Abstract
The set of single-gene deletions in yeast can be used to evaluate the effect of mutation on fitness over the whole genome. The measurement of growth in pure culture or relative growth in mixtures has confirmed that most deletions have little effect in laboratory culture. Moreover, there is a sharp distinction between lethality and a very mild impairment of growth, with very few intermediate cases. Different components of fitness, such as growth rate and yield, are positively correlated. Growth is also positively correlated across environments, although new conditions of growth usually identify a few conditionally impaired strains. Double mutants on average show alleviating epistasis, although a few per cent of combinations are synthetic lethal. The properties of the yeast deletion set provide us with the first genome-wide account of fitness, although transferring these conclusions to the field is a task for the future.
Keywords: gene deletion, fitness components, epistasis, environmental heterogeneity, plasticity
1. The unexpected mildness of mutation
The classical view of mutations, that held sway throughout the twentieth century, is that almost all mutations are deleterious, in proportion to the magnitude of genetic disruption. The geometrical analogy developed by Fisher (1930) was particularly influential. It depicts the optimal state of the population as a point in space representing a combination of character values. The current state of the population is a second point, more or less distant from the optimum. Any random change in a character, brought about by mutation, will move the population either closer to the optimum or farther away. Large random changes are almost certain to relocate the population farther away, and will be prevented from spreading by strong purifying selection. Only small changes have any appreciable chance of being beneficial, and adaptation will therefore involve the successive fixation of a long series of mutations of small effect.
In the last few years it has become possible to estimate the effects of mutation on fitness in a systematic fashion, throughout the entire genome. The results have been unexpected. Early studies using gene disruption by transposition revealed mostly mild effects, with fitness being reduced by only a few per cent. When it became possible to delete large numbers of genes by homologous recombination in yeast, it was immediately apparent that most strains bearing a single specified deletion were capable of normal growth (Thatcher et al. 1998). The extension of this programme to the whole genome of yeast showed that the deletion of a gene has one of two effects: either it is lethal (in the haploid or homozygous state), or there is little, if any, visible impairment of growth. Lethality is the expected outcome, from the Fisherian point of view, but only a minority of genes (about 20%) are essential in this sense. The mild phenotype associated with deleting any of the majority of genes is unexpected, and shows that the long-standing view of loss-of-function mutations is incomplete. In particular, it is not obvious how genetic integrity is preserved, and normal function maintained, if purifying selection is ineffective.
In this review, I shall use whole-genome surveys of growth in yeast to investigate the effect of mutation and the operation of selection. I shall present original estimates of competitive ability and yield in pure culture (see §2; see also Bell 2008), and collate the results of other large-scale trials. The ability to screen the whole genome makes it possible for the first time to provide reliable estimates of some of the most fundamental quantities in evolutionary biology, such as the effect of a mutation, the relationships among components of fitness, the extent of dominance and epistasis, and the correlation of fitness across environments.
2. Material and methods
(a). Strains
The haploid MATa yeast single deletion set was obtained from Open Biosystems (www.openbiosystems.com). The ancestor is BY4741 (MATa his3Δ1 leu2Δ0 met15Δ0 ura3Δ0).
(b). Media
YPD is yeast peptone dextrose medium: 20 g peptone, 10 g yeast extract, 20 g dextrose to 1 l with distilled water. Minimal medium: 1.4 g yeast nitrogen base (without amino acids), 20 g glucose to 1 l with distilled water. Low-N minimal medium has 1.4 g yeast nitrogen base. Maple and birch sap was obtained by coring trees at Mont St-Hilaire, Quebec, in March 2005, sterile-filtering the homogenized samples and storing frozen. Bark and leaf infusions were made by steeping a given quantity of plant material in an equal volume of water at room temperature for 24 h and sterile-filtering the supernatant. All cultures were incubated at 28°C except in the high temperature experiment where they were incubated at 37°C.
(c). Pure-culture assays
For pure-culture assays, all strains were replated to 96-well plates each holding 48 deletion strains and 12 copies of the ancestor in interior wells, with all marginal rows blank except for plate identification inoculations. For each cycle of growth, wells were inoculated with 10 µl of stock culture and cultured for 48 h at 28°C, before a second set was inoculated from the first and again grown for 48 h at 28°C before being stirred and optical density recorded (FluoStar Optima, BMG Lab Technologies). Transfers were done in sterile conditions using a Biomek FX automated liquid handling system inside a Baker BioProtect II laminar flow hood. Plates were routed with a robotic handler (Beckman Coulter).
3. How does selection preserve genetic integrity?
The problem to be solved is: how can the mild phenotype of most deletion strains be reconciled with the maintenance of fully functional gene sequences? There are three leading explanations.
—Chronic weak purifying selection. Loss-of-function mutations are not neutral, but rather mildly deleterious, and are therefore prevented from spreading by purifying selection. They will continue to be maintained at low frequency by mutation pressure, but any given individual will bear intact sequences throughout almost its whole genome. If this explanation be correct, then careful studies will show that the growth and fitness of viable deletion strains always falls short of their intact ancestor.
—Frequent strong synthetic selection. The genome is moderately redundant, in the sense that the failure of one activity can be compensated by the extension of another. Hence, the loss of a single gene can be tolerated because another gene can take its place. If this second gene should also be lost, however, fitness will be severely reduced. Hence, genetic integrity is preserved because a lineage bearing a loss-of-function mutation at one locus will sooner or later be doomed by a loss-of-function mutation at a second locus. This explanation requires that neutral single-locus deletions should often combine to give a synthetic lethal effect in the double deletant.
—Intermittent strong directional selection. This mildness of most deletions is attributable to highly permissive conditions of growth. In more stressful conditions, more loci would be lethal when deleted. Moreover, a different set of loci is essential for each distinctive set of conditions. Genetic integrity is preserved in a changing environment because any lineage bearing a loss-of-function mutation at any locus will be eliminated when the conditions for which that locus is essential appear. This explanation requires that single-locus deletions that are neutral in some environments should be severely deleterious in others.
I shall now summarize the evidence for each of these three processes. They are not mutually exclusive, and each may be responsible, to some degree, for the maintenance of genetic integrity and normal function. I shall then use genomic data to evaluate the contribution of each to selection in natural populations.
4. Chronic weak purifying selection
(a). Yield in pure culture
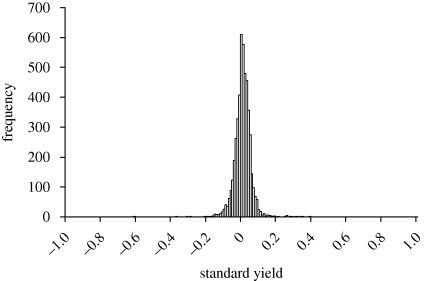
The most straightforward way of estimating the average effect of gene deletion is to compare the growth of each strain in pure culture with the ancestral value. I grew all 4846 viable haploid strains of the yeast single deletion set in such a way that each strain could be compared with two replicate cultures of the ancestral undeleted strain growing on the same row on the same plate (see §2). The measure of growth was optical density of the stirred culture after 48 h of growth at 28°C in rich medium (YPD). Standard yield was then calculated as Ystandard = (strain − ancestor)/(ancestor − blank), using the average of uninoculated wells on each plate as a blank. A score of 0 indicates that the deletion has no effect, whereas a score of −1 indicates that it is lethal. The expected outcome on the Fisherian view is an exponential decline in frequency from a mode of severely impaired strains with large negative Ystandard. Instead, Ystandard was narrowly and almost symmetrically distributed around a mode near zero (figure 1). A few strains (about 20) were nearly lethal and grew only very slowly; only a very few strains (about 10) had intermediate values. Excluding these cases, the phenotypic standard deviation of the means was σP = 0.052 and the genetic standard deviation σG = 0.039. This shows that almost all genes in the yeast genome genes fall into two sharply delineated categories, defined by the effect of deletion: Fisherian genes, whose deletion is lethal, and non-Fisherian genes, whose deletion is more or less inconsequential. Moreover, the overall effect of deletion was beneficial: Ystandard exceeded zero for about two-thirds of all loci (3489/4846), with a mean value of +0.0147 (s.d. = 0.084, s.e. = 0.0012; mean excluding the few nearly lethal strains is +0.0195, s.d. = 0.052, s.e. = 0.0007).
Figure 1.
Distribution of standard yield among deletion strains in complete (YPD) medium. The estimate for each strain is the average of five independent replicate experiments.
To construct the deletion set, the resident gene is displaced by a construct including a kanMX deletion cassette conferring resistance to geneticin. The effect on mean yield might therefore be attributable either to the removal of a given gene, or to the insertion of the construct. I identified 30 open reading frames (ORFs) in the Saccharomyces genome database (www.yeastgenome.org), which are annotated as ‘Dubious ORF unlikely to encode a protein, based on available experimental and comparative sequence data’, and which do not overlap any other ORF. Deleting these ORFs should have no effect on fitness. The mean standard yield of strains bearing deletions of dubious ORFs in YPD was +0.0350 (s.e. = 0.0074), compared with +0.0147 (s.e. = 0.0012) for all ORFs. I also identified nine genes associated with the sexual cycle, which are unlikely to be expressed in vegetative growth and whose deletion should likewise be neutral. The mean standard yield of these strains in YPD was +0.0329 (s.e. = 0.0085). Hence, the elevation of growth caused by deleting a non-coding or non-expressed ORF is similar to, or greater than, the effect of deleting a coding gene. The general elevation of fitness in YPD associated with gene deletion is therefore likely to be attributable to the insertion of the cassette. If the effects of gene deletion and cassette insertion are additive, then the average effect of gene deletion on growth in YPD is (0.0147 − 0.0350) = −0.0203. Hence, gene deletion causes a marginal loss of yield of about 2 per cent on average.
(b). Growth rate in pure culture
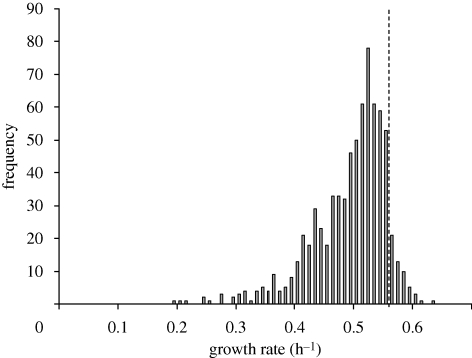
Fudata & Korona (2009) estimated the growth rate of about 740 deletion strains chosen to be broadly representative of the genome. They found a sharply peaked distribution with a mode slightly inferior to the wild-type (figure 2). Unlike yield, there is a conspicuous left-hand tail of subvital lines. The scarcity of lines with intermediate growth rates is still striking, however, with genetic standard deviation σG = 0.060. The average effect of a deletion on growth rate (without allowing for a marker effect) is (0.502 − 0.567)/0.567 = −0.114, a much greater value than for yield.
Figure 2.
Distribution of maximum growth rate among deletion strains in complete (YPD) medium. Each estimate is the mean of two estimates for each mating type; the broken line is the growth rate of the intact ancestral strain. Data from Jasnos & Korona (2009).
(c). Competitive fitness
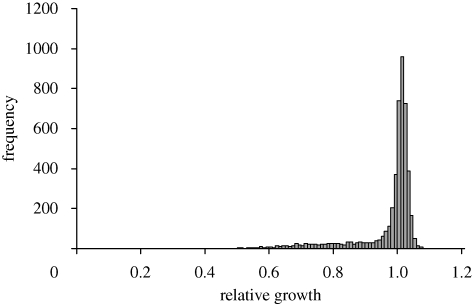
Each deletion strain is tagged with a unique short sequence that can be recognized and quantified by hybridization on a microarray. This allows the frequency of each deletion strain to be monitored in a pool where each strain is initially present, leading to an estimate of the selection coefficient for each strain. This expresses its fitness relative to the mean fitness of the pool; the ancestor is not included, so the absolute effect of a deletion cannot be estimated. Extensive trials of this sort have been reported by Giaever et al. (2002), Steinmetz et al. (2002) and Deutschbauer et al. (2005), which will be referred to as ‘Giaever’, ‘Steinmetz’ and ‘Deutschbauer’, respectively. They show a sharply peaked distribution with a flat left-hand tail extending back to about 0.5 (figure 3). Genetic standard deviations are similar to or somewhat greater than for yield and growth rate: σG = 0.055 (Deutschbauer), 0.086 (Steinmetz) and 0.141 (Giaever). If the best strain has fitness 1 + x, and any value less than 1 − x is regarded as impaired, then 880/4471 = 19.7 per cent of viable strains show impaired fitness in the Deutschbauer data.
Figure 3.
Distribution of selection coefficients among deletion strains in complete (YPD) medium. Each estimate is 1 + b, where b is the regression of log hybridization intensity on time (in generations) for three time points during the first 20 generations of growth. Data from Steinmetz et al. (2002); available at http://www-deletion.stanford.edu/YDPM/YDPM_index.html.
An alternative approach is to measure the relative growth of a deletion strain in competition with the undeleted ancestor. Sliwa & Korona (2005) concluded that very few, if any, deletants are superior to wild-type in complete medium. In their experiment, all strains in the single deletion set were mixed together and 50 cells transferred to each of 384 microwells; in each case it is likely that the inoculum represented 50 different strains. These cultures were then propagated by serial transfer for 180 generations. They were then mixed in equal quantities with wild-type and propagated for a further 360 generations. In 251 cultures no change in the frequency of wild-type was observed, whereas in 133 cultures the deletants increased. Only 74 different strains were represented among the successful deletants, and some appeared to have hitch-hiked with beneficial mutations arising during the course of the competition; consequently, only 12 consistently superior deletants could be identified.
Breslow et al. (2008) monitored the outcome of competition between intact and deleted strains by fluorescent-activated cell sorter, using contrasted fluorescent protein markers. They reported that about 45 per cent of deletions were associated with impaired fitness in minimal medium. A few deletion strains were consistently superior, many of which involved genes in the nutrient-sensing protein kinase pathway. Reducing the level of expression of essential genes by disrupting the 3′ untranslated region with a marker cassette also caused reduced fitness for about 40 per cent of loci.
(d). Correlation among fitness components in rich medium
Yield, growth rate and competitive ability may all contribute to fitness, in proportions that will depend on conditions of culture. They are all positively correlated, to a degree limited by repeatability. Yield and growth rate have r = +0.44. Both are correlated with competitive ability. For the deletion-pool studies by Giaever et al. (2002); Steinmetz et al. (2002) and Deutschbauer et al. (2005), the correlations of standard yield with selection coefficient are +0.13, +0.37 and +0.37, respectively; for growth rate, the corresponding values are +0.13, +0.66 and +0.56.
Hence, these large-scale studies lead to the simple conclusion that the effect of a loss-of-function mutation at a locus is similar for all the main components of fitness, at least for cultures grown in rich medium in the laboratory.
(e). Relative fitness in stressful media
The mildness of mutation in rich medium may be misleading if deletion causes a much greater loss of fitness in more stressful conditions, such as are presumably typical of natural environments. I tested the haploid deletion set in eight more stressful media: minimal, low-N minimal, YP ethanol, high temperature, tree sap and infusions of leaves and bark (see §2). Average yield relative to the intact ancestor was greater in some conditions and less in others. The deletion strains were most severely impaired, however, in the most stressful environments, leaf and bark infusions, which had Ystandard = −0.55 and −0.20, respectively. Jasnos et al. (2008) found that the effect of deletion on growth rate was actually alleviated in more stressful environments (minimal, high temperature, caffeine and salt). Growth rate and yield were affected in the same direction by culture in minimal medium and at high temperature. Hence, there is no simple or consistent tendency for stress to exacerbate the effect of gene deletion on fitness.
5. Frequent strong synthetic selection
All the experiments reviewed above tested the deletion set in haploid or homozygous state. In practice, interactions between allelic and non-allelic genes are likely to be pervasive, and both dominance and epistasis will contribute to the effectiveness of selection.
(a). Dominance
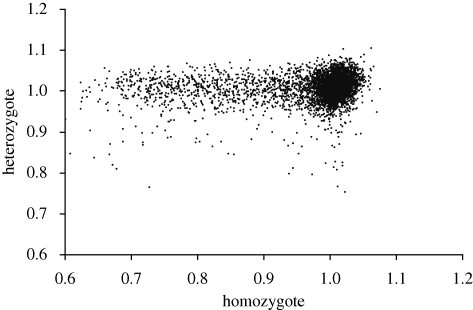
Purifying selection will be most effective for mutations that are dominant for fitness. Steinmetz et al. (2002) provide competition pool data for both homozygous and heterozygous deletion strains. Some heterozygous strains are impaired, but most have nearly average fitness, even for deletions that substantially reduce competitive growth as homozygotes. Hence, most deletions are almost completely recessive (figure 4). Phadnis & Fry (2005) claim that there is a strong and consistent relation between dominance and competitive growth, but this is attributable to autocorrelation between their measures of dominance and selection coefficients. Being recessive, most deletions will be sheltered from selection in wild diploids with infrequent sexual episodes.
Figure 4.
Relative growth of heterozygote and homozygote deletion strains in a competition pool assay. Data from Steinmetz et al. (2002), replicate Tc1 grown in YPD.
(b). Epistasis
Mutations will be removed more effectively if they are more deleterious in combination than when they are single. In the extreme case, loss-of-function mutations at two different loci might be neutral when either is borne, yet lethal when both are borne together. Synthetic lethal interactions will prevent loss-of-function mutations from accumulating. The balance between single-locus and synthetic effects depends on the genomic mutation rate. In small genomes, with low overall mutation rates, most genetic deaths are caused by the single-locus effect. In larger genomes, synthetic effects contribute an increasing fraction of genetic deaths, and become the predominant source of purifying selection when the genomic mutation rate exceeds about one per replication.
Tong et al. (2004) reported a systematic survey of 132 focal single-deletion strains, each of which was crossed with about 5000 other strains in order to isolate the double deletion strains. This generated about 105 double deletion strains, of which about 4000 had synthetic lethal or synthetic sick phenotypes. Hence, synthetic lethality will give rise to selection of a few percent against deletions that are individually neutral.
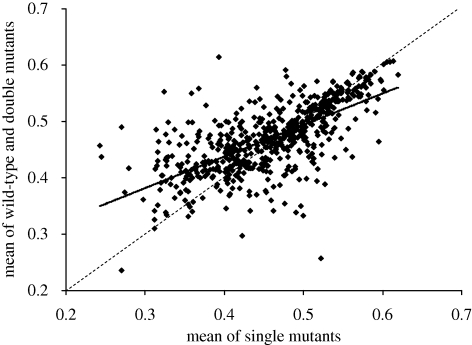
More generally, genetic interactions may be alleviating (positive epistasis) or aggravating (negative epistasis). With alleviating epistasis, the fitness of a double mutant is less than the product of the fitnesses of the single mutants. With aggravating epistasis, the double mutant is less fit than expected from the fitnesses of the single mutants; synthetic lethality is the extreme case of aggravating epistasis. Jasnos & Korona (2007) dissected tetrads from 639 crosses between single-deletion strains with low maximum growth rate to isolate the nil-mutation (00), single-mutation (01,10) and double-mutation (11) segregants. Epistasis for exponential growth rate m, estimated as ε = (m00 + m11) − (m01 + m10), was distributed roughly around zero, but with an excess of positive values at low overall growth rates and a slight excess of negative values at high growth rates (figure 5). The excess of alleviating epistasis is maintained in stressful conditions (Jasnos et al. 2008). It should be noted, however, that systematic synthetic screens (such as that reported by Tong et al. 2004) suggest an excess of aggravating epistasis, primarily among strains with high growth rates. I conclude that genetic interactions are pervasive, but are probably not predominantly aggravating and so do not on balance facilitate the elimination of deleterious mutations.
Figure 5.
Epistasis in crosses between deletion strains with low growth rates. Each point is the mean of two to four replicate estimates per cross: data from Jasnos & Korona (2007). The regression slope is +0.5595 + s.d. 0.0239. The dashed line is the line of equality. The unweighed mean growth of the single deletant segregants is 0.458 (s.d. = 0.073), and the mean of the nil-deletion and double-deletion segregants is 0.470 (s.d. = 0.060).
6. Intermittent strong directional selection
(a). Genetic correlation across environments
The deletion strains do not respond uniformly when growth conditions change. I estimated yield in eight culture media. Four were simple laboratory media: YPD, glucose minimal medium, ethanol-supplemented medium and YPD at 37°C. The other four were natural fluids or extracts: the sap of maple and birch, and infusions of oak bark and leaves. Estimates of variance components showed that genotype–environment interaction  was comparable in magnitude to the genetic variance
  itself:
  /(
/( ) = 0.39. The correlation over environments, however, was positive in most (92/112) pairwise comparisons of replicate trials in different media, with an average of r = +0.042 (s.e. = 0.005). As the correlation of replicate trials in the same medium was only r = +0.185, this suggests a true correlation over environments of about +0.2. Giaever et al. (2002) conducted trials in six growth conditions, with higher repeatability, leading to a comparable value of average correlation of r =+0.269 (s.e. = 0.045).
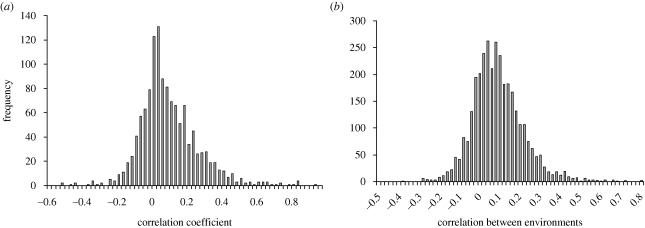
Other authors have tested a much wider range of simpler manipulations by adding cytotoxic agents to standard growth media. Brown et al. (2006) tested 4756 genes in 51 media and found average r = +0.0979. Parsons et al. (2006) tested 3418 genes in 82 media and obtained a very similar estimate of average r = +0.0997. The distribution of the cross-environment genetic correlation is strikingly similar in these studies: 75–80% of estimates positive, modal between 0 and +0.1, and with a long right-hand tail of positive values (figure 6).
Figure 6.
Distribution of genetic correlation over environments for the deletion strains. (a) Data for 1275 single-gene deletion strains grown in 51 growth conditions involving cytotoxic or cytostatic agents from Brown et al. (2006, electronic supplementary material). Mean = 0.0979; s.d. = 0.1697; s.e. = 0.0048; 950/1275 = 74.5% estimates were positive. (b) Data for 4111 single-gene deletion strains grown with 82 compounds and natural extracts from Parsons et al. (2006, electronic supplementary material, table S7). Mean = 0.0997; s.d. = 0.1266; s.e. = 0.0022; 2674/3321 = 80.5% of estimates were positive.
(b). Mean fitness and plasticity
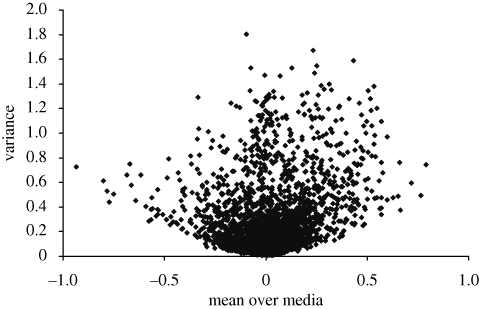
The variance of growth across environments reflects the ability of a strain to maintain a consistent level of fitness. Strains with lower variance are more plastic, in that they are able to express a similar phenotype in different conditions. The relationship between the mean and the variance of growth across environments will influence overall fitness. Since the most fit combination would be high average growth and a low variance of growth, it has been suggested that there should be a trade-off between mean fitness and plasticity, leading to a positive relationship between the mean and the variance of growth. The actual relationship is a striking ‘shellburst’ plot that roughly fills in a parabolic region of parameter combinations (figure 7). The growth of mediocre strains in different media is distributed more or less symmetrically around the population mean, but extreme strains grow exceptionally well (or poorly) in several media, reflecting the positive correlation across media. This produces a distribution which is still modal around the population mean, but has a long left or right tail, and consequently has greater variance. One consequence of this pattern is that there are no strains that have both high average fitness and high plasticity.
Figure 7.
‘Shellburst’ plot of variance on mean for the Parsons dataset (82 media). Each point is a deletion strain. The Brown dataset (51 media) and my pure-culture data (nine conditions) provide plots of the same general shape.
(c). Conditional lethals
Although the growth of most viable deletion strains is weakly positively correlated across environments, this does not exclude the possibility that any given strain may be lethal in a small fraction of environments. In any given environment, then, a few such conditional lethals would be detected, and if enough environments were screened, the great majority of deletions would be found to be conditionally lethal.
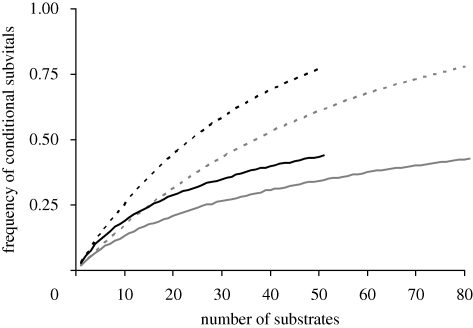
For the eight media I tested, I found that the average number of new conditional lethals identified was about 25 per new medium. In the more extensive surveys reported by Brown et al. (2006) and Parsons et al. (2006), the response variable is the change of frequency in pool competition trials, and there is no discrete class of lethals. I have arbitrarily defined subvitals as those strains falling 2 s.d. units or more below the mean fitness over all strains. If there is no genetic correlation between media, the overall frequency of conditional subvitals in a random set of E media is Σp(1 − p)i, where p is the frequency of subvitals in a single medium, and the summation is taken from i = 1 to i = E − 1. Plots of the cumulative frequency of conditional sublethals for an increasing number of media fall below expectation because of the positive genetic correlation between media, and approach a value of about 0.5 for 50–80 media (figure 8). Hence, about half of all deletion strains will be severely deleterious when exposed to one or more agents. The average number of new conditional sublethals uncovered by each new medium in these two surveys was 37 (Brown et al. 2006) and 22 (Parsons et al. 2006).
Figure 8.
The cumulative frequency of conditional sublethal loci when the deletion set is tested over a large number of substrates. ‘Subvital’ is defined as lying 2 s.d. units or more below average in pool competition experiments. The dashed grey line and dashed black line represent random data from Parsons and Brown, respectively. The solid grey line represents data from Parsons et al. (2006) and solid black line represents data from Brown et al. (2006).
The most extensive survey reported to date was by Hillenmeyer et al. (2008), who screened all viable deletion strains in media each containing one of 178 different small molecules. Among 3853 homozygous deletion strains with normal growth in complete medium (according to the Deutschbauer dataset), 3437 are substantially impaired in at least one of the experimental media. Most of the loci with no phenotype in any medium do not encode a protein, or are only weakly expressed, if at all. Hence, this study claims to demonstrate that every gene is necessary for normal growth in some conditions. It should be noted, however, that many of the molecules used are biologically active and may inhibit particular proteins, so the phenotypes that are expressed may be closer to synthetic genetic interactions than to conventional genotype–environment interaction. The number of conditional lethals exposed on average by each new molecule was 3437/178 ≈ 19.
In short, these surveys consistently report that altering a single factor in the physical conditions of growth uncovers about 20 additional loci, whose deletion is lethal or severely deleterious. This consistency is all the more remarkable, perhaps, in view of the lack of any objective definition of what constitutes an environmental factor.
7. Discussion: how does selection maintain genetic integrity in nature?
Studies of the yeast deletion set have established or confirmed a series of broad generalizations about the variation of fitness.
—Most mutations have only a slight effect on fitness, even when they completely disrupt a gene.
—The effect of mutation is not in general exacerbated by stressful conditions.
—Loss-of-function mutations are recessive.
—A few per cent of pairwise combinations of viable mutations are synthetically lethal.
—Among viable combinations, both aggravating and alleviating interactions are found, with an excess of alleviating interactions.
—The correlation of fitness across environments is positive.
—Plasticity is related to average fitness by a ‘shellburst’ plot in which strains with high average fitness and high plasticity are rare or absent.
—When exposed to any novel environmental factor, a small number of loci (perhaps about 20 on average) are conditionally lethal.
These are general features of variation over the whole genome, insofar as variation can be evaluated through the properties of deletion strains. They are not necessarily features of variation in evolved populations. To show how arbitrary and evolved populations may differ, consider the growth of the strains in two different media. This will usually give a scatter plot with a slight positive correlation. We might argue, however, that only strains that are able to grow fairly well in both media are of interest, so the analysis should be restricted to the few percent of strains with the highest mean fitness across media. The plot now has a strong negative correlation. In one sense, this is an artefact: plotting the best 1 per cent of two large series of independent normal random numbers will yield a regression slope of −1 (if the two series have equal variance) and r2 ≈ 0.5. In another sense, it is what is to be expected as the consequence of selection, through the elimination of strains inferior in both environments. The statistical features of the deletion strains provide a reliable basis for characterizing genetic variation, but will often be modified by selection either in natural or in experimental populations.
(a). Fitness of deletion strains in nature
The effect of gene deletion on fitness in natural conditions of growth has not yet been evaluated by field experiments. Broad surveys of genetic variation in wild yeast (Liti et al. 2009; Schacherer et al. 2009) have identified strains with large deletions which probably have a very similar effect on fitness as the precise and complete deletions of the laboratory strains. Their occurrence proves that some deletions, at least, have only mild effects on fitness in the wild. Schacherer et al. list 254 large deletions collected from 63 Saccharomyces cerevisiae strains. When cultured in YPD, the standard yield of the deletion strains corresponding to these isolates is significantly higher in my experiments than the average over all viable deletion strains (0.0298 versus 0.0147; t = 4.40, d.f. = 5009, p < 0.001). The pool competition experiments of Giaever and Deutschbauer give a similar result. The mean score of the isolates over all media in the experiment by Parsons et al. (2006) is higher than the overall mean of all viable deletion strains (0.0816 versus 0.0048; t = 6.57, d.f. = 4250, p < 0.001), and the variance is less (0.1437 versus 0.2018; t = −3.47, d.f. = 4250, p < 0.001). From the experiment by Brown et al. (2006), the isolates do not exceed the mean score of all strains (−0.039 versus −0.026; t = −2.28, d.f. = 4435, 0.05 > p > 0.02), although the variance is again less (0.041 versus 0.071; t = −4.44, d.f. = 4435, p < 0.001). Hence, the loci found to be partly or wholly deleted in wild isolates tend to have greater average fitness and a lower variance of fitness over media when deleted and tested in the laboratory.
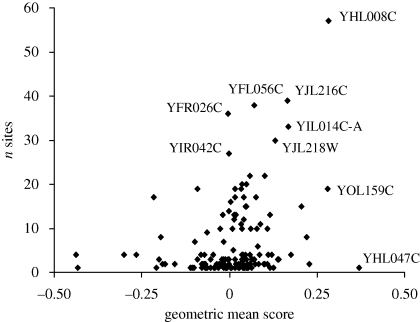
The frequency of isolates in which a given locus is deleted might provide a rough quantitative measure of its fitness in nature. This frequency is uncorrelated with growth in YPD in any of the data sets. It is weakly correlated (r = 0.205, d.f. = 138, p = 0.01) with the average score over all media in Parson's experiments, and very weakly correlated with the variance of growth over media (r = −0.025, n.s.). The appropriate fitness measure for a lineage experiencing a succession of different conditions is the geometric mean, which is approximately equal to the arithmetic mean minus half the environmental variance. This is positively correlated over loci with the frequency of sites in which the locus is deleted (r = +0.26, p < 0.01; figure 9). The relationship appears to be triangular rather than linear, in that genotypes with low geometric mean fitness are seldom found. Brown's data yields a similar triangular plot, but with no linear regression.
Figure 9.
Frequency of deletions among natural isolates in relation to geometric mean fitness in culture. Fitness data from competition-pool studies by Parsons et al. (2006). All the labelled points with high frequency of occurrence are genes of unknown function except YFL056C, which encodes AAD6, an aryl-alcohol dehydrogenase for which there are seven similar ORFs in the genome. YHL047C has the highest geometric mean in this set of loci, and was deleted at only a single site; it encodes the siderophore receptor ARN2.
Most deletions found in several or many isolates are spurious ORFs, genes of unknown function or members of gene families with several similar copies in the genome (figure 9). This is easily explained if the deletions found commonly in natural populations are simply those for which purifying selection is least effective. Nevertheless, deletions involving 120 annotated genes were identified in 1–15 isolates, comprising 18 per cent of all the deletions found. They had a mean score in Parsons' survey scarcely inferior to that of spurious or unannotated ORFs (0.067, s.d. = 0.139). Hence, genomes in natural populations can sustain loads of up to a dozen or so deletions of functional genes.
(b). Fitness in complex and variable environments
Yeast is normally cultured in rich, undefined media such as YPD, or in minimal medium with a single limiting carbon source such as glucose. Natural environments are unlikely to be similar to either of these conditions, because they will vary in time and space. It is conceivable that there is a single limiting factor at any given time whose nature frequently changes. This would eliminate loss-of-function mutations at about 20 loci at a time. This seems very unlikely, since natural isolates have not accumulated loss-of-function mutations for a large fraction of the genome.
It is more likely that natural environments contain a variety of substrates at low concentrations, none able alone to sustain growth; they will also contain a range of toxins, growth inhibitors and waste products emitted by other organisms, primarily microbes, also individually at low concentration. The particular range of substrates and toxins may change continuously over time, as the result of seasonal and year-to-year changes in physical processes and community composition. The meagre experimental evidence that is available suggests that selection in complex environments leads to the evolution of overlapping incomplete generalists, each of which can exploit or tolerate a substantial fraction of the prevailing conditions (Barrett et al. 2005). Loss-of-function mutations that narrow the niche of a lineage would be deleterious because each would reduce its rate of growth or limiting abundance by an amount that would be inversely proportional to niche width. This pattern might tend to evolve if the cross-environmental correlation of mutations is positive, such that some combinations of mutations are impaired in given conditions, whereas others are unaffected. It would also be facilitated by the shellburst relationship between plasticity and mean fitness, with mutations having little effect in most conditions but having much higher or much lower fitness in others.
In terms of the three options identified in §1, the most plausible explanation for the preservation of genetic integrity over evolutionary time seems to be chronic weak purifying selection elicited by the complexity of natural environments. Strong genetic interactions and frequent changes in conditions seem less likely to be important.
This scheme seems consistent with laboratory observations and with the occurrence of modest frequencies of deletions of annotated genes in natural populations. However, it is far from being securely established. First, there is no entity that unequivocally constitutes a unit environmental factor, in the same way that a gene constitutes a unit genetic factor. Small molecules are an interesting possibility, but their effect will be modulated by the physical context, such as pH and moisture, and they do not fully represent vicissitudes such as being eaten by a nematode. Secondly, we know very little about the natural conditions of growth of wild yeast. It can be reliably isolated from plant surfaces such as tree bark and leaves (Naumov et al. 1998; Glushakova et al. 2007; Replansky 2007), but its physical and chemical conditions of life, and its interactions with the community in which it is embedded, are very poorly understood. Finally, field experiments have not yet been attempted because suitable experimental material is not available. The deletion strains cannot be deployed in the field because they are constructed in a multiply auxotrophic background, and no comparable resource is yet available for wild yeast. The whole-genome surveys that yeast biotechnology has made possible have indeed provided us with unparalleled insight into the variation of fitness. The interpretation of these surveys in relation to the conditions in which yeast has evolved awaits the development of an ecological and evolutionary yeast model that will be as powerful as its laboratory precursor (Replansky et al. 2008).
Acknowledgements
This article was first presented as the Presidential Address to the annual meeting of the Canadian Society for Ecology and Evolution in Vancouver, May 2008. The robot experiments were run by Zhang Ming Wang. I am grateful to Austin Burt (Imperial College, London) and Corey Nislow (University of Toronto) for comments on the manuscript.
This research was funded by the Natural Sciences and Engineering Research Council of Canada and the Canadian Foundation for Innovation.
Footnotes
Invited review by the former president of the Canadian Society for Ecology and Evolution.
References
- Barrett R. D. H., MacLean R. C., Bell G.2005Experimental evolution of Pseudomonas fluorescens in simple and complex environments. Am. Nat. 166, 470–480 (doi:10.1086/444440) [DOI] [PubMed] [Google Scholar]
- Bell G.2008Selection. The mechanism of evolution, 2nd ed.Oxford, UK: Oxford University Press [Google Scholar]
- Breslow D. K., et al. 2008A comprehensive strategy enabling high-resolution functional analysis of the yeast genome. Nat. Methods 5, 711–718 (doi:10.1038/nmeth.1234) [DOI] [PMC free article] [PubMed] [Google Scholar]
- Brown J. A., Sherlock G., Myers C. L., Burrows N. M., Deng C., Wu H. I., McCann K. E., Troyanskaya O. G., Brown J. M.2006Global analysis of gene function in yeast by quantitative phenotypic profiling. Mol. Syst. Biol. 2: 2006.0001. Epub 2006 Jan 17. (doi:10.1038/msb4100043) [DOI] [PMC free article] [PubMed] [Google Scholar]
- Deutschbauer A. M., Jaramillo D. F., Proctor M., Kumm J., Hillenmeyer M. E., Davis R. W., Nislow C., Giaever G.2005Mechanisms of haploinsufficiency revealed by genome-wide profiling in yeast. Genetics 169, 1915–1925 (doi:10.1534/genetics.104.036871) [DOI] [PMC free article] [PubMed] [Google Scholar]
- Fisher R. A.1930The genetical theory of natural selection Oxford, UK: Oxford University Press [Google Scholar]
- Fudala A., Korona R.2009Low frequency of mutations with strongly deleterious but non-lethal fitness effects. Evolution 53, 2164–2171 [DOI] [PubMed] [Google Scholar]
- Giaever G., et al. 2002Functional profiling of the Saccharomyces cerevisiae genome. Nature 418, 387–391 (doi:10.1038/nature00935) [DOI] [PubMed] [Google Scholar]
- Glushakova A. M., Ivannikova Y. V., Naumova E. S., Chernov I. Y., Naumov G. I.2007Massive isolation and identification of Saccharomyces paradoxus yeasts from plant phyllosphere. Microbiology 76, 1608–1637 [PubMed] [Google Scholar]
- Hillenmeyer M. E., et al. 2008The chemical genomic portrait of yeast: uncovering a phenotype for all genes. Science 320, 362–365 (doi:10.1126/science.1150021) [DOI] [PMC free article] [PubMed] [Google Scholar]
- Jasnos L., Korona R.2007Epistatic buffering of fitness loss in yeast double deletion strains. Nat. Genet. 39, 550–554 (doi:10.1038/ng1986) [DOI] [PubMed] [Google Scholar]
- Jasnos L., Tomala K., Paczesniak D., Korona R.2008Interactions between stressful environment and gene deletions alleviate the expected average loss of fitness in yeast. Genetics 178, 2105–2111 (doi:10.1534/genetics.107.084533) [DOI] [PMC free article] [PubMed] [Google Scholar]
- Liti G., et al. 2009Population genomics of domestic and wild yeasts. Nature 458, 337–341 (doi:10.1038/nature07743) [DOI] [PMC free article] [PubMed] [Google Scholar]
- Naumov G. I., Naumova E. S., Sniegowski P.1998Saccharomyces paradoxus and Saccharomyces cerevisiae are associated with exudates of North American oaks. Can. J. Microbiol. 44, 1045–1050 (doi:10.1139/cjm-44-11-1045) [PubMed] [Google Scholar]
- Parsons A. B., et al. 2006Exploring the mode of action of bioactive compounds by chemical-genetic profiling in yeast. Cell 126, 611–625 (doi:10.1016/j.cell.2006.06.040) [DOI] [PubMed] [Google Scholar]
- Phadnis N., Fry J. D.2005Widespread correlations between dominance and homozygous effects of mutations: implications for theories of dominance. Genetics 171, 385–392 (doi:10.1534/genetics.104.039016) [DOI] [PMC free article] [PubMed] [Google Scholar]
- Replansky T.2007Saccharomyces sensu stricto as a model system in ecology and evolution. MSc thesis, McGill University, Montreal, Canada: [DOI] [PubMed] [Google Scholar]
- Replansky T., Koufopanou V., Greig D., Bell G.2008Saccharomyces cerevisiae as a model system in ecology and evolution. Trends Ecol. Evol. 23, 494–501 (doi:10.1016/j.tree.2008.05.005) [DOI] [PubMed] [Google Scholar]
- Schacherer J., Schapiro J. A., Ruderfer D. A., Kruglyak L.2009Comprehensive polymorphism survey elucidates population structure of Saccharomyces cerevisiae. Nature 458, 341–346 (doi:10.1038/nature07670) [DOI] [PMC free article] [PubMed] [Google Scholar]
- Sliwa P., Korona R.2005Loss of dispensable genes is not adaptive in yeast. Proc. Natl Acad. Sci. USA 102, 17 670–17 674 (doi:10.1073/pnas.0505517102) [DOI] [PMC free article] [PubMed] [Google Scholar]
- Steinmetz L. M., et al. 2002Systematic screen for human disease genes in yeast. Nat. Genet. 31, 400–404 [DOI] [PubMed] [Google Scholar]
- Thatcher J. W., Shaw J. M., Dickinson W. J.1998Marginal fitness contributions of non-essential genes in yeast. Proc. Natl Acad. Sci. USA 95, 253–257 (doi:10.1073/pnas.95.1.253) [DOI] [PMC free article] [PubMed] [Google Scholar]
- Tong A. H. Y., et al. 2004Global mapping of the yeast genetic interaction network. Science 303, 808–813 (doi:10.1126/science.1091317) [DOI] [PubMed] [Google Scholar]


