Abstract
Dendritic spines contain a family of abundant scaffolding proteins known as Shanks, but little is known about how their distributions might change during synaptic activity. Here, pre-embedding immunogold electron microscopy is used to localize Shanks in synapses from cultured hippocampal neurons. We find that Shanks are preferentially located at postsynaptic densities (PSDs) as well as in a filamentous network near the PSD, extending up to 120 nm from the postsynaptic membrane. Application of sub-type specific antibodies shows that Shank2 is typically concentrated at and near PSDs while Shank1 is, in addition, distributed throughout the spine head. Depolarization with high K+ for two minutes causes transient, reversible translocation of Shanks towards the PSD that is dependent on extracellular Ca2+. The amount of activity-induced redistribution and subsequent recovery is pronounced for Shank1 but less so for Shank2. Thus, Shank1 appears to be a dynamic element within the spine, whose translocation could be involved in activity-induced, transient structural changes, while Shank2 appears to be a more stable element positioned at the interface of the PSD with the spine cytoplasm.
Keywords: postsynaptic density, electron microscopy, Shank1, Shank2
Shanks, a family of scaffolding proteins, are known under different names including ProSAP, Synamon, CortBP, Spank and SSTRIP (Du et al., 1998; Naisbitt et al., 1999; Boeckers et al., 1999b; Yao et al., 1999; Zitzer et al., 1999). Three genes encode Shank1, Shank2 and Shank3, all with similar sets of domains proteins are present in brain. Shank proteins co-purify with postsynaptic density (PSD) fractions (Naisbitt et al., 1999; Boeckers et al., 1999b) as well as with affinity-purified synaptic PSD-95 complexes (Dosemeci et al., 2007). Immuno electron microscopy confirms their localization at the PSD in intact brain (Naisbitt et al., 1999; Tu et al., 1999; Boeckers et al., 1999b; Valtschanoff and Weinberg, 2001; Rostaing et al., 2006) and in isolated PSDs (Petersen et al., 2003).
Shanks contain several protein-protein interaction domains. The alignment from the N- to the C-terminal includes ankyrin repeats, Src homology (SH3), PDZ domains, a variable proline-rich region, and a sterile alpha motif (SAM) domain (review: Sheng and Kim, 2000). Shanks associate with multiple proteins within the dendritic spine through their protein-protein interaction domains, including interactions with GKAPs (Boeckers et al., 1999a; Naisbitt et al., 1999; Yao et al., 1999) and Homer (Tu et al., 1999), thus potentially linking ionotropic- and metabotropic glutamate receptors. Shanks also bind to cortactin/ Abp1 (Du et al., 1998; Naisbitt et al., 1999; Qualmann et al., 2004), potentially linking the PSD complex to actin in the spine cytoskeleton. Moreover, Shanks can multimerize by association through their SAM domains (Naisbitt et al., 1999; Baron et al., 2006). These interactions place Shanks in a pivotal position in the structural organization of the dendritic spine.
Synaptic activity and excitatory stimuli elicit structural changes in spine morphology (review: Holtmaat and Svoboda, 2009). Due to their multiple associations and critical positioning, Shanks are prime candidates to participate in the orchestration of the structural re-organization of the spine. To date, little is known about the effects of activity on the localization of Shanks, except that glutamate uncaging leads to a transient decrease in Shank2 in the spine (Steiner et al., 2008). However, electron microscopic studies on the effects of activity on the distribution of Shanks within the spine had been lacking.
In the present study, pre-embedding immunogold electron microscopy is used to determine the distribution of Shanks in dissociated hippocampal neuronal cultures, where synaptic activity can be manipulated easily. Differences in positioning between Shank1 and Shank2 are examined using double label confocal microscopy as well as immunogold electron microscopy. A picture emerges of Shanks as dynamic proteins operating right at the interface between the PSD and the spine cytoplasm, with different Shank family members playing different roles there.
EXPERIMENTAL PROCEDURES
Antibodies and Western immunoblotting
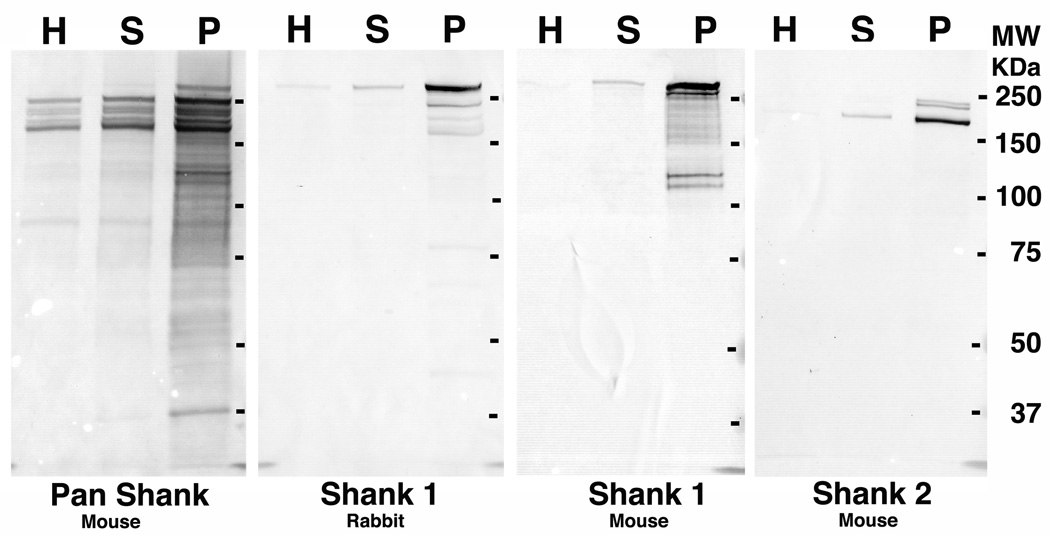
Mouse monoclonal antibodies against Shank1 (clone N22/ 21, used at 1:50–100 for microscopy and 1:500 for Western), against Shank2 (clone N23B/ 6, used at 1:200 for microscopy and 1:1000 for Western), and pan Shank (clone N23B/ 49, used at 1:200 for microscopy and 1:1000 for Western) were from NeuroMab, Davis, CA. Rabbit polyclonal antibody against Shank1, used at 1:100 for microscopy and 1:1000 for Western, was from Novus, Littleton, CO. For Western immunoblotting proteins were separated on 7.5% SDS-PAGE and transferred to nitrocellulose. Alkaline phosphatase conjugated anti mouse (Sigma, St. Louis, MO) and anti rabbit (Pierce, Rockford, IL) secondary antibodies were used. Synaptosome and PSD fractions from adult brains (custom collected and frozen in liquid nitrogen within 2 minutes of sacrifice by Pel-Freez Biologicals, Rogers, AR) were prepared as described previously (Dosemeci et al., 2000). Western immunoblotting confirmed that Shank1 and Shank2 antibodies recognize distinct bands, while the pan Shank antibody recognizes multiple bands including those labeled by the isoform-specific antibodies (Fig. 1). Comparison of subcellular fractions indicated enrichment of all Shank proteins in the PSD compared to parent homogenate and synaptosome fractions (Fig. 1).
Figure 1.
Western immunoblots with Shank antibodies of homogenate (H), synaptosome (S) and PSD (P) fractions from cerebral cortex show significant enrichment of all Shank sub-types in the PSD fraction. The same amount of protein (10 µg) was loaded into each lane. Shank sub-families show further molecular diversity due to alternative splicing (reviewed in Boeckers et al., 2002). Reported isoforms of Shank1 in the UniProtKB database are in the 160–226 KDa range and for Shank 2 in the 134–200 KDa range.
Dissociated hippocampal neuronal cultures and treatment
The animal protocol was approved by the NIH Animal Use and Care Committee and conforms to NIH guidelines. Hippocampal cells from 21-day embryonic Sprague-Dawley rats were dissociated and grown on a feeder layer of glial cells (Lu et al., 1998) for 19 – 21 days. During experiments, culture dishes were placed on a floating platform in a water bath maintained at 37°C. Incubation media (normal, high K+ and Ca2+-free in HEPES-buffered Krebs Ringer) were as described by (Dosemeci et al., 2001). Cultures were washed once with normal incubation medium, and then treated with either the same medium (control) or the high K+ medium (90 mM K+) for 2 min before fixation. For recovery experiments some samples were treated for 2 min in high K+, washed with normal medium (5 times within 2 min), then left in the same medium for 30–60 min. To test the effects of extracellular calcium, treatment with high K+ was carried out in the presence or absence of Ca2+ (high K+ media with 2.5 mM Ca2+ or 1 mM EGTA, respectively).
Perfusion fixation of mouse brain
Two C57BL/ 6 male mice (two to three months old, body weight 20–30 g) were fixed by rapid transcardiac perfusion (Tao-Cheng et al., 2007). Briefly, mice were anaesthetized with isoflurane, and then the heart was exposed and perfused with 100 ml of fixative, 2% formaldehyde and 0.1% gluteraldehyde in PBS (calcium and magnesium free, phosphate buffered saline at 150 mM, pH 7.4), for ~10 minutes. The time between cutting the diaphragm and the start of perfusion was kept below 100 seconds, and the time between cutting the atrium and the start of perfusion was kept below 30 seconds. Perfusion pressure was maintained at 150 mm Hg with a PerfusionOne system (MyNeurolab, Maryland Heights, MO)
Pre-embedding immunolabeling for electron microscopy
Dissociated cultures were fixed with 4% paraformaldehyde (EMS Fort Washington, PA) in PBS for 30–45 min and permeablized with 0.05–0.1% saponin for 40–60 min, or with 50% ETOH for 10–15 min. Perfusion-fixed mouse brains were dissected after 1–2 hrs of fixation, and vibratomed into 100 µm thick slices, washed and stored in PBS. Before use, brain slices were permeablized with 0.1% saponin for 1 hr.
Samples were incubated with primary antibody in 5% normal goat serum in PBS for 1–2 hr, washed and then incubated with secondary antibody (Nanogold, Nanoprobes, Yaphand, NY) in 1–5% normal goat serum in PBS for 1–2 hr, fixed with 2% glutaraldehyde in PBS for 30–60 min, silver enhanced (HQ kit, Nanoprobes), en block mordanted with 0.25–0.5% uranyl acetate in acetate buffer for 30–60 min, treated with 0.2% osmium tetroxide in 0.1M phosphate buffer for 30 min, dehydrated in graded ethanols, and embedded in epoxy resin (Tanner et al., 1996). The primary antibody was omitted in some experiments to control for nonspecific labeling by the secondary antibody. The overall amount of labeling varied between experiments, so comparisons were limited to changes within a parallel run. Illustrations within a figure (Figs. 4, 6) are from parallel samples in the same experiment.
Figure 4.
Immunolabeling with pan Shank antibody in cultured hippocampal neurons showing representative distribution of label at rest (A), after two minutes of high K+ (B), and after 30 min of recovery from high K+ (C). The density of label in the PSD and contiguous network (Zone I) appears to increase with stimulation, and return to resting level with 30 min rest. Scale bar = 100 nm.
Figure 6.
Representative electron micrographs showing distributions of label for pan Shank in Zone I following two minutes high K+ either in the presence (A) or in the absence of external Ca2+ (B). The stimulation-induced clustering of label for Shank in Zone I, and the PSD curvature change appear to depend on external Ca2+. Scale bar = 100 nm.
Morphometry
Excitatory synapses were identified by the presence of presynaptic clusters of synaptic vesicles; a synaptic cleft; and a postsynaptic density (PSD) composed of a band of dense material underneath the membrane limiting the synaptic cleft. Every labeled PSD encountered in dissociated cultures and in the zonula radiatum of the CA1 region of the brains (cf Tao-Cheng et al., 2007) was photographed at 40,000X, with a CCD digital camera system (XR-100 from AMT, Danvers, MA) and printed at a final magnification of 150,000 for measurement and counting.
The border of the PSD proper is conventionally defined by the dense material which, under basal conditions, typically extends from the postsynaptic membrane ~30 nm into the cytoplasm. A sub-synaptic web (Valtschanoff and Weinberg, 2001), composed of a meshwork of filamentous materials lying below the PSD proper, manifests a texture different form that of the rest of the spine cytoplasm. Shank labeling typically occupied the entire depth of this meshwork, which we refer to for descriptive purposes as the PSD contiguous network. The PSD contiguous network becomes particularly apparent after depolarization (Figure 2A). The cytoplasmic border of the contiguous network is typically irregular in outline, and may extend up to ~120 nm inwards from the postsynaptic membrane. Because Shank labeling within the PSD proper appeared to be continuous with the surrounding contiguous network, these two zones are lumped together for the purpose of counting gold label. The cut-off from the rest of the spine cytoplasm is set at 120 nm in order not to undercount Shank labels within the PSD contiguous network.
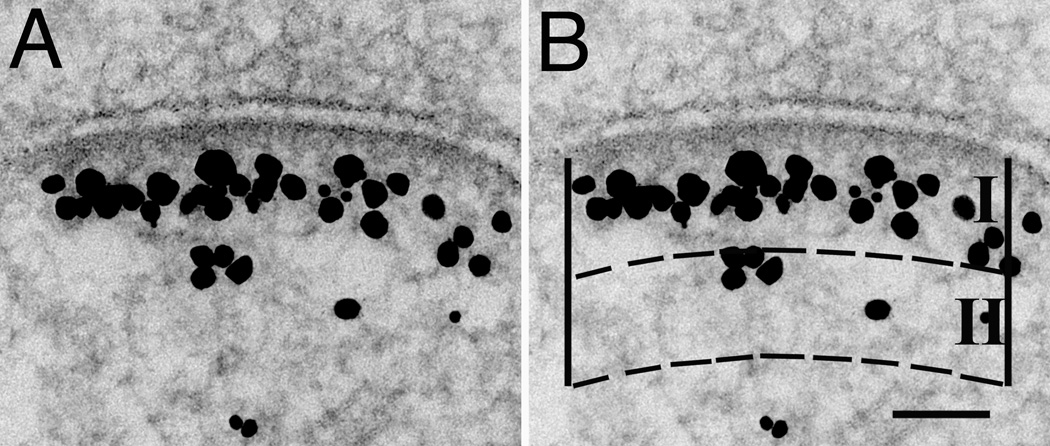
Figure 2.
Synapse labeled with pan Shank antibody (A) shown with superimposed mask (B) to illustrate the method for measuring the amount of label for Shanks in the vicinity of the PSD. Two zones, I and II, which are equal in area are delimited between arcs parallel to the PSD, and two vertical edges originating from the ends of the PSD. Zone I is designed to include the contiguous network immediately below the PSD. Each particle is assigned to the zone containing the majority of its areal projection. Scale bar = 100 nm.
The postsynaptic membrane was marked to measure the length of the PSD, and a line parallel to the PSD, but 120 nm deeper into the cytop lasm was then drawn (uppermost dashed line, Fig. 2B). This area below the PSD was then boxed in with two perpendicular lines defining a Zone I. All labels within this box were counted and divided by the length of the PSD to yield the labeling density for Zone I as # grains/µm PSD length. A second box with a depth and area equal to that of Zone I constituted a Zone II. Zone II represents only part of the entire cytolasmic compartment. The depth of Zone II, like that of Zone I was set at 120 nm, because many small spines would have been eliminated from measurement if this zone were deeper, and having Zone II equal in area to Zone I simplified calculations of the ratio of labeling between Zone II and Zone I. Statistical analysis (KaleidaGraph, Synergy Software) was carried out by Student’s t test (unmatched sets, unequal variances) with confidence levels set at P <0.01 unless otherwise indicated. When comparing mean values from different experiments, experimental results were normalized to the control, and expressed as percent change (Figure 7C).
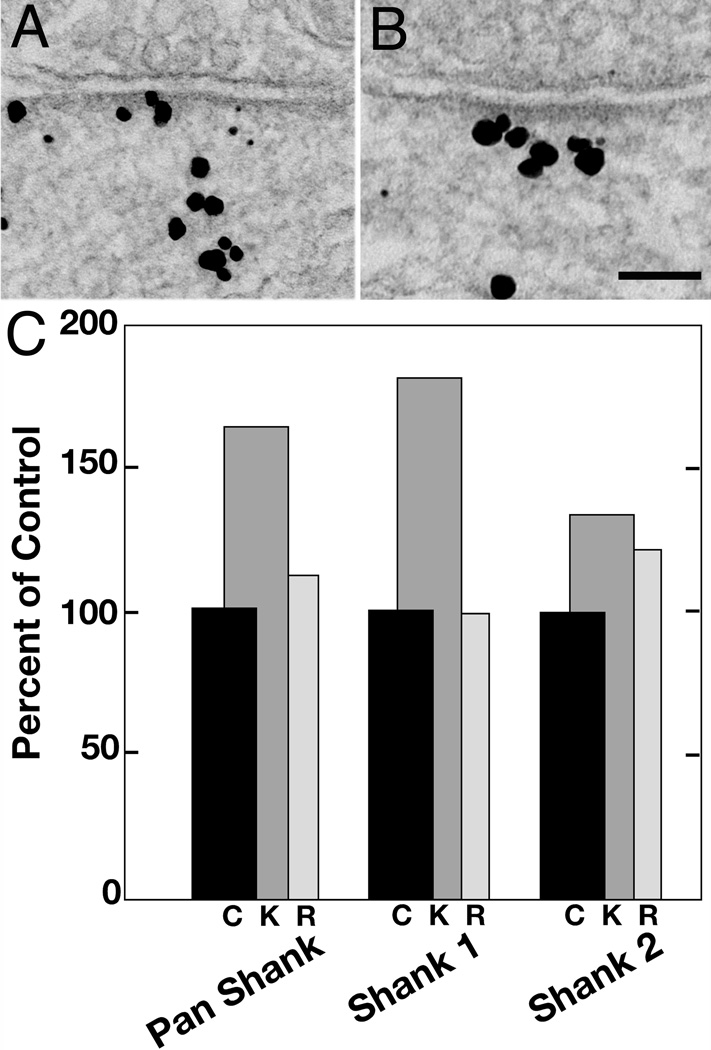
Figure 7.
Comparison of labeling in Zone I for Shank1 (A) and Shank2 (B), showing that label for Shank2 is localized closer to the PSD. Scale bar = 100 nm. C. Pooled results from all experiments expressed as percent of labeling in control (black bars labeled c (control), set at 100 percent). Normalization was necessary in pooling experiments because the overall level of labeling varied between experiments. After high K+, the percentage of Shank1 appearing in Zone I exceeded that of Shank2 (dark gray bars labeled K). In contrast, the label for Shank1 decreases more than that for Shank2 during the recovery period (light gray bars, labeled R).
The curvature of a PSD is calculated from the height of the apex of an arc above a line connecting the two ends of the PSD (reviewed in Calverley and Jones, 1990). Curvature is expressed as the height of the arc divided by the length of this line, converted to a percentage (Tao-Cheng et al., 2007), so a curvature of zero percent denotes a flat PSD that does not arc up or down. Presynaptic terminals in illustrations are oriented on top of the PSD, so PSDs that arc up into the presynaptic terminal are given positive percentages, and those with negative percentages arc down into the postsynaptic spine.
Confocal Microscopy
Cultures of hippocampal neurons were transfected at eight days in vitro (DIV) with a plasmid encoding cerulean fluorescent protein (mCer, plasmid 15214 Addgene,(Rizzo et al., 2004)), using Effectene transfection reagent (Qiagen) following the manufacturers suggested protocol }. Cultures at 22 DIV were fixed with 4% paraformaldehyde in PBS, extracted with 0.2% TritonX-100 in PBS and immunolabeled with anti-Shank1 polyclonal rabbit antibody (1:100) and anti-Shank2 monoclonal mouse (1:200). Secondary antibodies were Alexa 488 anti-rabbit and Alexa 555 anti-mouse (Invitrogen). Confocal microscopy was performed with a 63× 1.4 NA Planapo objective on a LSM510 (Carl Zeiss, Thornwood, NY) and 405, 488 and 561 nm excitation. Transfected neurons were sparse (fewer than one percent of the neurons), allowing their finest branches and spines to be visualized. Image stacks were collected at 0.1 µm horizontal pixel size and 0.5 µm vertical spacing. Projections of 3–6 planes were combined to produce images in which whole spines were visualized separate from surrounding structures.
RESULTS
Postsynaptic labeling for Shank proteins is variable
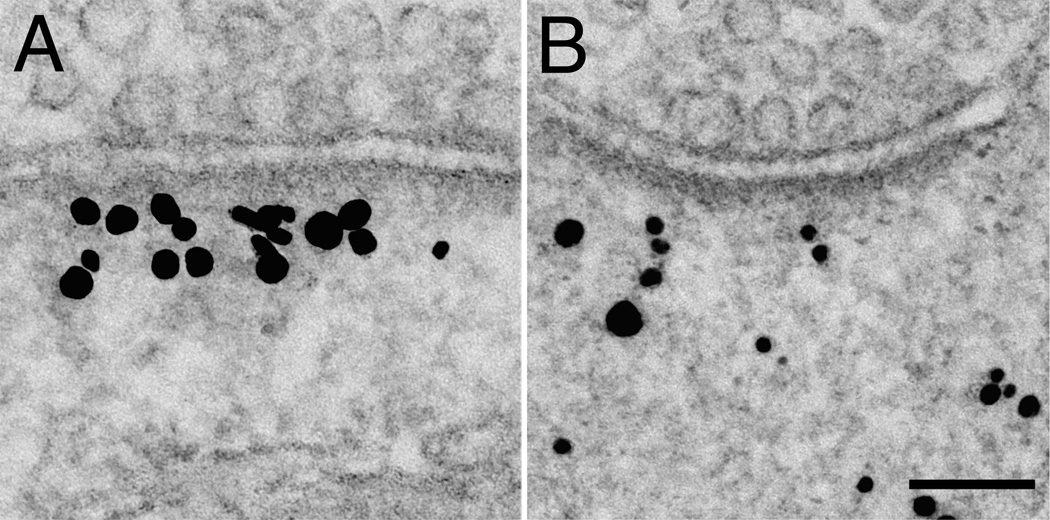
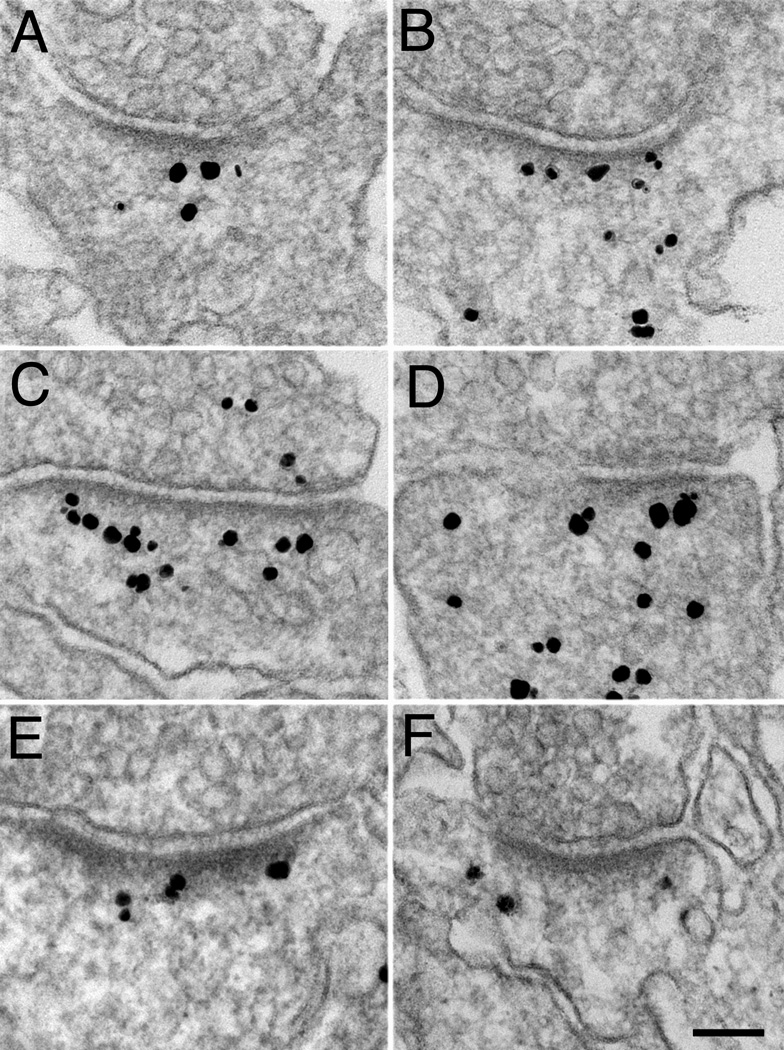
Under basal conditions, labeling with the pan Shank antibody in cultured hippocampal neurons varied from synapse to synapse both in intensity as well as in distribution (Fig. 3). In general, the PSD and the contiguous filamentous network immediately beneath it (Zone I, defined in Fig. 2B) were preferentially labeled regardless of whether the level of labeling was low (Fig. 3A) or high (Fig. 3C). However, variable amounts of label were also dispersed in the cytoplasm furth er away from the PSD (Fig. 3B&D). Labeling patterns in the synapses from zonula radiatum of the CA1 region of perfusion fixed mouse brains were similar (Fig. 3E&F). Thus, under basal conditions, variable amounts of Shanks are localized at the PSD and its contiguous network (Zone I), as well as in the rest of the spine cytoplasm.
Figure 3.
Immunolabeling with pan Shank antibody in cultured hippocampal neurons (A–D), and in perfusion-fixed hippocampus (E–F). Label in cultures shows a range of distributions from sparse in Zone I (A) to plentiful throughout the spine (D). Label in spines in brain (E), like that in the cultures (B), also is concentrated, but lighter, in a zone corresponding to Zone I in cultured neurons. Scale bar = 100 nm. Label in presynaptic terminals (C), if present, was always at a much lower density than that associated with PSDs, and these are attributable to non-specific background.
Depolarization induces a transient redistribution of Shank
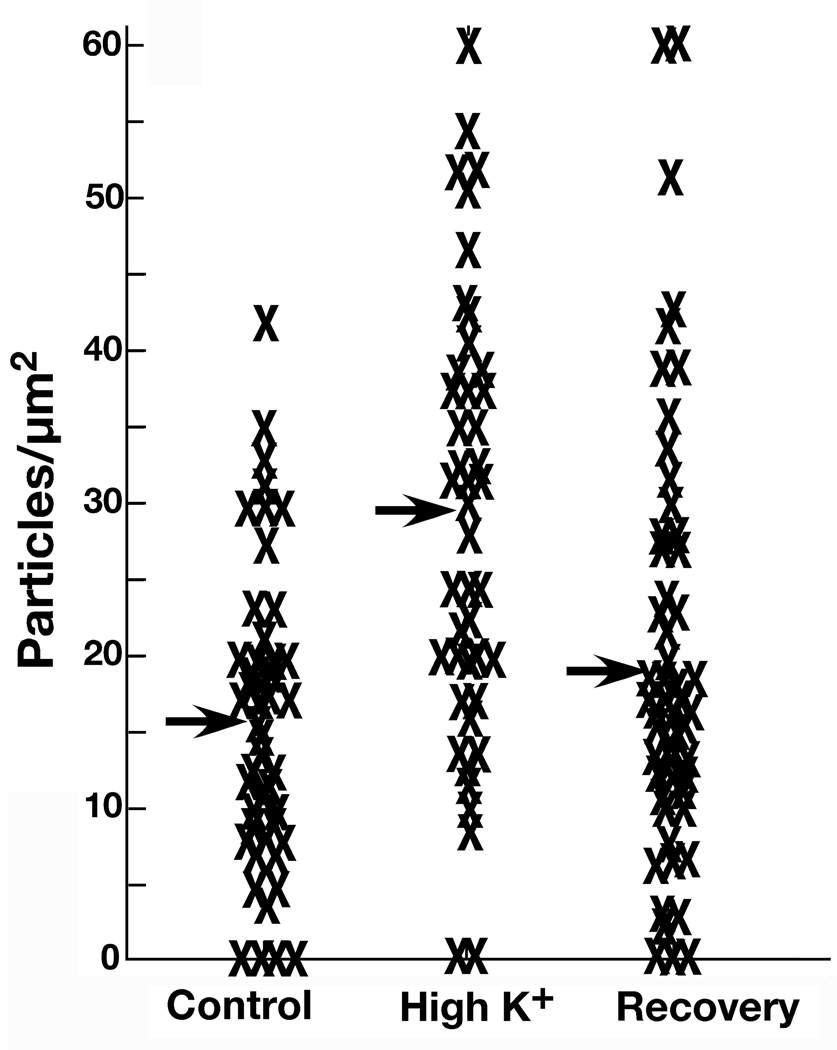
Pan Shank labeling in the PSD and contiguous network (Zone I) increased significantly after 2 min of depolarization in high K+, and this increase was for the most part reversed within 30 min of cessation of depolarization (Fig. 4). Complete data from one matched set of experiment are shown in the scattergram in Fig. 5. The same trends were apparent in nine experiments (Supplemental Table 1). The mean level of label in Zone I, combined from all experiments, increased from 19.9 ± 1.6 grains/ µm PSD length in the control group to 32.4 ± 3.0 in high K+(p<0.001), and decreased to 24.8 ± 5.8 after 30 min of recovery (Supplemental Table 1).
Figure 5.
A. Measurement of distribution of label with pan Shank antibody in Zone I at rest, after two minutes of high K+, and after 30 min of recovery from high K+. Crosses (X) depict individual measurements from all synapses from one parallel set of experiments. Means for each experimental condition are indicated by arrows.
After 2 min depolarization, pan Shank antibody labeling further away from the PSD (Zone II) showed a concomitant decrease. The ratio of Zone II to Zone I labeling was 0.39 ± 0.07 under basal conditions but decreased to 0.13 ± 0.02 (p<0.05) after depolarization (four experiments, Supplemental Table 2). This marked decrease in the relative amount of label in Zone II upon depolarization suggests that increase of label in Zone I is contributed to by Shank molecules translocating into Zone I from Zone II.
Depolarization induces a reversible change in curvature of the PSD
Under basal conditions, the majority of PSDs were either flat or curved slightly downwards (Fig. 3, 4A), indenting the spine head. After depolarization, the great majority of PSDs curved in the opposite direction (Fig. 4B), indenting the axon terminal rather than the spine, and their curvature reverted to the resting state 30 min after cessation of depolarization (Fig. 4C). The combined mean of the PSD curvature indices (% arc height of arc length) increased from −2.9 ± 1.3 in the control group to 10.2 ±1.9 in high K+(p<0.005), and decreased to −2.3 ±1.0 after 30 min of recovery (Supplemental Table 3).
Changes in Shank labeling and PSD curvature are Ca2+-dependent
Depolarization with high K+ in Ca2+-free medium containing 1 mM EGTA failed to produce either an increase in pan Shank labeling in Zone I, or a change in PSD curvature (Fig. 6). Label densities in Zone I following 2 min high K+ were 25.7 ± 1.9 in the presence of Ca2+ but 17.6 ± 0.6 (p<0.05) in the absence of external Ca2+. PSD curvature indexes were 9.6 ± 2.2% with Ca2+ and −0.7 ± 1.8% (p<0.05) without Ca2+ (4 experiments, Supplemental Table 4). Thus, depolarization-induced changes in label for Shank and PSD curvature appear to require extracellular calcium.
Distributions of Shank1 and Shank2 during and after activity
Isoform-specific antibodies recognizing Shank1 or Shank2 were used to further differentiate the distributions of different Shank family members. Under basal conditions, Shank1 was dispersed widely in the cytoplasm of the spine (Fig. 7A) while Shank2 was located more consistently in Zone I near the PSD (Fig. 7B). The ratio of label in zone II to that in zone I was significantly higher for Shank1 (0.5 ± 0.09), than for Shank2 (0.13 ± 0.02; p<0.05; Supplemental Table 2).
After depolarization with high K+, both Shank1 and Shank2 became more concentrated in Zone I (Figure 7C). The increase in Shank1 was greater than that of Shank2 (Fig. 7C); the high K+ treatment over control values was 182 ± 24% for Shank1 and 134 ± 11% for Shank2. At 30 min after the cessation of high K+ treatment, the increase in Shank1 labeling reversed while that for Shank2 labeling in zone I remained higher than control values (99 ± 2% for Shank1, and 121 ± 6% for Shank2, Figure 7C).
Distributions of Shank1 and Shank2 in the same spines
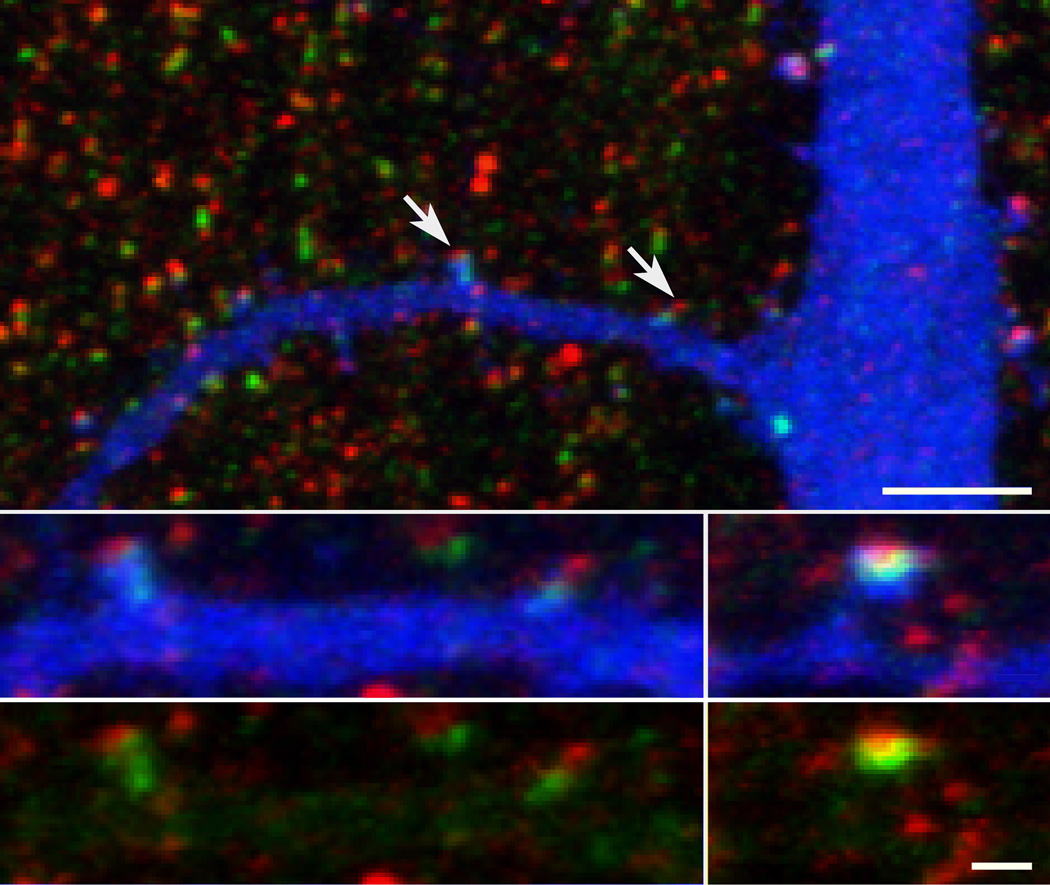
Combining immunofluorescence labeling for Shank1 and for Shank2 with a volume marker for neurons (mCer fluorescent protein) allowed the distributions of Shank1 and Shank2 to be compared in the same spines by confocal microscopy (Fig. 8). The filling of dendrites with mCer allowed individual spines to be visualized (arrows in top panel of Fig. 8), and the distributions of label for Shank1 (green) and Shank2 (red) at a particular spine to be compared directly. The relative amounts of labeling for Shank1 and Shank2 varied considerably, consistent with the results from immunogold electron microscopy. Almost all spines contain Shank2 (red), which is concentrated near the tip of the spine head. Most spines also contain Shank1 (green) concentrated somewhat proximal to Shank 2 and extending deeper into the body of the spine (bottom panels of Fig. 8).
Figure 8.
Comparison of the overall distributions of Shank1 (green) and Shank2 (red) by confocal microscopy. Shank2 is concentrated near the tips of spines while Shank1 extends further away from the tip than Shank2 (arrows in top panel, shown at higher magnification in the two left insets). Dendrites are filled by expressed cerulean fluorescent protein (blue). Low magnification view is projection of entire stack of 16 confocal images, while insets are projections of 4–6 image planes. Blue channels in duplicates of insets (bottom panels) are suppressed to expose extent of label for Shank1 (green) in the spine. Top scale bar = 5 µm, lower scale bar = 1 µm.
DISCUSSION
As expected (Naisbitt et al., 1999; Tu et al., 1999; Boeckers et al., 1999b; Valtschanoff and Weinberg, 2001; Rostaing et al., 2006), pre-embedding immunogold electron microscopy with a pan Shank antibody localizes Shanks at PSDs. However, in distinction to previous studies, labeling for Shanks is also concentrated in a zone extending ~120 nm into the cytosol from the postsynaptic membrane, and at many synapses, spread throughout the spine as well. The more extended distribution of label reported here could result from differences in antibodies, or from the immunolabeling methods–the pre-embedding immunogold method used here may be more sensitive than post-embedding techniques and more precise than pre-embedding with HRP/ DAB (Masugi-Tokita and Shigemoto, 2007). Different binding partners may be responsible for the stabilization of Shanks at specific locations within the spine, including GKAPs (Naisbitt et al., 1999) at and near the PSD (Valtschanoff and Weinberg, 2001) and cortactin/ abp1 (Du et al., 1998; Naisbitt et al., 1999; Qualmann et al., 2004) throughout the actin cytoskeleton (Racz and Weinberg, 2004).
The area intensely labeled for Shank immediately below the PSD shows a filamentous network, possibly directly attached to the PSD, that distinguishes it from cytoplasm in the rest of the spine. A comparable zone next to the PSD has been termed a sub-synaptic web (Valtschanoff and Weinberg, 2001). Shank labeling in the network contiguous to the PSD suggests that Shanks are a key scaffolding constituent of this strategically placed network, which bridges between the matrix of the PSD into the surrounding spine cytoplasm. Another possible constituent of this network may be Homer, which forms a polymeric, mesh-like structure with Shank (Hayashi et al., 2009) and is located in a similar zone (Petralia et al., 2005).
The variability in the distribution of Shanks in different cytoplasmic zones of individual synapses suggests that Shank localization might be regulated by activity, which led us to investigate the effects of short-term activity on the amount of Shank in the vicinity of the PSD. Indeed, application of high K+ to the hippocampal cultures elicited a marked, but transient, increase in the amount of label for Shank at the PSD and contiguous network (Zone I). A concomitant decrease in the adjacent Zone II deeper in the spine cytoplasm, implies that the activity dependent increase in Shank in Zone I is the result of translocation from the surrounding spine cytoplasm.
The application of high K+, in addition to the PSD thickening described previously (Dosemeci et al., 2001), also led to an increase in PSD curvature, a structural change indicative of recent synaptic activity (Tao-Cheng et al., 2007). Since Shank is a major element of the PSD, its translocation, along with CaMKII, is likely to contribute to PSD thickening. On the other hand, it is unclear for now whether the redistribution of Shank also contributes to the change in curvature, although its localization at the interface of the actin cytoskeleton and the PSD could support such a role. Similar changes in curvature are also observed upon application of glutamate/ glycine as well as of NMDA (J.-H. Tao-Cheng, unpublished observations), implying that depolarization-induced presynaptic vesicle release with its resulting increase in presynaptic plasma membrane is not a requirement.
Both the depolarization-induced change in the distribution of Shank and the concomitant change in curvature of the synaptic junction require the presence of Ca2+. We have previously demonstrated depolarization and Ca2+ dependent translocation of CaMKII to the PSD (Dosemeci et al., 2001). Ca2+ regulates the activity of CaMKII, and CaMKII phosphorylates Shank and its binding partners, the GKAPs (Dosemeci and Jaffe, 2009). Thus, some of the events regulating Shank may be downstream from CaMKII activation.
Immunocytochemistry with antibodies that distinguish subtypes of Shanks indicates that there are differences between Shank1 and Shank2 with respect to their location and dynamics within the spine. Shank1 and Shank2 show overlapping but distinct distributions by both electron and confocal microscopy, with Shank2 more concentrated at the PSD and contiguous network (Zone I), and Shank1 spread throughout the body of the spine.
The third sub-type of Shank, Shank3, must also be present at the PSD and contiguous network, as indicated by biochemical and immunoEM observations (Dosemeci et al., 2007; Rostaing et al., 2006). While immunoEM with pan Shank antibody is expected to localize all three Shank sub-types, it is not possible to deduce from the present data whether Shank3 localizes more like Shank1 or Shank2. On the other hand, Shank2 and Shank3 both depend on the integrity of their C-terminal regions for synaptic targeting (Boeckers et al., 2005), whereas Shank1 requires the GKAP binding domain (Sala et al., 2001), indicating similarity between Shank2 and 3.
It is striking that depolarization elicits a significant increase in levels of Shank1 in Zone I, but only a modest increase in Shank2. Moreover, while the increase in Shank1 is reversed in 30 min, the increase in Shank2 for the most part is maintained. These observations lead us to propose that Shank1 is a variable element, involved in transient structural changes, while Shank2 is a more stable, core element of the postsynaptic complex. However, the modest but maintained increase in Shank2 upon depolarization opens the possibility that this Shank sub-type may be involved in sustained structural changes at the synapse.
Other findings support the idea that different Shank subtypes perform different functions. During development, Shank2 becomes concentrated at the postsynaptic membranes at the newly formed synaptic contacts, even before PSD-95 and NR1 (Boeckers et al., 1999b), suggesting a role as a primary organizer for PSD structure. On the other hand, over-expression of Shank1 causes spine maturation and enlargement (Sala et al., 2001) and Shank1 knockout mice have smaller spines than wild type (Hung et al., 2008), suggesting a role for Shank1 in affecting the size of dendritic spines. Our finding that Shank1 is more dynamically affected by depolarization than Shank 2 may be related to the fact that Shank1 is the only subfamily of Shanks that needs its GKAP binding domain for synaptic targeting (Sala et al., 2001; Boeckers et al., 2005), a process that may be subject to activity-induced regulation.
Supplementary Material
Acknowledgements
We thank Christine A. Winters for hippocampal neuronal cultures, Virginia Crocker and Rita Azzam for expert EM technical support, John Chludzinski for measurements and image processing. Supported by the Intramural Research Program of the NIH, NINDS.
ABBREVIATIONS
- PSD
postsynaptic density
- CaMKII
Calcium calmodulin-dependent protein kinase II
- EM
electron microscopy
Footnotes
Publisher's Disclaimer: This is a PDF file of an unedited manuscript that has been accepted for publication. As a service to our customers we are providing this early version of the manuscript. The manuscript will undergo copyediting, typesetting, and review of the resulting proof before it is published in its final citable form. Please note that during the production process errors may be discovered which could affect the content, and all legal disclaimers that apply to the journal pertain.
REFERENCES
- Baron MK, Boeckers TM, Vaida B, Faham S, Gingery M, Sawaya MR, Salyer D, Gundelfinger ED, Bowie JU. An architectural framework that may lie at the core of the postsynaptic density. Science. 2006;311:531–535. doi: 10.1126/science.1118995. [DOI] [PubMed] [Google Scholar]
- Boeckers TM, Winter C, Smalla KH, Kreutz MR, Bockmann J, Seidenbecher C, Garner CC, Gundelfinger ED. Proline-rich synapse-associated proteins ProSAP1 and ProSAP2 interact with synaptic proteins of the SAPAP/ GKAP family. Biochem Biophys Res Commun. 1999a;264:247–252. doi: 10.1006/bbrc.1999.1489. [DOI] [PubMed] [Google Scholar]
- Boeckers TM, Kreutz MR, Winter C, Zuschratter W, Smalla KH, Sanmarti-Vila L, Wex H, Langnaese K, Bockmann J, Garner CC, Gundelfinger ED. Proline-rich synapse-associated protein-1/ cortactin binding protein 1 (ProSAP1/ CortBP1) is a PDZ-domain protein highly enriched in the postsynaptic density. J Neurosci. 1999b;19:6506–6518. doi: 10.1523/JNEUROSCI.19-15-06506.1999. [DOI] [PMC free article] [PubMed] [Google Scholar]
- Boeckers TM, Bockmann J, Kreutz MR, Gundelfinger ED. ProSAP/ Shank proteins - a family of higher order organizing molecules of the postsynaptic density with an emerging role in human neurological disease. J Neurochem. 2002;81:903–910. doi: 10.1046/j.1471-4159.2002.00931.x. [DOI] [PubMed] [Google Scholar]
- Boeckers TM, Liedtke T, Spilker C, Dresbach T, Bockmann J, Kreutz MR, Gundelfinger ED. C-terminal synaptic targeting elements for postsynaptic density proteins ProSAP1/ Shank2 and ProSAP2/ Shank3. J Neurochem. 2005;92:519–524. doi: 10.1111/j.1471-4159.2004.02910.x. [DOI] [PubMed] [Google Scholar]
- Calverley RK, Jones DG. Contributions of dendritic spines and perforated synapses to synaptic plasticity. Brain Res Brain Res Rev. 1990;15:215–249. doi: 10.1016/0165-0173(90)90002-6. [DOI] [PubMed] [Google Scholar]
- Dosemeci A, Reese TS, Petersen J, Tao-Cheng J-H. A novel particulate form of Ca(2+)/ calmodulin-dependent [correction of Ca(2+)/ CaMKII-dependent] protein kinase II in neurons. J Neurosci. 2000;20:3076–3084. doi: 10.1523/JNEUROSCI.20-09-03076.2000. [DOI] [PMC free article] [PubMed] [Google Scholar]
- Dosemeci A, Tao-Cheng JH, Vinade L, Winters CA, Pozzo-Miller L, Reese TS. Glutamate-induced transient modification of the postsynaptic density. Proc Natl Acad Sci U S A. 2001;98:10428–10432. doi: 10.1073/pnas.181336998. [DOI] [PMC free article] [PubMed] [Google Scholar]
- Dosemeci A, Makusky AJ, Jankowska-Stephens E, Yang X, Slotta DJ, Markey SP. Composition of the synaptic PSD-95 complex. Mol Cell Proteomics. 2007;6:1749–1760. doi: 10.1074/mcp.M700040-MCP200. [DOI] [PMC free article] [PubMed] [Google Scholar]
- Dosemeci A, Jaffe H. Regulation of phosphorylation at the postsynaptic density during different activity states of Ca(2+)/ calmodulin-dependent protein kinase II. Biochem Biophys Res Commun. 2009 doi: 10.1016/j.bbrc.2009.10.167. [DOI] [PMC free article] [PubMed] [Google Scholar]
- Du Y, Weed SA, Xiong WC, Marshall TD, Parsons JT. Identification of a novel cortactin SH3 domain-binding protein and its localization to growth cones of cultured neurons. Mol Cell Biol. 1998;18:5838–5851. doi: 10.1128/mcb.18.10.5838. [DOI] [PMC free article] [PubMed] [Google Scholar]
- Hayashi MK, Tang C, Verpelli C, Narayanan R, Stearns MH, Xu RM, Li H, Sala C, Hayashi Y. The postsynaptic density proteins Homer and Shank form a polymeric network structure. Cell. 2009;137:159–171. doi: 10.1016/j.cell.2009.01.050. [DOI] [PMC free article] [PubMed] [Google Scholar]
- Holtmaat A, Svoboda K. Experience-dependent structural synaptic plasticity in the mammalian brain. Nat Rev Neurosci. 2009;10:647–658. doi: 10.1038/nrn2699. [DOI] [PubMed] [Google Scholar]
- Hung AY, Futai K, Sala C, Valtschanoff JG, Ryu J, Woodworth MA, Kidd FL, Sung CC, Miyakawa T, Bear MF, Weinberg RJ, Sheng M. Smaller dendritic spines, weaker synaptic transmission, but enhanced spatial learning in mice lacking Shank1. J Neurosci. 2008;28:1697–1708. doi: 10.1523/JNEUROSCI.3032-07.2008. [DOI] [PMC free article] [PubMed] [Google Scholar]
- Lu Z, McLaren RS, Winters CA, Ralston E. Ribosome association contributes to restricting mRNAs to the cell body of hippocampal neurons. Mol Cell Neurosci. 1998;12:363–375. doi: 10.1006/mcne.1998.0723. [DOI] [PubMed] [Google Scholar]
- Masugi-Tokita M, Shigemoto R. High-resolution quantitative visualization of glutamate and GABA receptors at central synapses. Curr Opin Neurobiol. 2007;17:387–393. doi: 10.1016/j.conb.2007.04.012. [DOI] [PubMed] [Google Scholar]
- Naisbitt S, Kim E, Tu JC, Xiao B, Sala C, Valtschanoff J, Weinberg RJ, Worley PF, Sheng M. Shank, a novel family of postsynaptic density proteins that binds to the NMDA receptor/ PSD-95/ GKAP complex and cortactin. Neuron. 1999;23:569–582. doi: 10.1016/s0896-6273(00)80809-0. [DOI] [PubMed] [Google Scholar]
- Petersen JD, Chen X, Vinade L, Dosemeci A, Lisman JE, Reese TS. Distribution of postsynaptic density (PSD)-95 and Ca2+/ calmodulin-dependent protein kinase II at the PSD. Journal of Neuroscience. 2003;23:11270–11278. doi: 10.1523/JNEUROSCI.23-35-11270.2003. [DOI] [PMC free article] [PubMed] [Google Scholar]
- Petralia RS, Sans N, Wang YX, Wenthold RJ. Ontogeny of postsynaptic density proteins at glutamatergic synapses. Mol Cell Neurosci. 2005;29:436–452. doi: 10.1016/j.mcn.2005.03.013. [DOI] [PMC free article] [PubMed] [Google Scholar]
- Qualmann B, Boeckers TM, Jeromin M, Gundelfinger ED, Kessels MM. Linkage of the actin cytoskeleton to the postsynaptic density via direct interactions of Abp1 with the ProSAP/ Shank family. J Neurosci. 2004;24:2481–2495. doi: 10.1523/JNEUROSCI.5479-03.2004. [DOI] [PMC free article] [PubMed] [Google Scholar]
- Racz B, Weinberg RJ. The subcellular organization of cortactin in hippocampus. J Neurosci. 2004;24:10310–10317. doi: 10.1523/JNEUROSCI.2080-04.2004. [DOI] [PMC free article] [PubMed] [Google Scholar]
- Rizzo MA, Springer GH, Granada B, Piston DW. An improved cyan fluorescent protein variant useful for FRET. Nat Biotechnol. 2004;22:445–449. doi: 10.1038/nbt945. [DOI] [PubMed] [Google Scholar]
- Rostaing P, Real E, Siksou L, Lechaire JP, Boudier T, Boeckers TM, Gertler F, Gundelfinger ED, Triller A, Marty S. Analysis of synaptic ultrastructure without fixative using high-pressure freezing and tomography. Eur J Neurosci. 2006;24:3463–3474. doi: 10.1111/j.1460-9568.2006.05234.x. [DOI] [PubMed] [Google Scholar]
- Sala C, Piech V, Wilson NR, Passafaro M, Liu G, Sheng M. Regulation of dendritic spine morphology and synaptic function by Shank and Homer. Neuron. 2001;31:115–130. doi: 10.1016/s0896-6273(01)00339-7. [DOI] [PubMed] [Google Scholar]
- Sheng M, Kim E. The Shank family of scaffold proteins. J Cell Sci. 2000;113(Pt 11):1851–1856. doi: 10.1242/jcs.113.11.1851. [DOI] [PubMed] [Google Scholar]
- Steiner P, Higley MJ, Xu W, Czervionke BL, Malenka RC, Sabatini BL. Destabilization of the postsynaptic density by PSD-95 serine 73 phosphorylation inhibits spine growth and synaptic plasticity. Neuron. 2008;60:788–802. doi: 10.1016/j.neuron.2008.10.014. [DOI] [PMC free article] [PubMed] [Google Scholar]
- Tanner VA, Ploug T, Tao-Cheng JH. Subcellular localization of SV2 and other secretory vesicle components in PC12 cells by an efficient method of preembedding EM immunocytochemistry for cell cultures. J Histochem Cytochem. 1996;44:1481–1488. doi: 10.1177/44.12.8985140. [DOI] [PubMed] [Google Scholar]
- Tao-Cheng JH, Gallant PE, Brightman MW, Dosemeci A, Reese TS. Structural changes at synapses after delayed perfusion fixation in different regions of the mouse brain. J Comp Neurol. 2007;501:731–740. doi: 10.1002/cne.21276. [DOI] [PubMed] [Google Scholar]
- Tu JC, Xiao B, Naisbitt S, Yuan JP, Petralia RS, Brakeman P, Doan A, Aakalu VK, Lanahan AA, Sheng M, Worley PF. Coupling of mGluR/ Homer and PSD-95 complexes by the Shank family of postsynaptic density proteins. Neuron. 1999;23:583–592. doi: 10.1016/s0896-6273(00)80810-7. [DOI] [PubMed] [Google Scholar]
- Valtschanoff JG, Weinberg RJ. Laminar organization of the NMDA receptor complex within the postsynaptic density. J Neurosci. 2001;21:1211–1217. doi: 10.1523/JNEUROSCI.21-04-01211.2001. [DOI] [PMC free article] [PubMed] [Google Scholar]
- Yao I, Hata Y, Hirao K, Deguchi M, Ide N, Takeuchi M, Takai Y. Synamon, a novel neuronal protein interacting with synapse-associated protein 90/ postsynaptic density-95-associated protein. J Biol Chem. 1999;274:27463–27466. doi: 10.1074/jbc.274.39.27463. [DOI] [PubMed] [Google Scholar]
- Zitzer H, Honck HH, Bachner D, Richter D, Kreienkamp HJ. Somatostatin receptor interacting protein defines a novel family of multidomain proteins present in human and rodent brain. J Biol Chem. 1999;274:32997–33001. doi: 10.1074/jbc.274.46.32997. [DOI] [PubMed] [Google Scholar]
Associated Data
This section collects any data citations, data availability statements, or supplementary materials included in this article.


