Abstract
Recent work on a new, higher sensitivity preamplifier design for Fourier transform ion cyclotron resonance mass spectrometry (FTICRMS) revealed a number of artifact peaks (spectral features) which do not contain useful chemical information. In order to determine the cause of these artifacts and eliminate them, these severely distorted spectra were compared with similarly distorted signal models. The source of several common signal processing artifacts was thereby determined and correlated to radio-frequency interference (RFI) noise and saturation of the amplifier and/or the digitizer. Under such conditions, the fast Fourier transform (FFT) generates spectral artifact peaks corresponding to harmonics and mixing frequencies of the real signal peaks and RFI frequencies. While this study was done using FTICRMS data, it is important to stress that these artifacts are inherent to the digitization and FFT process and thus are relevant to any FT-based MS instrument, including the orbitrap and FT ion trap.
Mass spectrometry is a sophisticated, sensitive, and accurate method for the analysis of chemical and biological compounds.1 A mass spectrometer measures mass-to-charge ratios (m/z) of samples which provide information about their composition, conformation, and their interaction with other compounds.2-4 Fourier transform ion cyclotron resonance mass spectrometry (FTICRMS) is generally recognized for its high mass resolving power and mass accuracy compared to other mass spectrometry platforms.5-7
In an FTICR mass spectrometer sample compounds are excited into cyclotron orbits as coherent packets of ions in the presence of external magnetic and electric fields.5 The rotating ion packets induce an alternating image current on the plates of the ICR cell with a frequency corresponding to, roughly, their cyclotron frequencies (given by Eqn. (1)). The induced signal is the superposition of all the spectral frequency components due to various ion packets of different m/z. This signal is amplified using a low noise amplifier and digitized using an analog-to-digital converter (ADC)8-12 (Fig. 1). The spectral components in this time-domain signal are extracted by a fast Fourier transform (FFT) algorithm.13 These frequency components are then calibrated to provide a mass spectrum.14-17
| (1) |
Figure 1.
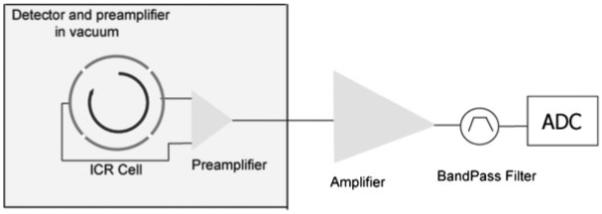
FTMS detection scheme.
The peaks in the mass spectrum represent the frequency of cyclotron motion of ions. However, in the commonly used open cylindrical and cubic ICR cell in FTMS, the electric field which the ions experience is not perfectly hyperbolic which adds non-linear terms to Eqn. (1). Moreover, the finiteness of the electrodes of the ICR cell results in the appearance of signal peaks at the odd harmonics of the cyclotron frequency.10,11 Higher order harmonic detection to improve resolution in FTICRMS has also been shown in the past.18,19 Though these harmonics can also provide vital information such as ion cyclotron radius,20 their presence increases the complexity of the mass spectra making data interpretation difficult.
Often, in FTMS, there are peaks which arise in a mass spectrum which are not due to any physical phenomenon/ imperfections but are the result of errors in sampling by an analog-to-digital converter (ADC) or because of calculation of the FFT of the distorted ion signal.21 Recently, these artifacts were observed during the evaluation of an ultra-sensitive detection amplifier for room temperature FTMS.12 The presence of such non-real peaks makes the interpretation of mass spectra far more complex and prone to identification errors. Thus it becomes important to understand these artifacts, their cause and ways to avoid them. This short communication discusses such artifacts in mass spectra obtained by FTMS which are related to sampling and signal processing. Strategies to avert these errors in signal processing are also presented. These methods are equally applicable to any instrument which uses Fourier transform as a tool for data analysis such as an orbitrap,22 Fourier transform ion trap,23 etc. Various cases with relevant examples of mass spectra obtained by matrix-assisted laser desorption/ionization (MALDI)-FTMS24 and simulated numerically are presented.
EXPERIMENTAL
A custom-made MALDI-FTMS system24 was used for all the experiments which has a ultra-low-noise BUSM detection preamplifier.12 A saturated solution of C60 in toluene was spotted onto a stainless steel plate. Spectra were generated using a single shot of a 355 nm Nd:YAG laser (Continuum Inc., Santa Clara, CA, USA) at 50-150 μJ/pulse. A pair of hexapoles driven by radio-frequency (RF) oscillators25,26 were used to transfer the ions to the ICR cell. After 200 ms of thermal stabilization, the ions were resonantly excited into coherent cyclotron orbits by the application of a broadband RF sweep. An RF sweep voltage of 80 Vp-p was applied for 8 ms and swept from 150 to 3000 Da. 256K samples were taken from the amplified ICR signal at a rate of 1 MHz (total transient length of 0.262s). The digitized data was fast Fourier transformed without apodization. The standard detection scheme for an FTMS experiment is shown in Fig. 1.
Simulated spectra were generated using a MATLAB script (The MathWorks Inc., Natick, MA, USA). Three undamped sinusoidal functions were used to model the first three isotopes of C60. The instantaneous signal, f(t), at any time, t, can be found by superposition principle, as shown in Eqn. (2).9,21
| (2) |
Here, A1, A2, A3 and fc1, fc2, fc3 are the abundances and cyclotron frequencies for the first three most abundant isotopes of C60, respectively. Substituting the values for 7 Tesla FTICRMS, we obtain:
| (3) |
Note that, this is a simplified model of induced ion current in ICR; sufficient to analyze the artifacts arising due to signal processing which is the primary goal of this article. A detailed signal model can be found in an article by Grosshans et al.11 The density functional theory (DFT) routine defined in MATLAB was used to obtain the spectral information from the time-domain data. The frequency spectrum was converted into the mass-to-charge domain using calibration constants for a 7 Tesla magnetic field.15,16,27
RESULTS AND DISCUSSION
In these sets of experiments, C60 was chosen as the compound of interest. The intermodulation of time-domain signals due to the first three isotopes of C60 is shown in Fig. 2(a). The induced image signals from the three isotopes interfere constructively and destructively with each other causing the generation of the beat pattern. The spacing between these beats is determined by the frequencies of the neighboring isotopes.28 The Fourier transform of the time-domain signal from Fig. 2(a) is shown in Fig. 2(b), where fc, 149 kHz, is the cyclotron frequency of the C60 ion at 7 T. A simulated mass spectrum and experimental mass spectrum of C60 are shown in Figs. 2(c) and 2(d), respectively. As the physical model of the electric field inhomogeneity is not included here, the odd harmonics which are present in real spectra are not seen in Fig. 2(b), but are apparent in the real spectra (data not shown). Figure 2 represents a nearly ideal detection case in FTICRMS.
Figure 2.
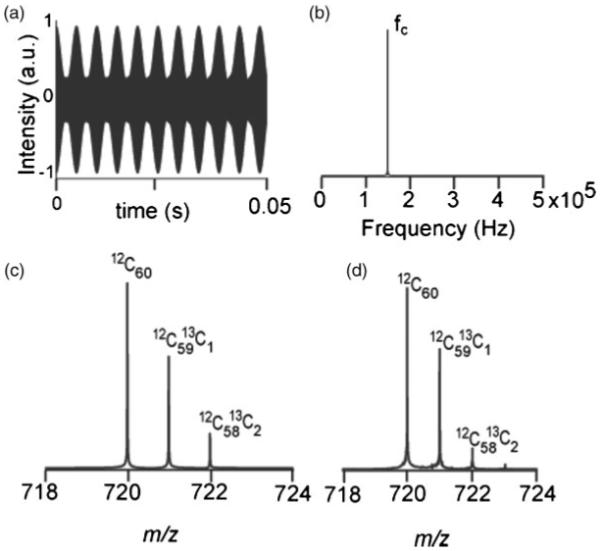
C60 signal recorded by FTMS. (a) Simulated transient. (b) Simulated frequency spectrum, FFT of (a). (c) Simulated mass spectrum, calibrated m/z spectrum of (b) using 7 T calibration constants. (d) Mass spectrum obtained by MALDI-FTMS.
In FTICRMS, the detection amplifier sends the signal to the ADC. In a case when the detection amplifier is highly sensitive (high gain & low noise), saturation of the amplifier or overloading of the ADC can occur, which generates additional spectral artifacts. Figure 3(a) shows the C60 beat pattern with a direct current (DC) offset causing the saturation/clipping of part of the negative signal. The DC offset could be caused by the temperature drift in electronic components of the amplifier, or imbalance of the two FFTs (mismatch).12 The frequency spectrum of the simulated transient is shown in Fig. 3(b). The spectral components due to C60 are present, fc; however, the so-called ‘clipping’ of the time-domain signal generates the harmonics of the cyclotron frequency within the spectrum. Ideally, ICR detection is a differential scheme and no even harmonics should appear in the resulting mass spectra. However, in this case the clipping, which is caused by the imbalance in the ICR detection circuit, gives rise to the even harmonics.
Figure 3.
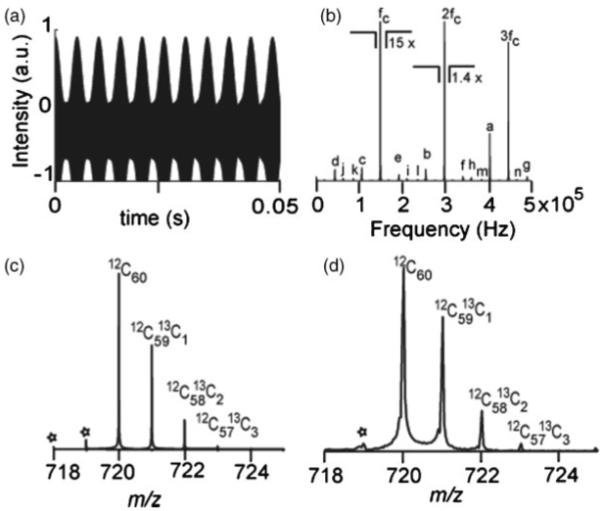
C60 signal with asymmetric overloading of the ADC. (a) Simulated transient. (b) Simulated frequency spectrum showing artifacts at odd and even harmonics of the cyclotron frequency, FFT of (a). The peak labels are defined in Table 1. (c) Simulated mass spectrum with 1 Da spacing artifacts due to intermodulation of the C60 isotope signals. (d) Experimental mass spectrum obtained by MALDI-FTMS showing the 1 Da neighboring artifacts, “*”.
The first harmonic (fc), second harmonic (2fc) and the third harmonic (3fc) at ≈149 kHz, ≈298 kHz, and ≈447 kHz, respectively, are seen in Fig. 3(b). The frequency of the fourth harmonic is more than the Nyquist frequency of 500 kHz; this results in the undersampling (aliasing), and a fold-over peak at 404 kHz (4fcf=1 MHz to 596 kHz) appears in the spectrum. Similarly, fold-over peaks up to the seventeenth harmonic, 17fcf, are visible and labeled in the frequency spectrum. The list of all harmonics in Fig. 3(b) is given in Table 1. It should be recalled that these harmonics are not due to any physical phenomenon such as magnetron motion, but are caused during the signal processing of the induced ion signal. Thus an anti-aliasing filter, the low pass part of the bandpass filter in Fig. 1, implemented in an ADC prior to sampling will not attenuate these artifacts. These even harmonics, originating typically from a mismatch in the two channels of the detection circuit, can be caused by misalignment of the cell electrodes, connecting wires, filter, unbalance within the preamplifier, or the digitizer itself. In the mass spectrum besides the C60 isotopic cluster there are several peaks at 1 Da spacing below the monoisotopic peak. These peaks shown in Figs. 3(c) and 3(d) (marked with *) arise due to intermodulation of the C60 isotopes and lead to the distortion of the C60 isotopic distribution. These peaks arise due to the mixing of frequencies of isotopes of C60. Similar modulations have been reported previously by Laude and coworkers, resulting in side bands.29 However, the side bands shown here are not due to any physical ion-ion interactions, but are the result of clipping of the signal at the digitizer.
Table 1.
List of artifact peaks at harmonics of the fundamental cyclotron frequency, fc
| a = 4fc | h = 11fcf |
| b = 5fcf | i = 12fcf |
| c = 6fcf | j = 13fcf |
| d = 7fcf | k = 14fcf |
| e = 8fcf | l = 15fcf |
| f = 9fcf | m = 16fcf |
| g = 10fcf | n = 17fcf |
The offset in the signal can be avoided by implementing a high pass filter prior to the ADC. However, overloading of the ADC can still occur due to the high gain of the detection amplifier. A time-domain signal showing such a case is shown in Fig. 4(a) in which truncation of the signal is caused by the amplitude of the ICR signal going beyond the dynamic range of the ADC. The frequency spectrum in Fig. 4(b) shows the presence of odd harmonics only. As previously mentioned, the odd harmonics in ICR arise from the finiteness of the detection electrodes in the trap, and their amplitudes monotonically increase with the ion cyclotron radius.21 This non-linearity is not modeled here, so the odd harmonics in Fig. 4(b) are due to clipping only. In the case of the C60 mass spectrum obtained by FTMS, the clipping of the transient increases the intensities of the odd harmonics, which were originally barely visible in the unclipped mass spectrum in Fig. 2(b). The simulated and the experimental mass spectra in Figs. 4(c) and 4(d) also show the isotopic intermodulation artifacts with ≈1 Da spacing below the C60 isotopes.
Figure 4.
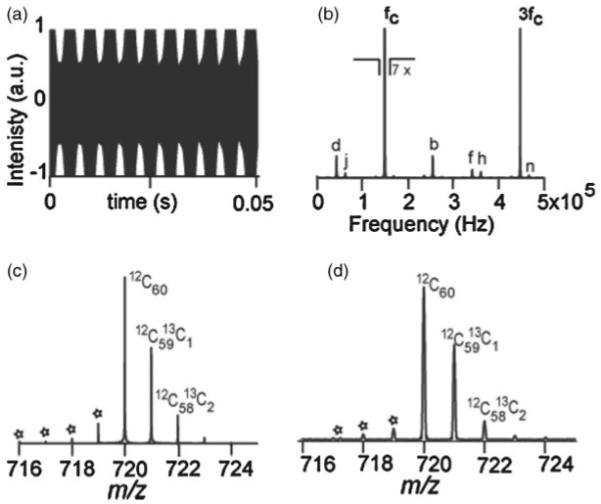
C60 signal with symmetric overloading of the ADC. (a) Simulated transient. (b) Simulated frequency spectrum showing artifacts at only odd harmonics of the cyclotron frequency, FFT of (a). (c) Simulated mass spectrum with 1 Da spacing artifacts due to intermodulation C60 isotope signals. (d) Experimental mass spectrum obtained by MALDI-FTMS showing the 1 Da neighboring artifacts, “*”.
Often in FTMS experiments too many ions in the ICR cell or high amplifier gain can lead to an extreme case of saturation of the ADC, henceforth referred as a ‘Blackbar’ transient. An example of such a transient for C60 ions is shown in Fig. 5(a). The Fourier transform of the simulated signal indicates the presence of dominant third harmonic and also a second harmonic component of the ICR signal. The experimental mass spectrum was generated by accumulating C60 ions from multiple laser shots. The increased number of C60 ions induced a voltage which after amplification was high enough to overload the ADC. The mass spectrum also exhibits the train of isotopic intermodulation artifacts at ≈1 Da spacing around C60 isotopes as in the previous case, however with much higher intensities. The A+1 and A+2 isotope peaks have their abundances severely altered by this mixing (Figs. 5(c) and 5(d)).
Figure 5.
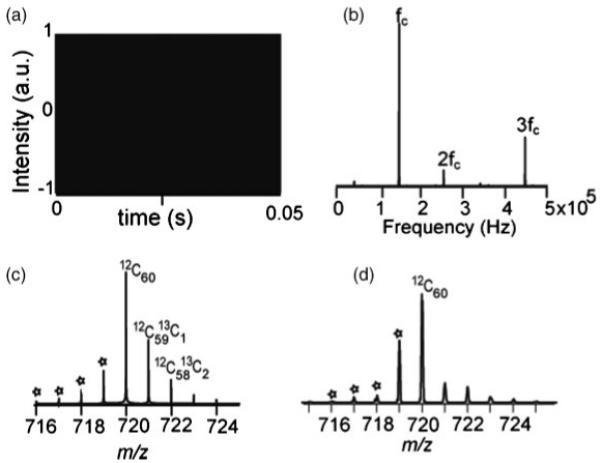
C60 ‘Blackbar’ transient. (a) Simulated transient. (b) Simulated frequency spectrum showing artifacts at odd and even harmonics of the cyclotron frequency, FFT of (a). (c) Simulated mass spectrum with 1 Da spacing artifacts due to intermodulation C60 isotope signals. (d) Experimental mass spectrum obtained by MALDI-FTMS showing the 1 Da neighboring artifacts, “*”.
All of the above artifacts were based on saturation of the ADC normally caused by the high amplitude of the FTMS signal compared to the dynamic range of the ADC. In this case, the amplifier had an output range of ±6 V, while the ADC had an input range of ±0.5 V, guaranteeing the saturation of the ADC prior to that of the amplifier. However, it is important to note that in other configurations these signals can also be generated by the saturation of the amplifier itself. A variable gain element with a feedback control can be implemented to prevent saturation of the amplifier. However, reducing the gain of the amplifier sacrifices the dynamic range and also degrades the limit of detection of the ICR detection circuit. Signal saturation can also be avoided by implementing automatic gain control (AGC) in the FT mass spectrometer. In such a scheme a survey scan or current measurement is performed to estimate the number of ions in FTMS. Then the ion accumulation time is adjusted accordingly to prevent overloading of the ICR cell.30
Another significant cause of artifacts in FTMS, which originally led to these investigations, are artifacts induced by radio-frequency interference (RFI) on the detection lines. In a mass spectrometer, power supplies, vacuum pumps, RF oscillators, driving ion guides, ion gauges, and even noise of the DC voltages on the ion optics can be a source of RFI, corrupting the ion signal. The signal in FTMS arises by charge induction on the detector electrodes, which have a capacitance of the order of 20 pF.12 The high impedance nature of the FTMS detector makes it prone to microphonic pick up at the input of the preamplifier. Even a small amount of injected charge can produce significant voltage to completely suppress the desired ion signal. Typically, RFI noise leads to electronic noise peaks in the frequency/mass spectrum which are readily recognizable as they have no isotopes and do not interfere in the analysis, if they do not overlap with the peaks of interest. However, one scenario is of special interest which results in distinct artifacts in a mass spectrum, as discussed below.
Figure 6(a) shows the particular case where RFI noise at 167 and 120 Hz was intentionally added to the C60 isotopes, in MATLAB, causing asymmetric overloading of the ADC. Without any saturation the 167 and 120 Hz peaks would correspond to 598 and 833 kDa, respectively, and normally would be out of the range of interest on a 7 Tesla FT mass spectrometer, thus not interfering with the data analysis. However, as evident from Fig. 6, the saturation has caused the intermodulation of these RFI frequencies with the isotopes of C60, complicating the spectrum.
Figure 6.
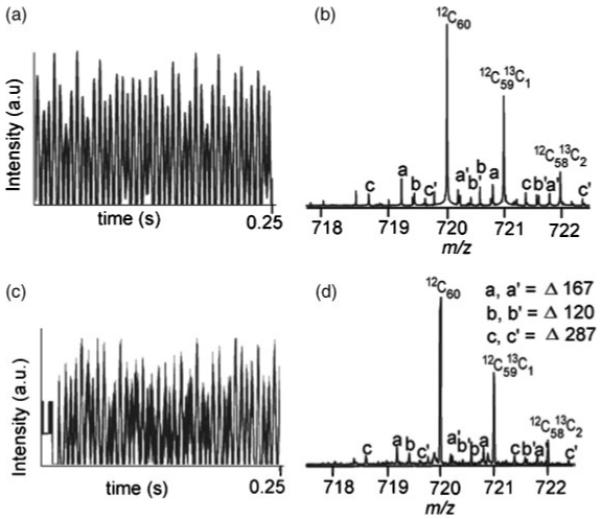
C60 transient with RFI at 120 and 167 Hz. (a) Simulated transient clipped in negative half. (b) Simulated mass spectrum showing peaks appearing at mixing frequencies of C60 isotopes and RFI signal. (c) Experimental C60 transient obtained by MALDI-FTMS. (d) Experimental mass spectrum obtained by MALDI-FTMS showing the intermodulation peaks.
More realistically, the RFI coupled to the ICR time-domain signal can affect the signal-to-noise (S/N) ratio, as evident in Fig. 6(c). This figure shows the real time-domain signal obtained by MALDI-FTMS using the low noise BUSM preamplifier.12 This preamplifier was powered by switching power supplies which introduced RFI noise peaks, pre-dominantly at 120 and 167 Hz. This low frequency signal was amplified and saturated the ADC on the negative side. The prominent artifacts from this saturation are labeled in Fig. 6(d). This cluster of small peaks made the spectrum appear noisy near the C60 isotopes, deteriorating the S/N ratio. Thus it becomes important to use low noise power supplies or, even better, batteries, for superior performance of the ICR detection preamplifier. Proper bypassing and grounding of the preamplifier power rails eliminates RFI which can manifest as spectral artifacts in a mass spectrum. Moreover, mounting the preamplifier as close as possible to the detection plates of the ICR cell greatly reduces the potential of RFI as the output of the preamplifier is a low impedance line, which significantly reduces microphonic and inductive pick ups.
Artifact peaks such as the ones shown in Figs. 3-6 can cause adverse effects on the mass accuracy of a peak centroid determination. If the calibration equation uses a total-ion-intensity correction term,27,31 and these artifact peaks are included in the measured signal intensity, this correction term will overestimate the number of ions and overcorrect the masses accordingly. Also, if some of the artifact peaks happen to overlap with real peaks of interest (which is likely), their presence will distort the peak shapes, shifting the peak centroid and adding error in the mass measurement. Thus, it is critically important that these artifacts are minimized in any experiment where the best possible mass accuracy is the goal. Furthermore, while automatic gain control (AGC) will usually prevent saturation, it is possible that if the number of ions that AGC is set to accumulate is maximized, the detector will be saturated in much the same way as illustrated here. It is simple to check for this by monitoring the transient, and it is important that instrument control software be able to do this.
CONCLUSIONS
Fourier transform mass spectrometry provides data with high mass accuracy and resolution which is rich in information. To ensure superior level of performance it is necessary to optimize the gain of the detection amplifier according to the ADC specification. In this communication it is shown that imbalance in the gain or bias of the amplifier can lead to overloading of the ADC which results in appearance of harmonics in the mass spectra. Severe overloading of the ADC can also cause distortion in the isotopic distribution of ions thus making the automated interpretation of the mass spectra difficult. Radio-frequency interference on the ICR signal can also cause imbalance and/ or overloading of the ADC. A low noise amplifier mounted close to the detection plates can minimize this.
Acknowledgements
The authors would like to thank Dr. Saikat Ray and Dr. Ronald W. Knepper for helpful comments. The contribution of the Scientific Instrument Facility in the project is also appreciated. This work was funded in part by grants from NIH/NCRR P41PR10888, NIH/NHLBI N01HV28178, NIH/NIGMS R01GM78293, and MDS Sciex.
Contract/grant sponsor: NIH; contract/grant numbers: NCRR P41PR10888, NHLBI N01HV28178, and NIGMS R01GM78293.
Contract/grant sponsor: MDS Sciex.
REFERENCES
- 1.Aebersold R, Goodlett DR. Chem. Rev. 2001;101:269. doi: 10.1021/cr990076h. [DOI] [PubMed] [Google Scholar]
- 2.Gygi SP, Han DK, Gingras AC, Sonenberg N, Aebersold R. Electrophoresis. 1999;20:310. doi: 10.1002/(SICI)1522-2683(19990201)20:2<310::AID-ELPS310>3.0.CO;2-M. [DOI] [PubMed] [Google Scholar]
- 3.Mann M, Hojrup P, Roepstorff P. Biol. Mass Spectrom. 1993;22:338. doi: 10.1002/bms.1200220605. [DOI] [PubMed] [Google Scholar]
- 4.Cronshaw JA, Krutchinsky AN, Zhang WZ, Chait BT, Matunis MJ. J. Cell Biol. 2002;158:915. doi: 10.1083/jcb.200206106. [DOI] [PMC free article] [PubMed] [Google Scholar]
- 5.Comisarow MB, Marshall AG. Chem. Phys. Lett. 1974;25:282. [Google Scholar]
- 6.Comisarow MB, Marshall AG. Chem. Phys. Lett. 1974;26:489. [Google Scholar]
- 7.Amster IJ. J. Mass Spectrom. 1996;31:1325. [Google Scholar]
- 8.Shockley W. J. Appl. Phys. 1938;9:635. [Google Scholar]
- 9.Comisarow MB. J. Chem. Phys. 1978;69:4097. [Google Scholar]
- 10.Nikolaev EN, Gorshkov MV. Int. J. Mass Spectrom. Ion Processes. 1985;64:115. [Google Scholar]
- 11.Grosshans PB, Shields PJ, Marshall AG. J. Chem. Phys. 1991;94:5341. [Google Scholar]
- 12.Mathur R, O’Connor PB. J. Am. Soc. Mass Spectrom. 2007;18:2233. doi: 10.1016/j.jasms.2007.09.013. [DOI] [PMC free article] [PubMed] [Google Scholar]
- 13.Cooley JW, Tukey JW. Math. Comput. 1965;19:297. [Google Scholar]
- 14.Comisarow MB, Marshall AG. J. Chem. Phys. 1976;64:110. [Google Scholar]
- 15.Ledford EB, Rempel DL, Gross ML. Anal. Chem. 1984;56:2744. doi: 10.1021/ac00278a027. [DOI] [PubMed] [Google Scholar]
- 16.Francl T, Sherman MG, Hunter RL, Locke MJ, Bowers WD, McIver RT. Int. J. Mass Spectrom. Ion Processes. 1983;54:189. [Google Scholar]
- 17.Zhang LK, Rempel D, Pramanik BN, Gross ML. Mass Spectrom. Rev. 2005;24:286. [Google Scholar]
- 18.Pan Y, Ridge DP, Rockwood AL. Int. J. Mass Spectrom. Ion Processes. 1988;84:293. [Google Scholar]
- 19.Grosshans PB, Marshall AG. Int. J. Mass Spectrom. Ion Processes. 1991;107:49. [Google Scholar]
- 20.Grosshans PB, Shields PJ, Marshall AG. J. Am. Chem. Soc. 1990;112:1275. [Google Scholar]
- 21.Marshall AG, Verdun FR. Fourier Transforms in NMR, Optical, and Mass Spectrometry. Elsevier; Amsterdam: 1990. pp. 247–253. [Google Scholar]
- 22.Hu Q, Noll RJ, Li H, Makarov A, Hardman M, Cooks RG. J. Mass Spectrom. 2005;40:430. doi: 10.1002/jms.856. [DOI] [PubMed] [Google Scholar]
- 23.Soni M, Frankevich V, Nappi M, Santini RE, Amy JW, Cooks RG. Anal. Chem. 1996;68:3314. doi: 10.1021/ac960577s. [DOI] [PubMed] [Google Scholar]
- 24.O’Connor PB, Budnik BA, Ivleva VB, Kaur P, Moyer SC, Pittman JL, Costello CE. J. Am. Soc. Mass Spectrom. 2004;15:128. doi: 10.1016/j.jasms.2003.10.005. [DOI] [PubMed] [Google Scholar]
- 25.O’Connor PB, Costello CA, Earle WE. J. Am. Soc. Mass Spectrom. 2002;13:1370. doi: 10.1016/S1044-0305(02)00700-6. [DOI] [PubMed] [Google Scholar]
- 26.Mathur R, O’Connor PB. Rev. Sci. Instrum. 2006;77:114101. [Google Scholar]
- 27.Zhang LK, Rempel D, Pramanik BN, Gross ML. Mass Spectrom. Rev. 2005;24:286. [Google Scholar]
- 28.Hofstadler SA, Bruce JE, Rockwood AL, Anderson GA, Winger BE, Smith RD. Int. J. Mass Spectrom. Ion Processes. 1994;132:109. [Google Scholar]
- 29.Hendrickson CL, Beu SC, Laude DA., Jr. J. Am. Soc. Mass Spectrom. 1993;4:909. doi: 10.1016/1044-0305(93)80016-R. [DOI] [PubMed] [Google Scholar]
- 30.Belov ME, Zhang R, Strittmatter EF, Prior DC, Tang K, Smith RD. Anal. Chem. 2003;75:4195. doi: 10.1021/ac0206770. [DOI] [PubMed] [Google Scholar]
- 31.Easterling ML, Mize TH, Amster IJ. Anal. Chem. 1999;71:624. doi: 10.1021/ac980690d. [DOI] [PubMed] [Google Scholar]


