

Abstract
Epigenetic inactivation of genes by DNA hypermethylation plays an important role in carcinogenesis. An in vitro model of human breast epithelial cell transformation was used to study epigenetic changes induced by estradiol during the neoplastic process. Different stages of tumor initiation and progression are represented in this model being MCF-10F the normal stage; trMCF cells, the transformed stage; bsMCF cells, the invasive stage and, caMCF cells, the tumor stage. Global methylation studies by restriction landmark genomic scanning (RLGS) showed an increased DNA-methylation during the in the invasive and tumor stages. Expression studies showed that NRG1 (neuregulin 1), CSS3 (chondroitin sulfate synthase 3) and SNIP (SNAP-25-interacting protein) were downregulated in the invasive and tumor cells. The transformed cells showed low expression of STXBP6 (amysin) compared to the parental cells MCF-10F. The treatment of these cells with the demethylating agent 5-aza-dC alone or in combination with the histone deacetylase inhibitor trichostatin increased the expression of NRG1, STXBP6, CSS3 and SNIP confirming that DNA methylation plays an important role in the regulation of the expression of these genes. The NRG1 exon 1 has a region located between −136 to +79 (considering +1, the translational initiation site) rich in CpG sites that was analyzed by methylation specific PCR (MSP). NRG1 exon 1 showed progressive changes in the methylation pattern associated with the progression of the neoplastic process in this model; NRG1 exon 1 was unmethylated in MCF-10F and trMCF cells, becoming hypermethylated in the invasive (bsMCF) and tumor (caMCF) stages. Studies of human breast tissue samples showed that NRG1 exon 1 was partially methylated in 14 out of 17 (82.4%) invasive carcinomas although it was unmethylated in normal tissues (8 out of 10 normal breast tissue samples). Furthermore, NRG1 exon 1 was partially methylated in 9 out of 14 (64.3%) morphologically normal tissue samples adjacent to invasive carcinomas.
Keywords: Epigenetic changes, Breast cancer, DNA methylation, Neuregulin, Cell transformation
1. Introduction
Breast cancer (BC) is a hormone dependent malignancy whose incidence is steadily increasing in most western societies and industrialized countries. Each year 44,000 women die of breast cancer, making it the second leading cause of cancer deaths among American women, after lung cancer, and the leading cause of death among women aged 40 to 55 years. The elevated incidence of breast cancer has been associated with prolonged exposure to high levels of estrogen such as early onset of menstruation and late menopause [1,2]. The relationship between estrogen and breast cancer is further supported by epidemiological data that have demonstrated that women who receive estrogenic hormone replacement therapy (HRT) are more likely than never users to develop breast cancer [3–5].
We have developed an in vitro model of human breast epithelial cells transformation induced by estradiol (Fig. 1) [6]. In this model, the human breast epithelial cell line MCF-10F that is estrogen receptor α (ESRα) negative, was transformed by estradiol and different cell lines that represent different stages of breast cancer progression were isolated [6]. The MCF-10F progression model consists of four derived cell lines: a) the spontaneously immortalized cell line MCF-10F, which does not show any characteristic of invasiveness or tumor formation and therefore is considered to be a normal-like breast epithelial cell line; b) the transformed trMCF cells; c) the invasive bsMCF cell line and, d) the tumor cell lines, caMCFs, which shown all characteristics of a fully malignant breast cancer cell types [6] (Fig.1). The bsMCF cells induced tumors in SCID mice that were poorly differentiated adenocarcinomas that were ESRα, progesterone receptor (PR) and ERBB2 negatives. The highest number of deregulated genes was observed in caMCF, being slightly lower in bsMCF, and lowest in trMCF and this order was consistent with the extent of chromosome aberrations (caMCF > bsMCF ⋙ trMCF) [7].
Figure 1. Different stages in the in vitro model of breast cancer progression.

MCF-10F cells were treated with 70nM 17 β-estradiol for 24 hours, twice a week for two weeks. After the treatment, the trMCF cells (transformed stage) were maintained in culture and after several passages they were placed on matrigel Boyden chambers. The cells that passed through the membrane, named bsMCF cells (invasive cells) were collected, expanded and injected into the mammary fat pad of SCID mice. These invasive bsMCF cells formed tumors that were dissected originating the caMCF cell lines. The caMCF1, caMCF2, caMCF3 and caMCF4 cell lines were isolated from four single xenograft tumors and these cells showed similar characteristics according to previous studies [6,7,18].
Breast cancer is characterized by a variety of genetic lesions that include gene amplification and deletion, point mutations, loss of heterozygosity, chromosomal rearrangements, and overall aneuploidy [8]. Alternative mechanisms are represented by DNA methylation and covalent modifications of histone proteins, two epigenetic modifications important in transcriptional control [9]. DNA-methylation of cytosine residues at CpG dinucleotides that span the promoter and the first exon of some genes, occurs by the addition of a methyl group to the carbon-5 position of cytosine through the action of the de novo DNA methyltransferase (DNMT) enzymes [10]. Hypermethylation of CpG-rich sequences present in the promoters is associated with gene silencing. Histone modification such as acetylation, methylation, phosphorylation and ubiquitination is another epigenetic modification. Histone acetylation is controlled by histone acetyltransferases and histone deacetylases (HDACs) which control gene expression by remodeling the nucleosomes [11]. Highly acetylated histones are usually associated with transcriptional active sequences and hypoacetylated histones with silenced genes.
In contrast to mutations, epigenetic changes are reversible, raising the possibility of developing therapeutics based on restoring the normal epigenetic state to cancer-associated genes. The drugs 5-azacytidine (5-aza-C) and 5-aza-2’-deoxycytidine (5-aza-dC) are capable of reactivating gene expression. Subsequent to the incorporation into nucleic acid, they have the ability to directly target DNA methyltransferases (DNMTs) and in this way deplete cells from DNMT activities [12,13]. The covalent interaction between 5-aza-C and DNMT1 forces DNA replication to proceed in the absence of DNA methylation, thereby causing genomic DNA hypomethylation, including the loss of methylation at the promoters of previously silenced genes [12]. Another chemical agent commonly used to modulate the expression of silenced genes in cancer cells is the histone deacetylase inhibitor trichostatin (TSA) [14,15].
We have demonstrated that treatment of the human breast epithelial cells MCF-10F with 17-β estradiol (E2) induces the expression of phenotypic and genomic changes indicative of cell transformation [6]. In the present work, DNA methylation analysis of the different stages of the in vitro model revealed that epigenetic modifications of NRG1, CSS3 and SNIP were involved in the progression to the invasive and tumor stages. Results reported here are the first ones to demonstrate that NRG1 exon 1 showed methylation changes during the progression of the neoplastic process. Studies of human breast tissue samples showed that NRG1 exon 1 was partially methylated in invasive carcinomas although it was unmethylated in normal tissues. Furthermore, NRG1 exon 1 was partially methylated in a high percentage of morphologically normal tissue samples adjacent to invasive carcinomas.
2. Materials and Methods
2.1. Cell lines and culture conditions
MCF-10F is a human breast epithelial cell line spontaneously immortalized estrogen receptor alpha (ERα)-negative and beta (ERβ)-positive, progesterone receptor (PR) and ERBB2 negatives. MCF-10F, trMCF, bsMCF and caMCF cells were cultured in Dulbecco’s modified Eagle medium [DMEM/F-12, Gibco®; Formula 90–5212 EF: containing DMEM/F12 (1:1) with L-glutamine and phenol red, with 315 mg/L D-glucose, with 55 mg/L sodium pyruvate] with 5% horse serum, 2.43 g/l sodium bicarbonate, 20 µg/l epidermal growth factor (EGF), 100 µg/l Vibrio cholera toxin, 10 mg/l insulin, 0.5 mg/l hydrocortisone, 1.05 mM calcium, antibiotics and antimicotic (100 units/ml penicillin, 100 µg/ml streptomycin, 0.25 µg/ml amphotericin) [6]. The caMCF1, caMCF2, caMCF3 and caMCF4 cell lines were isolated from four single xenograft tumors grown in four animals; previous studies showed that these tumorigenic cells are very similar between them [6,7].
The human breast cancer cell lines T47D and MCF-7, both ERα positive and the ERα negative cell lines MDA-MB-231, MDA-MB-468, HS578T and BT549 were obtained from the Cell Culture Facility at Fox Chase Cancer Center and grown in RPMI 1640 media (Gibco-BRL, Gaithersburg, MD) with L-glutamine plus 10% fetal bovine serum (FBS) with antibiotics (100 units/ml penicillin, 100 µg/ml streptomycin).
2.2. Human Breast tissue samples
Breast tissue samples from 42 patients enrolled from Fox Chase Cancer Center was used in this study. The breast tissue samples included: 11 normal breast tissues (controls), 17 invasive carcinoma (IC) samples and, 14 morphologically normal tissue samples adjacent to IC. The study protocol was approved by the Institutional Review Board (IRB) and written informed consent was obtained from every participant. All patients were identified by coded numbers in place of names in the FCCC database; patient names and/or medical record numbers were known only by the treating physician and ancillary personnel. The samples from the control group were histological normal tissue adjacent to breast lesions with minimal pathological changes such as fibrosis, fibroadenomas, adenosis or papillomas. The histological normal breast tissue included in this study was taken from a distance of approximately 2 cm from the main gross palpable lesion and divided into two equal portions, one portion was fixed and embedded in paraffin for evaluation by a pathologist and a second half was frozen at −80°C. The samples were considered morphologically normal if they contained clusters of small ducts composed of a single myoepithelial basal layer and single cubical luminal layer with clear and prominent lumen and, if the cells had uniform, small nuclei with diffusely distributed chromatin. The tumor samples (Group 2 in Table 3) and the morphologically normal tissues adjacent to IC (Group 3 in Table 3) were from different patients.
Table 3. Methylation of NRG1 exon 1 in invasive carcinomas (IC), morphologically normal tissue adjacent to IC and normal human breast tissues.
As control, normal tissue adjacent to benign lesions of the breast was used (control group). The methylation status of NRG1 is indicated as: U (unmethylated) or P (partially methylated: PCR products were obtained with both set of primers). M: methylated. ND: no determinate. The age of the patients at the moment that the sample was taken and type of lesion are indicated. IDC: invasive ductal carcinoma. ILC: invasive lobular carcinoma. DCIS: ductal carcinoma in situ. p
| Patient number | Age | Diagnostic | NRG1 |
|---|---|---|---|
| Group 1: Control Group (normal tissue adjacent to benign lesions) | |||
| 148115 | 60 | Bening breast disease | U |
| 135447 S8 | 77 | Apocrine metaplasia | U |
| 49101 | 56 | Fibroadenoma | ND |
| 136620 | 67 | Fibrocystic changes | P |
| 131665 | 64 | Fibrocystic changes | U |
| 85453 | 59 | Epithelial hyperplasia | U |
| 137340 S15 | 63 | Epithelial hyperplasia | P |
| 135990 S9 | 64 | Adenosis | U |
| 141007 S21 | 77 | Adenosis | U |
| 141300 S24 | 78 | Adenosis | U |
| S14 136880 | 59 | Papilloma | U |
| P=2/10=20% | |||
| Group 2: Breast tumors | |||
| 1004172 (287767) | 50 | IDC, DCIS (GRADE III) | P |
| 1003361 (285220) | 68 | IDC | P |
| 1004363 (276283) | 58 | IDC (HIGH GRADE) | P |
| 1004783 (214003) | 73 | IDC, DCIS(GRADE III) | P |
| 1003356 (261845) | 57 | IDC (GRADE II) | U |
| 1000851 (265718) | 59 | IDC, DCIS | P |
| 1004041 (286233) | 37 | IDC (GRADE III) | P |
| 1003341 (279135) | 44 | IDC, DCIS (HIGH GRADE) | P |
| 1004582 (296190) | 52 | IDC (GRADE III) | P |
| 1004092 (284610) | 78 | IDC (GRADE III) | U |
| 1000826 (279038) | 73 | IDC (GRADE III) | P |
| 1002833 (268295) | 64 | IDC (GRADE III) | P |
| 1001581 (230160) | 64 | IDC (GRADE III) | P |
| 1001380 (243278) | 59 | IDC (GRADE II) | U |
| 1001168 (254401) | 51 | IDC (GRADE II) | P |
| 1001484 (239086) | 76 | IDC (GRADE I) | P |
| 1003731 (241220) | 51 | IDC (GRADE III) | P |
| P= 14/17= 82.4% | |||
| Group 3: Morphologically normal tissue adjacent to IC | |||
| 140569 C26 | 67 | IDC | P |
| 145565 | 62 | IDC, DCIS | U |
| 145564 | 74 | IDC | P |
| 133360 | 57 | U | |
| 141008 S22 | 55 | IDC, DCIS | U |
| 145813 | 53 | IDC | P |
| 147043 | 73 | IDC, DCIS | M |
| 145563 | 65 | IDC | P |
| 139128 S19 | 84 | IDC | P |
| 141299 S23 | 75 | IDC, DCIS | P |
| 154855 | 59 | IDC | U |
| 143061 | 73 | IDC and ILC | P |
| 157678 | 92 | ILC | P |
| 156105 | 73 | ILC | U |
| P or M=9/14 = 64.3% | |||
2.3. Real time RT-PCR
Total RNA was isolated from growing cells at 70%–80% confluence using Trizol (Invitrogen, Carlsbad, CA) according to manufacture’s instructions. The RNAs were treated with DNase I (Invitrogen, Carlsbad, CA) and cleaned using RNeasy kit (Qiagen, Valencia, CA). The RNA concentration and quality were determinate using a spectrophotometer (NanoDrop Technologies, Wilmington, DE) and capillary gel electrophoresis (Agilent 2100 Bioanalyzer, Palo Alto, CA). The TaqMan One Step RT-PCR kit (Applied Biosystems, Foster City, CA) was used and the assays were run using Applied Biosystems 7900 HT instrument. The Ct (threshold cycle) was calculated using two different amounts of RNA for each sample (50 ng and 100 ng total RNA) to allow measurement of the PCR efficiency. The Taqman primers/probe sets used were Hs00247620_m1 for NRG1, Hs00365956_m1 for HOXA9, Hs00233470_m1 for BMP6, Hs00398096_m1 for SPRY1, Hs00194833_m1 for TM4SF9, Hs00986118_m1 for SNIP, Hs00274072_m1 for STXBP6, Hs00545664_m1 for CSS3, Hs00232429_m1 for TBR1, Hs00270117_s1 for FOXD1 and Hs00427620_m1 for TBP (Applied Biosystems, Foster City, CA). The Ct is defined as the fractional cycle number at which the fluorescence generated by cleavage of the probe passes a fixed threshold above baseline. The comparative method calculates the relative gene expression using the following equation: Relative quantity= 2 −ΔΔCt. For expression studies with 5-aza-dC and/or TSA, the treatments were performed in three independent experiments, RNA was isolated from the cells and the real time RT-PCR reactions were made in duplicate for each sample-primer/probe. TBP (TATA-box binding protein) was used as endogenous control and the expression levels of the different genes were referred to the expression in the parental cell line MCF-10F. The NRG1 primer/probe detects mRNAs corresponding to HRGα, HRGβ1, HRGβ2, HRGβ3, HRGγ, GGF, GGF2 and NDF43, type I isoforms [16,17].
2.4. Treatments with 5-aza-dC and TSA
MCF-10F, trMCF, bsMCF and caMCF cells were treated with 2.5 µM 5-aza-2’-deoxycytidine (5-aza-dC) (Sigma Chemical Co, St. Louis, MO) for 96 hours or the histone deacetylase inhibitor trichostatin (TSA) at a concentration 100 ng/ml (Wako Pure Chemical Industries Ltd., Osaka, Japan) for 12 hours. For combination studies, 5-aza-dC was added to the culture medium for 96 hours and TSA was added for the last 12 hours. As the four caMCF cell lines showed similar characteristics [6,7,18], caMCF2 and caMCF4 were randomly chosen to be treated with 5-aza-dC and/or TSA. The treatments with 5-aza-dC and/or TSA were performed in three independent experiments and the RNAs were isolated from the cells for expression studies. For NRG1 protein studies, the cells were treated with 5-aza-dC in two independent experiments and protein extracts were prepared as it is indicated below.
2.5. Methylation specific PCR (MSP)
DNA was isolated from the cells and human breast tissue samples using DNeasy Blood and Tissue kit (Quiagen). For the sodium bisulfite modification, 1µg of DNA was denatured by adding 0.3M NaOH, incubated at 42°C for 30 minutes and, treated with 3.3M sodium bisulfite and 0.49 mM hydroquinone at 55°C for 16h, and purified using the Wizard DNA purification resin (Promega, Madison, WI) [19]. Approximately, 150 ng of sodium bisulfite-modified DNA was used as template in each PCR reaction. The PCR mixture contained 1x PCR buffer, 1.5 mM MgCl2, 200 µM dNTPs, 0.2 µM each primers and 1 unit Platinum Taq Polymerase (Invitrogen). The PCR was performed as followed: an initial denaturalization step at 94°C during 5 min followed by 35 cycles at 94°C for 45 sec, annealing temperature for 45 sec and, an extension step at 72°C for 45 sec; a final extension for 10 min at 72°C was included at the end. The primers were designed using Methyl Primer Express Software 1.0 from Applied Biosystems (Table 1). The DNA from MCF-10F cells treated with SssI methyltransferase (New England Biolabs Inc., Bervery, MA) was used as positive control for methylated alleles. PCR products were analyzed on 1.5% agarose gels and visualized under UV illumination. Three independent DNA extractions were done for each cell line and converted by bisulfite treatment and, the MSP reactions were performed at least two times for each DNA.
Table 1. Primers used for methylation specific PCR (MSP).
The U-primers and M- primers recognize the unmethylated and methylated sequences, respectively. The annealing temperatures and the size of the PCR product are indicated in each case.
| Gene | Primers 5’→3’ | Annealing | PCR (bp) |
|---|---|---|---|
| NRG1 | Forw (U): GTAGTGTGAGTGTTTTAGTGTGGTTG Rev (U): CAAACTCCAACTTCTTACCA |
56°C | 215 |
| Forw (M): GTTTTAGCGCGGTCGTTC Rev (M): CGAACTCCGACTTCTTACCG |
58°C | ||
| SPRY1 | Forw (U): GGTATATATAAATGAAAGAGGAAAT Rev (U): AACACACAATAATTTACAAAACA |
52°C | 175 |
| Forw (M): GGTATATAAACGAAAGAGGAAAC Rev (M): CACGCAATAATTTACAAAACG |
52°C | ||
| STXBP6 | Forw (U): TGAGTATGTTTAGAGGTGGTT Rev (U): AACTTAACCAACCCAAATAC |
52°C | 209 |
| Forw (M): GAGTATGTTTAGAGGCGGTC Rev(M): ACTTAACCGACCCGAATAC |
55°C | ||
| CSS3 | Forw (U): TTAGAGTTGAGTGGGAGTTT Rev (U): CAAACA CTCACTAAACTATCA |
52°C | 193 |
| Forw (M): TTAGAGTTGAGCGGGAGTTC Rev(M): CGAACGCTCGCTAAACTATCG |
58°C | ||
| SNIP | Forw (U): TTATTTTTTGTAGATTTGGAGT Rev (U): AAAAACATCACACTTACAATCAA |
54°C | 237 |
| Forw (M): TTTTTCGTAGATTCGGAGC Rev(M): AAAAACATCACGCTTACGAT |
52°C |
2.6. Western blot
Proteins were extracted from the cells using M_PER Mammalian Protein Extraction Reagent (Thermo Scientific) according to the manufacture’s instructions and measured using Bradford assay. Approximately, 50 µg were loading in a 4–20% tris-glycine gel (Invitrogen). A polyclonal goat anti human neuregulin-1α (C19) (Santa Cruz, sc-1791) in a dilution 1:250 and a polyclonal goat anti human β-actin (Santa Cruz, sc-1616) at 1:500 dilution were used as primary antibodies. Donkey IgG anti goat with horse radish peroxidase (Santa Cruz, sc-2020) was used as secondary antibody (1:3,000 dilution). The ECL Western blotting detection Reagent kit (Amersham Biosciences) for a chemiluminescent detection was used to develop. Western blots were repeated at least 2 times for each protein extract. The bands from the films were scanned and their intensities were quantified using the gel image analysis software (Nonlinear Dynamics, Inc.). All bands of the NRG1 were normalized against the corresponding β-actin intensity and then compared to each other.
2.7. Statistical analysis
The mRNA expressions results are representative of three independent 5-aza-dC/TSA treatments. For NRG1 protein studies, two independent 5-aza-dC treatments were made for each cell line and at least two independent Western blots were made for each cell extract. The results are expressed as the means± standard errors. Statistical analysis of the data was performed using a Student’s t-test. The statistically significant differences are indicated (p≤0.05).
3. Results
3.1. Epigenetic changes in a model of breast cancer progression
Global CpG island methylation was study at the different stages of the in vitro model of breast cancer progression by restriction landmark genomic scanning (RLGS) [20]. RLGS is based on the DNA digestion with the restriction enzyme NotI which is methylation-sensitive [21]. Thirty-eight genes were hypermethylated in the transformed (trMCF), invasive (bsMCF) and/or tumor (caMCF) stages compared to normal-like breast epithelial cells MCF-10F [20]. In order validate the RLGS results and identify genes that show progressive changes in their methylation pattern associated with the progression of the neoplastic process, expression studies were performed in these cells. As hypermethylation is associated with mRNA downregulation, the expression of 10 out of 38 genes was studied by real time RT-PCR. FOXD1, TBR1, BMP6, HOXA9 and TM4SF9 mRNA levels were similar at the different stages suggesting that methylation pattern of these genes was similar in the different cells of this model (data not shown). Although NRG1, SPRY1, STXBP6, CSS3 and SNIP were downregulated at one or more stages compared to MCF-10F (Fig.2) suggesting that increased DNA-methylation of these genes could be involved in their downregulation. NRG1 mRNA level was higher in MCF-10F compared to other stages and it was downregulated in trMCF (-1.4-fold change), bsMCF (-188-fold change) and absent in caMCF cells, although the downregulation in trMCF was not significant compared to the control MCF-10F (Fig.2). SPRY1, CSS3 and SNIP showed downregulation in the invasive (bsMCF) and tumor (caMCF) cells and, STXBP6 was downregulated only in the transformed trMCF cells (Fig. 2). Furthermore, the transformed stage (trMCF) showed increased expressions of SPRY1, CSS3 and SNIP and the tumor caMCF cells showed increased expression of STXBP6 (Fig. 2).
Figure 2. NRG1, SPRY1, STXBP6, CSS3 and SNIP were downregulated at different stages in the in vitro model of breast cancer progression.

RNA was isolated from: MCF-10F (normallike stage), trMCF (transformed stage), bsMCF (invasive stage) and the tumor caMCFs cells (caMCF1, caMCF2, caMCF3 and caMCF4). RNAs were isolated from each cell line in three independent experiments and the quantitative real time PCR was made in duplicated for each sample-primer-probe The results represent the means ± standard errors. The statistically significant variations compared with MCF-10F are indicated (*) (p≤0.05).
3.2. Expression studies after treatment with the demethylating agent 5-aza-dC and the histone deacetylase inhibitor trichostatin (TSA)
The different cells of the model (MCF-10F, trMCF, bsMCF and caMCF2) were grown in regular media or media with 5-aza-dC and/or TSA and, the expression of NRG1, STXBP6, CSS3, SNIP and SPRY1 were studied using real time RT-PCR (Table 2). The invasive bsMCF and tumor cells caMCF2 showed higher induction of NRG1 expression than parental or transformed cells after treatment with 5-aza-dC. NRG1 expression increased in the invasive (bsMCF) and tumor (caMCF2) cells at least 48-fold times after 5-aza-dC treatment indicating that this genes became hypermethylated in bsMCF and remain hypermethylated in caMCF2 (Table 2).
Table 2. Expression studies after treatment with 5-aza-dC and/or the inhibitor of the histone deacetylase TSA (trichostatin).
MCF, trMCF, bsMCF and caMCF2 were treated with 2.5 µM 5-aza-dC during 96h or 100ng/ml TSA during 12 h. For combinational studies, 5-aza-dC was added for 96h, and TSA was added for the last 12 h. After treatments, the RNAs were isolated and real time RT-PCR assays were performed and the values compared to MCF-10F. The expression values are relative to the expression of each gene in MCF-10F grown in regular media. The cells were treated in three independent experiments and the real time RT-PCR assays were performed in duplicated for each sample/primer-probe. The means ± standard errors are shown.
| NRG1 | STXBP6 | CSS3 | SNIP | SPRY1 | |
|---|---|---|---|---|---|
| MCF-10F | 1±0.05 | 1±0.03 | 1.03±0.19 | 1.03±0.26 | 1±0.03 |
| MCF-10F AZA | 1.52±0.57 | 2.32±0.77 | 26.65±1.01 | 1.93±0.19 | 2.32±0.08 |
| MCF-10F TSA | 0.94±0.05 | 4.19±0.32 | 15.5±1.02 | 14.27±0.25 | 0.87±0.19 |
| MCF-10F AZA+TSA | 1.04±0.08 | 7.15±2.15 | 160.17±11.1 | 11.04±0.08 | 1.03±0.12 |
| trMCF | 0.71±0.24 | 0.06±0.01 | 9.01±3.07 | 1.89±0.098 | 1.17±0.02 |
| trMCF AZA | 0.71±0.11 | 1.62±0.07 | 93.18±15.85 | 2.81±0.34 | 3.07±0.08 |
| trMCF TSA | 0.55±0.06 | 1.49±0.07 | 44.89±13.87 | 8.76±0.33 | 0.41±0.12 |
| trMCF AZA+TSA | 0.498±0.12 | 5.96±0.42 | 164.20±55.9 | 15.68±1.95 | 0.93±0.04 |
| bsMCF | 0.01±0.001 | 1.08±0.32 | 0±0 | 0.22±0.02 | 0.35±0.04 |
| bsMCF AZA | 0.48±0.28 | 8.17±2.37 | 1.29±0.9 | 1.48±0.11 | 1.72±0.64 |
| bsMCF TSA | 0.005±0.003 | 2.84±0.47 | 0.07±0.07 | 3.79±0.63 | 0.49±0.07 |
| bsMCF AZA+TSA | 0.22±0.13 | 6.78±2.03 | 2.18±1.3 | 14.63±0.4 | 1.01±0.19 |
| caMCF2 | 0±0 | 5.1±1.32 | 0.73±0.09 | 0.1±0.004 | 0.35±0.01 |
| caMCF2 AZA | 1.02±0.08 | 19.78±1.78 | 70.64±9.25 | 1.57±0.08 | 0.51±0.04 |
| caMCF2 TSA | 0±0 | 5.41±0.169 | 0.13±0.13 | 0.88±0.14 | 0.72±0.05 |
| caMCF2 AZA+TSA | 0.01±0.002 | 8.61±0.3 | 0±0 | 1.84±0.15 | 1.74±0.3 |
The expression of STXBP6 increased in all the cells after treatment with 5-aza-dC in combination with TSA although there was a higher increase in trMCF. As it is showed in Table 2, the transformed cells (trMCF) showed a 27-fold times increase in STXBP6 expression with 5-aza-dc, 24.8-fold increase expression with TSA and, 99.3-fold induction when TSA was used in combination with 5-aza-dC. Lower STXBP6 increases were observed in bsMCF and caMCF2 after 5-aza-dC (7.6- and 3.9-fold time increases respectively), TSA (2.6- and 1.1- fold increases respectively) or combinational treatments (6.3- and 1.7-fold increases respectively). These results indicate that STXBP6 downregulation in the transformed cells trMCF was probably due to increased methylation and the hypoacetylation of the histones bind to this region of the chromatin. CSS3 showed higher expression with 5-aza-dC in all the cells from the model although, higher increases were observed in bsMCF and caMCF2 (at least 96.76-fold times induction) (Table 2). In the invasive bsMCF cells, CSS3 expression showed higher increases after combinational treatment with 5-aza-dC and TSA although caMCF2 shown higher levels of induction with 5-aza-dC alone (Table 2).
For SNIP, 5-aza-dC alone or in combination with TSA also increased its expression in all the cells from the model although higher increases were observed in bsMCF and caMCF2 cells. SNIP expression showed higher increases when the cells were treated with TSA in combination with 5-aza-dC: 11.04-fold in MCF-10F, 8.4-fold in trMCF and, 66.5- and 18.4-fold increase in the invasive bsMCF and tumor cells caMCF2, respectively (Table 2). These results indicated that the low SNIP expression in the invasive and tumor cells was related probably to increased methylation of this gene and hypoacetylation of the histones that were binding to the chromatin in this region making SNIP less accessible for its transcription.
All the cells from the in vitro model showed low SPRY1 increases after treatment with 5-aza-dC (2.32-fold in MCF-10F, 2.6- fold in trMCF, 4.9-fold in bsMCF and 1.5-fold in caMCF2) suggesting that methylation was not involved in the downregulation of this gene in bsMCF and caMCF cells (Table 2).
We observed that treatment with trichostatin (TSA) decreased the expression of some genes at certain stages but not in others (Table 2). The SPRY1 mRNA level decreased in trMCF cells treated with TSA and the difference was significant compared to the expression in trMCF grown in regular media (p≤0.05). Also these cells (trMCF) showed a decreased NRG1 expression after treatment with 5-aza-dC in combination with TSA but, the difference was not significant compared to the cells grown in regular media (p=0.54) (Table 2). A similar effect with TSA treatment was observed in bsMCF for NRG1 and in caMCF2 for CSS3 although the variations were not significant compared to their expressions in these cells grown in regular media (p= 0.8 and p=0.07, respectively) (Table 2).
3.3. Methylation studies by methylation specific PCR (MSP)
Methylation specific PCR (MSP) was performed to study the methylation status of SPRY1, STXBP6, CSS3, SNIP and NRG1 at the different stages of the in vitro model. For these studies, genomic DNA was treated with bisulfite which converts unmethylated cytosine to uracil for generating thymidine during the subsequent PCR process [22]. For SPRY1, all the cell lines from the model showed a band only with the U-primers indicating that this gene was unmethylated (Fig. 3). For STXBP6 and SNIP, all the cell lines showed a band with the M-primers indicating that these genes were methylated in all the stages of the in vitro model (Fig. 3). Although STXBP6 and SNIP showed significant differences in their expression in the different cells, these genes did not show to be unmethylated in some cells becoming methylated in others. A progressive methylation change was not observed for STXBP6 and SNIP in this model of breast cancer progression in the regions that were studied by MSP (Fig. 3A). CSS3 showed a band with both, the U- and M-primers in all the cells although even using different DNA extractions, MCF-10F and trMCF cells showed a stronger band with the U-primers and, bsMCF and caMCF cells with the M-primers (Fig. 3).
Figure 3. STXBP6, SNIP and CSS3 methylation in the in vitro model.
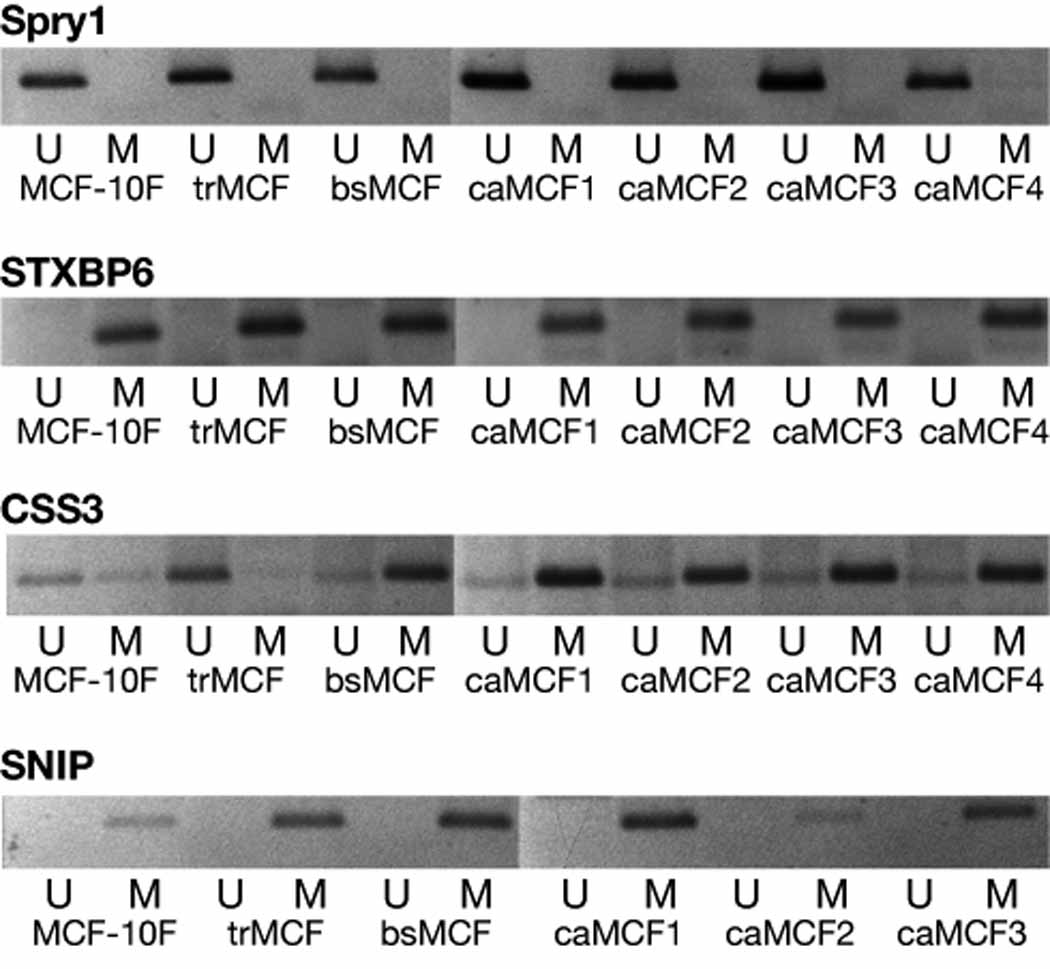
The methylation status of the promoter/exon 1 of STXBP6, SNIP and CSS3 was studied in MCF-10F, trMCF, bsMCF and caMCF cells. A representative experiment from three independent ones is showed.
When NRG1 exon 1 was studied by MSP, MCF-10F and trMCF cells showed a band only with the U-primers that recognize the unmethylated sequence and no bands were obtained with the M-primers (Fig. 4A). Conversely, PCR bands were obtained in bsMCF, caMCF1, caMCF2, caMCF3 and caMCF4 with the M-primers, but no band was obtained with the U-primers (Fig. 4A). These data indicated that NRG1 exon 1 is unmethylated in MCF-10F and trMCF cells, becoming methylated in the invasive (bsMCF) and tumor (caMCF) stages. In this model of breast cancer progression, NRG1 showed a progressive methylation change. Furthermore, NRG1 was study by methylation specific PCR (MSP) in different breast cancer cell lines (Fig. 4B). T47D and MCF-7, both ERα positive and, the ERα negative cell lines MDA-MB-231, HS578T and BT549 showed a band with the U-primers indicating that this gene was unmethylated in these cells. The cell line MDA-MB-468 (ERα negative) showed a band with the M-primers and no band was obtained with the U-primers indicating that NRG1 exon 1 was hypermethylated in MDA-MB-468 (Fig. 4B).
Figure 4. NRG1 hypermethylation in the invasive and tumorigenic stages of the in vitro model and the estrogen receptor negative cell line MDA-MB-468.

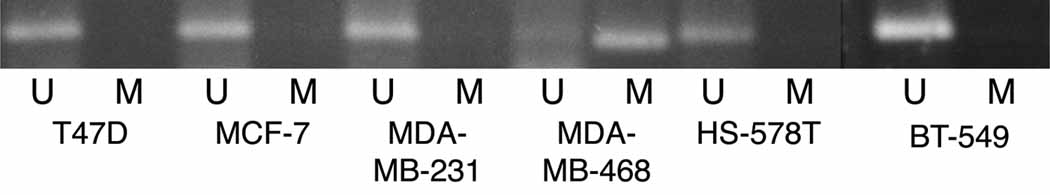
NRG1 methylation was studied by methylation specific PCR (MSP) in: A) the in vitro model of breast cancer progression and, B) in the human breast cancer cell lines T47D and MCF-7, both ERα positive and, the ERα negative cells MDA-MB-231, MDA-MB-468, HS578T and BT549. A band corresponding to NRG1 exon 1 was identified with two sets of primers, one pair recognized a sequence in which CpG sites present in the primer region were unmethylated (bisulfite modified to UpG), and the other recognized a sequence in which CpG sites were methylated (unmodified by bisulfite treatment). A representative experiment from three independent ones is showed.
3.4. NRG1 in the model of breast cancer progression
The levels of the NRG1 protein was studied by Western blot (Fig. 5A). NRG-1α protein level was lower in the transformed (trMCF), invasive (bsMCF) and tumorigenic (caMCF4) stages and the differences were significant compared to the control MCF-10F (p<0.05) for all of them, including trMCF cells (p=0.003). The invasive bsMCF and tumor caMCF4 cells showed significant increases of NRG1 after treatment with 5-aza-dC at both mRNA and protein levels (Fig. 5). Although NRG1 mRNA expression was very low in bsMCF and caMCF cells, the NRG-1α protein was present in these cells although at lower levels compared to the parental MCF-10F cells.
Figure 5. NRG1 expression in vitro model of breast cancer progression.


The different cells of the model were treated with 2.5µM 5-aza-dC during 96h or grown in regular media. A) NRG1 protein (44-kDa) was present in all cell lines although it was downregulated in trMCF, bsMCF and caMCF4 cells compared to the expression in the parental cell line MCF-10F. B) NRG1 mRNA expression: RNA was extracted from the cells and real time RT-PCR was performed and compared to the expression in MCF-10F. The averages ± standard errors are shown and the significant differences between cells grown without (regular media) or with 5-aza-dC (AZA) are indicated (*).
3.5. NRG1 methylation in human breast invasive carcinomas
NRG1 exon 1 methylation was study in invasive carcinomas (IC) and morphologically normal tissue adjacent to invasive carcinomas by methylation specific PCR (MSP) (Table 3). As it is indicated, it was not possible to include tumor and adjacent tissue samples from the same patients. As control, breast tissue samples adjacent to benign lesions were used as it was described (Table 3). We found that NRG1 exon 1 was partially methylated in 14 out of 17 (82.4%) invasive carcinomas although it was unmethylated in normal breast tissue (8 out of 10 normal breast samples). Furthermore, NRG1 exon 1 was partially methylated in 9 out of 14 (64.3%) morphologically normal tissue samples adjacent to IC (Table 3).
4. Discussion
Cancer progression models have become an invaluable tool for the study of genetic aberrations that correlate with a shift from a normal to a disease phenotype. In the present work, we used a human breast cancer progression model to study DNA methylation changes that occur during the transformation of breast epithelial cells with the idea to find biomarkers for an early detection of breast cancer. Using this model, we found that NRG1 was expressed by the normal human breast epithelial cells MCF-10F and transformed cells (trMCF) although it was downregulated at the invasive and tumorigenic stages (bsMCF and caMCF, respectively). DNA methylation studies showed that NRG1 was unmethylated in the normal and transformed cells becoming hypermethylated in the invasive and tumorigenic cells. Results presented here showed progressive methylation changes in NRG1 exon 1 in this breast cancer progression model. Furthermore, NRG1 exon 1 methylation was studied in normal human breast tissues and invasive breast carcinomas. We found that NRG1 exon 1 was partially methylated in a high percentage of human invasive carcinomas (IC) and morphologically normal tissue adjacent to IC although it was unmethylated in normal breast tissues.
Neuregulins are ligands for the ERBB human epidermal growth factor receptor (HER) family and they binds to ERBB-3 and/or ERBB-4 [23–25]. Loss of chromosome 8p, where NRG1 is located, is one of the most frequent genomic events reported in epithelial cancers including breast, colon, bladder and prostate. NRG1 has been proposed as the principal candidate tumor suppressor gene in this region [26–28]. The NRG1 gene is approximately 1.4 megabases long and as a consequence of alternative splicing and multiple promoters (possible nine) with the use of at least six transcription initiation sites [17,29] gives rise to the production of more than 15 protein variants [16,17,30]. The extraordinary diversity of the neuregulin signaling pathway is achieved by alternative splicing of this gene. NRG1 has been proposed both as candidate oncogene and as a tumor suppressor gene [31] and although they can be mitogens, they can also be pro-apoptotic proteins [32]. Also, neuregulins stimulate mammary epithelial growth and differentiation and, branching morphogenesis [33].
In the in vitro model of breast cancer progression, SNIP (SNAP-25- interacting protein) and CSS3 (chondroitin sulfate synthase 3 or CHSY2) expressions were lower at the invasive and tumor stages but progressive changes in the methylation status of their promoters were not detected by methylation PCR (MSP). Studies with the demethylated agent 5-aza-dC and the histone deacetylase inhibitor trichostatin, indicated that the lower SNIP expression in bsMCF and caMCF cells could be related to increase SNIP methylation and hypoacetylation of the bounded histones, making SNIP less accessible for its transcription. It has been showed that SNIP silencing increases cell spreading and migration in the normal breast MCF-10 cells (Di Stefano and Difilippi, unpublished data) [34]. CSS3 was partially methylated in all the cells although CSS3 promoter methylation seemed to increase in the invasive and tumorigenic stages. CSS3 is a glycosyltransferase involve in the biosynthesis of chondroitin sulfates (CS)-proteoglycans, molecules distributed on cell surfaces and in the extracellular matrix playing crucial roles in cell adhesion, morphogenesis and cell division [35]. The decreased SNIP and CSS3 levels could be related to the fibroblastic-like shape, decreased adhesion and increased motility and invasion capacity of the bsMCF and caMCF cells. In the in vitro model of breast cancer progression, STXBP6 (amysin) was downregulated in the transformed cells and increased its expression at the invasive and tumorigenic stages. Methylation studies showed that STXBP6 promoter was hypermethylated in all the cells of the model. STXBP6 binds components of the SNARE complex that has a central role in vesicle targeting and fusion in eukaryotic cells; it has been shown that epimorphin, one of the SNARE proteins, directs epithelial morphogenesis [36].
NRG1 exon 1 has a region located between −136 to +79 (considering +1, the translational initiation site) rich in CpG sites that was analyzed by methylation specific PCR (MSP). This region showed to be unmethylated in the immortal human breast MCF-10F and transformed cells (trMCF) but, hypermethylated in the invasive and tumorigenic cells (bsMCF and caMCF). These data indicated that NRG1 exon 1 is unmethylated in the parental MCF-10F and transformed trMCF cells, becoming hypermethylated in the invasive (bsMCF) and tumor (caMCF) stages. Furthermore, treatment with 5-aza-dC increased NRG1 expression in the invasive and tumorigenic stages supporting that this gene was hypermethylated at these stages. Interesting, although NRG1 was partially methylated and downregulated at the mRNA level, the protein was still present in bsMCF and caMCF cells although at lower level compared to MCF-10F.
The methylation status of NRG1 was also study in different breast cancer cells lines such as MCF-7, T47D, MDA-MB-231, MDA-MB-468, HS578T and BT-549. NRG1 was unmethylated in all the cells except in breast cancer cell line MDA-MB-468. The MDA-MB-468 cell line was isolated from a pleural effusion of a 51-year-old African American female patient with metastatic adenocarcinoma of the breast and this cell line produced tumors when it was inoculated in nude mice. Based on global gene expression analyses, breast cancer cell lines were classified into two major branches, luminal (MCF-7 and T47D) and basal [37,38]. Luminal cell lines display moderate to high expression of ERα and luminal cytokeratins [39]. The basal cell lines included the normal breast cell lines MCF-10A/F and the tumor cell lines MDA-MB-468, MDA-MB-231, HS578T and BT-549 [37]. The basal like carcinomas have a more aggressive clinical behavior [39].
NRG1 methylation was study in invasive carcinomas (IC) of the breast and morphologically normal tissue adjacent to IC. As control, breast tissue samples adjacent to benign breast lesions were used. We found that NRG1 exon 1 was partially methylated in 14 out of 17 (82.4%) IC and it was unmethylated in normal breast tissues (80% normal breast samples). Recently, it was shown that NRG1 was unmethylated in normal breast tissues and methylated in breast tumor samples [31] [40]. Although NRG1 was hypermethylated in the invasive bsMCF and tumorigenic caMCF cells, NRG1 protein was detected in these cells although at lower levels compared to the normal cell line MCF-10F. Raj et al (2000) have showed using immunohistochemistry, that advanced breast adenocarcinomas with absent or low levels of NRG-1α were associated with poorer prognosis [41].
In women with breast cancer, DNA methylation of the normal tissue adjacent to the tumor may be a marker for an increased risk of local recurrence. Since the density of DNA methylation has been shown to increase progressively during neoplastic transformation from premalignant lesions to invasive cancers, frequent promoter hypermethylation of tumor suppressor loci in normal breast tissue is a harbinger for local recurrence. In order to determine if NRG1 methylation was an early event manifested even before the morphological changes in the ductal cells occur, we have analyzed the normal breast tissue adjacent to invasive carcinomas. We found that NRG1 exon 1 was partially methylated in a high percentage of morphologically normal breast tissue adjacent to invasive carcinomas (9 out of 14 samples; 64.3%).
Altogether our data indicate that NRG1 exon 1 is methylated during the progressive stages of transformation in human breast epithelial cells. Importantly, the finding that the normal structures of the breast have NRG1 exon 1 partially methylated although the absence of histological or cytological abnormality, points to the use of this gene as a marker of neoplasia.
Acknowledgments
This work was supported by grant R21 ES015148 from the National Institute Environmental Health Sciences. The quantifications of the Western blots were done in collaboration of Dr Xin-Ming Li from the Proteomic Facility at FCCC.
Footnotes
Publisher's Disclaimer: This is a PDF file of an unedited manuscript that has been accepted for publication. As a service to our customers we are providing this early version of the manuscript. The manuscript will undergo copyediting, typesetting, and review of the resulting proof before it is published in its final citable form. Please note that during the production process errors may be discovered which could affect the content, and all legal disclaimers that apply to the journal pertain.
References
- 1.Henderson BE, Ross RK, Pike MC. Toward the primary prevention of cancer. Science. 1991;254:1131–1138. doi: 10.1126/science.1957166. [DOI] [PubMed] [Google Scholar]
- 2.Bernstein L, Ross RK. Endogenous hormones and breast cancer risk. Epidemiol Rev. 1993;15:48–65. doi: 10.1093/oxfordjournals.epirev.a036116. [DOI] [PubMed] [Google Scholar]
- 3.Beral V. Breast cancer and hormone-replacement therapy in the Million Women Study. Lancet. 2003;362:419–427. doi: 10.1016/s0140-6736(03)14065-2. [DOI] [PubMed] [Google Scholar]
- 4.Chlebowski RT, Hendrix SL, Langer RD, Stefanick ML, Gass M, Lane D, Rodabough RJ, Gilligan MA, Cyr MG, Thomson CA, Khandekar J, Petrovitch H, McTiernan A. Influence of estrogen plus progestin on breast cancer and mammography in healthy postmenopausal women: the Women's Health Initiative Randomized Trial. Jama. 2003;289:3243–3253. doi: 10.1001/jama.289.24.3243. [DOI] [PubMed] [Google Scholar]
- 5.Li CI, Malone KE, Porter PL, Weiss NS, Tang MT, Cushing-Haugen KL, Daling JR. Relationship between long durations and different regimens of hormone therapy and risk of breast cancer. Jama. 2003;289:3254–3263. doi: 10.1001/jama.289.24.3254. [DOI] [PubMed] [Google Scholar]
- 6.Russo J, Fernandez SV, Russo PA, Fernbaugh R, Sheriff FS, Lareef HM, Garber J, Russo IH. 17-Beta-estradiol induces transformation and tumorigenesis in human breast epithelial cells. FASEB J. 2006;20:1622–1634. doi: 10.1096/fj.05-5399com. [DOI] [PubMed] [Google Scholar]
- 7.Huang Y, Fernandez SV, Goodwin S, Russo PA, Russo IH, Sutter TR, Russo J. Epithelial to mesenchymal transition in human breast epithelial cells transformed by 17beta-estradiol. Cancer Res. 2007;67:11147–11157. doi: 10.1158/0008-5472.CAN-07-1371. [DOI] [PubMed] [Google Scholar]
- 8.O'Connell P. Genetic and cytogenetic analyses of breast cancer yield different perspectives of a complex disease. Breast Cancer Res Treat. 2003;78:347–357. doi: 10.1023/a:1023037925950. [DOI] [PubMed] [Google Scholar]
- 9.Jones PA, Baylin SB. The fundamental role of epigenetic events in cancer. Nat Rev Genet. 2002;3:415–428. doi: 10.1038/nrg816. [DOI] [PubMed] [Google Scholar]
- 10.Gardiner-Garden M, Frommer M. CpG islands in vertebrate genomes. J Mol Biol. 1987;196:261–282. doi: 10.1016/0022-2836(87)90689-9. [DOI] [PubMed] [Google Scholar]
- 11.Kondo Y, Shen L, Yan PS, Huang TH, Issa JP. Chromatin immunoprecipitation microarrays for identification of genes silenced by histone H3 lysine 9 methylation. Proc Natl Acad Sci U S A. 2004;101:7398–7403. doi: 10.1073/pnas.0306641101. [DOI] [PMC free article] [PubMed] [Google Scholar]
- 12.Bender CM, Zingg JM, Jones PA. DNA methylation as a target for drug design. Pharm Res. 1998;15:175–187. doi: 10.1023/a:1011946030404. [DOI] [PubMed] [Google Scholar]
- 13.Jones PA, Taylor SM. Cellular differentiation, cytidine analogs and DNA methylation. Cell. 1980;20:85–93. doi: 10.1016/0092-8674(80)90237-8. [DOI] [PubMed] [Google Scholar]
- 14.Johnstone RW. Histone-deacetylase inhibitors: novel drugs for the treatment of cancer. Nat Rev Drug Discov. 2002;1:287–299. doi: 10.1038/nrd772. [DOI] [PubMed] [Google Scholar]
- 15.Marks PA, Richon VM, Breslow R, Rifkind RA. Histone deacetylase inhibitors as new cancer drugs. Curr Opin Oncol. 2001;13:477–483. doi: 10.1097/00001622-200111000-00010. [DOI] [PubMed] [Google Scholar]
- 16.Falls DL. Neuregulins: functions, forms, and signaling strategies. Exp Cell Res. 2003;284:14–30. doi: 10.1016/s0014-4827(02)00102-7. [DOI] [PubMed] [Google Scholar]
- 17.Steinthorsdottir V, Stefansson H, Ghosh S, Birgisdottir B, Bjornsdottir S, Fasquel AC, Olafsson O, Stefansson K, Gulcher JR. Multiple novel transcription initiation sites for NRG1. Gene. 2004;342:97–105. doi: 10.1016/j.gene.2004.07.029. [DOI] [PubMed] [Google Scholar]
- 18.Tiezzi DG, Fernandez SV, Russo J. Epithelial mesenchymal transition during the neoplastic transformation of human breast epithelial cells by estrogen. Int J Oncol. 2007;31:823–827. [PubMed] [Google Scholar]
- 19.Herman JG, Graff JR, Myohanen S, Nelkin BD, Baylin SB. Methylation-specific PCR: a novel PCR assay for methylation status of CpG islands. Proc Natl Acad Sci U S A. 1996;93:9821–9826. doi: 10.1073/pnas.93.18.9821. [DOI] [PMC free article] [PubMed] [Google Scholar]
- 20.Fernandez SV, Russo J. Estrogen and Xenoestrogens in Breast Cancer. Toxicol Pathol. 2009 doi: 10.1177/0192623309354108. [DOI] [PMC free article] [PubMed] [Google Scholar]
- 21.Smiraglia DJ, Plass C. The study of aberrant methylation in cancer via restriction landmark genomic scanning. Oncogene. 2002;21:5414–5426. doi: 10.1038/sj.onc.1205608. [DOI] [PubMed] [Google Scholar]
- 22.Grunau C, Clark SJ, Rosenthal A. Bisulfite genomic sequencing: systematic investigation of critical experimental parameters. Nucleic Acids Res. 2001;29 doi: 10.1093/nar/29.13.e65. E65-65. [DOI] [PMC free article] [PubMed] [Google Scholar]
- 23.Sliwkowski MX, Schaefer G, Akita RW, Lofgren JA, Fitzpatrick VD, Nuijens A, Fendly BM, Cerione RA, Vandlen RL, Carraway KL., 3rd Coexpression of erbB2 and erbB3 proteins reconstitutes a high affinity receptor for heregulin. J Biol Chem. 1994;269:14661–14665. [PubMed] [Google Scholar]
- 24.Tzahar E, Levkowitz G, Karunagaran D, Yi L, Peles E, Lavi S, Chang D, Liu N, Yayon A, Wen D, et al. ErbB-3 and ErbB-4 function as the respective low and high affinity receptors of all Neu differentiation factor/heregulin isoforms. J Biol Chem. 1994;269:25226–25233. [PubMed] [Google Scholar]
- 25.Riese DJ, 2nd, van Raaij TM, Plowman GD, Andrews GC, Stern DF. The cellular response to neuregulins is governed by complex interactions of the erbB receptor family. Mol Cell Biol. 1995;15:5770–5776. doi: 10.1128/mcb.15.10.5770. [DOI] [PMC free article] [PubMed] [Google Scholar]
- 26.Huang HE, Chin SF, Ginestier C, Bardou VJ, Adelaide J, Iyer NG, Garcia MJ, Pole JC, Callagy GM, Hewitt SM, Gullick WJ, Jacquemier J, Caldas C, Chaffanet M, Birnbaum D, Edwards PA. A recurrent chromosome breakpoint in breast cancer at the NRG1/neuregulin 1/heregulin gene. Cancer Res. 2004;64:6840–6844. doi: 10.1158/0008-5472.CAN-04-1762. [DOI] [PubMed] [Google Scholar]
- 27.Pole JC, Courtay-Cahen C, Garcia MJ, Blood KA, Cooke SL, Alsop AE, Tse DM, Caldas C, Edwards PA. High-resolution analysis of chromosome rearrangements on 8p in breast, colon and pancreatic cancer reveals a complex pattern of loss, gain and translocation. Oncogene. 2006;25:5693–5706. doi: 10.1038/sj.onc.1209570. [DOI] [PubMed] [Google Scholar]
- 28.Birnbaum D, Adelaide J, Popovici C, Charafe-Jauffret E, Mozziconacci MJ, Chaffanet M. Chromosome arm 8p and cancer: a fragile hypothesis. Lancet Oncol. 2003;4:639–642. doi: 10.1016/s1470-2045(03)01225-7. [DOI] [PubMed] [Google Scholar]
- 29.Stein RA, Staros JV. Insights into the evolution of the ErbB receptor family and their ligands from sequence analysis. BMC Evol Biol. 2006;6:79. doi: 10.1186/1471-2148-6-79. [DOI] [PMC free article] [PubMed] [Google Scholar]
- 30.Hayes NV, Gullick WJ. The neuregulin family of genes and their multiple splice variants in breast cancer. J Mammary Gland Biol Neoplasia. 2008;13:205–214. doi: 10.1007/s10911-008-9078-4. [DOI] [PubMed] [Google Scholar]
- 31.Chua Y, Paw E. The NEUREGULIN1 gene and breast cancer. Breast Cancer Res. 2006;8 Suppl 2:5. [Google Scholar]
- 32.Weinstein EJ, Grimm S, Leder P. The oncogene heregulin induces apoptosis in breast epithelial cells and tumors. Oncogene. 1998;17:2107–2113. doi: 10.1038/sj.onc.1202428. [DOI] [PubMed] [Google Scholar]
- 33.Offterdinger M, Schneider SM, Grunt TW. Heregulin and retinoids synergistically induce branching morphogenesis of breast cancer cells cultivated in 3D collagen gels. J Cell Physiol. 2003;195:260–275. doi: 10.1002/jcp.10237. [DOI] [PubMed] [Google Scholar]
- 34.Di Stefano P, Damiano L, Cabodi S, Aramu S, Tordella L, Praduroux A, Piva R, Cavallo F, Forni G, Silengo L, Tarone G, Turco E, Defilippi P. p140Cap protein suppresses tumour cell properties, regulating Csk and Src kinase activity. EMBO J. 2007;26:2843–2855. doi: 10.1038/sj.emboj.7601724. [DOI] [PMC free article] [PubMed] [Google Scholar]
- 35.Schwartz NB, Domowicz M. Chondrodysplasias due to proteoglycan defects. Glycobiology. 2002;12 doi: 10.1093/glycob/12.4.57r. 57R–68R. [DOI] [PubMed] [Google Scholar]
- 36.Hirai Y, Lochter A, Galosy S, Koshida S, Niwa S, Bissell MJ. Epimorphin functions as a key morphoregulator for mammary epithelial cells. J Cell Biol. 1998;140:159–169. doi: 10.1083/jcb.140.1.159. [DOI] [PMC free article] [PubMed] [Google Scholar]
- 37.Neve RM, Chin K, Fridlyand J, Yeh J, Baehner FL, Fevr T, Clark L, Bayani N, Coppe JP, Tong F, Speed T, Spellman PT, DeVries S, Lapuk A, Wang NJ, Kuo WL, Stilwell JL, Pinkel D, Albertson DG, Waldman FM, McCormick F, Dickson RB, Johnson MD, Lippman M, Ethier S, Gazdar A, Gray JW. A collection of breast cancer cell lines for the study of functionally distinct cancer subtypes. Cancer Cell. 2006;10:515–527. doi: 10.1016/j.ccr.2006.10.008. [DOI] [PMC free article] [PubMed] [Google Scholar]
- 38.Kenny PA, Lee GY, Myers CA, Neve RM, Semeiks JR, Spellman PT, Lorenz K, Lee EH, Barcellos-Hoff MH, Petersen OW, Gray JW, Bissell MJ. The morphologies of breast cancer cell lines in three-dimensional assays correlate with their profiles of gene expression. Mol Oncol. 2007;1:84–96. doi: 10.1016/j.molonc.2007.02.004. [DOI] [PMC free article] [PubMed] [Google Scholar]
- 39.Charafe-Jauffret E, Ginestier C, Monville F, Finetti P, Adelaide J, Cervera N, Fekairi S, Xerri L, Jacquemier J, Birnbaum D, Bertucci F. Gene expression profiling of breast cell lines identifies potential new basal markers. Oncogene. 2006;25:2273–2284. doi: 10.1038/sj.onc.1209254. [DOI] [PubMed] [Google Scholar]
- 40.Chua YL, Pole JCM, Chin S-F, Ellis IO, Caldas C, O'Hare MJ, Murrell AM, Edwards P. NRG1 is frequently silenced by methylation in breast cancer and is strong candidate for the 8p tumor suppressor gene. Breast Cancer Res. 2008;10 Suppl 2:11. doi: 10.1038/onc.2009.259. [DOI] [PMC free article] [PubMed] [Google Scholar]
- 41.Raj EH, Skinner A, Mahji U, Nirmala KN, Ravichandran K, Shanta V, Hurst HC, Gullick WJ, Rajkumar T. Neuregulin 1-alpha expression in locally advanced breast cancer. Breast. 2001;10:41–45. doi: 10.1054/brst.2000.0182. [DOI] [PubMed] [Google Scholar]