

SUMMARY
Objective
The amygdalae have been a focus of mood disorder research due to their key role in processing emotional information. It has been long known that depressed individuals demonstrate impaired functional performance while engaged in emotional tasks. The structural basis for these functional differences has been investigated via volumetric analysis with mixed findings. In this study, we examined the morphometric basis for these functional changes in late-life depression (LLD) by analyzing both the size and shape of the amygdalae with the hypothesis that shape differences may be apparent even when overall volume differences are inconsistent.
Methods
Magnetic resonance imaging data were acquired from 11 healthy, elderly individuals and 14 depressed, elderly individuals. Amygdalar size was quantified by computing total volume and amygdalar shape was quantified with a shape analysis method that we have developed.
Results
No significant volumetric differences were found for either amygdala. Nevertheless, localized regions of significant shape variation were detected for the left and right amygdalae. The most significant difference was contraction (LLD subjects as compared to control subjects) in a region typically associated with the basolateral nucleus, which plays a key role in emotion recognition in neurobiologic models of depression.
Conclusions
In this LLD study, we have shown that, despite insignificant amygdalar volumetric findings, variations of amygdalar shape can be detected and localized. With further investigation, morphometric analysis of various brain structures may help elucidate the neurobiology associated with LLD and other mood disorders.
Keywords: morphometry, late-life depression, amygdala, shape analysis, volumetrics
INTRODUCTION
Depression is a widespread psychiatric illness that affects a large portion of the elderly population. It is estimated that 10–15% of the US elderly population (Kaplan and Sadock, 1998) are affected by depressive symptoms. Individuals suffering from late-life depression (LLD) exhibit common depressive symptoms such as prolonged changes in mood and behavior, and are likely to become cognitively impaired (Butters et al., in press). Ever since the pioneering amygdalar lesion work of Kluver and Bucy (1939) demonstrated the role of the amygdalae’s affect on mood, the amygdalae have been a focus of depression research due to their key role in integrating emotional meaning with perception and experience.
Observations of the amygdalae’s functional role in mood disorders have been quantified and verified in electrophysiological (e.g. electroencephalography and magnetoencephalography) and neuroimaging (e.g. functional magnetic resonance imaging and positron emission tomography) studies. Some mood disorder researchers have utilized structural magnetic resonance imaging (MRI) to investigate the anatomical basis for these functional observations by measuring changes in amygdalar size. Results from these studies, however, have been variable and inconclusive. For example, there are reports of: (1) increased amygdalar volume in major depression (Frodl et al., 2002, 2003; Lange and Irle, 2004), bipolar disorder (Altshuler et al., 1998), first-episode nonschizophrenic psychosis (Velakoulis et al., 2006), and generalized anxiety disorder (Bellis et al., 2000); (2) decreased amygdalar volume in depression (Hastings et al., 2004), mild dementia (Hensel et al., 2005), depression with psychosis (Keller et al., 2008), unipolar pediatric depression, and a unilateral volume decrease in the left amygdala in depression with memory problems (Gunten et al., 2000) and a unilateral volume decrease in the right amygdala with major depression (Xia et al., 2004); and (3) no change in amygdalar volume in major depression (Bremner et al., 2000; Mervaala et al., 2000; Munn et al., 2007), questionable dementia (Hensel et al., 2005; Rosso et al., 2005), recurrent major depression (Sheline et al., 1998), and depression without psychosis (Keller et al., 2008). A compilation of findings from amygdalar volumetric studies is summarized in Table 1 to document the range of these inconsistent findings. Also summarized in Table 1 are the MRI parameters, amygdalar segmentation protocol, number of subjects, and age of subjects used for each study.
Table 1.
Summary of published total amygdalae volumetric results in mood disorder research (elderly studies shown in bold)
| Study | Mood disorder | Diff/Side1 | MRI Properties2 | Seg Method3 | N4 |
|---|---|---|---|---|---|
| (Frodl et al., 2002) | Major depression | +/B | 1.5T/1.5 mm | (Convit et al., 1999) | 34F/26M 40.3 (12.6)/40.6 (12.5) |
| (Lange and Irle, 2004) | Major depression | +/B | 1.5T/1.3 mm | (Pruessner et al., 2000) | 34F 34 (10)/32 (6) |
| (Xia et al., 2004) | Major depression | -/R | 1.5T/1.2 mm | NA | 18F/17M 39.5 (12)/35.4 (8.9) |
| (Hastings et al., 2004) | Major depression | -/B | 1.5T/1.5 mm | (Sheline, 1998) | 20F/16M 38.9 (11.4)/34.8 (13.6) |
| (Bremner et al., 2000) | Major depression | Ø/B | 1.5T/3 mm | (Bremner et al., 1995) | 12F/20M 43 (8)/45 (10) |
| (Mervaala et al., 2000) | Major depression | Ø/B | 1.5T/3 mm | (Watson et al., 1992) | 29F/22M 42.2 (12.2)/42.1 (14.6) |
| (Munn et al., 2007) | Major depression | Ø/B | 1.5T/1 mm | (Munn et al., 2007) | 44F 20.54 (1.75) |
| (Keller et al., 2008) | Depression without psychosis | Ø/B | 3T/1.5 mm | (Kates et al., 1997) | 22F/23M 36.6 (11.9)/32.2 (11.5) |
| (Keller et al., 2008) | Depression with psychosis | -/B | 3T/1.5 mm | (Kates et al., 1997) | 22F/23M 36.5 (13.2)/32.2 (11.5) |
| (Rosso et al., 2005) | Pediatric depression | -/B | 1.5T/3 mm | (McCarley and Shenton, 2008) | 23F/11M 15.35 (.34)/14.08 (.31) |
| (Gunten et al., 2000) | Depression with memory problems | -/L | 1.5T/1.5 mm | (Gunten et al., 2000) | 16F/12M 57.6 (NA)/58.1 (NA) |
| (Sheline, 1998) | Recurrent major depression | Ø/B | 1.5T/1.25 mm | (Sheline, 1998) | 40F 53 (17)/54 (18) |
| (Hensel et al., 2005) | Mild dementia | /B | 1.5T/1.5 mm | (Watson et al., 1992) | 37F/27M 78.4 (3.2)/79 (3.5) |
| (Hensel et al., 2005) | Questionable dementia | Ø/B | 1.5T/1.5 mm | (Watson et al., 1992) | 48F/25M 79.8 (3.1)/79 (3.5) |
| (Altshuler et al., 1998) | Bipolar disorder | +/B | 1.5T/1.4 mm | (Altshuler et al., 1998) | 30FM 50.8 (13.3)/53.4 (11.1) |
| (Velakoulis et al., 2006) | First-episode psychosis | +/B | 1.5T/1.5 mm | (Convit et al., 1999) | 86F/163M 21.5 (3.4)/26.9 (10) |
| (Bellis et al., 2000) | Generalized Anxiety disorder | +/B | 1.5T/1.5 mm | (Giedd et al., 1996) | 15F/21M 12.7 (2.4)/12.5 (2.3) |
Total amygdalar volume differences are reported as mood disorder relative to control. The ‘+’ denotes an increase in size, ‘-’ denotes a decrease in size, and ‘Ø’ denotes no change in size. B denotes a bilateral difference and L denotes a unilateral difference for the left amygdala.
The MRI properties reported here are MRI magnet strength (Tesla, T) followed by slice thickness in mm.
Reference to the segmentation protocol used to manually delineate the amygdalae.
The total number of subjects included in the study followed by mean age (standard deviation) for mood disorder followed by control subjects.
Several reasons may help explain these mixed results. The most critical factor in measuring the volume of the amygdalae is the precision of segmenting the amygdalae, which in turn depends on the definition of the amygdalae itself. The boundary delineation of the amygdalae is still debated amongst neuroscientists and is variable from study to study. Therefore, volumetric analysis is dependent on the particular delineation protocol used for segmentation. Factors to be considered in the delineation protocol include the separation of the amygdalae from surrounding tissue such as the hippocampus. Other factors that may affect volume measures include image quality, brain/head size normalization, and inter- and intra-rater reliability of manual segmentation. Aside from segmentation precision, demographic and clinical variables such as age, number of depressive episodes, depression history, substance abuse, childhood trauma, etc. should be taken into consideration as independent confounding variables during statistical analysis.
Additionally, we believe that reported volumetric discrepancies might be due to an inherent limitation in gross size measures. As an alternative to using only size as a morphologic measure, we believe that shape could provide better specificity by localizing regions affected by a pathophysiologic presence, which may be used to link local structure variation to other measures. In this study, we investigate morphometry (size and shape) to test the hypothesis that shape differences may be apparent even when overall volume differences are inconsistent. To our knowledge no studies have investigated the morphometry of the amygdalae in LLD. To assess amygdalae shape variation, we have developed an analysis method based on the work of Thompson et al. (2004) for quantifying local structural differences with the goal of isolating specific regions of surface deformations. Even though the focus of our study is on the amygdalae, our method may be applied to other brain structures. Our method relies on first tessellating the surface of a manually delineated structure. The distance from each surface point to the medial manifold is calculated for each subject. To calculate the medial manifold, we use an algorithm employing a framework called Shells and Spheres (Cois et al., 2006), which links surface points to the medial manifold without making any assumptions about the structure of interest. Distance measures for corresponding surface points across subject groups are compared via permutation testing, which yields a statistical map consisting of p-values at each surface point with low p-values indicative of significant differences in distance measures. The surface map thus allows for visualizing local structure variation that can potentially be related to underlying neuroanatomy and clinical variables for a better understanding of LLD neuropathology.
METHODS
Subject Characteristics
To investigate amygdalar morphometry in LLD, MRI data were acquired from LLD diagnosed patients and healthy elderly controls. A total of 25 subjects were included in this study and they all gave informed consent prior to participation in this study. All but one of the participating subjects were right-handed. Each subject received a Structured Clinical Interview for DSM-IV (SCID-IV) evaluation, which were reviewed in a diagnostic consensus conference. Exclusion criteria included all Axis I psychiatric disorders except for major depressive disorder and anxiety disorders. Subjects were also excluded for a history of stroke or significant head injury, dementia, Alzheimer’s disease, Parkinson’s disease, or Huntington’s disease. Subjects with co-morbid anxiety disorders were included due to the high prevalence (48%) of anxiety disorders in subjects with LLD (Beekman et al., 2000). Cognitive status of the subjects was assessed using the Mattis Dementia Scale (MDS). See Table 2 for MDS scores and other demographic information.
Table 2.
Demographic and clinical information for participants in this research study. Data presented as mean (standard deviation)
| Diagnosis | N | Gender | Age | MMSE | Hamilton | Mattis |
|---|---|---|---|---|---|---|
| Control | 11 | 4F/7M | 67.2 (6.8) | 29 (1.4) | 2.2 (1.7) | 140.2 (3.6) |
| LLD | 14 | 5F/9M | 69.8 (5.1) | 28.7 (1.6) | 13.8 (4.2) | 137 (4.4) |
The LLD subject group consisted of 14 elderly patients; nine males and five females with an average age of 69.8 ± 5.1 years (mean ± SD). Each of these individuals diagnosed with LLD had a history of being medicated with an antidepressant. The control group consisted of 11 healthy elderly subjects; seven males and four females with an average age of 67.2 ± 6.8 years. These subjects presented with no clinical ± symptoms of LLD and did not meet any of the exclusion criteria.
MRI data acquisition
Each subject in the study had his or her head scanned using the same MRI scanning protocol, which was approved by the internal review board at the University of Pittsburgh. High resolution, 3D data were acquired on a 1.5 Tesla Signa Scanner (General Electrics Medial Systems, Milwaukee, WI) full body scanner. A spoiled GRASS imaging sequence was used with the following acquisition parameters: TR/TE = 5/25 ms, flip angle = 40°, and FOV = 24 × 18 cm. Images were acquired with the subject in the prone position and had a resolution of 0.9375 × 0.9375 mm in the axial plane and 1.5 mm in the interslice dimension.
Segmentation and image processing
For our morphometric analysis, both left and right amygdala were manually segmented from each subject’s MRI scan. All images were initially aligned to the same orientation with the AC-PC (anterior commisure-posterior commisure) alignment routine (rigid body, landmark-based transformation) available in the Automated Functional NeuroImaging (Cox, 1996) software suite. Following AC-PC alignment, a trained person manually delineated the boundaries of each amygdala following a protocol in which adequate intra- and inter-rater reliability has been previously established (Siegle et al., 2002) (posterior boundary: the alveus of the hippocampus; anterior boundary: 2 mm from the temporal horn of the lateral ventrical; superior boundary: ventral horn of the sub-arachnoid space (SS); inferior boundary: most dorsal finger of the white matter tract under the horn of the SS; lateral boundary: 2 mm from the surrounding white matter; mesial: 2 mm from the SS). The tracer performing the manual segmentations was blind to the group status for each subject. To avoid revealing group status to the tracer, images were made anonymous by removing demographic information from image headers. Image filenames were encoded with a string of numbers and the linkage between the filename and demographic information was kept from the tracer. Shown in Figures 1A—C is an example amygdala segmentation rendered as a 3D surface model and overlaid on cross-sections of the corresponding MRI image. Segmentations of each subject’s amygdalae were saved as a binary image and bisected into separate images such that the left and right amygdala could be analyzed independently. Amygdalar volumes were measured by counting the number of voxels within the delineated region.
Figure 1.

A. Coronal, B. axial, and C. orthogonal cross-sections of a subject’s MRI image are shown with 3D renderings of the segmented amygdala. D. A mesh tessellated from the amygdalar segmentation (the color coding is described in the Results section)
Shape analysis
To correct for brain size variability, each subject image was registered to a reference image with a mean squares intensity metric. To prepare the images for size normalization, the brain was separated from extraneous tissue with the Brain Extraction Tool (Smith, 2002). Intensity correction was unnecessary since all subject images were acquired with the same MRI scanner sequence and differences in field strength were negligible. Registration was performed with an isotropic scale transform to preserve amygdalar shape. The transform matrix computed for each subject image was then applied to the subject’s amygdalae segmentations. Implementation of the image registration was performed with software that we developed utilizing the Insight Toolkit (ITK) (Yoo, 2004).
The method of shape analysis developed by Thompson et al. (2004) relies on generating parametric surface meshes for each segmented structure, calculating the distance from each surface point to the medial manifold, and comparing distance measures, between groups, at each corresponding surface point. Significant group differences are then translated to a statistical map consisting of p-values at each surface point with a low p-value indicative of an appreciable inter-group difference. Our implementation of each of these steps is detailed below.
Surface tessellation
In Thompson et al. (2004), a surface mesh is parametrically defined with a fixed number of vertices. The mesh is then warped to match the surface of each amygdala, where each amygdalar segmentation has been previously mapped to a stereotaxic space to establish mesh correspondences. In our method, the surface of each segmented amygdala was tessellated using ITK’s implementation of the marching cubes algorithm resulting in triangular meshes with a variable number of vertices and cells. A mesh generated from a subject amygdala segmentation is shown in Figure 1D with colors indicating statistical measures of local, inter-group structural differences (further explained in Results section). Surface point correspondences were determined using an iterative closest point algorithm and thus did not require the segmented images to be mapped to stereotaxic space.
Computing medial distance maps
The next step of the method requires computing, at each surface point, the medial distance, which is defined as the shortest Euclidean distance from a surface point to the medial manifold. We use the term medial distance map to refer to a mesh with medial distances stored at the vertices corresponding to the location of the surface point used to compute the medial distance. The medial manifold is comprised of the locus of points extending along the center of the object of interest such that the points are equidistant to at least two object boundaries. Many methods exist for extracting the medial manifold of an object. In this study, we developed an algorithm based on a framework called Shells and Spheres (Cois et al., 2006). Advantages of using the Shells and Spheres framework are points along the medial manifold are automatically linked to their respective boundary points making the medial distance from boundary points trivial to compute and that it does not make assumptions about the structure of interest.
Group comparison of medial distance maps
Medial distances calculated for each subject’s amygdalae were stored, as already described, in the respective subject’s meshes resulting in a medial distance map for each amygdala. For the amygdalae in each subject group, the point-wise mean and SD of the medial distance maps were calculated. A t-statistic (unpaired t-test with unequal means and unequal variances) is calculated to compare the average medial distance between subject groups. The terms contraction and expansion denote, respectively, a lower and higher average medial distance for one group as compared to the opposing group. Throughout the remainder of this article, LLD subjects are compared relative to control subjects, e.g. contraction indicates a lower average medial distance for the LLD subjects as compared relative to the control subjects. Statistical maps were generated with permutation testing to correct for Type I error at each surface point to indicate significant regions of localized structural differences. The permutation test measures the distribution that would be observed if subjects were randomly assigned to a group. The computed test statistics are then compared, as a ratio, to the test statistics computed with subjects assigned to the correct group. This ratio is the chance of the observed test statistic occurring by accident, which provides a corrected p-value at each surface point if a very large number of permutations are permitted. In future work we will adapt techniques, e.g. Forman et al. (1995) and Thompson et al. (2004) to restrict significance to larger spatially contiguous clusters of significant morphological group differences.
RESULTS
Volumetric analysis was performed on both amygdalae of the subject groups by counting the number of segmented voxels. The volume mean and standard deviation are reported for the left and right amygdala of the subject groups in Table 3. A two-tailed t-test statistic was computed between groups to arrive at a p-value.At the p < 0.05 significance level there was no significant volumetric difference for either amygdala, although there was a statistical trend toward significance for volume decrease in the left amygdala of the LLD group (p = 0.07).
Table 3.
Amygdalar volumes measured for the right (R.) and left (L.) amygdala for each subject group and p-values (unpaired, two-tailed t-test with unequal variances) computed for each categorical group
| Group | Volume (mean ± SD, voxels) | p-value |
|---|---|---|
| R. (Control) | 1553 ± 293 | 0.40 |
| R. (Patient) | 1433 ± 404 | |
| L. (Control) | 1547 ± 329 | 0.07 |
| L. (Patient) | 1295 ±325 |
Statistical maps were generated with 1 million permutations to correct for Type I error at each surface point. The statistical maps indicate regions of structural differences in LLD subjects relative to control subjects with low p-values indicating regions of considerable structural differences. The statistical maps for each amygdala are shown in Figure 2 as surface renderings of the reference amygdalar meshes with p-values interpolated between vertices. Final p-values are color-coded from 0 to 1 with significant (p < 0.05) contraction shown as bright red and significant expansion shown as magenta (circled). Recall that LLD subjects are compared relative to control subjects and thus contraction/expansion indicates a lower/higher average medial distance for the LLD subjects as compared relative to the control subjects. The entire range of p-values for expansion and contraction are included to illustrate any trend toward significance. As can be seen in each view there are isolated regions of shape variation. The p-values were thresholded at 0.05 on the statistical map for illustrative purposes and it shown in Figure 3 with red regions indicating contraction, blue regions (circled) indicating expansion, and green regions indicating no statistical difference between LLD and control subjects. The most prominent structural change was contraction occurring at the anterior portion of the amygdala. Histological studies typically associate this region with the basolateral nuclei, e.g, Sah et al. (2003).
Figure 2.
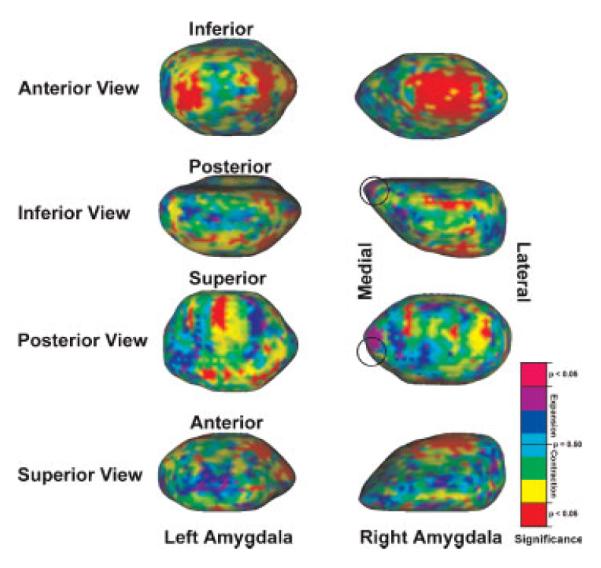
Amygdalar statistical maps with p-values indicating structural differences between the LLD group and the healthy control group rendered on reference amygdalae. Bright red indicates significant contraction and magenta (circled) indicates significant expansion
Figure 3.
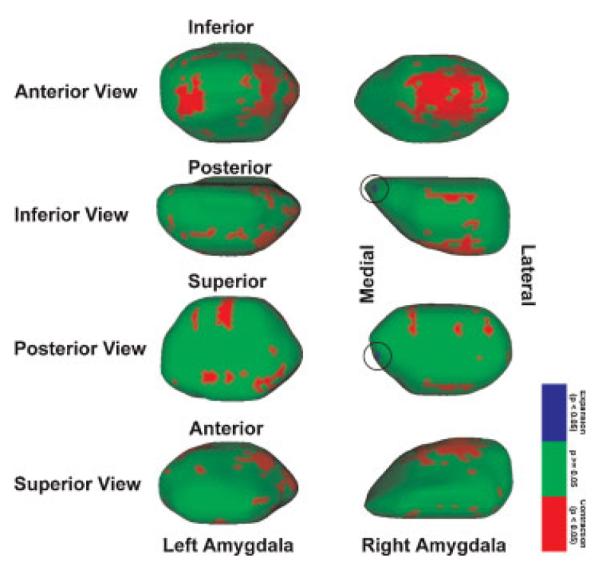
Surface meshes shown with thresholded p-values that indicate significant contraction (red) and expansion (blue, circled) rendered on reference amygdala. Green indicates regions in which the difference is not statistically significant. The large regions of expansion shown in the anterior view are typically associated with the basolateral nuclei
DISCUSSION
The present study investigated amygdalar morphometry (size and shape) of elderly individuals diagnosed with major depression. Previous studies have examined volumetric differences in LLD, but to our knowledge this is the first study to also examine amygdalar shape variation in LLD. Our results suggest that the size of the amygdalae in depressed, elderly individuals do not undergo significant changes as compared to healthy, elderly individuals. This is in agreement with some previous studies in major depression (Bremner et al., 2000; Mervaala et al., 2000; Munn et al., 2007), questionable dementia (Hensel et al., 2005), recurrent major depression (Sheline et al., 1998), and depression without psychosis (Keller et al., 2008). We also found a trend towards unilateral decreased volume in the left amygdala, which has been observed in depression with memory problems (Gunten et al., 2000). However, our volumetric results differ from other mood disorder studies that have found amygdalar volumetric differences (increases and decreases), e.g. (Altshuler et al., 1998; Bellis et al., 2000; Frodl et al., 2002; Frodl et al., 2003; Hastings et al., 2004; Lange and Irle, 2004; Xia et al., 2004; Hensel et al., 2005; Rosso et al., 2005; Velakoulis et al., 2006; Keller et al., 2008).
Mixed amygdalar volumetric findings may be explained by a variety of technical factors including differences in MRI image resolution, diagnosis heterogeneity, neuroanatomical amygdalae definition, amygdalae boundary delineation protocol, head and/or brain size normalization, etc. Additionally, demographic and clinical variables should be considered as covariates during statistical analysis. Demographic and clinical variables to be considered include, but are not limited to age, gender, education, medication usage, illness duration and course, substance abuse, history of physical or emotional abuse, etc. Moreover, the co-occurence of other medical conditions should probably also be considered such as the presence of vascular lesions, white matter hyperintensities, diabetes, cortisol dysregulation, etc. These factors could contribute to the differing amygdalar volumetric results in mood disorder studies.
A variety of amygdalar volumetric studies have identified variables that are correlated with volume changes, but, again, the findings remain mixed. Another potential cause of these inconsistencies may be the non-differentiation between the various sub-types of depression. For example, among the previous studies, fewer than half focused on major depression and none of those focused on the elderly. The only study focused on the elderly subjects was a dementia study conducted by Hensel et al. (2005). Therefore, we believe that without fully accounting for deviations in technical protocol, and fully controlling and exploring demographics and clinical variables, it would be unwise to directly compare our volumetric results to those of other studies.
We believe that, in addition to various technical, clinical and demographic factors, reported volumetric discrepancies might partly be due to an inherent limitation in considering a gross measure of size. Shape analysis provides for better specificity over volume delivering a spatial map of localized regions affected by a pathology, which may be used to link local structural differences to other measures. Several published research studies have investigated shape variation in other structures believed to be complicit in psychiatric illnesses. Thompson et al. (2004) developed an analytical method to quantify the progression of hippocampal and ventricular change in Alzheimer’s disease (AD), finding that temporal horn expansion was a strong indication of AD progression. Shen et al. (2005) studied hippocampal shape differences in mild cognitive impairment and found that structural changes are primarily located in the anterior right hippocampus and posterior left hippocampus. Styner et al. (2005) studied structural differences of the lateral ventricles in schizophrenia and found that, although volumetric differences were insignificant, the locality of the observed shape difference in the anterior and posterior regions of the lateral ventricles is under genetic influence in both healthy controls and schizophrenia patients.
In the present study, we tested the hypothesis that amygdalar shape differences may be apparent even when overall volumes are inconsistently altered. Resulting statistical maps revealed significant structural differences at multiple regions of both amygdalae. Specifically, there were dispersed regions of significant contraction in the LLD subjects as compared to the control subjects despite insignificant volumetric differences. The primary regions exhibiting contraction were the basolateral nuclei for both the left and right amaygdalae. A comprehensive description for the neurobiological basis of the observed shape changes was outside of the scope of this study. However, investigators have previously found a decrease in the size of the basolateral nuclei, (e.g. Sheline et al., 1998) attributing the volume loss to neuronal degeneration as a result of glutamate excitotoxicity associated with hypercortisolemia, which may be exemplified by overactivity of the amygdalae in depression (Drevets, 2001).
The basolateral nuclei play a key role in emotion recognition in neurobiologic models of depression. The basolateral nuclei receive afferent neural connections from the hippocampus, entorhinal cortex, sensory thalamus and cortex, polymodal cortex, and medial prefrontal cortex, etc., and sends efferent neural connections to the prefrontal cortex, polymodal cortex, and ventral striatum, etc. Many functional and structural neuroimaging studies have found that these structures are significantly different in LLD (Nobler et al., 1999; Kumar et al., 2000; Steffens et al., 2000; Alexopoulos, 2002; Bell-McGinty et al., 2002; Aizenstein et al., 2005). Therefore, it is possible that, in LLD, morphologic changes of the basolateral nuclei may directly affect the connectivity with these regions and cause neuronal damage to them or vice versa.
KEYPOINTS
Published volumetric (size) studies of the amygdalae in mood disorders have been inconclusive with reports of increased, decreased, and no volume change for patients relative to controls.
Many reasons may explain these volumetric discrepancies such as delineation precision. However, it can be hypothesized that shape differences may be apparent even though overall volumes may be inconsistent. This hypothesis was tested in this study by examining the morphometry (size and shape) of the amygdalae in LLD.
Despite insignificant volumetric findings, local shape differences were detected with the most prominent change being contraction in the LLD subjects as compared to the control subjects in a region typically associated with the basolateral nuclei.
It is believed that studying shape differences of the amygdalae and other brain structures may help better understand the neurobiology of LLD and other mood disorders.
CONCLUSIONS
In this study, we investigated the morphometry (size and shape) of the amygdalae to determine if local structural differences exist between healthy elderly individuals and elderly individuals diagnosed with LLD. We were able to identify specific regions of structural variation despite insignificant volumetric differences. The basolateral nuclei were the primary regions exhibiting structural variation, which was contraction in the LLD subjects as compared to the control subjects. Shape analysis has given us the capability of localizing specific regions of structural variation, which may correlate with anatomical data, physiological data, demographic variables, or clinical variables. In future work, we hope to investigate various demographic variables such as age and gender and clinical variables such as age of onset to better understand the neurobiology of LLD.
ACKNOWLEDGEMENTS
The research presented here was funded by NIH grants MH19986, MH074807, MH064159, MH30915, MH71944, MH64678, LM03501, and MH072947.
Footnotes
Each subject gave informed consent prior to participation in this study. The internal review board at the University of Pittsburgh approved the MRI scanning protocol.
CONFLICT OF INTEREST None known.
REFERENCES
- Aizenstein H, Butters M, Figurski J, et al. Prefrontal and striatal activation during sequence learning in geriatric depression. Biological Psychiatry. 2005;58:290–296. doi: 10.1016/j.biopsych.2005.04.023. [DOI] [PubMed] [Google Scholar]
- Alexopoulos G. Frontostriatal and limbic dysfunction in late-life depression. Am J Geriatr Psychiatry. 2002;10:687–695. [PubMed] [Google Scholar]
- Altshuler LL, Bartzokis G, Grieder T, et al. Amygdala enlargement in bipolar disorder and hippocampal reduction in schizophrenia: an MRI study demonstrating neuroanatomic specificity. Arch Gen Psychiatry. 1998;55:663–664. doi: 10.1001/archpsyc.55.7.663. [DOI] [PubMed] [Google Scholar]
- Beekman ATF, Beurs ED, Balkom AJLMV, et al. Anxiety and depression in later life: co-occurrence and communality of risk factors. Am J Psychiatry. 2000;157:89–95. doi: 10.1176/ajp.157.1.89. [DOI] [PubMed] [Google Scholar]
- Bell-McGinty S, Butters MA, Meltzer CC, et al. Brain morphometric abnormalities in geriatric depression: long-term neurobiological effects of illness duration. Am J Psychiatry. 2002;159:1424–1427. doi: 10.1176/appi.ajp.159.8.1424. [DOI] [PubMed] [Google Scholar]
- Bellis MDD, Casey BJ, Dahl RE, et al. A pilot study of amygdala volumes in pediatric generalized anxiety disorder. Biological Psychiatry. 2000;48:51–57. doi: 10.1016/s0006-3223(00)00835-0. [DOI] [PubMed] [Google Scholar]
- Bremner JD, Narayan M, Anderson ER, et al. Hippocampal volume reduction in major depression. Am J Psychiatry. 2000;157:115–118. doi: 10.1176/ajp.157.1.115. [DOI] [PubMed] [Google Scholar]
- Bremner JD, Randall P, Scott TM, et al. MRI-based measurement of hippocampal volume in patients with combat-related posttraumatic stress disorder. Am J Psychiatry. 1995;152:973–981. doi: 10.1176/ajp.152.7.973. [DOI] [PMC free article] [PubMed] [Google Scholar]
- Butters MA, Young JB, Lopez OL, et al. Pathways linking late-life depression to persistent cognitive impairment and dementia. Dialogues Clin Neurosci. 2008;10:345–357. doi: 10.31887/DCNS.2008.10.3/mabutters. [DOI] [PMC free article] [PubMed] [Google Scholar]
- Cois CA, Rockot K, Galeotti J, et al. Shells and Spheres: A Framework for Variable Scale Statistical Image Analysis. Carnegie Mellon University; Pittsburgh, PA: 2006. [Google Scholar]
- Convit A, McHugh P, Wolf OT, et al. MRI volume of the amygdala: a reliable method allowing separation from the hippocampal formation. Psychiatry Res. 1999;90:113–123. doi: 10.1016/s0925-4927(99)00007-4. [DOI] [PubMed] [Google Scholar]
- Cox RW. AFNI: software for analysis and visualization of functional magnetic resonance neuroimages. Computers Biomedic Res. 1996;29:162–173. doi: 10.1006/cbmr.1996.0014. [DOI] [PubMed] [Google Scholar]
- Drevets WC. Neuroimaging and neuropathological studies of depression: implications for the cognitive-emotional features of mood disorders. Curr Opin Neurobiol. 2001;11:240–249. doi: 10.1016/s0959-4388(00)00203-8. [DOI] [PubMed] [Google Scholar]
- Forman SD, Cohen JD, Fitzgerald M, et al. Improved assessment of significant activation in functional magnetic resonance imaging (fMRI): use of a cluster-size threshold. Magn Reson Med. 1995;33:636–647. doi: 10.1002/mrm.1910330508. [DOI] [PubMed] [Google Scholar]
- Frodl T, Meisenzahl E, Zetzsche T, et al. Enlargement of the amygdala in patients with a first episode of major depression. Biological Psychiatry. 2002;51:708–714. doi: 10.1016/s0006-3223(01)01359-2. [DOI] [PubMed] [Google Scholar]
- Frodl T, Meisenzahl EM, Zetzsche T, et al. Larger amygdala volumes in first depressive episode as compared to recurrent major depression and healthy control subjects. Soc Biological Psychiatry. 2003;53:338–344. doi: 10.1016/s0006-3223(02)01474-9. [DOI] [PubMed] [Google Scholar]
- Giedd JN, Vaituzis AC, Hamburger SD, et al. Quantitative MRI of the temporal lobe, amygdala, and hippocampus in normal human development: ages 4–18. J Compar Neurol. 1996;366:223–230. doi: 10.1002/(SICI)1096-9861(19960304)366:2<223::AID-CNE3>3.0.CO;2-7. [DOI] [PubMed] [Google Scholar]
- Gunten AV, Fox NC, Cipolotti L, Ron MA. A volumetric study of hippocampus and amygdala in depressed patients with subjective memory problems. J Neuropsychiatry Clin Neurosci. 2000;12:493–498. doi: 10.1176/jnp.12.4.493. [DOI] [PubMed] [Google Scholar]
- Hastings RS, Parsey RV, Oquendo MA, et al. Volumetric analysis of the prefrontal cortex, amygdala, and hippocampus in major depression. Neuropsychopharmacol. 2004;29:952–959. doi: 10.1038/sj.npp.1300371. [DOI] [PubMed] [Google Scholar]
- Hensel A, Wolfe H, Dieterlen T, et al. Morphometry of the amygdala in patients with questionable dementia and mild dementia. J Neurological Sci. 2005;238:71–74. doi: 10.1016/j.jns.2005.06.011. [DOI] [PubMed] [Google Scholar]
- Kaplan HI, Sadock BJ. Synopsis of Psychiatry. Lippincott Williams and Wilkins; Philadelphia, PA: 1998. [Google Scholar]
- Kates WR, Abrams MT, Kaufmann WE, et al. Reliability and validity of MRI measurement of the amygdala and hippocampus in children with fragile X syndrom. Psychiatry Res. 1997;75:31–48. doi: 10.1016/s0925-4927(97)00019-x. [DOI] [PubMed] [Google Scholar]
- Keller J, Shen L, Gomez RG, et al. Hippocampal and amygdalar volumes in psychotic and nonpsychotic unipolar depression. Am J Psychiatry AiA. 2008:1–9. doi: 10.1176/appi.ajp.2008.07081257. [DOI] [PMC free article] [PubMed] [Google Scholar]
- Kluver H, Bucy PC. Preliminary analysis of the temporal lobes in monkeys. Arch Neurological Psychiatry. 1939;42:979–1000. [Google Scholar]
- Kumar A, Bilker W, Jin Z, Udupa J. Atrophy and high intensity lesions: complementary neurobiological mechanisms in late-life major depression. Neuropsychopharmacol. 2000;22:264–274. doi: 10.1016/S0893-133X(99)00124-4. [DOI] [PubMed] [Google Scholar]
- Lange C, Irle E. Enlarged amygdala volume and reduced hippocampal volume in young women with major depression. Psychological Med. 2004;34:1059–1064. doi: 10.1017/s0033291703001806. [DOI] [PubMed] [Google Scholar]
- McCarley RW, Shenton ME. MR Image Acquisition and Image Processing Tools and Neuroanatomical Regions of Interest. Surgical Planning Laboratory; Harvard University: 2008. [Google Scholar]
- Mervaala E, Fohr J, Kononen M, et al. Quantitative MRI of the hippocampus and amygdala in severe depression. Psychological Med. 2000;30:117–125. doi: 10.1017/s0033291799001567. [DOI] [PubMed] [Google Scholar]
- Munn MA, Alexopoulos J, Nishino T, et al. Amygdala volume analysis in female twins with major depression. Biological Psychiatry. 2007;62:415–422. doi: 10.1016/j.biopsych.2006.11.031. [DOI] [PMC free article] [PubMed] [Google Scholar]
- Nobler MS, Pelton GH, Sackelm HA. Cerebral blood flow and metabolism in late-life depression and dementia. J Geriatr Psychiatry Neurol. 1999;12:118–127. doi: 10.1177/089198879901200305. [DOI] [PubMed] [Google Scholar]
- Pruessner JC, Li LM, Series W, et al. Volumetry of hippocampus and amygdala with high-resolution MRI and three-dimensional analysis software: minimizing the discrepancies between laboratories. Cerebral Cortex. 2000;10:433–442. doi: 10.1093/cercor/10.4.433. [DOI] [PubMed] [Google Scholar]
- Rosso IM, Cintron CM, Steingard RJ, et al. Amygdala and hippocampus volumes in pediatric major depression. Biological Psychiatry. 2005;57:21–26. doi: 10.1016/j.biopsych.2004.10.027. [DOI] [PubMed] [Google Scholar]
- Sah P, Faber ESL, Armentia MLD, Power J. The amygdaloid complex: anatomy and physiology. Physiological Rev. 2003;83:803–834. doi: 10.1152/physrev.00002.2003. [DOI] [PubMed] [Google Scholar]
- Sheline YI. Neuroanatomical changes associated with unipolar major depression. Neuroscientist. 1998;4:331–334. [Google Scholar]
- Sheline YI, Gado MH, Price JL. Amygdala core nuclei volumes are decreased in recurrent major depression. NeuroReport. 1998;9:2023–2028. doi: 10.1097/00001756-199806220-00021. [DOI] [PubMed] [Google Scholar]
- Shen L, Saykin A, McHugh T, et al. Morphometric Analysis of 3D Surfaces: Application to Hippocampal Shape in Mild Cognitive Impairment. International Conference on Computer Vision, Pattern Recognition and Image Processing; Salt Lake City, UT: 2005. [Google Scholar]
- Siegle GJ, Steinhauer SR, Thase ME, et al. Can’t shake that feeling: event-related fMRI assessment of sustained amygdala activity in response to emotional information in depressed individuals. Biological Psychiatry. 2002;51:693–707. doi: 10.1016/s0006-3223(02)01314-8. [DOI] [PubMed] [Google Scholar]
- Smith SM. Fast robust automated brain extraction. Human Brain Mapping. 2002;17:143–155. doi: 10.1002/hbm.10062. [DOI] [PMC free article] [PubMed] [Google Scholar]
- Steffens DC, Byrum CE, McQuoid DR, et al. Hippocampal volume in geriatric depression. Biological Psychiatry. 2000;48:301–309. doi: 10.1016/s0006-3223(00)00829-5. [DOI] [PubMed] [Google Scholar]
- Styner M, Lieberman JA, McClure RK, et al. Morphometric analysis of lateral ventricles in schizophrenia and healthy controls regarding genetic and disease-specific factors. Proceed Nat Acad Sci. 2005;102:4872–4877. doi: 10.1073/pnas.0501117102. [DOI] [PMC free article] [PubMed] [Google Scholar]
- Thompson PM, Hayashi KM, Zubicaray GID, et al. Mapping hippocampal and ventricular change in Alzheimer disease. Neuro-Image. 2004;22:1754–1766. doi: 10.1016/j.neuroimage.2004.03.040. [DOI] [PubMed] [Google Scholar]
- Velakoulis D, Wood SJ, Wong MTH, et al. Hippocampal and amygdala volumes according to psychosis stage and diagnosis. Arch Gen Psychiatry. 2006;63:139–149. doi: 10.1001/archpsyc.63.2.139. [DOI] [PubMed] [Google Scholar]
- Watson C, Andermann F, Gloor P, et al. Anatomic basis of amygdaloid and hippocampal volume measurement by magnetic resonance imaging. Neurology. 1992;42:1743–1750. doi: 10.1212/wnl.42.9.1743. [DOI] [PubMed] [Google Scholar]
- Xia J, Chen J, Zhou Y, et al. Volumetric MRI analysis of the amygdala and hippocampus in subjects with major depression. J Huazhong Univ Sci Technol Med Sci. 2004;24:500–502. doi: 10.1007/BF02831120. 506. [DOI] [PubMed] [Google Scholar]
- Yoo T, editor. Insight Into Images. A.K. Peters; Wellesley MA: 2004. [Google Scholar]