Abstract
We show that fluorescence lifetime is a powerful contrast mechanism that can enhance the whole-body imaging of fluorescent proteins (FPs), in the presence of background tissue autofluorescence (AF). The nonexponential AF decay is characterized from time-domain (TD) measurements on multiple nude mice and separated from the FP fluorescence using a linear fit to a priori basis functions. We illustrate this approach using an orthotopic mouse tumor model of breast adenocarcinoma. We also report that four commonly used FPs show distinct lifetimes, indicating their suitability for in vivo lifetime multiplexing. These results suggest the potential for exploiting fluorescence lifetime for imaging FPs for a variety of whole-body small-animal imaging applications.
Intrinsically fluorescent proteins such as the green fluorescent protein (GFP) and other spectral variants [1] have served as powerful tools to visualize disease mechanisms at the cellular level, in both intensity-based [2] and lifetime-based microscopy techniques [3]. However, whole-body small-animal imaging with FPs has been restricted to CW detection [4–7], which is insensitive to lifetime. In addition, the FP signal in a CW measurement is indistinguishable from the tissue autofluorescence (AF), which is a major confound for visible imaging in deep tissue. Multispectral techniques have been employed to alleviate this problem [8] using a priori spectral profiles of the AF and FP fluorescence. The use of time-domain (TD) detection allows the visualization of FPs in vivo using an additional dimension, namely, lifetime [9]. In this Letter, we present lifetime-resolved images of FP expression within intact mice models of breast adenocarcinoma using TD detection, exploiting the distinct nature of the temporal responses of the FP from that of tissue AF.
A detailed description of the TD fluorescence tomography system used in this study can be found in previous work [10]. The system consists of a gated-intensified CCD camera (Lavision, Gmbh), which allows noncontact detection with 200 ps time resolution. A supercontinuum (SC) laser source (SC-450-4, Fianium, Inc., Southampton, UK) was used to excite the FPs. The SC has broad excitation capability in the range 450 nm–2400 nm with a maximum output power of 0.7 mW/10 nm between 480 nm–550 nm, the region of interest for this study. The output of the SC was fiber coupled to allow both reflectance and transmittance imaging. Interference filters were used to filter the broadband output of the SC-450.
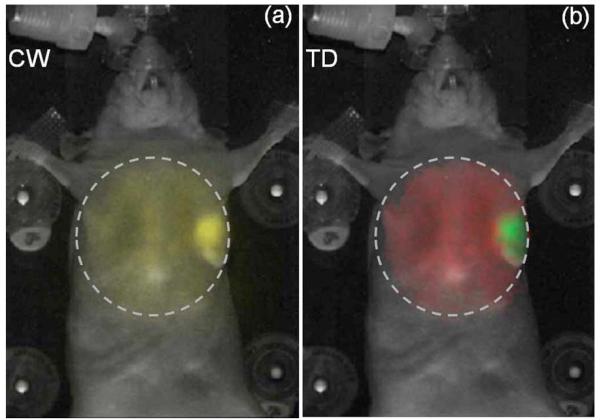
We studied the feasibility of imaging FP lifetimes within intact tumors in living mice (without any surgical preparation). The tumors were derived from the human breast-cancer cell line, MDA-MB-231, which expressed both enhanced GFP (EGFP) and cyan FP (CFP). To begin with, the cells (≈2×10⁶) were suspended in 50 μL of Hanks’ Balanced Salt Solution (Invitrogen, N.Y.) and injected into the mammary fat pads of 6–8 weeks old female nude mice. The mice were imaged 3 weeks post implantation, when the tumor was 7–8 mm in diameter, as measured using a caliper. The tumors were located ≈1 mm below the skin surface. Figure 1(a) shows the CW reflectance image for area illumination across the torso of the mouse placed in supine position, for 488 nm (10 nm width) excitation and 515 nm (long-pass) emission. The CW image is overlaid on the white-light image of the mouse. While the location of the tumor is apparent from the intensity image, the AF component is significant across the entire illumination area and effectively reduces the contrast of the FP signal.
Fig. 1.

(Color online) (a) Continuous-wave component (signal inside dashed circle, yellow online) of the reflectance TD fluorescence measurement (excitation, 488 nm; emission, 515 nm longpass) of an anesthetized nude mouse placed in supine position. 2×10⁶ EGFP/CFP expressing breast-tumor cell lines (MDA-MB-231) were implanted in the mammary fat pad. The images shown were obtained three weeks post implantation. (b) Amplitude components of the AF (red online, large area inside circle) and FP (green online, small part inside circle) decays, aAF and aFP, obtained by fitting Eq. (1) to the raw TD fluorescence data are shown as a single RGB image. The dashed lines indicate the illumination area (≈2.5 cm2). The background image of the mouse is shown in white.
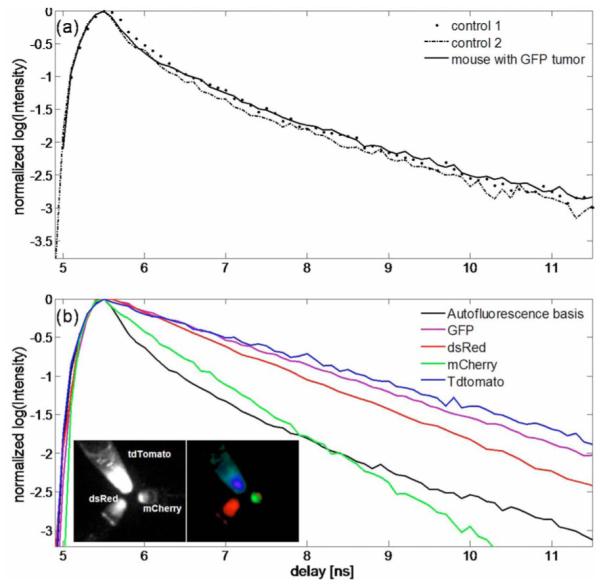
The AF decay has lifetime components overlapping with the FP lifetime, making the two indistinguishable in a multiexponential analysis approach. Thus, rather than fit the surface TD decays to a sum of exponentials, we obtained more-robust results using a “basis function” approach that performs a linear fit for the decay amplitudes, using a priori knowledge of the decay profiles. This assumption is valid for the present scenario. First, the FP lifetimes can be measured in vitro using the tumor cells prior to injection into the mice. The lifetime of the dual EGFP/CFP expressing cells used here was 2.5 ns. Second, the shape of the AF (for 488 nm excitation/ 515 nm long-pass detection) across the torso of the mouse was found to be adequately described by a single nonexponential decay profile. Figure 2(a) shows representative AF decays from multiple points across the torso region of two control nude mice, as well as from the nontumor region of the mouse in Fig. 1(a). A normalized AF basis function, B(t), was formed by averaging multiple AF decays from the three mice [Fig. 2(b), black line]. Using the known FP lifetime and the AF basis B(t), a simple bifunctional linear model was used to fit the asymptotic portion [10] of the raw TD data,
| (1) |
where τFP is the lifetime of the FP and rd is the location of an image pixel. Figure 1(b) shows the decoupled AF (red) and FP (green) amplitudes as the red and green components of a single RGB image matrix. The error of the fit was less than 5% across the entire illumination area. The TD approach [Fig. 1(b)] confirms the prescence of the tumor and provides a superior delineation of the tumor from the background AF, as compared to the CW intensity image [Fig. 1(a)]. The contrast-to-background ratio (CBR) was estimated for the CW and TD approaches as CBRCW =(Ūt-Ū0)/Ū0 and , where Ūt and are the average CW intensity and FP decay amplitude within the tumor region and Ū0 and are the corresponding values outside the tumor region. The CBR was near 23 for the TD approach, compared with near 2 for the CW case, suggesting a >tenfold improvement.
Fig. 2.

(Color online) (a) Representative AF decays obtained from two control nude mice and from a control region of a mouse with a localized tumor. (b) Global AF decay generated from the control mouse data (black) compared with the decays of FPs measured in vitro. The FP decays were exponential with lifetimes: GFP, 2.8 ns; dsRed, 2.5 ns; mCherry, 1.5 ns; and tdTomato, 3.4 ns. tdTomato, mCherry, and dsRed were excited at 543 nm (10 nm width) and detected with a 580 nm long-pass filter. GFP was excited at 480 nm (10 nm width) and detected using a 515 nm long-pass filter. The insets in (b) show the CW reflectance image (left) of tubes containing equal concentrations of tdTomato, dsRed, and mCherry, and the amplitude components (right) of a three-exponential fit using the averaged decays of the three FPs. The amplitudes are shown as red (dsRed), green (mCherry), and blue (tdTomato).
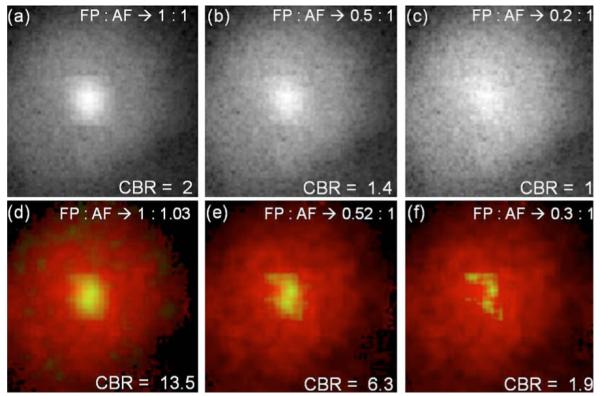
Given that the FP tumor model used in this work is localized and significantly brighter than the AF background, a natural question arises as to the smallest tumor that can be detected in the presence of background AF. This threshold depends on several factors, such as the depth of the tumor from the surface, the quantum yield of the FP used, and the sensitivity of the detection apparatus. We performed simulations to obtain a rough estimate for the detection threshold for the specific conditions used here. The AF signal from a measurement with a nude mouse was added to varying levels of a simulated single-exponential decay of 2.5 ns lifetime, representing the FP signal. The FP decay had a Gaussian distributed spatial amplitude, cocentric with the AF signal with a spatial variance of 1 cm. Shot noise (2%) was added to the FP decay. Simulated data were generated such that the maximum CW intensity of the FP and AF had ratios of 1:1, 0.5:1, and 0.2:1. Figure 3 shows the amplitudes aAF and aFP recovered from the model Eq. (1). It is clear from Fig. 3 that the amplitude ratio is recovered accurately for true FP:AF background ratios down to 0.5:1, with a CBR improvement of nearly 5 for TD over CW. Further experiments are required to translate these numbers into the smallest detectable tumor size, but the simulation clearly suggests the potential for tracking early-stage tumor growth via lifetime contrast without the need for repeated control-animal measurements to subtract the AF background.
Fig. 3.

(Color online) Simulations to test the efficiency of AF separation. (a)–(c) Continuous-wave images of simulated exponential decays within a≈1 cm diameter area added to an experimetal AF image from a control mouse with planar illumination. The ratios between the FP and AF images correspond to ratios of the maximum CW intensities of the FP and AF decays. (d)–(f) show the decoupled AF (red online, exterior color) and the FP (green online, interior color) decay amplitudes obtained using Eq. (1), as the red and green components of an RGB image matrix. Thus yellow (online) indicates the degree of overlap. The FP amplitude is scaled by a factor of 2 in. (e) and 4 in. (f) for clarity. The corresponding FP:AF ratios recovered by the fit are indicated in (d)–(f).
We also measured the in vitro lifetimes of four commonly used FPs, namely, GFP, dsRed, mCherry, and TdTomato [1]. A detailed study of the performance of these FPs for CW imaging was recently reported [7]. The results presented here offer additional criteria for in vivo lifetime imaging with these FPs. All cell lines except dsRed were prepared by transducing human glioblastoma cells (Gli36-EGFRvIII) with the corresponding lentiviral vectors for the FPs in Dulbecco’s modified Eagle’s medium, with 10% fetal calf serum and 4 μg/ml protamine sulphate. The dsRed expressing cell lines were prepared using CNS-1 rat glioma tumor cells. The cells were placed in Eppendorf tubes and imaged in reflectance mode with the TD system. The inset of Fig. 2(b) shows the CW intensity image and the lifetime-separated image of tubes containing equal concentrations of tdTomato, dsRed, and mCherry cells, excited uniformly at 543 nm and detected using a 580 nm long-pass filter. tdTomato showed the brightest signal, with dsRed and mCherry showing decreasing intensities. The lifetimes were calculated using exponential fits to be 3.4 ns for glioma-tdTomato, 2.8 ns for glioma-GFP, 2.5 ns for CNS-1-dsRed, and 1.5 ns for gliomamCherry. The FP lifetimes were independent of cell density, laser power, and CCD integration time. The relative brightness of the cells relate to their lifetimes; longer-lived FPs generally imply a higher quantum yield and hence a brighter fluorescence, assuming similar excitation cross sections. The simple exponential nature of the decays suggests their separability from AF. In addition, these results indicate the potential for lifetime multiplexing applications with far-red FPs. For instance, previous studies have labeled host and tumor cells with dual-color FPs to visualize tumor–host interactions [4]. Whereas these studies required the use of spectrally distinct FPs, including at least one visible FP, lifetime contrast allows the use of spectrally overlapping far-red FPs such as dsRed and tdTomato, which are better suited for deep tissue imaging [7].
To our knowledge, we have presented the first lifetime contrast images of FP expression from intact tumors in living mice. FPs have been extensively employed in fluorescence lifetime microscopy to visualize excited-state reactions [3] and in intravital microscopy for studying tumor pathophysiology [2]. The results presented here suggest that fluorescence lifetime can also be exploited for in vivo applications with FPs to quantify biological processes under physiologically relevant conditions. Although planar lifetime imaging can by itself enable longitudinal quantification of tumor growth, angiogenesis, and theraputic response in a single animal, the FP amplitudes, aFP, could also be employed in lifetime-based tomography techniques for recovering 3D distributions of FP expression [10]. It should be stressed that the approach presented here extracts FP amplitudes directly from TD data without the need for Fourier decomposition, which results in poorer performance in the presence of lifetime contrast [11]. Ongoing work is directed at further characterizing the nature of the AF decay in intact nude mice and applying the TD approach for longitudinally monitoring tumor physiology and metastasis in mouse models.
Acknowledgments
This study was supported by the National Institutes of Health (NIH) grants AG026240, CA80124, CA85140, CA96915, CA115767, and CA126642 and Federal Share/NCI Proton Beam Program Income grant(s).
References
- 1.Shaner NC, Steinbach PA, Tsien RY. Nat. Methods. 2005;2:905. doi: 10.1038/nmeth819. [DOI] [PubMed] [Google Scholar]
- 2.Jain RK, Munn LL, Fukumura D. Nat. Rev. Cancer. 2002;2:266. doi: 10.1038/nrc778. [DOI] [PubMed] [Google Scholar]
- 3.Bastiaens PIH, Squire A. Trends Cell Biol. 1999;9:48. doi: 10.1016/s0962-8924(98)01410-x. [DOI] [PubMed] [Google Scholar]
- 4.Yang M, Lingna L, Jiang P, Moossa AR, Penman S, Hoffman RM. Proc. Natl. Acad. Sci. USA. 2003;100:14259. doi: 10.1073/pnas.2436101100. [DOI] [PMC free article] [PubMed] [Google Scholar]
- 5.Zacharakis G, Kambara H, Shih H, Ripoll J, Grimm J, Saeki Y, Weissleder R, Ntziachristos V. Proc. Natl. Acad. Sci. USA. 2005;102:18252. doi: 10.1073/pnas.0504628102. [DOI] [PMC free article] [PubMed] [Google Scholar]
- 6.Hoffman RM, Yang M. Nat. Protocols. 2006;1:1429. doi: 10.1038/nprot.2006.223. [DOI] [PubMed] [Google Scholar]
- 7.Deliolanis NC, Kasmieh R, Wurdinger T, Tannous BA, Shah K, Ntziachristos V. J. Biomed. Opt. 2008;13:044008. doi: 10.1117/1.2967184. [DOI] [PMC free article] [PubMed] [Google Scholar]
- 8.Tam JM, Upadhyay R, Pittet MJ, Weissleder R, Mahmood U. Mol. Imaging. 2007;6:269. [PubMed] [Google Scholar]
- 9.Soloviev VY, McGinty J, Tahir KB, Neil MAA, Sardini A, Hajnal JV, Arridge SR, French PMW. Opt. Lett. 2007;32:2034. doi: 10.1364/ol.32.002034. [DOI] [PubMed] [Google Scholar]
- 10.Kumar ATN, Raymond SB, Dunn AK, Bacskai BJ, Boas DA. IEEE Trans. Med. Imaging. 2008;27:1152. doi: 10.1109/TMI.2008.918341. [DOI] [PMC free article] [PubMed] [Google Scholar]
- 11.Kumar ATN, Raymond SB, Bacskai BJ, Boas DA. Opt. Lett. 2008;33:470. doi: 10.1364/ol.33.000470. [DOI] [PMC free article] [PubMed] [Google Scholar]


