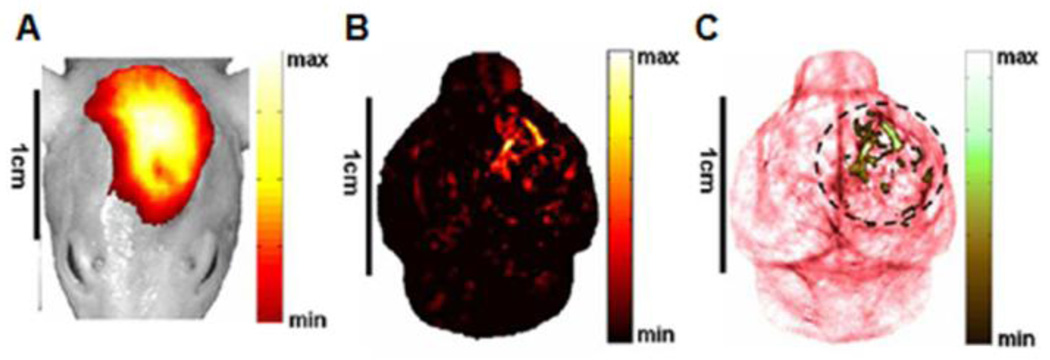
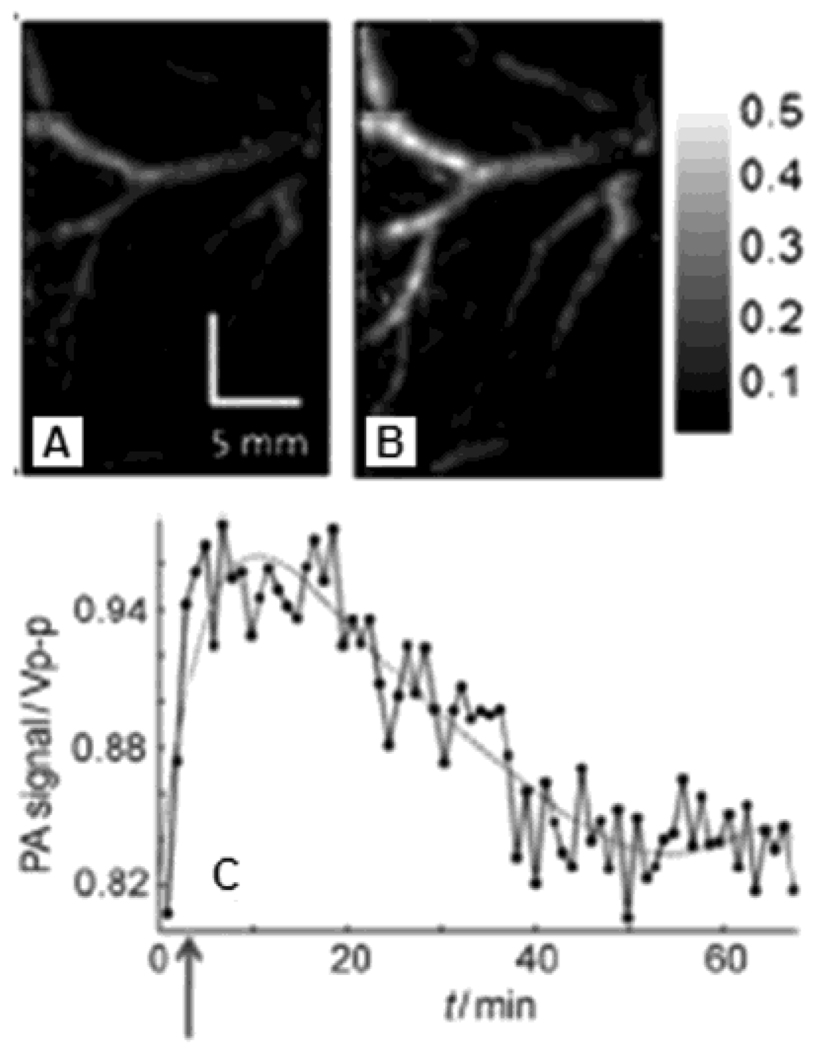
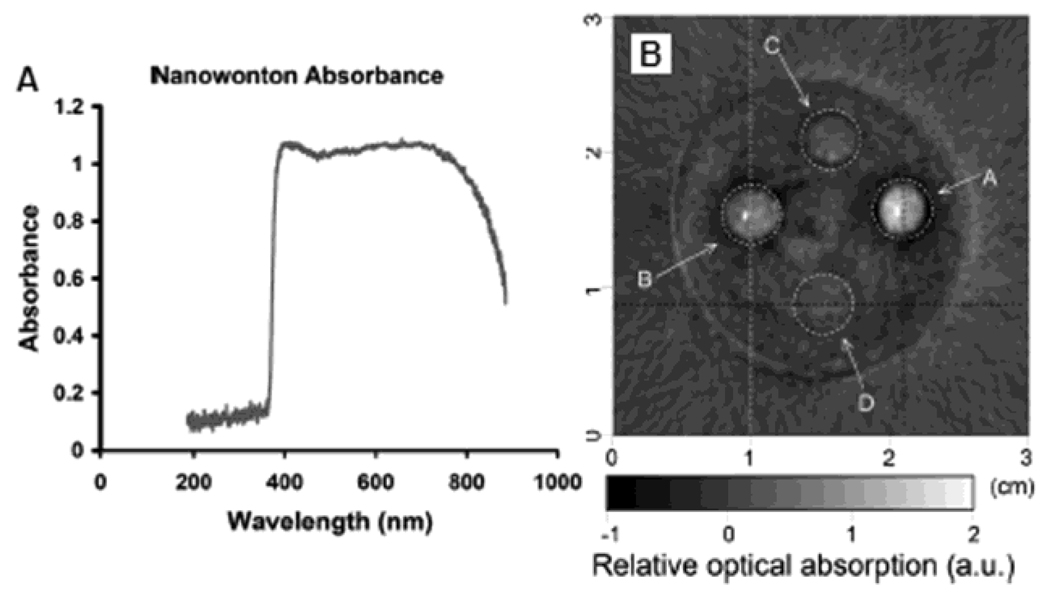
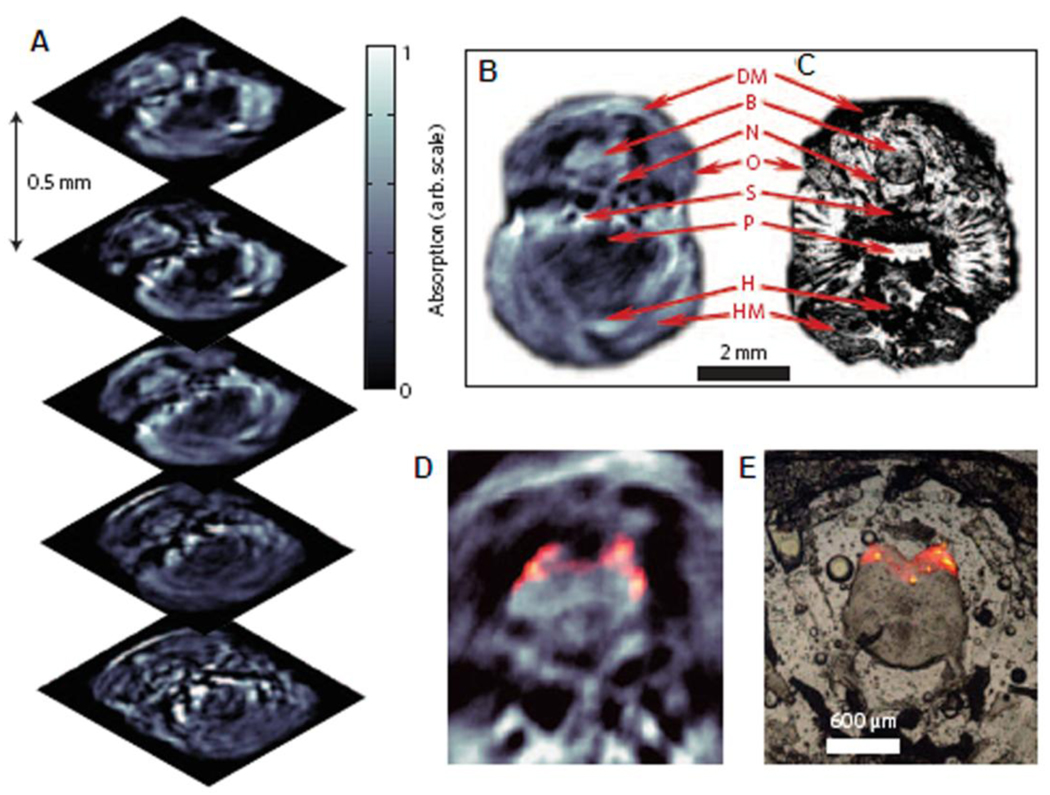
1. Introduction
High-resolution volumetric optical imaging modalities, such as confocal microscopy, two-photon microscopy, and optical coherence tomography, have become increasingly important in the biomedical imaging field. However, due to strong light scattering, the penetration depths of these imaging modalities are limited to the optical transport mean free path in biological tissues, e.g., ~1 mm in the skin. Photoacoustic tomography (PAT), an emerging hybrid imaging modality that can provide strong endogenous and exogenous optical absorption contrasts with high ultrasonic spatial resolution using the photoacoustic (PA) effect,1 has overcome the fundamental depth limitation. The image resolution is scalable with the ultrasonic frequency. The imaging depth is limited to the reach of photons and up to a few centimeters deep in biological tissues. This article will review the following aspects of PAT described in works published from 2003 to 2009: (1) multi-scale PAT systems, (2) morphological and functional PAT using intrinsic contrasts (hemoglobin or melanin), and (3) functional and molecular PAT using exogenous contrast agents (organic dyes, nanoparticles, reporter genes, or fluorescence proteins).
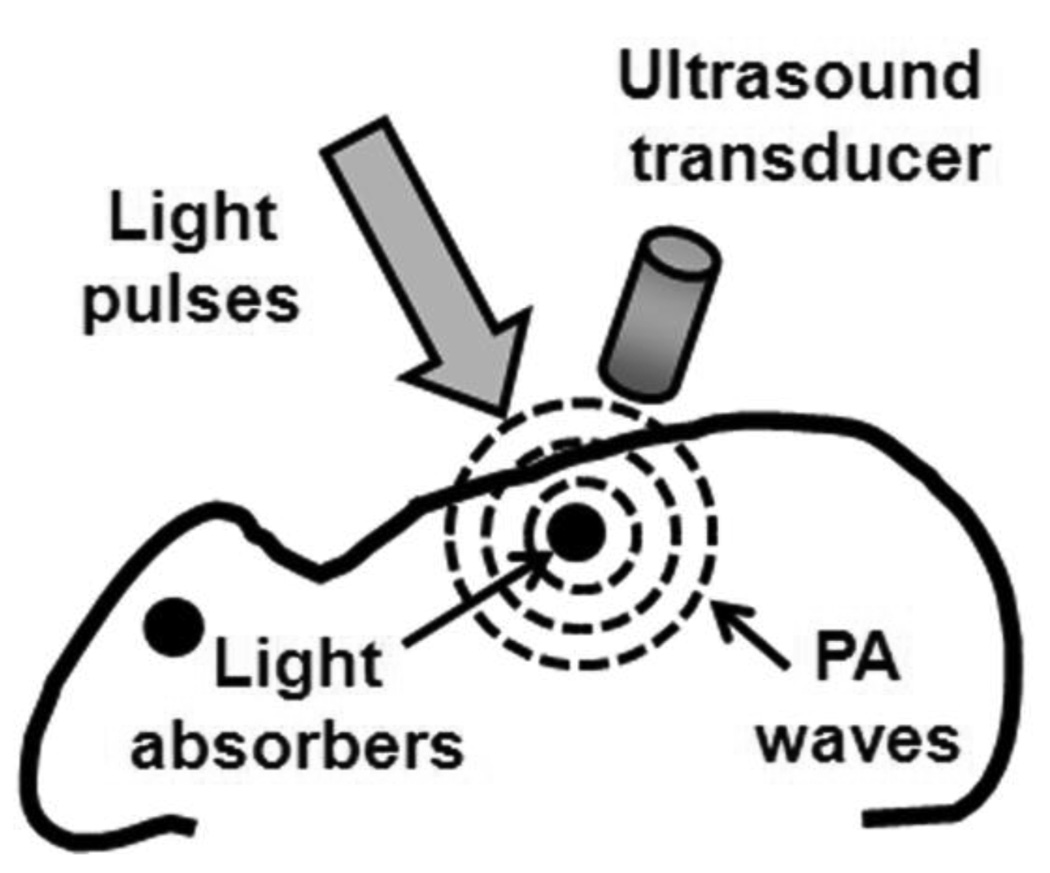
Figure 1 illustrates the PA effect and its application to imaging. In general, a target is irradiated by a short-pulsed laser beam. A portion of the light is absorbed by the target’s constituents and then partially converted into heat, which generates a pressure rise through thermo-elastic expansion. This initial pressure rise—determined by the local optical energy deposition and other thermal and mechanical properties—is propagated as an acoustic wave in the biological tissue and detected by ultrasonic transducers. PA images are derived from the arrival times of the ultrasonic waves. PAT image contrast is determined by optical absorption in the PA excitation phase, whereas its resolution is derived from ultrasonic detection in the PA emission phase. The combination of these intrinsic properties enable PA imaging to break through the fundamental limitations of pure optical imaging2–5 (i.e., shallow imaging depth for high resolution or low spatial resolution beyond the transport mean free path) and pure ultrasonic imaging (i.e., weak contrast for early cancer detection and speckle artifacts). By scaling the ultrasonic detection frequency, the spatial resolution and imaging depth can be tuned accordingly to the imaging application.
Figure 1.
Illustration of the PA mechanism. When a target absorbs light, PA waves are generated via thermo-elastic expansion. The PA waves propagate and are detected by an ultrasonic transducer.
There are two major types of PAT systems. One is photoacoustic computed tomography (PACT), which uses reconstruction algorithms to generate an image.6 The second is photoacoustic microscopy (PAM) or macroscopy, which utilizes direct point by point detection and raster scanning over an object to render an image. PACT can be implemented using a single-element unfocused ultrasound transducer and circular scanning,6 or an ultrasound array system in circular7, quarter-circular8, or linear form. The imaging speed is dramatically improved in the latter approach and is ultimately limited to the pulse repetition rate of the excitation light source and the tissue damage threshold. By contrast, PAM does not require the use of an inverse algorithm to generate a three-dimensional image, but it requires raster scanning with a single-element focused transducer. An example of a PAM system is a dark-field confocal photoacoustic microscope9,10 Based on recently reported experimental results, PAM imaging depth is scalable from 0.7 to 30 mm by varying the ultrasonic frequency from 75 to 3.5 MHz,10–12 whereas the spatial resolution is scalable from 5 to 150 µm.
Purely with endogenous contrasts such as hemoglobin or melanin, PAT is able to produce high resolution images of vascular structures,9,12 solid tumors and angiogenesis,9,13 and internal organs11,14 in vivo. In addition to morphological information, this technique can provide functional information such as oxygen saturation of hemoglobin and total hemoglobin concentration, using multiple wavelengths of light.6,9,15,16 Important to many functional measurements is the acquisition speed. With ultrasound array systems, PA imaging is sufficiently fast and capable of monitoring real-time heart beats in small animals.17 Exogenous contrast agents (organic dyes, nanoparticles, reporter genes, or fluorescence proteins) with biomarkers further enhances PA imaging, making it an increasingly valuable tool for molecular imaging.18,19
2. Photoacoustic tomography systems
2.1. Photoacoustic computed tomography (PACT)
2.1.1. A single-element unfocused ultrasound transducer based PACT
When the laser pulse width is shorter than the characteristic thermal diffusion time (referred to as thermal confinement), PA waves p(r0, t) are related to light absorption H(r, t) as follows: 20
| (1) |
where vs is the acoustic velocity, CP is the specific heat, and β is the volumetric thermal expansion coefficient. In addition, the light absorption H(r, t) is equal to Ae(r)I(t), where Ae(r) denotes the spatial distribution of optical energy deposition, F(r)µa(r), and I(t) denotes the temporal laser pulse profile, where F(r) denotes the local fluence and µa(r) denotes the local optical absorption coefficient.
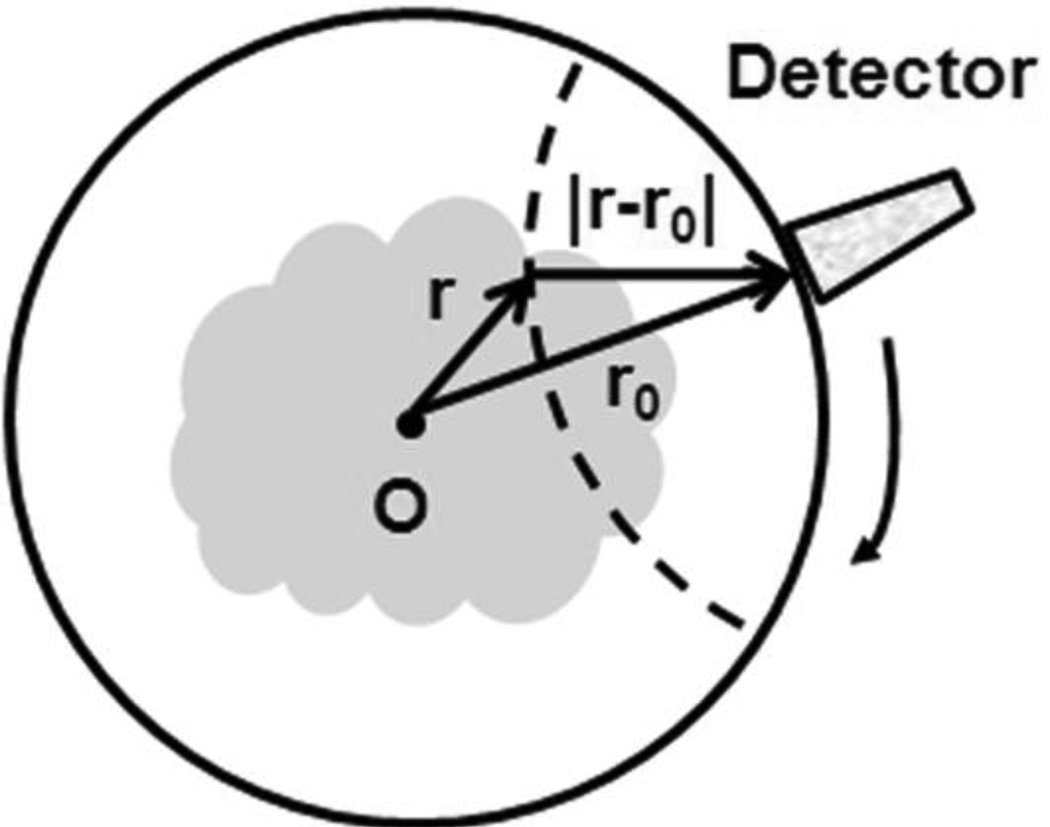
If I(t) is a Dirac delta function, a PA wave received at a detection point r0 (Figure 2) can be described as follows:21
| (2) |
where ds is the surface element of a unit sphere and R is |r – r0|.
Figure 2.
Circular scanning geometry in PACT using an unfocused ultrasound transducer.
By assuming the detection point r0 is far from the source point at r compared to the wavelength of PA wave, the spatial map of optical energy deposition Ae(r) can be reconstructed as follows:20
| (3) |
where Ω0 is the solid angle of the whole detection surface with respect to a given point source and dΩ is the solid angle of a detection element. If the fluence in the imaging plane is homogeneous at a given optical wavelength, the image of Ae(r) is proportional to the image of µa(r); otherwise, fluence F(r) need to be considered for quantitative analysis of µa(r).
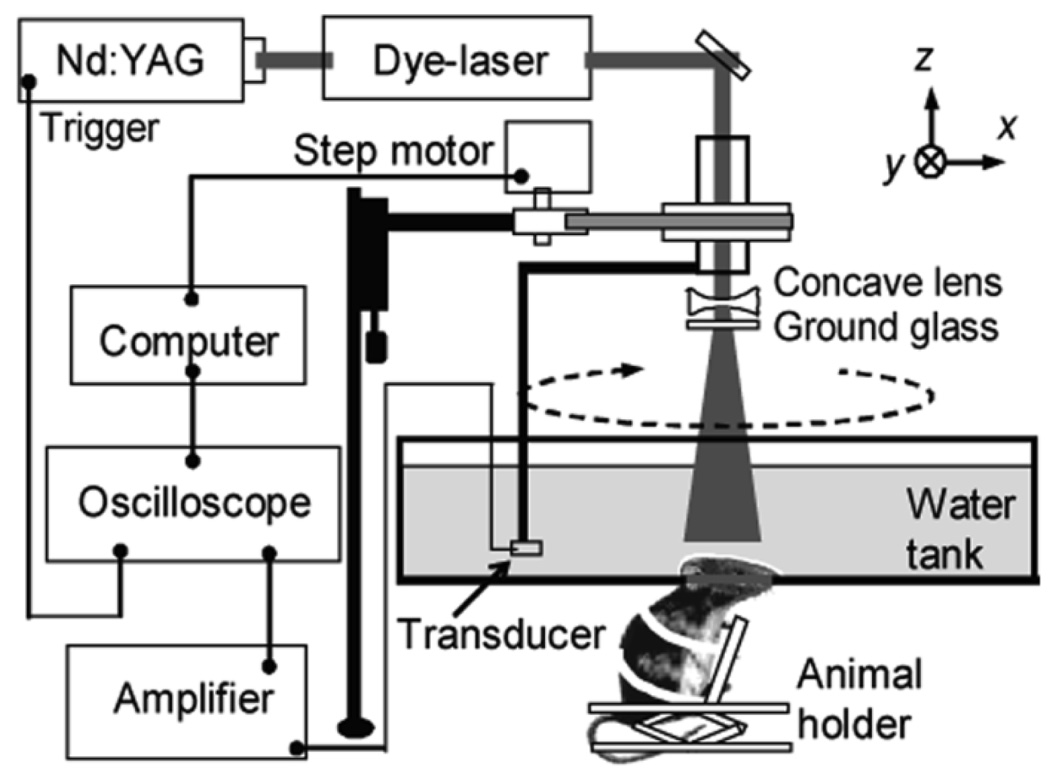
As an example, a schematic of a PACT system with a circularly scanning, single-element unfocused ultrasonic transducer used for small-animal brain imaging is shown in Figure 3.15 The system employed a tunable dye laser (ND6000, Continuum) pumped by an Nd:YAG laser (Brilliant B, Big Sky) to generate laser pulses with a pulse duration of 6.5 ns at 10 Hz. The laser beam was first expanded using a concave lens and homogenized using a ground glass. The incident energy density on skin surface was less than 3 mJ/cm2, which is well below the ANSI standard of 20 mJ/cm2.22 An unfocused ultrasonic transducer (e.g., XMS-310 or V383, Panametrics) was circularly scanned around the rat brain cortex in the horizontal (x-y) plane. By incrementally moving the ultrasonic transducer along the z-direction, volumetric information was obtained. The detected PA signals were first amplified and then digitized by an oscilloscope. Finally, 3D PA images were reconstructed and displayed in the computer. Since this system requires mechanical scanning of a single-element transducer, the scanning times required for both 2D and 3D images were approximately 15 minutes and several hours, respectively.
Figure 3.
A schematic of a PACT system for small-animal brain imaging. (Reprinted with permission from ref 82. Copyright 2006 American Chemical Society.)
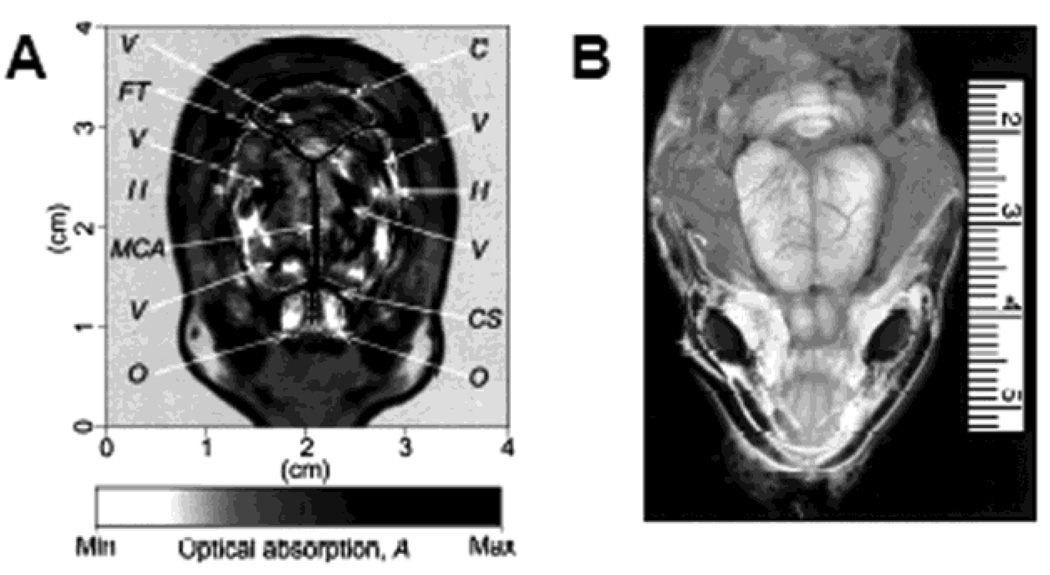
The PACT imaging was performed on an adult Sprague Dawley rat (~350 g) using a 10-MHz ultrasonic transducer. The images were obtained noninvasively with the scalp and skull intact. Figure 4 shows the transdermal and transcranial images of a rat’s brain acquired in vivo. The optical absorption is indicated with a gray scale, where the darker areas—such as blood vessels—have relatively higher absorption. The PA image of the rat brain cortex (Figure 4A) matches well with the open-skull photograph (Figure 4B) obtained after PA imaging.
Figure 4.
Structural PACT image of a rat brain acquired in vivo. (A) Noninvasive PACT image of a rat brain cortex acquired with the skin and skull intact. C, cerebellum; H, cerebral hemispheres; O, olfactory bulbs; MCA, middle cerebral artery; CS, cruciate sulcus; FT, fissure transversa; V, blood vessels. (B) Open-skull photograph taken after PACT experiment. (Reprinted with permission from ref 6. Copyright 2003 Nature.)
2.1.2. A ring ultrasound array based real-time PACT7,8
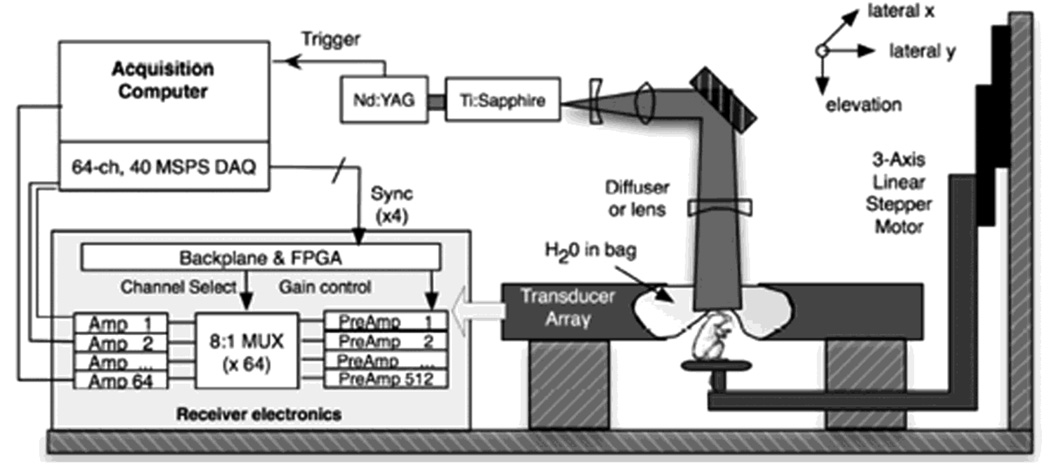
As mentioned above, single-element based PACT systems can be relatively slow and the example system required about 15 minutes to collect single 2D tomographic image. However, by employing a full-ring transducer array, the temporal resolution can be significantly improved. The system described below utilizes a 512 element full-ring transducer array and can collect one 2D tomographic image at the frame rate of 0.9 Hz.
A schematic of 512-element, 360-degree PACT system is shown in Figure 5. A Ti:Sapphire (Symphotics TII, LS-2134) laser pumped by a Q-switched Nd:YAG laser (Symphotics-TII, LS-2122) illuminated a small-animal brain with 8–12 ns pulses. The laser beam was first expanded and homogenized before striking the target. The custom-made transducer array (Imasonic) consisted of 512 elements in a curved aperture such that a complete circle (i.e., 360 degrees) was formed with a radius of 25 mm. The center frequency of the transducers in this array system was 5 MHz with a nominal bandwidth greater than 80%. The system was also equipped with 512 dedicated low-noise and 20 dB gain preamplifiers. With 8:1 multiplexing, eight laser pulses were necessary to generate a complete 512-element capture. Data setup and transfer of results for a single acquisition could be performed at a frequency up to 8 Hz, leading to a maximum full-capture rate of about 1 frame/second.
Figure 5.
A schematic of 512-element, 360-degree PACT system. (Reprinted with permission from ref 7. Copyright 2009 The Optical Society of America.)
The brain cortex of a mouse (~ 20 g) was noninvasively imaged to demonstrate the potential of dynamic spectroscopic PA imaging to monitor regional and temporal changes in oxygenation status throughout a small-animal brain. During the 30-second imaging experiment, the laser wavelength of the laser was manually tuned from approximately 700 nm to 900 nm. Figure 6 shows the individual frames from the real-time sequence. The vascular structures of the brain cortex are clearly visible. The higher PA signals in blood vessels at 850 nm can be explained by both an increased penetration depth due to less optical scattering and higher absorption coefficients of the predominantly oxygenated hemoglobin at longer wavelengths. This experiment demonstrated the capability to perform wide-range, in vivo spectroscopic studies with sub-minute scan times.
Figure 6.
Time-resolved PA images of mouse brain vasculature with fast wavelength scanning. The laser wavelength was manually chirped from 710 nm to 900 nm over 30 seconds. (Reprinted with permission from ref 7. Copyright 2009 The Optical Society of America.)
2.1.3. A linear ultrasound array based real-time PACT17,23,24
Linear transducer arrays can also be used for PACT. A high-frequency (30 MHz) linear ultrasound transducer array was adapted to create a microscopic PACT system. This system performs real-time depth-resolvable 2D imaging (referred to as B-scan) at 50 Hz (faster than the 30-Hz video rate) with real-time beamforming and 3D imaging of 166 B-scan frames at 1 Hz post beamforming.
The schematic of microscopic PACT system is depicted in Figure 7. The tunable dye laser (Cobra, Sirah) pumped by a Nd:YLF laser (INNOSLAB, Edgewave) produced 7-ns laser pulses at the maximum repetition rate of 1 kHz without compromising the pulse energy. Dark-field confocal light delivery configuration was designed to provide a compact system with sufficient signal-to-noise ratio (SNR) and robust performance. The laser pulses were coupled into a multimode fiber and collimated at the exit of the fiber. The collimated beam was split into two beams by a 50:50 nonpolarizing beamsplitter. The two beams were reflected by mirrors toward two cylindrical lenses and coupled into a plastic slab. The optical fluence on the skin surface was ~2 mJ/cm2 per pulse, well within the ANSI safety limit.22 A 30-MHz linear ultrasound transducer array was fabricated by a 2-2-piezocomposite and was comprised of 48 elements (82 µm × 2 mm) with 100-µm spacing. The dimension of the element in the elevation direction was 2 mm, and the elements were focused in this direction with a fixed focal length of 8.2 mm. The axial, lateral, and elevational resolutions at 7-mm depth from the transducer surface were estimated to be 25, 70, and 200 µm, respectively. The imaging depth in biological tissues was deeper than 3 mm. The detected PA signals were first amplified and then multiplexed to eight channels. Linear scanning was performed to achieve 3-D imaging.
Figure 7.
Schematic of a microscopic PACT imaging system using a linear ultrasound array. (Reprinted with permission from ref 23. Copyright 2008 Society of Photo-Optical Instrumentation Engineers.)
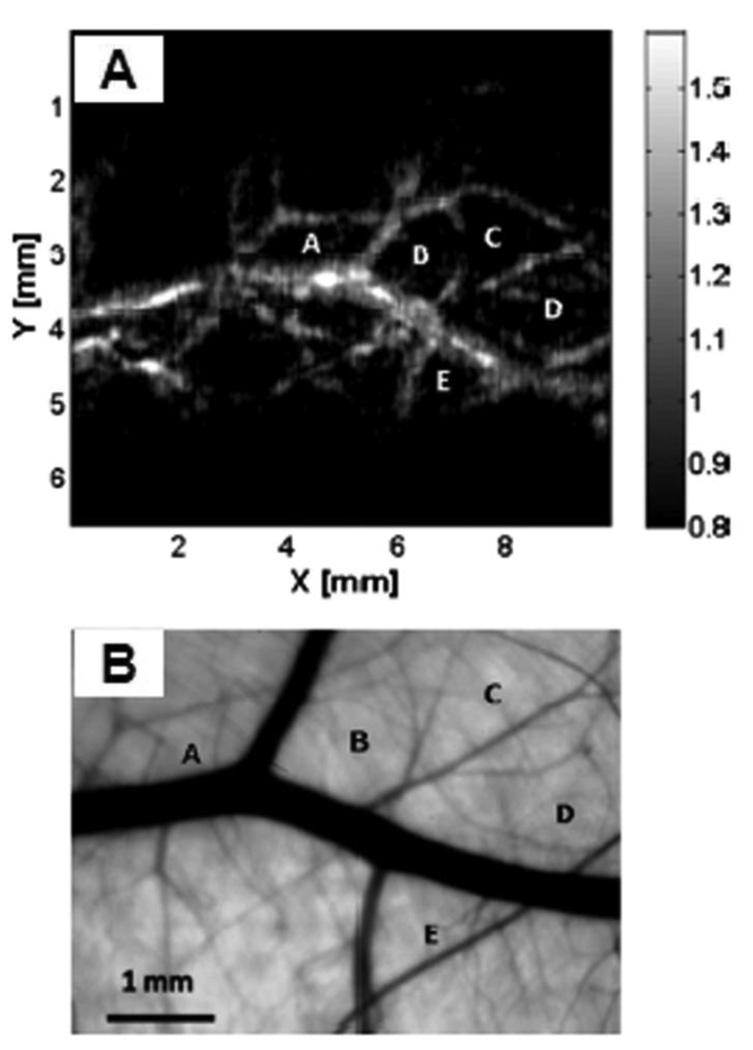
To demonstrate this system’s capability to image blood vessels in vivo, the upper dorsal region of a Sprague Dawley rat (~95 g) was imaged. Figure 8 shows an in vivo PA image and an ex vivo transmission optical microscopic image of the subcutaneous vasculature in an imaged area. As shown in Figure 8, the vascular distributions in the two images matched well. The data acquisition for this image was completed within 1 s, and the MAP image was displayed within 3–4 s.
Figure 8.
(A) In vivo noninvasive PA image of subcutaneous blood vessels in a rat using microscopic PACT with a linear ultrasound array. The regions enclosed by major blood vessels are labeled using A–E. (B) Photograph taken from the dermal side of the excised skin with transmission illumination. (Reprinted with permission from ref 23. Copyright 2008 Society of Photo-Optical Instrumentation Engineers.)
2.2. Confocal photoacoustic microscopy (PAM)
2.2.1. A single-element focused ultrasound transducer based dark-field confocal PAM9,10,25
As opposed to PACT, dark-field confocal PAM utilizes a spherically focused ultrasound transducer. The axial resolution of this type of PAM is determined by the bandwidth of the transducer and the transverse resolution is limited to the numerical aperture of the spherically focused acoustic lens. By measuring the time of arrivals of the PA signals, one dimensional depth resolved image can be obtained, referred to as an A-line. Raster scanning along the two transverse directions enables to form three-dimensional images of optical absorption heterogeneities in biological tissues. Consequently, no additional reconstruction algorithm is required in PAM. The acquired volumetric images were expressed in one of two forms: a maximum amplitude projection (MAP), in which the maximum signal from each A-line is projected onto the corresponding XY plane or a true volumetric image processed by Volview software (Kitware Inc.).
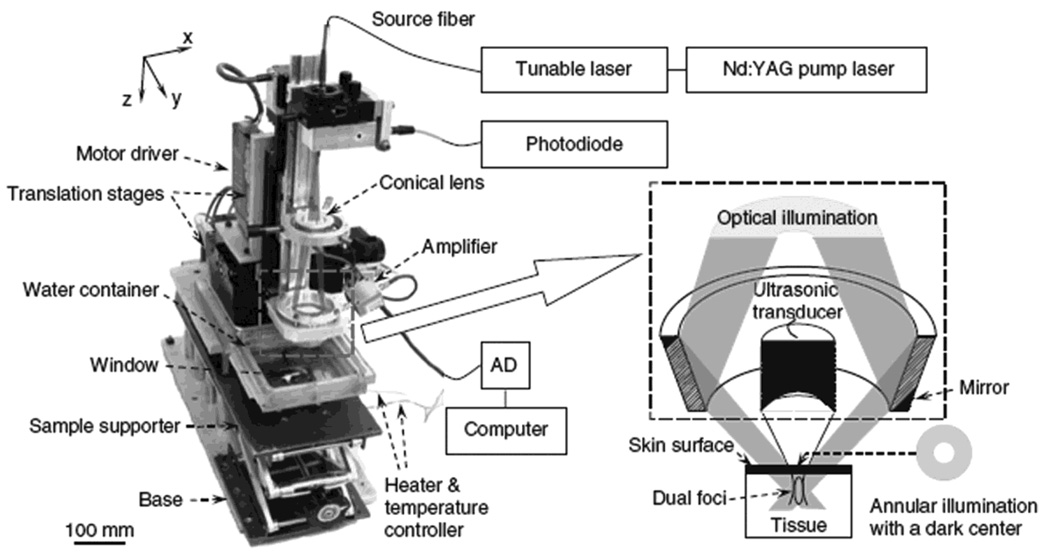
A dark-field confocal PAM system is shown in Figure 9. The light was delivered from a tunable dye laser (ND6000, Continuum) pumped by a Q-switched Nd:YAG laser (LS-2137, LOTIS) with 6-ns pulse duration and 10-Hz pulse repetition rate. A multimode fiber was used for the light delivery. A dark-field illumination pattern was formed by the combination of a spherical conical lens and a weakly focusing optical condenser and was coaxially aligned with the ultrasound focus in water. This dark-field confocal configuration provides a greater penetration depth and higher SNR than the previously discussed confocal PACT systm.26 The light fluence on the skin was less than 6.4 mJ/cm2, which is within the ANSI limit.22 Generated PA waves were detected by a single-element ultrasound transducer (20 or 50 MHz). The 50-MHz ultrasonic frequency yielded 15 µm and 45 µm axial and transverse resolutions, respectively. The maximum penetration depth at 50 MHz was about 3 mm. As mentioned in the Introduction section, the spatial resolution and imaging depth are highly scalable as a function of the ultrasonic frequency.
Figure 9.
Experimental dark-field confocal PAM system. (Reprinted with permission from ref 9. Copyright 2006 Nature.)
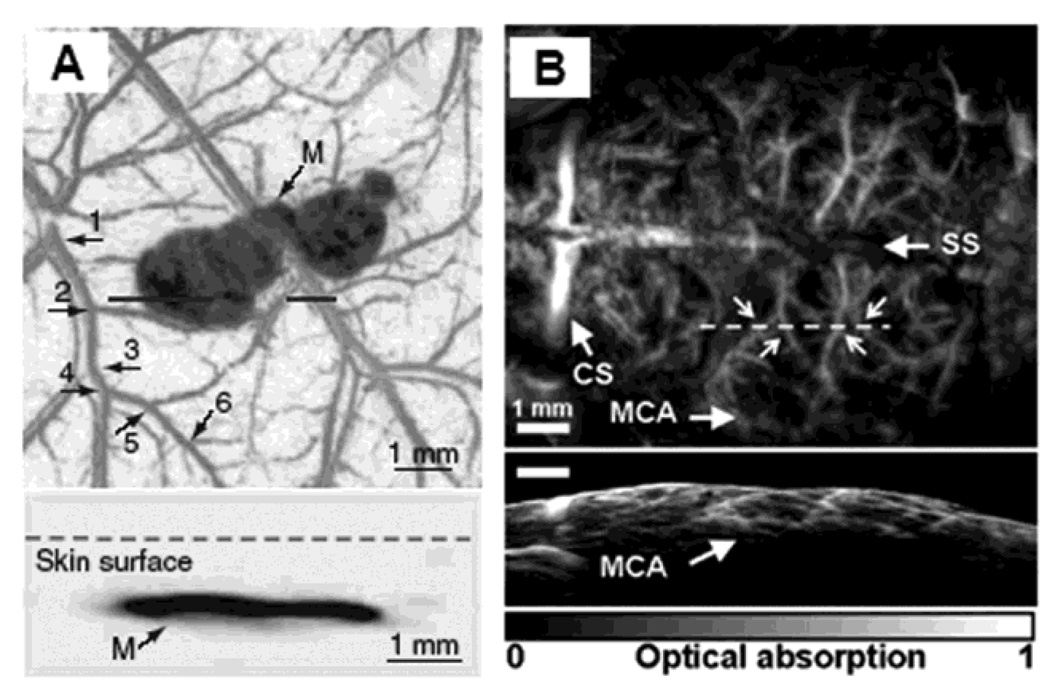
By taking advantage of the high optical absorption in hemoglobin and melanin, subcutaneous microvaculatures and melanoma in mice were imaged using the PAM system in vivo. Figure 10A shows a composite image of a melanoma and surrounding vascular structures. These dual pigments were imaged with two different wavelengths, 584 nm for the surrounding microvasculature and 764 nm for the melanoma. The bottom panel in Figure 10A shows the corresponding two dimensional depth-resolved image (referred to as B-scan) along the dashed line in the top panel. The averaged image contrast of blood vessels at 584 nm compared to background is 13 ± 0.89, and that of the melanoma at 764 nm is 68 ± 5. Figure 10B shows the mouse brain cortical microvasculature imaged using 20 MHz ultrasonic frequency and 570 nm optical wavelength.27 Major vascular landmarks (sagittal sinus, middle cerebral artery, and coronal suture) are clearly identified. The corresponding bottom figure shows the B-scan image along the dashed line in the top figure.
Figure 10.
In vivo noninvasive PA images of subcutaneous microvasculature, melanoma, and cortical vasculature in mice using dark-field PAM. (A) Top: a composite image of a melanoma acquired at 764 nm and surrounding microvasculature acquired at 584 nm using a 50 MHz ultrasonic detection frequency. Bottom: a B-scan image along the cut in the corresponding top figure. M, melanoma. (B) Top: a cortical vasculature image obtained at 570 nm using a 20 MHz ultrasonic detection frequency. Bottom: a B-scan image along the cut in the corresponding top figure. SS, sagittal sinus; MCA, middle cerebral artery; CS, coronal suture. (Reprinted with permission from ref 9. Copyright 2006 Nature, and from ref 27. Copyright 2009 American Institute of Physics.)
2.2.2. Deep-reflection mode PA macroscopy 11,14
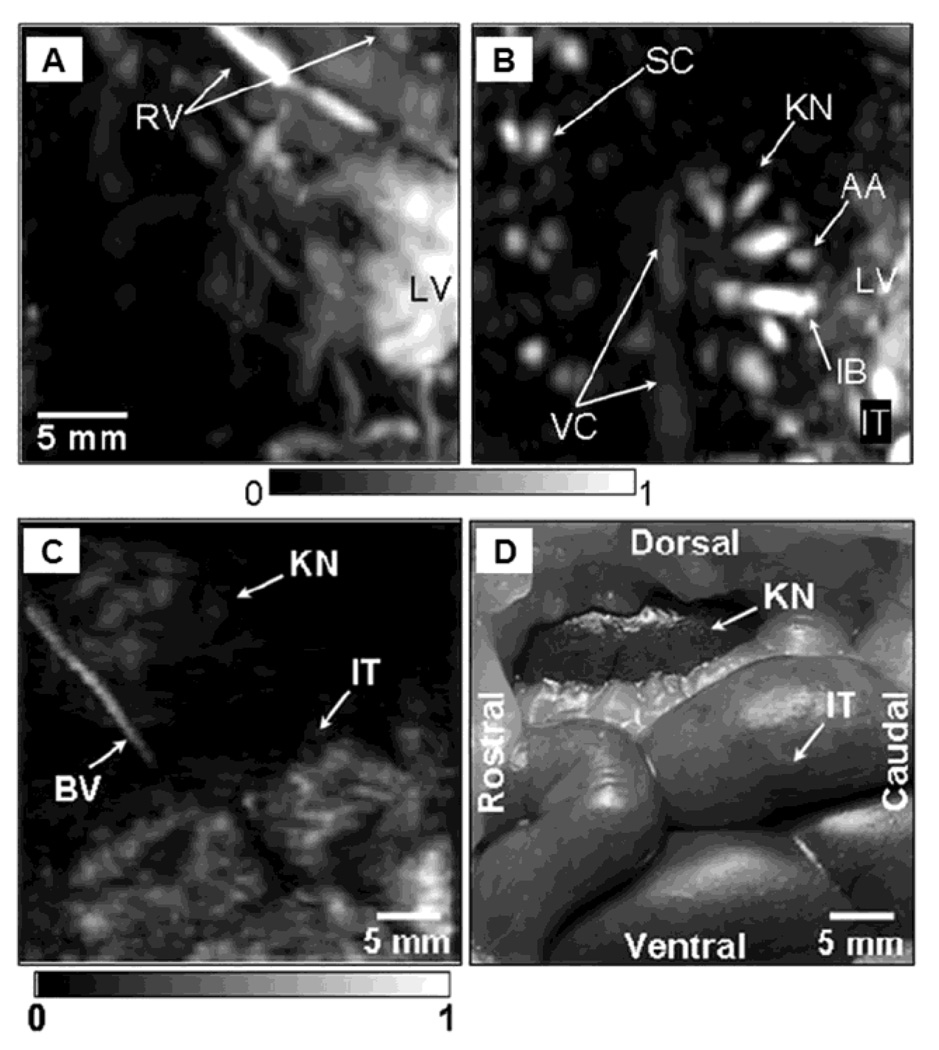
To test the imaging capability in deep tissues and demonstrate the scalability of PAM, the deep-reflection mode PAM system was constructed and tested. The imaging penetration depth was increased more than 3 cm by lowering the ultrasonic frequencies to 3.5 – 10 MHz. For example, using a 5 MHz ultrasonic frequency the spatial resolutions at 19 mm deep in biological tissue were 144 µm in the axial direction and 560 µm in the transverse direction. The principle of this system is the same as the previously described dark-field confocal PAM system15, but the system has been scaled for deep imaging. Figure 11 shows the images of several internal organs such as a liver, a kidney, and an intestine from small and large animals imaged in situ. A Sprague Dawley rat weighing ~ 200 g and a New Zealand white rabbit weighing ~ 3 kg were used for the small and large animal imaging, respectively. The liver and kidney of the rat are clearly identified in Figure 11A and 11B, respectively. The intestine of the rabbit is also clearly shown in Figure 11C, and match well with the photograph (Figure 11D) taken after the PA imaging.
Figure 11.
In situ noninvasive PA images of internal organs in small and large animals using deep-reflection mode PAM. PA images of liver (A) and kidney (B) in a rat. A PA images (C) of intestine in a rabbit, and the corresponding invasive photograph (D) taken after the imaging. AA, arcuate blood vessels; IB, interlobar blood vessels; IT, intestines; KN, kidney; LF, lumbodorsal fascia; LV, liver; RV, blood vessels around ribs; SC, blood vessels in the spinal cord; VC, vena cava inferior; BV, blood vessel; and IT, intestine. (Reprinted with permission from ref 14. Copyright 2008 The American Association of Physicists in Medicine.)
2.2.3. Optical-resolution PAM (OR-PAM)12
Thus far, both axial and transverse resolutions in the above mentioned PAM systems depend solely on ultrasonic parameters. To improve the ultrasonic resolution to the order of a µm, the penetration depth, which is limited by the frequency-dependent ultrasonic attenuation in tissues, becomes severely reduced. For example, to achieve a 5 µm transverse resolution, a 300 MHz of ultrasonic frequency is required. Consequently, the penetration depth is limited to ~ 100 µm in tissue due to the strong acoustic attenuation. As an alternative approach, optical focusing can provide fine transverse resolution while the axial resolution is still derived from the ultrasonic bandwidth. This technique is referred as optical-resolution photoacoustic microscopy (OR-PAM). Although in this case the imaging depth is limited to the ballistic photon regime due to strong light scattering like other pure optical microscopy techniques, 2–4 OR-PAM can still probe deeper than a PA system with the same transverse resolution provided by ultrasonic focusing. OR-PAM provides primarily optical absorption contrast, whereas conventional optical microscopy provides dominantly optical scattering or fluorescence contrast.
The experimental schematic of an OR-PAM system is shown in Figure 12. A dye laser pumped by a Nd:YLF laser was used as the PA excitation source. Laser pulses (pulse duration, 7 ns) passing through a 25-µm-diameter pinhole were spatially filtered, and then the pinhole was imaged to a nearly diffraction-limited focal spot with 3.7 µm in diameter through an objective lens (NA, 0.1; depth of focus, ~40 µm). About 100 nJ of the pulse energy after the objective lens was used. The ultrasound transducer (V2022 BC, Olympus NDT, 75 MHz) was focused through a plano-concave lens (radius of curvature, 5.2 mm; aperture, 6.4 mm; NA in water, 0.46). Therefore, both optical illumination and acoustic detection were coaxially aligned. A 3D image was acquired by raster scanning the surface of the target and combining the 1D depth scans received at each surface position. The transverse and axial resolutions of this system were 5 and 15 µm, respectively, and the maximum penetration depth was better than 700 µm.
Figure 12.
Schematic of the OR-PAM. a, Condenser lens; b, pinhole; c, microscope objective; d, ultrasonic transducer; e, correcting lens; f, isosceles prism; g, acoustic lens; h, silicon oil. (Reprinted with permission from ref 12. Copyright 2008 The Optical Society of America.)
Microvasculature in the ear of a nude mouse (~ 20 g) was imaged in vivo at an optical wavelength of 578 nm. Unlike that in the ref 28, no optical clearing agent was applied to the skin surface. The microvasculature is clearly seen in two-dimensional MAP (Figure 13A) and volumetric OR-PAM images (Figure 11B), which agree well with the photograph (Figure 11C) taken with a transmission optical microscope. Small sizes of blood vessels are only observable in the OR-PAM image. The image contrast of blood vessels is nearly 20, compared to the background. Some vessels labeled with CL show a diameter of ~5 µm, comparable to the diameter of a single capillary. These results demonstrate the capability of OR-PAM to image single capillaries in vivo without additional exogenous contrast agents.
Figure 13.
OR-PAM images of microvasculature in a nude mouse ear in vivo. (A) 2D OR-PAM MAP image. (B), 3D visualization of the OR-PAM image. (C) photograph taken with transmission optical microscopy. CL, capillary, and SG, sebaceous gland. (Reprinted with permission from ref 12. Copyright 2008 The Optical Society of America.)
3. Functional photoacoustic tomography using intrinsic contrasts
3.1. Functional imaging of blood vessels in vivo using PAT29
Functional, biological images, such as the total hemoglobin concentration (HbT) and hemoglobin oxygen saturation (SO2), are important in many medical and biomedical fields. These measurements are valuable for imaging brain activation,30 studying tumor physiopathology,31 monitoring wound healing process,32 and studying gene expression.33 Currently, the following other techniques can potentially estimate SO2:
Near-Infrared Spectroscopy (NIRS)34: NIRS measures reflected or transmitted diffusive light from biological tissues at various optical wavelengths and estimates the SO2 comparing optical-spectral differences between deoxy-hemoglobin (HbR) and oxy-hemoglobin (HbO2). However, it is difficult to collect localized measurements due to strong light scattering in biological tissues.
Blood-Oxygen-Level-Dependent contrast Magnetic Resonance Imaging (BOLD MRI)35: Despite the high spatial resolution of BOLD MRI, the contrast is only sensitive to HbR, consequently measuring oxygenation and blood flow changes in vessels with this technique is challenging.
Electron Paramagnetic Resonance Imaging (EPRI)36: EPRI requires the injection of exogenous free-radical contrast agents.
Positron Emission Tomography (PET) and Single Photon Emission Tomography (SPET)37,38: Both techniques require the injection of radioactive isotopes and suffer from poor spatial resolution.
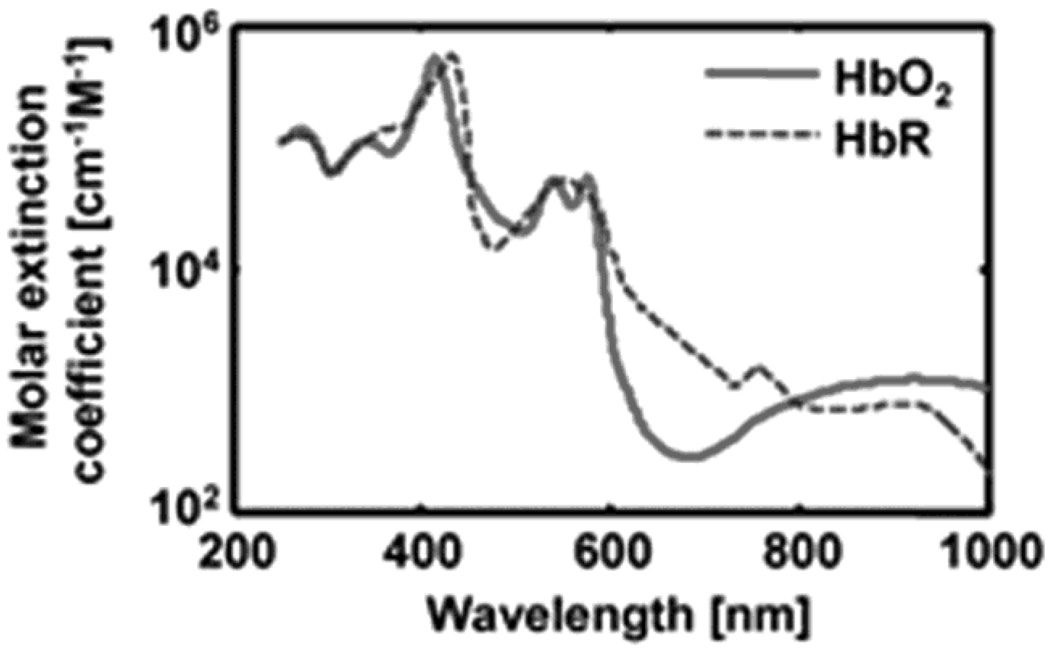
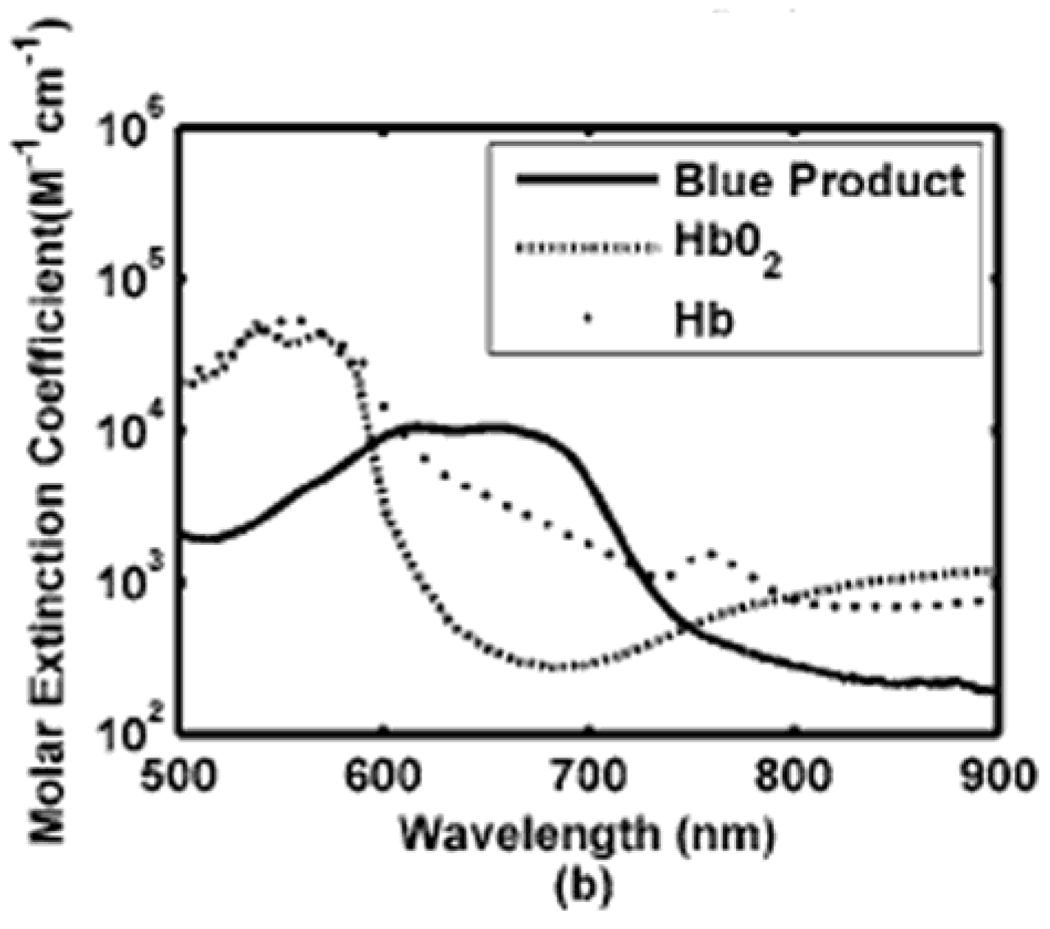
PA measurements of SO2 use the same principle as NIRS, where hemoglobin is considered the dominant optical absorption chromophore at each wavelength (λi). The two forms of hemoglobin, HbR and HbO2, have different molar extinction spectra (Figure 14), where the molar extinction coefficient is defined as the extinction coefficient of a substance at a specific unit of concentration.
Figure 14.
Spectra of two types of hemoglobin. Oxy-hemoglobin (HbO2) and deoxy-hemoglobin (HbR).
Thus, as a first order approximation, the blood absorption coefficient µa(λi) can be calculated as follows:
| (4) |
| (5) |
where µa (cm−1) is the absorption coefficient; λ1 and λ2 are the two PA imaging wavelengths; εox and εde are the known molar extinction coefficients (cm−1 mM−1) of the HbO2 and HbR, respectively; Cox and Cde are the concentrations (mM) of the HbO2 and HbR. The SO2 and HbT are defined as follows:
| (6) |
| (7) |
Since the localized PA amplitudes are proportional to the local optical energy deposition, one can replace µa with the measured PA amplitudes. In addition, to minimize wavelength-dependant fluence fluctuation, close wavelengths (i.e., 566 and 570 nm) are usually selected. Many groups work on the correction of wavelength-dependant fluence fluctuation as well. It is shown that even a simple difference between two images acquired using two appropriately different wavelengths is correlated with the oxygenation of hemoglobin. More than two optical wavelengths; however, are often used to improve accuracy.
3.2. Static and dynamic SO2 imaging in rats’ skin 9,16
The 50-MHz dark-field confocal PAM (see section 2.2.1) was employed for both static and dynamic SO2 imaging in Sprague-Dawley rats (~200 g) in vivo. Four optical wavelengths (578, 584, 590, and 596 nm) were applied sequentially to get multicolored PA images. Figure 15A shows morphological MAP image of blood vessels taken at 584 nm (isosbestic wavelength), which reflects the total hemoglobin concentration. Vessel-by-vessel mapping of SO2 using Eq. 6 is shown in Figure 15B, estimated from the four images. Red color represents arterial blood (SO2 = 0.97 ± 0.02) and blue color does venous blood (SO2 = 0.77 ± 0.04), and these values agree well with values previously reported in the literature.39 With high-resolution PAM system vessel-by-vessel SO2 mapping is possible, while the other techniques show only the volume-averaged SO2.
Figure 15.
Static and dynamic SO2 imaging in rats’ skin. (A) Structural MAP image taken at 584 nm. (B) Static SO2 mapping. Red, arterial blood; Blue, venous blood. (C) Structural MAP image taken at 584 nm. (D) Static SO2 mapping under normoxia. Red, arterial blood; Blue, venous blood. (E) Changes in SO2 from normoxia to hypoxia. (F) Changes in SO2 from normoxia to hyperoxia. (G) Quantification of SO2 values in arteries and veins under three physiologic conditions. (Reprinted with permission from ref 9. Copyright 2006 Nature, and from ref 16. Copyright 2007 American Institute of Physics.)
For dynamic SO2 mapping, three physiological conditions (hyperoxia, normoxia, and hypoxia) were induced in a rat by changing the oxygen concentration of the inhaled gases (pure oxygen, normal air, and carbogen compromising 5% O2, 5% CO2, and 90% N2). The other imaging protocols remained the same as in the static imaging experiment. Figure 15C shows the morphological MAP image of blood vessels taken at 584 nm under hyperoxia. Figure 15D shows the SO2 imaging under normoxia. Figure 15E shows the differential SO2 image between normoxia and hypoxia (hypoxia – normoxia). In addition, the SO2 changes between normoxia and hyperoxia (hyperoxia – normoxia) are shown in Figure 15F. The SO2 values in the arteries and veins under three physiological conditions are quantified in Figure 15G. The changes in SO2 between the three conditions agreed well with the pulse oximeter readings and previously reported results.40
3.3. Imaging brain hemodynamic changes in small animals6,15,41
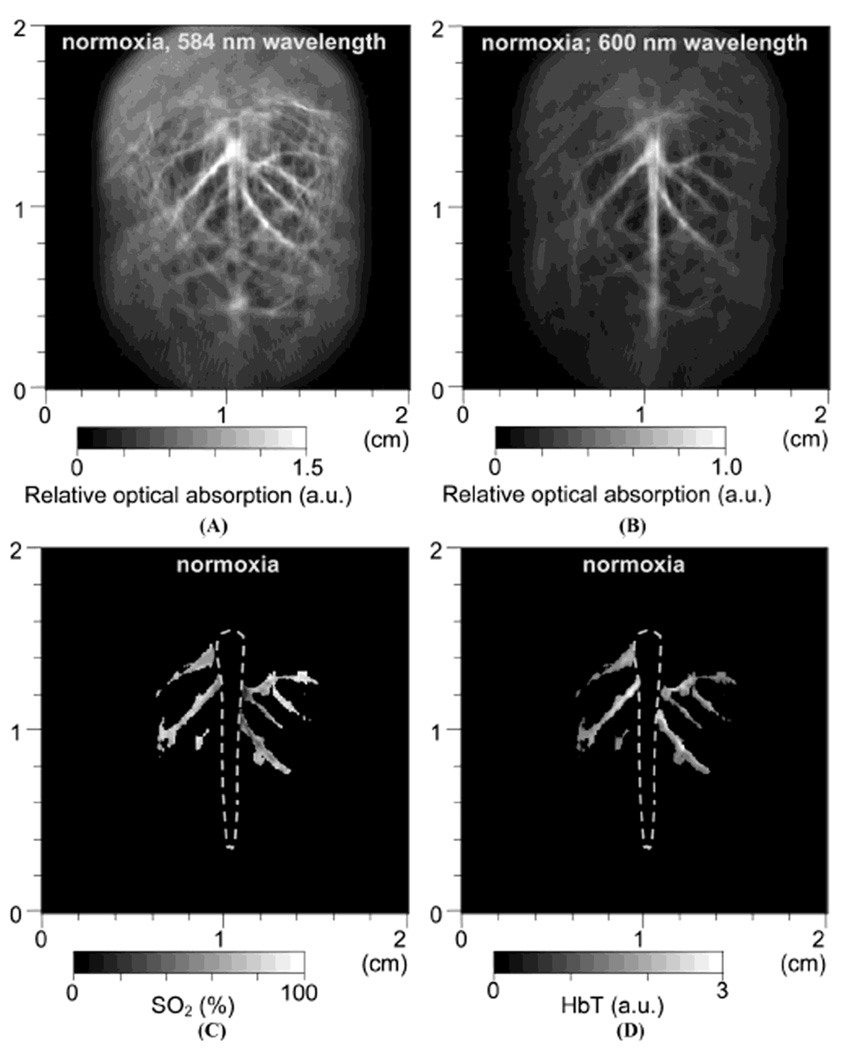
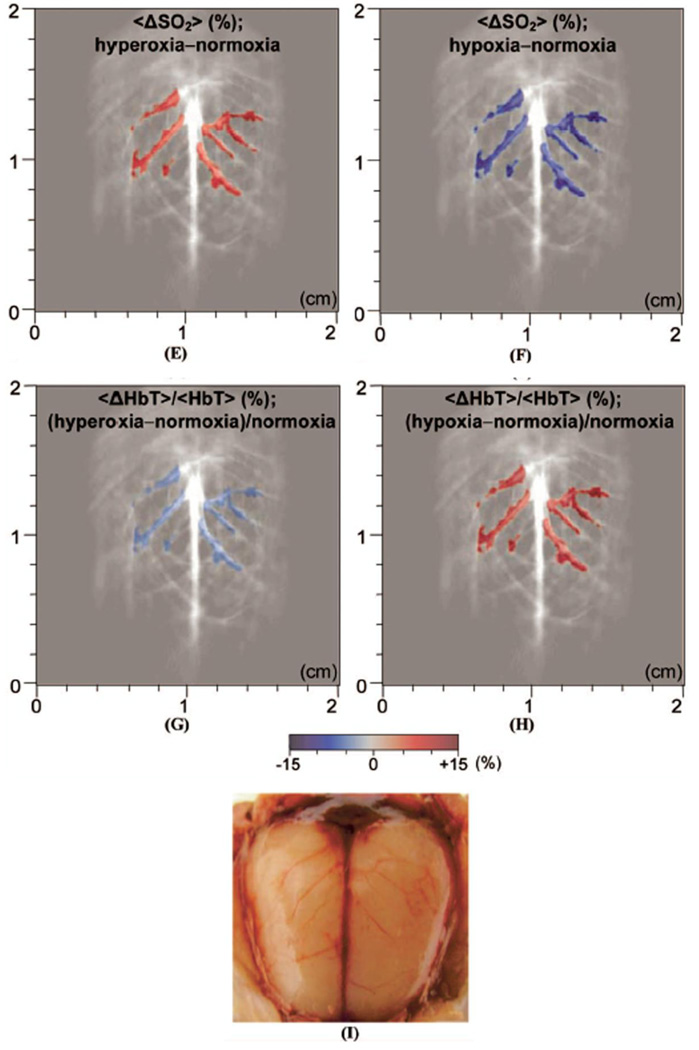
First, a single-element unfocused ultrasound transducer based PACT (see section 2.1.1) was employed to assess the cerebral blood volume and SO2 in brains of Sprague Dawley rats (~80 g) in vivo. Three physiological states (hyperoxia, normoxia, and hypoxia) were induced in a rat by changing oxygen concentration in the inhaled gases as explained in section 3.2. Two PA images were acquired at two optical wavelengths (584 and 600 nm) for each physiological state. Figure 16A and B show the morphological images of the brain cortex under normoxia taken at 584 and 600 nm, respectively, which match well with the photograph (Figure 16I) taken after the imaging experiments. PA signals in Figure 16A are stronger than those in Figure 16B because the optical absorption coefficients of both types of hemoglobin are higher at 584 nm than at 600 nm (Figure 14). For the HbT and SO2 mapping using Eqs. 6 and 7, the cortical venous regions were segmented from the background. Figure 16C and D show the mapping of SO2 and HbT under normoxia, respectively. The SO2 image indicates the absolute value, whereas the HbT image has an arbitrary unit. Figure 16E shows the differential <SO2>(the averaged SO2 level) image between normoxia and hyperoxia (hyperoxia – normoxia). Additionally, the <SO2>changes between normoxia and hypoxia (hypoxia – normoxia) are shown in Figure 16F. Under hyperoxia, <SO2>in the cortical venous vessels was higher than that under normoxia and as expected <SO2>under normoxia was higher than that under hypoxia. The quantified <SO2>were ~ 80%, ~ 70%, and ~ 57% under hyperoxia, normoxia, and hypoxia, respectively. Simultaneously, changes in the averaged HbT value, <HbT>, were estimated during the changes of physiological states. Changes in <HbT>, denoted by <ΔHbT>/<HbT>, from normoxia to hyperoxia was ~ 4% decrease (Figure 16G), whereas from normoxia to hyperoxia was ~12% increase (Figure 16H). All segmented functional images in Figure 16E to H were overlaid on the structural image in Figure 16B. These results agree well with the previously reported results.40
Figure 16.
In vivo noninvasive PA images of rat brain hemodynamic changes includingtotal hemoglobin concentration (HbT) and oxygen saturation of hemoglobin (SO2). (A) and (B) Structural brain images under normoxia at 584 and 600 nm laser light, respectively. (C) and (D) Images of SO2 and HbT in the cortical venous area under normoxia. (E) The differential <SO2> (the averaged SO2 level) image between normoxia and hyperoxia (hyperoxia - normoxia). (F) The differential <SO2>image between normoxia and hypoxia (hypoxia - normoxia). (G) The fractional change in HbT (<ΔHbT>/<HbT>) between hyperoxia and normoxia. (H) The fractional change in HbT between hypoxia and normoxia. (I) Open-skull anatomical photograph taken after the PA imaging experiments. (Reprinted with permission from ref 15. Copyright 2006 Society of Photo-Optical Instrumentation Engineers.)
Using the PACT system, functional brain activation in rats’ brain cortexes were studied in response to left and right whisker stimulations in Sprague Dawley rats (~ 350 g). PA images acquired without whisker stimulation were subtracted from images acquired with whisker stimulation to map the brain activation. Figure 17A and B show functional cerebral hemodynamic changes in response to left and right whisker stimulation, respectively. The activated regions in PA images were marked on the open-skull photograph with two boxes taken after the PA imaging experiments (Figure 17C). This region was histologically analyzed. The vibrotome sections of cortical layer IV —whisker-barrel cortex in Figure 17D— colocalized well with the activated regions in PA images. Increases in PA signals in those areas could be explained as increase in blood volume and/or flow due to the whisker stimulation.
Figure 17.
Functional PA images of cerebral hemodynamic changes in response to whisker stimulations. (A) and (B) Cerebral functional PA images in response to left and right whisker stimulation, respectively. The map of increased PA signals (color) was superimposed on the gray-scale structural PA image. (C) Open-skull photograph taken after the PA imaging experiments. B, bregma; L, lambda; M, midline; A, activated regions. (D) Histology of normal lamina IV cortical barrels (region A). (Reprinted with permission from ref 6. Copyright 2003 Nature.)
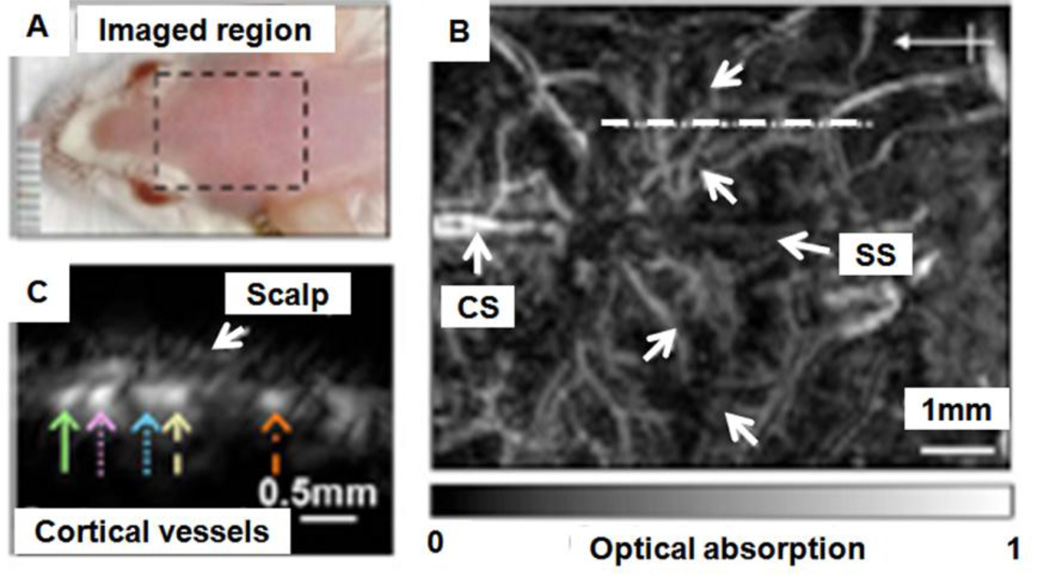
The 20-MHz dark-field confocal PAM (see section 2.2.1) was also employed to image brain activity via the hemodynamic response in Swiss Webster mice (~ 25 g) in vivo. The real-time oxygenation dynamics of the selected individual cortical vessels were measured simultaneously in response to controlled perturbations of inhaled oxygen levels. Figure 18B shows the morphological PA image of the brain cortex in the marked region in Figure 18A at 570 nm (isosbestic wavelengtht). After identifying several major somatoseonsory cortex (SC) vessels in Figure 18B, a B-scan (Figure 18C) was obtained by raster scanning along the dashed line in Figure 18B. The temporal resolution of one B-scan (Figure 18C) is less than one second.
Figure 18.
In vivo structural PA images of the mouse cortex vasculature. (A) Photograph of the scanned region. (B) Noninvasive PA image of the mouse cortex vasculature. SS, sagittal sinus; CS, coronal suture. (C) B-scan image obtained from scanning along the white dotted line in (B). (Reprinted with permission from ref 41. Copyright 2009 Society of Photo-Optical Instrumentation Engineers.)
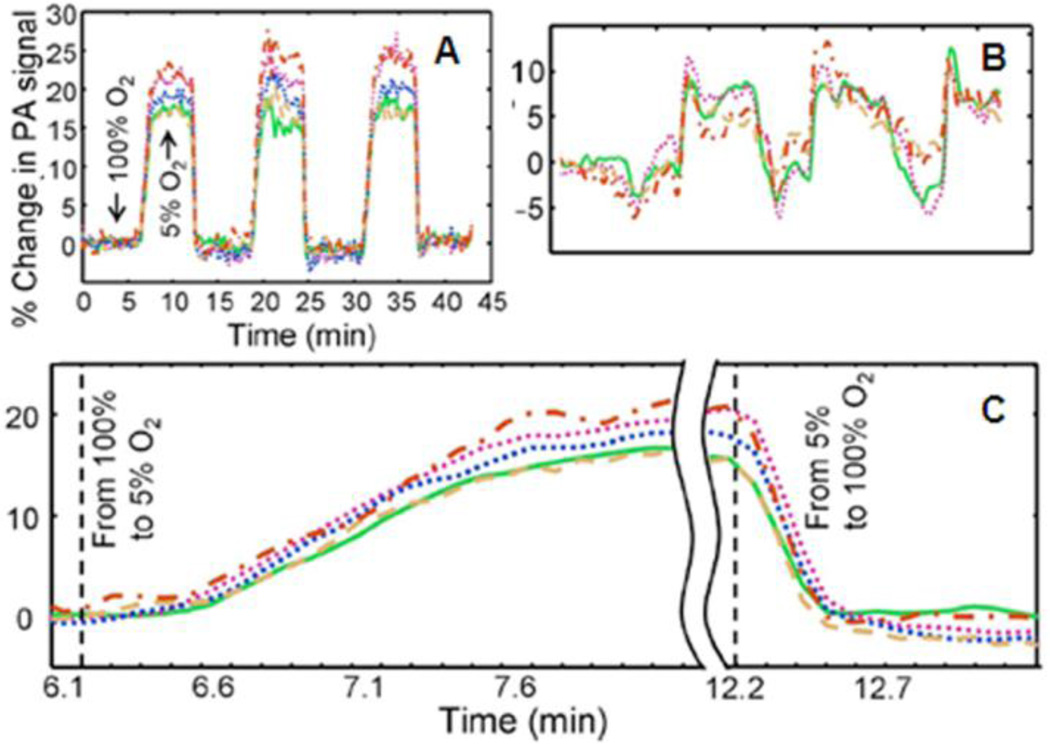
Two optical wavelengths (561 nm: deoxyhemoglobin dominant wavelength, 570 nm: an oxygen-insensitive absorption wavelength) were applied sequentially to get multicolored PA images. The acquisition time for a pair of dual wavelength scans (10 s) was limited by the wavelength tuning time of the dye laser. Throughout image acquisition, hyperoxic (pure oxygen: 100% O2) and hypoxic (carbogen: 5% O2, 5% CO2, and 90% N2) states were induced by alternating the inhaled oxygen levels every 6 minutes, and a pulse oximeter was used to verify each change. To estimate dynamic oxygenation changes, the integration of the full width at half-maximum (FWHM) of the image of each vessel over the time period was calculated to minimize the laser fluctuation effects. A hyperoxic state (100% O2) was used as a baseline, and the animal was exposed to three 5% O2 steps with a return to baseline between successive hypoxic states. Figure 19A shows the dynamic oxygenation profile for each of the five vessels, and a close-up of the profile is shown in Figure 19C to emphasize the transition phases between two physiological states. The baseline (isosbestic) measurement is shown in Figure 19B. The initial step from hyperoxia to hypoxia occurred at time t = 6.1 min. The forward response time, characterized by the rising time from 10 to 90% of maximum, was 63 ± 6 s. The forward response time among the five vessels did not vary significantly (α = 0.1). Although the maximum values under hypoxia significantly fluctuated among the vessels, no significant correlation between maximum response and vessel diameter was observed. At t =12.2 min, the hypoxic challenge ended via a step exposure to 100% O2. The reverse response time, defined as the falling time from 90 to 10% of the maximum, was 16 ± 2 s.
Figure 19.
Dynamic oxygenation profiles of five vessels. Profiles acquired through a hypoxic challenge and shown in changes (%) of (A) ratiometric PA signals and (B) isosbestic PA signals. (C) Close-up of the forward rising part of the dynamic vessel responses shown in A. (Reprinted with permission from ref 41. Copyright 2009 Society of Photo-Optical Instrumentation Engineers.)
3.4. Imaging tumor angiogenesis and tumor hypoxia in small animals13,42
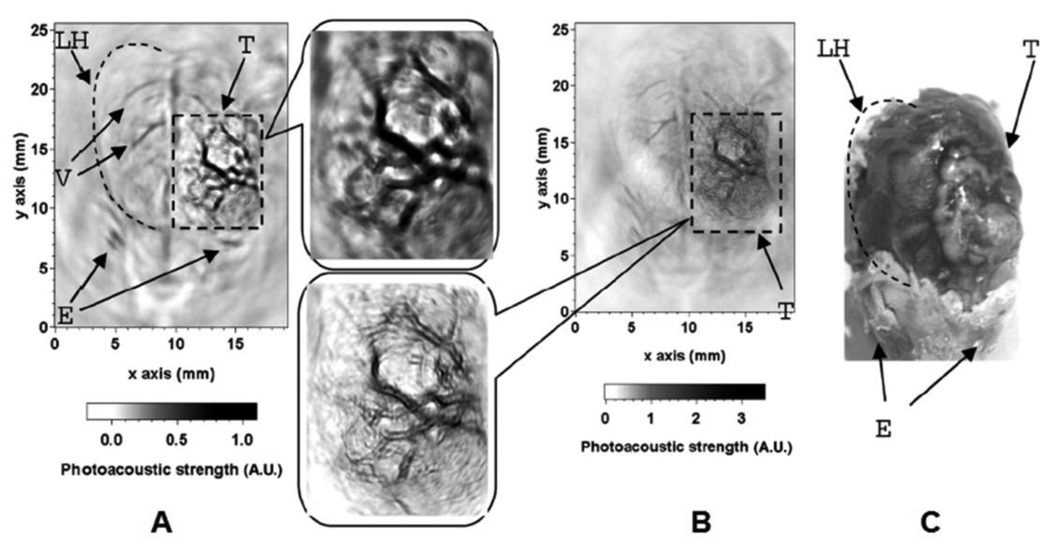
Tumor angiogenesis43,44 describes the formation of new blood vessels around and within the tumor and is a critical step in tumor growth. Angiogenesis increases the blood and nutrient supply to the tumor, and consequently expedites tumor growth. During the normal angiogenesis process, the balance of pro-and anti-angiogenic signals is tightly regulated, so new blood vessels become quickly mature and stable. However, during the tumor angiogenesis, this balance is not maintained and new vessels are constantly formed. The structures of these blood vessels are different from normal vessels. They are typically abnormally shaped, dilated, tortuous, and can have blind ends. In addition, these vessels are leaky and hemorrhagic from overproduction of vascular endothelial growth factor (VEGF). Due to these differences, tumor angiogenesis is an important parameter for tumor diagnosis and can be detected with PAT. A single-element unfocused ultrasound transducer (3.5 or 20 MHz) based PACT (see section 2.1.1) was employed to image tumor angiogenesis in tumor-bearing brains of Sprague Dawley rats (~100 – 200 g) in vivo. The mammary adenocarcinoma cell line (Br7-C5)45 was transcranially injected (orthotopic inoculation, 105 monodispersed cells) into the brain cortex. One month after the intracerebral inoculation, a tumor nodule (0.5 cm in diameter) developed on the brain cortex. Figure 20A and B show two in vivo PA images of brain tumors, acquired noninvasively with 3.5- and 20-MHz ultrasonic transducers, respectively. Two corresponding close-up images of the tumors are shown in Figure 20 as well. The images were compared with the open-skull photograph of the rat brain taken after the PA imaging in Figure 20C. Irregular blood vessels with distorted shapes are easily recognized within the tumor shown in the two images. Furthermore, hemorrhagic infiltration of the parenchyma due to leaky blood vessels containing interendothelial junctions, an incomplete or absent basement membrane, and large numbers of transendothelial channels can clearly be observed in the region of the tumor.46 In the close-up image acquired with the 20-MHz transducer, the vessels show better delineated boundaries, as expected.
Figure 20.
In vivo PA images of tumor angiogenesis and the corresponding close-up images in a rat brain acquired with (A) a 3.5-MHz ultrasonic transducer and (B) a 20-MHz ultrasonic transducer. (C) Photograph of the rat brain LH, left cerebral hemisphere; V, blood vessels; E, eyes; T, tumor. (Reprinted with permission from ref 13. Copyright 2005 The Optical Society of America.)
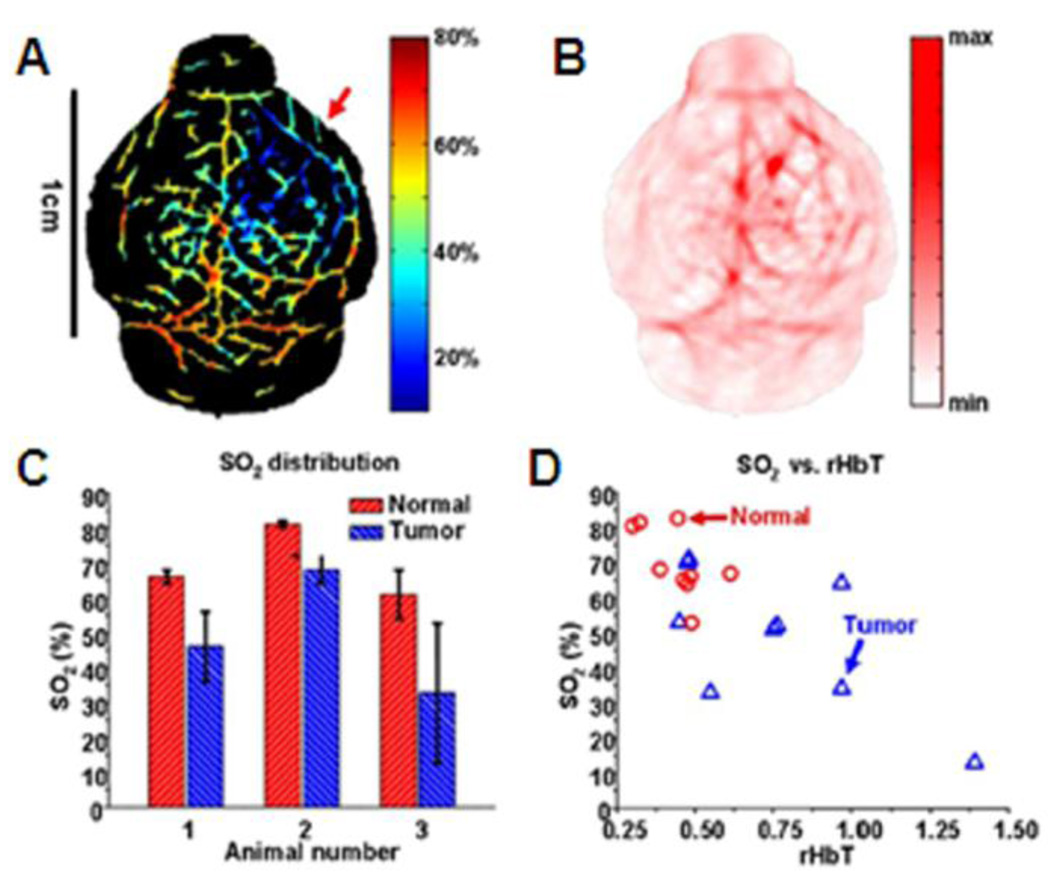
Tumor hypoxia47,48 is a situation in which tumor cells lack oxygen. Some regions of the tumor have lower oxygen concentration than healthy tissue. Tumor hypoxia is primarily caused by unbalanced oxygen consumption compared with oxygen supply due to the abnormal tumor vasculature. As described above, tumor vasculature is extremely abnormal and is marked by random vascular dilations and networks, elongated and tortuous structures, and lack of flow regulation. These effects cause severe deficiencies in the perfusion of oxygen and nutrients, leading to ischemic hypoxia. In addition, those cells in the hypoxic zone are quiescent and prevent not only oxygen but also anti-cancer agents from penetrating. Tumor hypoxia is a distinctive feature, important for tumor diagnosis, and can be imaged with PAT. A single-element unfocused ultrasound transducer (10 MHz) based PACT (see section 2.1.1) was used to image tumor hypoxia in tumor-bearing brains of nude mice (~ 20 g) in vivo. Human U87 glioblastoma tumor cells were inoculated stereotactically into mice. 1 × 10⁶ cells of 7 µl were inoculated intracranially into the caudate nucleus at a 3 mm depth from the skin surface.49 Four optical wavelengths (764, 784, 804, and 824 nm) were applied sequentially to obtain spectrally different PA images. Figure 21A and B show the SO2 (estimated with Eq. 6) and HbT (estimated with Eq. 7) mapping on the tumor-bearing brain in a nude mouse, respectively. The SO2 in the tumor region is lower than the surrounding blood vessels indicating tumor hypoxia; the HbT is higher indicating probable angiogenesis. SO2 and HbT values from normal and tumor vasculatures were quantified in Figure 21C. The averaged SO2 within the tumor is at least 13% lower than in the normal vasculature. In addition, the SO2 level in the tumor is more heterogeneous as indicated by the error bars. Hence, a relative HbT (rHbT)—defined as the ratio of the local HbT to the mean HbT in the medium fissure of each mouse—is adopted. Figure 21D show the plot of SO2 versus relative HbT (rHbT) between the normal and tumor vasculatures. The normal vessels tend to have a lower rHbT, a higher SO2, and a lower SO2 fluctuation as compared to the tumor vessels.
Figure 21.
In vivo functional PA images of U87 glioblastoma xenograft in a nude mouse brain. (A) SO2 image of the nude mouse brain (Red arrow: hypoxic region). (B) HbT image of the nude mouse brain. (C) Comparison of normal and tumor vasculatures in SO2 (N = 3). (D) The SO2 versus the relative HbT in normal and tumor vasculatures. (Reprinted with permission from ref 42. Copyright 2008 The Institute of Electrical and Electronics Engineers, Inc.)
3.5. Label-free functional chronic imaging of wound healing process using OR-PAM50
Chronic imaging of long-term microhemodynamics plays an important role in the studies of disease progression,51,52 neural dynamics,53 and functional recovery from pathological states.54 Since the current microvascular imaging techniques require invasive procedures and/or fluorescence labeling, these effects disturb the normal physiology of the microcirculation, discourage chronic studies, and impede clinical translations. By avoiding invasiveness and photo-toxicity, label-free OR-PAM (see section 2.2.3) is an ideal imaging technique for chronic microcirculation studies. The healing process of a laser-induced microvascular lesion in a nude mouse ear was monitored over a period of 12 days. At each stage of the chronic imaging, the corresponding transmission-mode optical microscopic photograph (left column in Figure 22) was acquired along with an OR-PAM image (middle column in Figure 22) at 570 nm. The SO2 values (right column in Figure 22) within the microvascular lesion were estimated using two optical wavelengths, 570 nm (isosbestic point) and 578 nm (oxyhemoglobin dominant). Directly after acquiring the images in Figure 22A, a microvascular lesion in the nude mouse ear was created by 150-mW continuous wave (cw) laser illumination in the middle of the region of interest (ROI). This ROI was imaged immediately after the cw laser treatment (Figure 22B), and in the subsequent 12 days (Figure 22C, (C-1)–(C-12) using both the OR-PAM and a conventional optical microscope. Four steps of the wound healing process were observed:55 (1) Vessel regression and hemostasis immediately following the laser treatment (Figure 22B); (2) inflammation (in the forms of vasodilation), which began 24 hours after the injury and lasted for about 5 days (Figure 22C, (C-1)–(C-5)). Hypoxia facilitated the synthesis of the VEGF to trigger angiogenesis (Figure 22B and 22C, (C-1)–(C-5)); (3) the growth of new capillaries, previously supplied by the damaged arteriole and observable after 3 days of the treatment (Figure 22C, (C-3)); (4) after 12 days, the damaged arteriole-venule pair was almost completely recovered (Figure 22C, (C-12)). The wound healing process could only partially be monitored by the commercial transmission-mode optical microscope.
Figure 22.
In vivo noninvasive OR-PAM monitoring of the healing process of a laser-induced microvascular lesion. (A) Before laser treatment. (B) Immediately after laser treatment. (C) On each of the subsequent 12 days. Left column, Photographs taken by a commercial transmission-mode optical microscope; middle column, the front view of the 3D microvascular morphology acquired by OR-PAM at 570 nm; right column, SO2 mapping of the laser-damaged region overlaid with the morphological PA image. (Reprinted with permission from ref 50. Copyright 2009 The American Association of Physicists in Medicine.)
4. Functional and molecular PAT using exogenous contrasts
Intrinsic optical contrasts, such as hemoglobin and melanin, are highly promising for PAT, but these contrasts significantly absorb light and generate strong PA signals in the visible spectral region. Due to both strong optical absorption and scattering, the light penetration depth is quite limited in this spectral region and the maximum imaging depth is shallow. To image in deep tissues, the use of near-infrared (NIR) light is highly desirable for optical imaging. Exogenous contrast agents greatly enhance the sensitivity of PAT in the NIR spectral region. Additionally, some biological targets do not have intrinsic optical absorption contrast for PAT in the visible and near-infrared (NIR) regimes. One such important example is the lymphatic system. Through the use of contrast agents in PAT, imaging sensitivity and specificity are significantly improved just as in CT, PET, and MRI. Optically absorptive organic dyes, nanoparticles, reporter genes and fluorescence proteins have been successfully applied as PA contrast agents.
4.1. Organic dyes
4.1.1. Indocyanine green (ICG)56,57
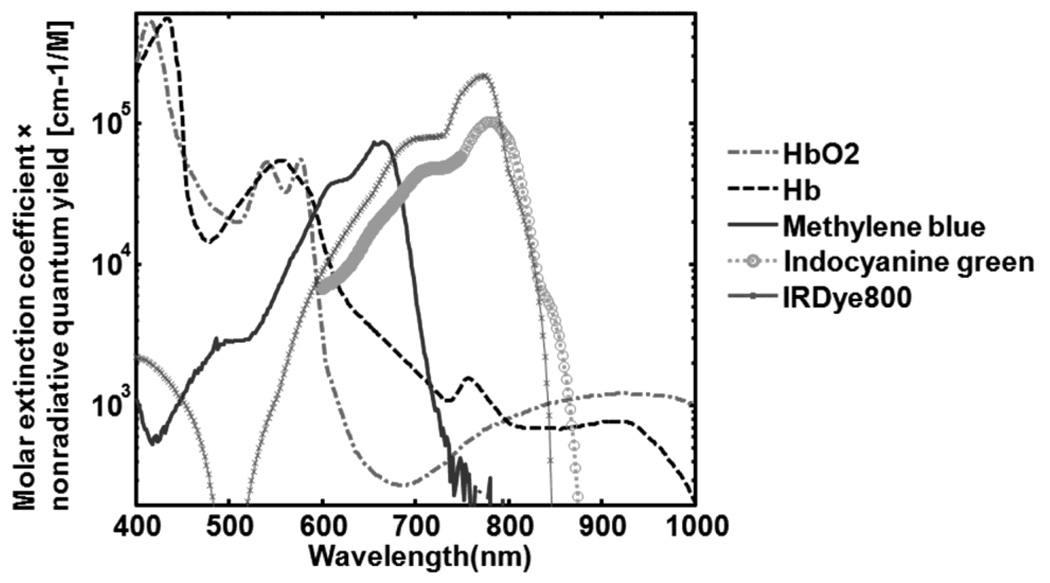
Indocyanine green (ICG) is a nontoxic, water-soluble tricarbocyanine dye with a peak optical absorption at 790 nm.58 The penetration depth of PA imaging using ICG can be increased using NIR light. The chemical structure of ICG is shown in Figure 23. ICG is FDA-approved for determining human cardiac output, hepatic function and blood flow, and ophthalmic angiography. Because ICG has a moderate fluorescence quantum yield (~10% in DMSO and less than 1% in water)59, it emits a sufficient amount of fluorescence and generates strong PA signals and as such can be used as a contrast agent for both fluorescence and PA imaging. Typical optical, chemical, and physical parameters of ICG are summarized in Table 1. The product of the molar extinction coefficient profile and the nonradiative quantum yield (1 – fluorescence quantum yield) of ICG is shown in Figure 31, where the effect of the internal conversion on the energy conversion is neglected. Due to aggregation of ICG molecules, the spectrum of ICG in water is highly unstable as the concentration is increased.60 The spectrum changes are also caused by protein binding.
Figure 23.
Chemical structure of ICG.58
Table 1.
Summaries of chemical and optical properties of organic dyes.
| Dyes | Indocyanine green58 | IRDye800-NHS62 | Methylene blue67,74 |
|---|---|---|---|
| Molecular weight [g/mol] | 775 | 1165 | 320 |
| Molecular formula | C43H47N2NaO6S2 | C50H54N3Na3O17S4 | C16H18N3ClS |
| Peak molar extinction coefficient [cm−1M−1] |
1.5 × 10⁵ | 2.7 × 10⁵ | 7.4 × 10⁴ |
| Peak absorption wavelength [nm] | 790 | 795 | 667 |
| Fluorescence quantum yield [%] | 10% in DMSO < 1% in water |
15% | 0.04% |
| Peak molar extinction coefficient × nonradiative quantum yield [cm−1M−1] |
1.4 × 10⁵ | 2.3 × 10⁵ | 7.1 × 10⁴ |
Figure 31.
Molar extinction profiles of oxyhemoglobin (HbO2), deoxyhemoglobin (Hb), and organic dyes multiplied by nonradiative quantum yield.
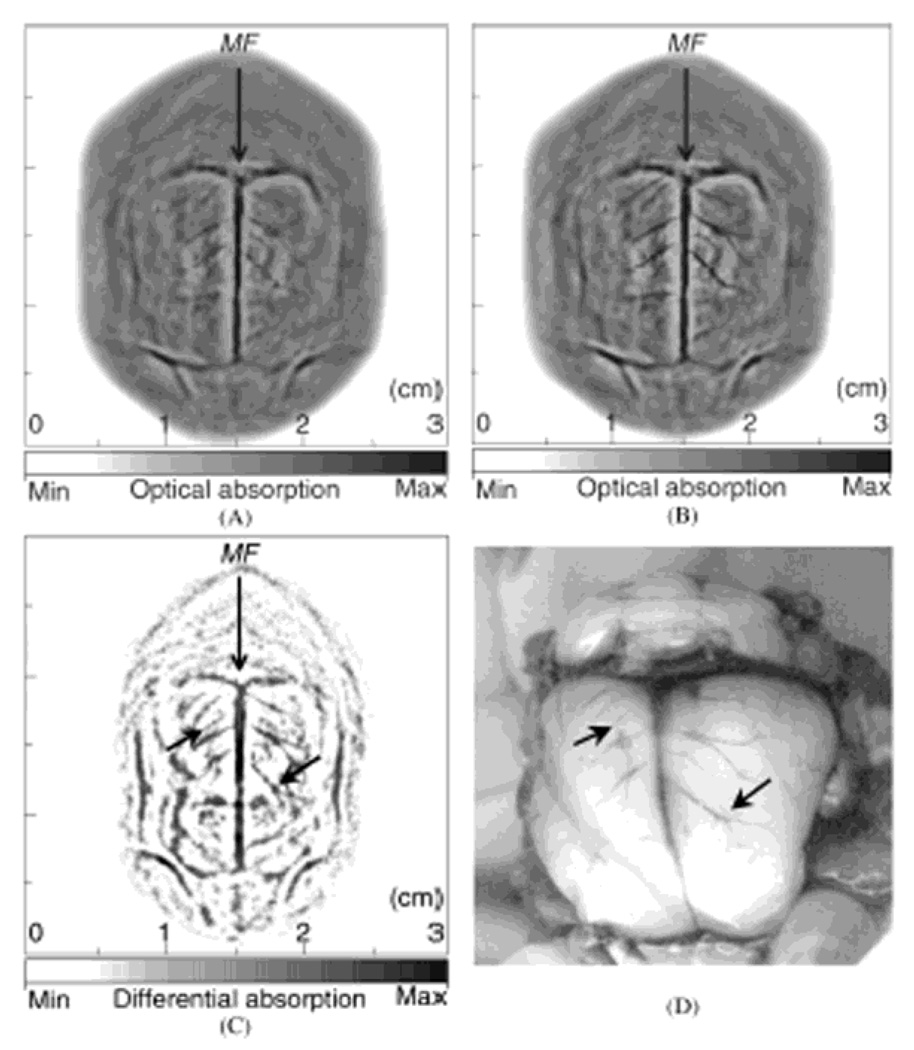
A single-element unfocused ultrasound transducer (10 MHz) based PACT (see section 2.1.1) was employed to assess the contrast enhancement in brain cortical structures in Sprague Dawley rats (~150 g) in vivo. Polyethylene glycol (PEG) was used to stabilize the ICG, thereby prolonging its circulation time in blood.61 This PEG conjugated ICG (ICG-PEG) highly absorbs light around an optical wavelength of 805 nm. The ICG-PEG (the concentration = 320 µM) in phosphate buffered saline was injected intravenously through the tail vein. A dosage of 0.25 ml/100 g body weight was administered and the estimated ICG concentration in blood was ~ 10 µM. Based on the injection dose, the number of detectable molecules in one resolved volume (60 µm × 60 µm × 60 µm with the z dimension limited by the blood vessel diameter) is ~ 2 fmol per imaging voxel. Figure 24A and B show the noninvasive PA images of a rat brain cortex before and after the ICG-PEG injection, respectively. The brain cortical structures of two PA images match well with the photograph (Figure 24D) taken after the PA imaging. The subtracted image (Figure 24C) between pre- and post-injection images shows increased PA signals due to the ICG injection. Moreover, this subtracted image shows a more detailed vasculature (indicated as black arrows in Figure 24C) than the images in Figure 24A and B.
Figure 24.
In vivo noninvasive PA images of a rat brain using ICG-PEG as contrast agents. (A) and (B) PA images obtained before and after the injection, respectively. MF, median fissure. (C) Subtracted PA image between before and after the injection (C = B - A). (D) Open-skull photograph after the PA imaging. (Reprinted with permission from ref 57. Copyright 2004 The Optical Society of America.)
To demonstrate the benefits of using contrast agents for deep PA imaging, the maximum imaging depth was increased to 5.2 cm in biological tissues, imaged ex vivo. Three pairs of transparent plastic tubes containing anticoagulation-treated whole rat blood, ICG solution in water (323 mM), and ICG solution in blood (129 mM), were embedded in chicken breast tissues of ~7.5-cm diameter in their transverse cross sections (Figure 25A). The optical coefficients of blood, ICG in water, and ICG in blood are ~ 4–5 cm−1, 16 cm−1, and 43 cm−1 at 800 nm, respectively.60 A single-element unfocused ultrasound transducer (2.25, 3.5, or 5 MHz) based PACT (see section 2.1.1) was employed. Cross-sectional PA images were acquired by layering chicken breast tissues, so the imaging depth from the laser illumination surface was increased from 1.3 to 5.2 cm (Figure 25B). Figure 25C – F show the PA images obtained at various depths (1.3, 2.6, 4.2, and 5.2 cm) using a 2.25-MHz transducer. The PA signals from the whole blood are not visible below 2.6 cm deep. However, the PA signals from ICG in water and ICG in blood are clearly discernible at depths reaching 5.2 cm. The PA signals from ICG in blood are stronger than those from ICG in water which agree well with the above mentioned optical absorption coefficients of two solutions. Figure 25G and F show the cross-sectional PA images at the depth of 5.2 cm using 3.5 and 5 MHz ultrasonic transducers, respectively. Despite lower SNR’s at higher ultrasonic frequencies, the spatial resolution is better with the 5-MHz transducer.
Figure 25.
Two-dimensional cross-sectional PA images at various depths in biological tissues. Photographs of (A) the cross section of chicken breast tissues where three pairs of tubes (whole blood, ICG in water, and ICG in blood) are embedded and (B) the entire sample. Two-dimensional PA images using a 2.25-MHz ultrasonic transducer at depths of (C) 1.3, (D) 2.6, (E) 4.2, and (F) 5.2 cm. Two-dimensional PA images at a 5.2-cm depth acquired by (G) 3.5- and (H) 5.0-MHz ultrasonic transducers. (Reprinted with permission from ref 56. Copyright 2005 The Optical Society of America.)
4.1.2. IRDye-800 as molecular imaging contrast agents42
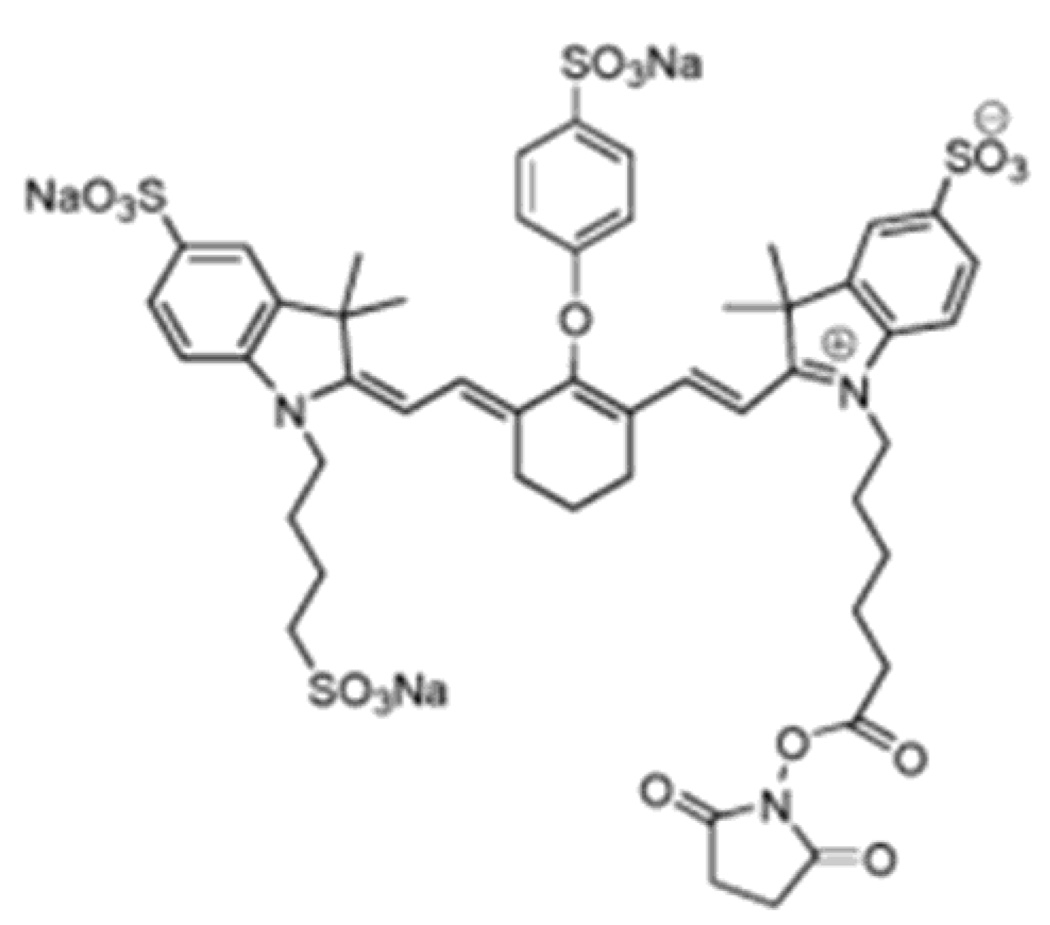
ICG is hard to be functionalized for labeling. IRDye 80062 is a water-soluble ICG derivative dye for protein/antibody labeling applications. By adding the NHS ester reactive group, IRDye800-NHS is able to be functionalized for labeling primary and secondary amino groups. The chemical structure of IRDye800-NHS is shown in Figure 26. Typical optical, chemical, and physical parameters of IRDye800-NHS are summarized in Table 1. The product of the molar extinction coefficient profile and the nonradiative quantum yield of IRDye-NHS is shown in Figure 31.
Figure 26.
Chemical structure of IRDye800-NHS. 62
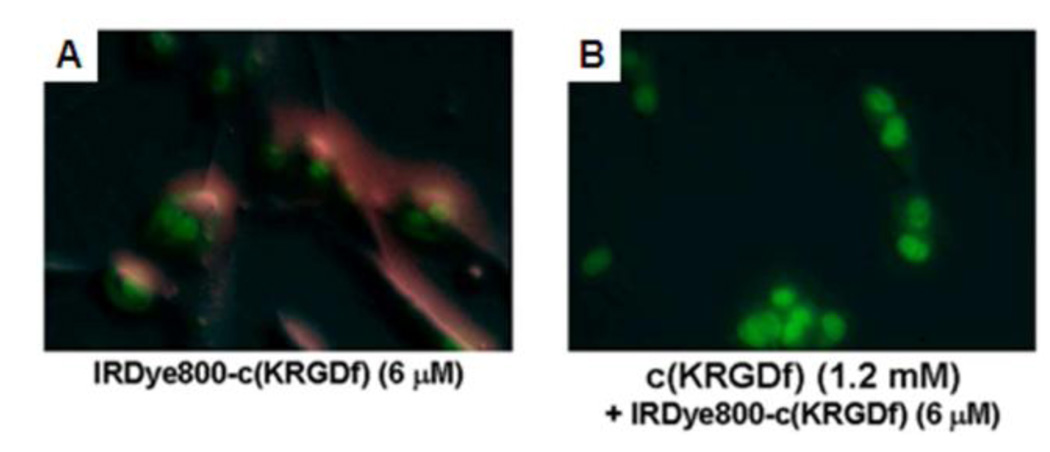
A single-element unfocused ultrasound transducer (10 MHz) based PACT (see section 2.1.1) was employed to image molecular contrast enhancement in nude mice (~ 20 g) in vivo using IRDye800-NHS as a contrast agent. Human U87 glioblastoma tumor cells (1 × 10⁶ cells of 7 µl) were inoculated intracranially into the caudate nucleus at a 3 mm depth from the skin surface.49 IRDye800-NHS was conjugated with cyclic peptide cyclo(Lys-Arg-Gly-Asp-Phe), which targets integrin αvβ3 (referred to as IRDye800-c(KRGDf)63). Since IRDye800 absorbs light and emits fluorescence in the NIR regime; the former affects contrast in PACT and the latter affects contrast in fluorescence imaging, it can be used as a contrast agent for both imaging techniques. PAT was used to image the level of IRDye800-c(KRGDf) uptake in the brain tumor xenograft. First, before the injection, simultaneous SO2 and HbT maps in the brain were acquired (see section 3.4). Conventional planar fluorescence imaging was employed to confirm the contrast-agent uptake. Integrin αvβ3 is overexpressed in newly formed tumor microvasculatures and important in progression, angiogenesis, and metastasis of melanoma and glioblastoma.64 Figure 27 shows the binding capability of IRDye800-c(KRGDf) to U87 tumor cells in vitro.
Figure 27.
In vitro binding test of IRDye800-c(KRGDf) to integrin αvβ3 overexpressed U87 tumor cells. (A) Fluorescence image of IRDye800-c(KRGDf) (6 µM) incubated U87 cells for 3 min. (B) Fluorescence image of U87 cells incubated with an excess 1.2 mM of c(KRGDf) for 5 min and then followed by a 6 µM of IRDye800-c(KRGDf) for 3 min. Red: IRDye800-c(KRGDf); green: Sytox green-labeled cell nuclei. (Reprinted with permission from ref 42. Copyright 2008 The Institute of Electrical and Electronics Engineers, Inc.)
Twenty hours after the intravenous injection of IRDye800-c(KRGDf), the mice were imaged first by a planar fluorescence imaging system and then by the PACT system. After the dual-modality imaging experiments, the brain was histologically analyzed to validate the results. The uptake of the IRDye800-c(KRGDf) in the tumor was first proven by the fluorescence imaging in Figure 28A. Figure 28B and C show in vivo molecular PACT image of IRDye800-c(KRGDf) and a composite image superimposing the segmented molecular PACT image (ultrasonic frequency, 2.25 MHz; in-plane spatial resolution, 312 µm) onto the structural image (ultrasonic frequency, 10 MHz; in-plane spatial resolution, 60 µm; optical wavelength, 804 nm) of the brain cortex, respectively. The uptake of the contrast agents is clearly seen in these PA images.
Figure 28.
In vivo molecular PA images of a nude mouse brain with a U87 glioblastoma xenograft using IRDye800-c(KRGDf) as a molecular contrast agent. (A) A composite image of a fluorescence image and white-light photograph of the mouse head acquired 20 h after the injection. (B) In vivo molecular PA image of IRDye800-c(KRGDf). (C) A composite image of a segmented molecular and structural image, both acquired with the PACT system. (Reprinted with permission from ref 42. Copyright 2008 The Institute of Electrical and Electronics Engineers, Inc.)
4.1.3. Methylene blue (MB) as a contrast agent on sentinel lymph node (SLN) mapping65
Methylene blue (MB)66,67 is a heterocyclic aromatic chemical compound widely used in biology and chemistry. In biology, MB is used as a stain in bacteriology and as an oxidation-reduction indicator.68,69 The chemical structure of MB is shown in Figure 29. Typical optical, chemical, and physical parameters of MB are summarized in Table 1. The product of the molar extinction coefficient profile and the nonradiative quantum yield of MB is shown in Figure 31.
Figure 29.
Chemical structure of methylene blue (MB).67
Sentinel lymph node biopsy (SLNB), i.e., the biopsy of the first lymph node receiving drainage from a cancer-containing area, has become the standard procedure for staging breast cancer patients to reduce the postoperative complications of axillary lymph node dissection (ALND).70 Although SLNB with blue dye (lymphazurin blue or methylene blue) and radioactive tracers has an identification rate of 90–95% and a sensitivity of 88–95%, these methods still require ionizing imaging tools and intraoperative procedures. Moreover, they can fail to identify axillary disease owing to a false negative rate of 5–10%.71 SLNB, despite being less invasive than ALND, still poses significant side effects.72 Recently, ultrasound-guided fine needle aspiration biopsy (FNAB) has been tested and clinically evaluated as a minimally invasive biopsy procedure.73 However, this technique requires accurate identification of the SLN. Therefore, there is still a pressing need to develop an accurate, non-ionizing, and noninvasive detection method for lymph node assessment. Thanks to the strong optical absorption coefficient of MB, PA imaging can be an alternative method to localize a SLN both accurately without the use of any ionizing radiation. In the United States, lymphazurin blue (LB)74 is the only dye approved by FDA for SLN identification in breast surgery. However, LB causes following the complications: allergic and anaphylactic type I hypersensitivity reactions, skin pigmentation, and discoloration of body fluids. In addition, the supply of LB is insufficient and LB is more expensive than MB. MB is more widely used in SLNB because it is more readily available and cost-effective. Furthermore, although MB causes more skin staining, no anaphylaxis has been reported for SLNB.
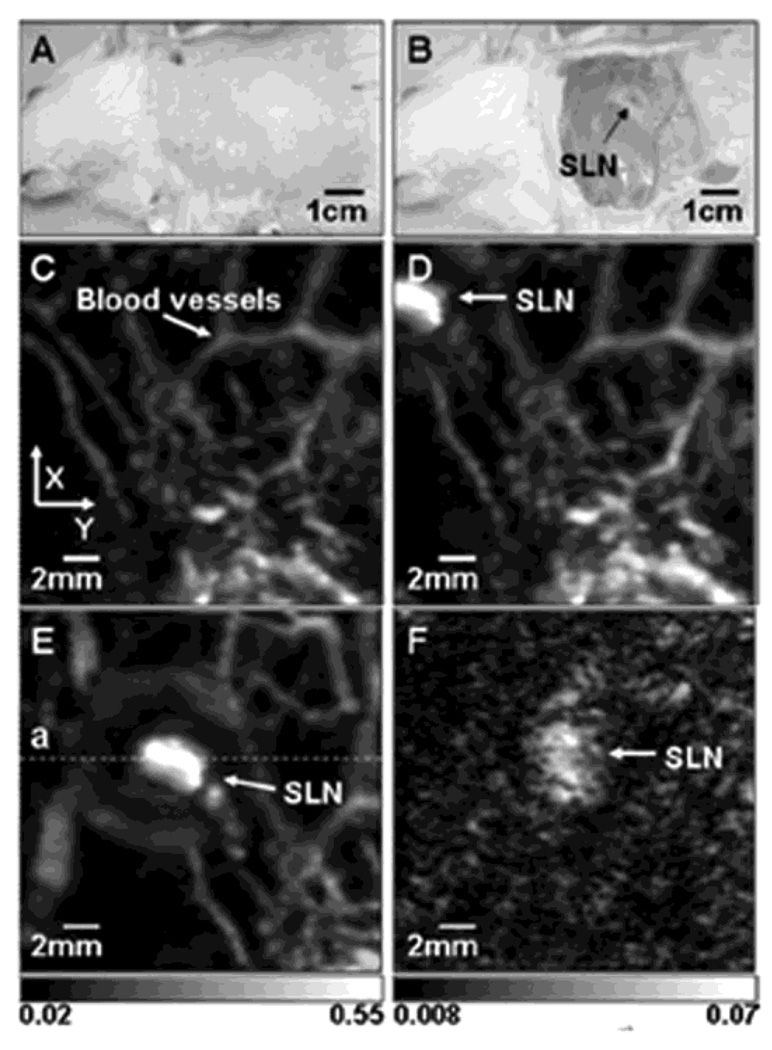
A deep reflection-mode PAM system (see section 2.2.2) was employed to map SLNs noninvasively in Sprague Dawley rats (~ 250 – 350 g) using MB. An ultrasonic frequency of 5 MHz and an optical wavelength of 635 nm were used in this system. The incident laser fluence on the rat skin was 3.4 mJ/cm2, within the ANSI safety limit (20 mJ/cm2).22 After removing hairs on the rat skin, a control image was acquired. 0.07 ml of 1% MB (10 mg/mL) was intradermally injected on a left forepaw pad. After the administration of MB, a series of PA images were acquired. Figure 30A and B show photographs of a rat taken before and after image acquisition, respectively. After PA imaging, the rat’s skin was removed to identify the MB dyed lymph node (Figure 30B). The surrounding vasculature in the axillary area is clearly seen with an image contrast of 7 ± 0.5 with respect to the background in the control image (Figure 30C). The SLN appeared immediately after the injection of MB with an image contrast of 12 ± 2, seen in Figure 30D. The SLN was still observed 50 min post-injection after the scan head was repositioned (Figure 30E). The mean depth of top surface of human SLNs is 12 ± 5 mm in ultrasonography. To determine the feasibility of PAT in human SLN imaging, the imaging depth was increased to 18 mm by adding chicken tissues on top of the rat. Although the blood vessels faded away, the SLN is still clearly seen in Figure 30F.
Figure 30.
In vivo noninvasive PA images of the SLN in a rat. (A) Photograph with hair removed before PA imaging. (B) Photograph with skin removed after PA imaging. (C) Control image before the MB injection. (D) PA image immediately after the injection. (E) 52 min post-injection PA image with the scan head repositioned. (F) PA image of the deeply positioned (~ 18 mm) SLN. (Reprinted with permission from ref 65. Copyright 2008 Society of Photo-Optical Instrumentation Engineers.)
Table 1 summarizes the optical, chemical, and physical parameters of organic dyes. The product of the molar extinction coefficients and nonradiative quantum yield values, defined as the difference of the fluorescence quantum yield from 1, of various organic dyes are shown in Figure 31. The molar extinction coefficients of oxy (HbO2) and deoxyhemoglobin (Hb) are also plotted in the same figure.
4.2. Nanoparticles
Nanoparticles have received considerable attention in biomedical applications, since it has been proven that they can be utilized effectively for delivering75,76 and targeting77,78 therapeutic agents to a specific site and as contrast agents for diagnostic purposes.78–80 Due to their tunable properties such as sizes, shapes, and compositions, nanoparticles are widely used to enhance image contrasts throughout biomedical imaging fields, including optical imaging,78,81,82 magnetic resonance imaging (MRI), 83–85 and x-ray computed tomography (CT).86,87 The basic theories and fabrication processes of gold nanostructures (gold nanospheres, gold nanoshells, gold nanorods, and gold nanocages) used in PAT were reviewed in ref 88. In this article, the biomedical applications of gold nanostructures in conjunction with PAT will be reviewed.
4.2.1. Gold nanocages89,90
Gold nanocages are hollow porous nanoparticles with a broad range of sizes (35–100 nm). Gold nanocages have been used as a contrast agent in PA imaging because of biocompatibility, easily modifiable surfaces for targeting,91,92 a lack of heavy metal toxicity,93 a tunable localized surface plasmon resonance (LSPR) peak, encapsulated site-specific drug delivery,94 and strong optical absorption in the NIR spectral region.38,91
Gold nanocages were prepared by titrating silver nanocubes with aqueous HAuCl4.94–100 Silver nanocubes with an edge length of ~30 nm (Figure 32A) were synthesized using a polymer-mediated polyol method, which involves reduction of silver nitrate by ethylene glycol at 160 °C.101–103 In general, the size of the nanocubes could be varied by controlling the reaction time. The silver nanocubes can then serve as sacrificial templates and be converted into gold nanocages via a galvanic replacement reaction, , with HAuCl4 in water under refluxing (Figure 32B). The edge length of the subsequent gold nanostructure increased from 30 to 36 nm because the gold was deposited around the outer surface of the silver template. The ensuing gold nanocages have a strong absorption peak, determined by the ratio of the wall thickness to edge length. Experimentally, we can easily and precisely control this parameter by varying the molar ratio of Ag to HAuCl4 in a fashion similar to acid-base titration. Figure 32C shows the extinction spectra measured for the 30-nm silver nanocubes and the resultant gold nanocages with the extinction peak specifically tuned to 800 nm. Using the discrete dipole approximation (DDA) method, we can predict the exact scattering and absorption components (Figure 32D) for the gold nanocages. The calculated and measured spectra agree well in terms of peak position. Calculations indicate that absorption is predominant for gold nanocages <50 nm in size.104
Figure 32.
(A)Transmission electron microscopy (TEM) image of 30-nm silver nanocubes synthesized with a growth time of 20 h. (B) Scanning electron microscopy (SEM) image of gold nanocages prepared with the silver cubes as a sacrificial template. The inset shows a TEM image of the same sample. (C) Extinction spectra taken from aqueous suspensions of the silver nanocubes and the corresponding gold nanocages. (D) Spectra calculated using the DDA method for a gold nanocage with the dimensions shown in the inset (extinction = absorption + scattering). (Reprinted with permission from refs 91,104. Copyright 2005 American Chemical Society.)
Using established alkanethiol chemistry, the surface of the gold nanocages can be easily functionalized with tumor-targeting moieties such as antibodies or polypeptides. 104 For instance, the surface of gold nanocages can be derivative with thiol molecules containing the poly-ethylene-glycol (PEG) segment and N-hydroxysulfosuccinimide (NHS) terminus, a facile leaving group for amide bond formation. The NHS terminus can be coupled into the antibodies (Figure 33A). To confirm the effectiveness of bioconjugation, the targeting specificity was studied in vitro. As an example, a breast cancer cell line (SK-BR-3), which is known to overexpress HER2 receptor on its surface, was chosen for demonstration. Monoclonal antibodies (i.e. anti-HER2) were employed to target the receptors. Figure 33B shows a scanning electron microscopy (SEM) image taken from a representative cancer cell whose surface was directly targeted with anti-HER2-derivatized gold nanocages, revealing the molecular specificity and high coverage of nanocages on the cell surface. As a control, the SK-BR-3 cells were incubated with PEGylated gold nanocages that did not have anti-HER2 attached. The SEM image (Figure 33C) shows essentially no gold nanocages on the cell surface. These results demonstrate that the immuno gold nanocages can selectively target the specific receptor expressed on cancer cell surface.
Figure 33.
(A) Schematic illustration of the formation of immuno gold nanocages. (B) SEM image of a typical SK-BR-3 cancer cell whose surface was directly targeted by immuno gold nanocages of 36 nm in size. The inset shows an image at higher magnification (scale bar = 100 nm). (C) SEM image of a typical SK-BR-3 cell that had been incubated with PEGylated nanocages (i.e., no specific targeting), showing essentially no nanocages on the surface. (Reprinted with permission from refs 91,104. Copyright 2005 American Chemical Society.)
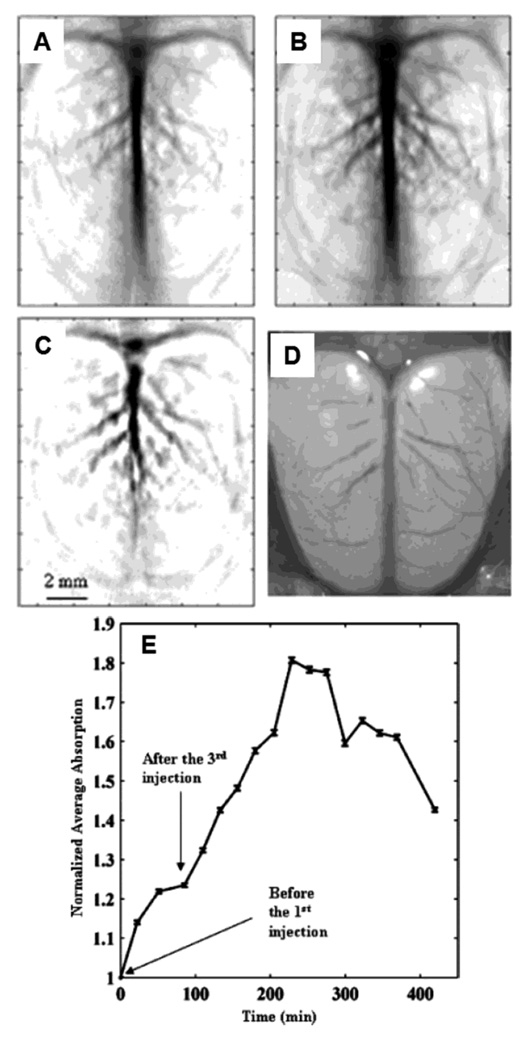
A single-element unfocused ultrasound transducer (10 MHz) based PACT (see section 2.1.1) was employed to confirm the contrast enhancement of gold nanocages for PA imaging in vivo. PEGylated gold nanocages were injected into Sprague Dawley rats (100 – 150g) via the tail vein and PA images of its cerebral cortex were recorded. Three successive injections of nanocages were administrated, each with a dose of ~0.8 × 10⁹ nanocages/g body weight. The data were acquired before and after injection up to 3 hours with a optical wavelength of 804 nm. Figure 34A shows the structural image of the rat brain, measured from intrinsic optical contrast, before injection of PEGlyated nanocages, while Figure 34B shows a better resolved image of the same rat brain after the injection. Figure 34C shows the subtracted image between the pre-injection image (Figure 34A) and the post-injection image (Figure 34B). All PA images of the rat brain cortex (Figure 34A–C) match well with the open-skull anatomical photograph in Figure 34D. The enhancement of PA signals due to gold nanocages was quantified as a function of time in Figure 34E. At 2 hours after the final injection, the PA signal was increased maximally by ~ 81%, after which the signal gradually cleared out from the blood.
Figure 34.
In vivo noninvasive PA images of the cerebral cortex acquired (A) before the injection, and (B) ~2 h after the final of PEGylated nanocages via tail vein. (C) A differential image (34B subtracted from 34A). (D) An open-skull photograph of the rat’s cerebral cortex. (E) Quantification of the PA signal enhancement after the injection as a function of time. (Reprinted with permission from ref 90. Copyright 2007 American Chemical Society.)
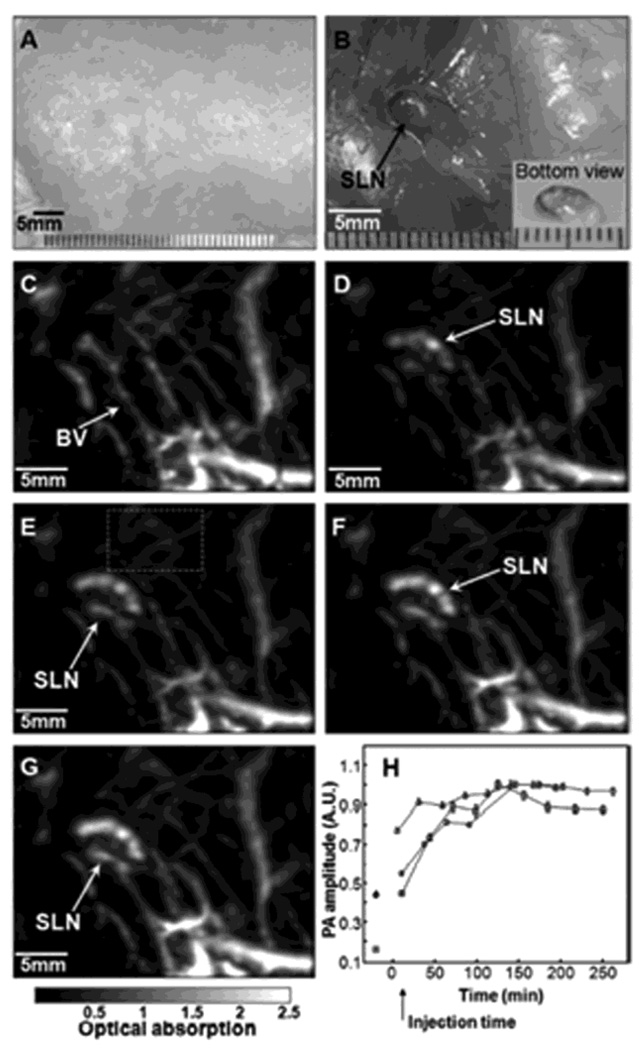
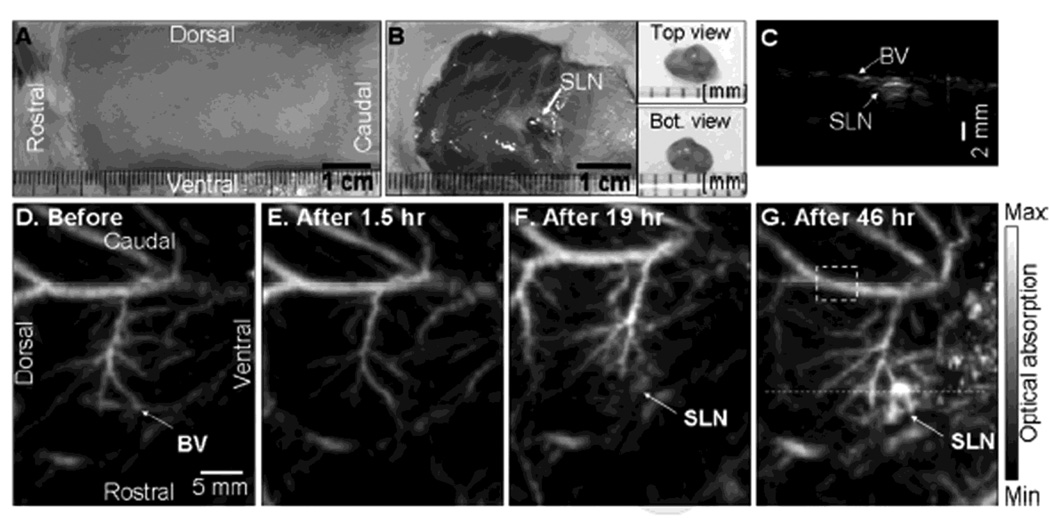
In another demonstration, 100 µL of 2 nM gold nanocage solutions were intradermally injected on the left forepaw pads of Sprague Dawley rats (250 – 350 g) to image sentinel lymph nodes noninvasively. The deep reflection-mode PAM system (see section 2.2.2) was employed. Figure 35A shows a photograph of the axilla of a rat after the hair was removed and before PA imaging. The photograph in Figure 35B shows the same region of the rat with the skin removed and the SLN containing gold nanocages after the PA imaging. The control image is shown in Figure 35C, captured prior to the injection of gold nanocages. The surrounding vasculature is clearly seen in the control image. The SLN was detectable about 5 min after the injection (Figure 35D). Figure 35E–G show the time-course of PA images acquired at 54 min, 135 min, and 189 min after the injection, respectively. Figure 35H shows the increase of PA signal in the SLN as a function of time. As time elapsed, the gold nanocages gradually accumulated and the PA signal within the SLN was increased. The peak accumulation time of gold nanocages in the SLN was observed to be about 140 min after the injection.
Figure 35.
Noninvasive in vivo PA images of the SLN in a rat. (A) Photograph of axillary region with hair removed before the injection of gold nanocages. (B) Photograph with skin removed after the PA images had been captured. PA images acquired before (C) and after (D–H) the nanocage injection: (D) 5 min (SLN started to appear), (E) 59 min, (F) 140 min, (G) 194 min. (H) The increase of PA signal in the SLN as a function of time. BV, blood vessels; SLN, sentinel lymph node. (Reprinted with permission from ref 89. Copyright 2009 American Chemical Society.)
4.2.2. Gold nanoshells82,105,106
Gold nanoshells comprised of silica cores (~116 nm in diameter) coated with an thin gold shell (~14 nm) have widely tunable plasmon resonances in the visible and near-infrared regimes.107 The absorption peaks of these nanoshells are tunable by varying the core size relative to the thickness of the gold shell. In addition, the optical absorption properties of the gold nanoshells also depend on rigid metallic structures, unlike organic dyes, whose optical properties are determined by molecular orbital electronic transitions. Due to their excellent biocompatibility, gold nanoshells have been widely used in photothermal therapy108 and as diagnostic contrast agents.82,105 PEGylated gold nanoshells has longer blood circulation time.
A single-element unfocused ultrasound transducer (10 MHz) based PACT (see section 2.1.1) was employed to confirm the contrast enhancement of gold nanoshells for PA imaging in vivo. The extinction spectrum of the gold nanoshells peaked at 800 nm, accordingly an 800 nm laser excitation wavelength was used in PA imaging. PEGylated gold nanoshells were injected into Sprague Dawley rats (130 – 160g) via the tail vein and then a series of PA images were acquired of their cerebral cortexes. The nanoshells were administrated three times successively. Each dose was ~0.8 × 10⁹ nanoshells/g body weight. After the final injection, the rat brain was imaged sequentially 10 times for more than ~6 h. Figure 36A shows the brain cortical vasculature before injection of PEGlyated nanoshells. A PA image of rat brain cortex is shown in Figure 36B, acquired ~20 min after the injection. Figure 36C shows the subtracted image between the pre-injection image (Figure 36A) and the post-injection image (Figure 36B). This image shows the distribution of increased optical absorption in the rat brain due to the injection of PEGlyated nanoshells. All PA images of the rat cerebral cortex (Figure 36A–C) match well with the open-skull anatomical photograph in Figure 36D taken after the PA imaging. The time-course PA signal increase was quantified in Figure 36E. The maximal increase of PA signal was ~ 63%. After that, the signal gradually decreased.
Figure 36.
In vivo noninvasive PA images of the cerebral cortex acquired (A) before the injection, and (B) ~20 min after the final injection of PEGylated nanoshells via tail vein. (C) A differential image (36B subtracted from36A). (D) An open-skull photograph of the rat’s cerebral cortex showing that the PA images agreed with the location of blood vessels. (E) Quantification of the PA signal enhancement after the injection as a function of time. (Reprinted with permission from ref 82. Copyright 2004 American Chemical Society.)
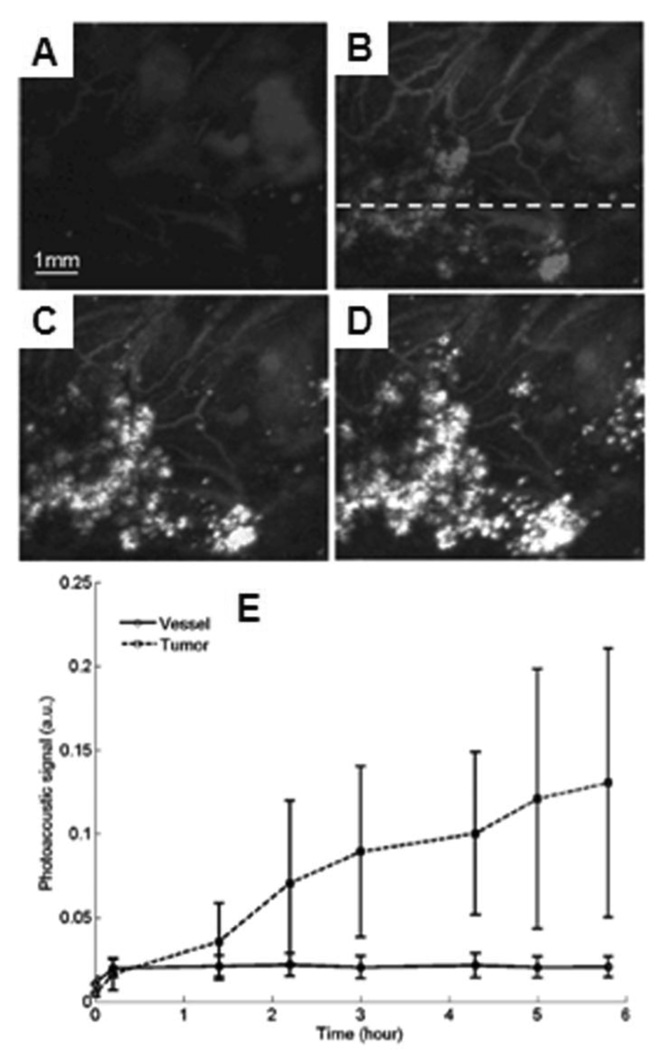
In another demonstration, the 50-MHz dark-field confocal PAM (see section 2.2.1) was employed to image progressive extravasation and accumulation of nanoshells within a solid tumor in vivo. Immunocompetent BALB/c mice (~ 20g) were inoculated with CT26.wt murine colon carcinoma cells subcutaneously on the mice brains. Imaging was performed 7 days after tumor inoculation. PEGylated nanoshells with a peak optical absorption at 800 nm were then intravenously administered at a dose of 1.4 × 10⁹ nanoshells /g body weight. A control imaged prior to the nanoshell injection was acquired in Figure 37A. After the injection, the extravasation and accumulation of nanoshells in and around the tumor was monitored for 6 h. Figure 37B – D shows the passive uptake of nanoshells at the tumor at 1.4, 3, and 5.8 h post-injection, respectively. As time elapsed, the accumulation of nanoshells at the tumor is clearly evident. Time-dependent PA signal enhancement in the vessels and tumor from the injection is shown in Figure 37E. At 5.8 h post-injection, the image contrast ratio of tumor to vessels is ~6.5.
Figure 37.
In vivo noninvasive PA images of nanoshell extravasation in a tumor. (A) Control image before the injection of nanoshells. (B), (C), and (D) PA images of accumulation of nanoshells at 1.4, 3, and 5.8 h post-injection, respectively. (E) Averaged PA signals as a function of time. Line with circles: vessel regions; dashed line with squares: tumor foci. (Reprinted with permission from ref 105. Copyright 2009 Society of Photo-Optical Instrumentation Engineers.)
A single-element focused ultrasound based PAM (48 MHz)106 was employed to investigate the feasibility of molecular PA imaging of specific tumors using targeted spherical gold nanoparticles. Three tissue phantoms with human epithelial carcinoma cells (A431 keratinocyte) were tested: (1) a control phantom without any nanoparticles; (2) a targeted phantom with EGFR (epithelial growth factor receptor) targeted gold nanoparticles; and (3) a non-targeted phantom with PEGylated gold nanoparticles. The absorbance spectra of the control, targeted, and non-targeted phantoms are shown in Figure 38A. The non-targeted phantom has a peak absorbance at 520 nm, while the peak absorbance of the targeted phantom has red-shifted and broadened due to EGFR-mediated aggregation of gold nanoparticles.109 In the control phantom, the absorbance is significantly lower throughout a wide spectral range. Based on the Figure 38A, the PA images of three phantoms shown in Figure 38B, D and F were acquired at the optical wavelength of 532 nm. The other three images, Figure 38C, E and G were obtained at 680 nm. Nothing is shown in the control images at both wavelengths in Figure 38B and C, which agrees well with the absorbance spectrum of the control phantom. Stronger PA signals are observable from the non-targeted phantom (Figure 38F) than from the targeted phantom (Figure 38D) at 532 nm; whereas opposite results were recovered when illuminated with an optical wavelength of 680 nm. These results agree well with the absorbance spectra in Figure 38A.
Figure 38.
(A) Absorbance spectra of control, targeted and non-targeted phantoms. (B), (D), and (F) PA images (λ = 532 nm) of control, targeted, and non-targeted phantoms, respectively. (C), (E), and (G) PA images (λ = 680 nm) of control, targeted, and non-targeted phantoms, respectively. (Reprinted with permission from ref 106. Copyright 2007 The Optical Society of America.)
4.2.3. Gold nanorods18,110–113
Since gold nanorods possess dielectric properties in the NIR, they have strong and narrow optical absorption band in this regime. Additionally, gold nanorods have biocompatibility, surfaces that are easily modifiable and amenable for targeting, a lack of heavy metal toxicity, and a readily tunable LSPR peak. Due to these properties, gold nanords have been widely used in photothermal therapy114 and as diagnostic contrast agents in PAT.18,110–113
A single-element focused ultrasound based PAM (50 MHz)112 was employed to demonstrate the feasibility of PA imaging of inflammatory responses using bioconjugated gold nanorods in vitro. The aspect ratio of gold nanorods was 3:1 and the peak wavelength of optical absorption was at 700 nm. Intercellular adhesion molecule-1 (ICAM-1) is a strong inflammatory mediator in systemic inflammatory diseases such as rheumatoid arthritis (RA).115 Anti-intercellular adhesion molecule-1 (anti-ICAM-1) was selected as a biomarker of inflammation and activation of endothelial cells (ECs), which binds to cell surfaces over expressing ICAM-1. Unstimulated and stimulated ECs were incubated with gold nanorods bioconjugated with anti-ICAM-1, photoacoustically imaged, and compared. Non-bioconjugated gold nanorods (blank gold nanorods) incubated in both unstimulated and stimulated ECs. 1012 nanorods/ml were used as a control for all experiments. PA signals from stimulated ECs with bioconjugated nanorods (Figure 39A) were 10 dB stronger than those from unstimulated ECs with bioconjugated nanorods (Figure 39B). This result implies ICAM-1 was over expressed on the surfaces of stimulated ECs and anti-ICAM-1 conjugated nanorods were highly bound to the cell surfaces. When blank nanorods were used, PA signals from both stimulated and unstimulated ECs did not increase significantly, as seen in Figure 39C and D, respectively. This reflects very low nonspecific binding efficiency of blank nanorods to ECs.
Figure 39.
PA images of (A) stimulated and (B) unstimulated ECs binding with anti-ICAM-1 conjugated gold nanorods, and (C) stimulated and (D) unstimulated ECs binding with blank gold nanorods. (Reprinted with permission from ref 112. Copyright 2007 American Institute of Physics.)
The custom-made ultrasonic array based PA imaging system111 was employed to investigate the feasibility of preclinical and clinical applications of PA imaging using gold nanorods as a contrast agent. A nude mouse was positioned on top of the ultrasonic array system, and light illuminated from the top. The PA imaging system consists of two parallel linear arrays of 32 acoustic transducers equipped with a real-time multichannel signal processor. The excitation laser wavelength of 757 nm was close to the peak wavelength of optical absorption of the nanorods. Using a single channel acoustic transducer, the minimum sensitivity was measured in nude mice. First, PBS (25 µL) was injected subcutaneously into the abdominal area of the mouse and a control PA image was acquired. Then, PEGylated gold nanorods with a concentration of 1.25 pM (7.5 × 10⁸ nanorods/ml) were injected subcutaneously. The localized PEGylated gold nanorods are clearly seen in the subcutaneous (SQ) tissue, where the gold nanorods were injected, in Figure 40A. Using the ultrasonic array based PA imaging system, the PA signal enhancement due to gold nanorods was observed in a nude mouse in vivo. PEGylated gold nanorods of 100 µL with a concentration of 7.5 × 10¹⁰ nanorods/ml were subcutaneously injected into the abdominal area of the mouse. Figure 40B and C show two PA images before and after the nanarod injection, respectively. The injected gold nanorods are clearly seen in Figure 40C with an image contrast of 9:1 compared to the background.
Figure 40.
(A) In vivo noninvasive PA A-line image of a nude mouse after the injection of gold nanorods (25 µL at a concentration of 1.25 pM) or PBS (25 µL). The x-axis of (A) is the time of arrival of ultrasound. A typical PA image of a nude mouse before (B) and after (C) subcutaneous injection of 100 µL of gold nanorods at a concentration of 7.5 × 10¹⁰ nanorods/mL in the abdominal area. Injected nanoparticles were brightly visible in the PA image (C). (Reprinted with permission from ref 111. Copyright 2007 American Chemical Society.)
A custom-made single-element ultrasound transducer based PAM (20 MHz)18 was employed to demonstrate the feasibility of molecular PA imaging of malignant tumors using bioconjugated gold nanorods (AuNRs) in vivo. Two types of tumor cell lines were used in this study: 1) oral cancer OECM1 (oral squamous cell carcinoma) cells overexpressed with HER2 (human epidermal growth factor receptor 2) on the cell surface, and 2) Cal27 (squamous cell carcinoma) cells overexpressed with EGFR (epidermal growth factor receptor). For multiple targeting, two types of gold nanorods were tested: 1) AuNR785-HER2 (peak absorption wavelength, 785 nm; aspect ratio, 3.7; conjugated antibody, anti-HER2 for targeting OECM1 cells) and (2) AuNR1000-EGFR (peak absorption wavelength, 1000 nm; aspect ratio, 5.9; conjugated antibody, anti-EFGR for targeting Cal27 cells). Two optical wavelengths, 800 and 1064 nm, were used for AuNR785-HER2 and AuNR1000-EGFR, respectively. The AuNRs were coated with poly(ethylene glycol) (PEG). The PEG-AuNRs (referred to as AuNRs) without any bioconjugation were used for control experiments. A 100 µL of AuNRs were injected to mice in each study at concentration of 30 nM. Figure 41 shows time-course co-registered ultrasonic (US, gray color scale) and PA (red color scale) images of Cal27 tumors before and after the injections of AuNR1000 and AuNR1000-EGFR, independently. The contoured area indicates the tumor region in Figure 41A and B. Within the tumor region, the PA image contrast with the injection of AuNR1000-EGFR at 7hr post-injection is higher than the contrast prior to the injection (Figure 41A). When AuNR1000 were injected, there is no apparent difference in PA images between pre- and post-injections (Figure 41B). The time-dependant PA signal enhancement within the tumor region was quantified in Figure 41C. The contrast using AuNR1000-EGFR is maximally ~3.5 dB higher than that using AuNR1000 at 7h post-injection.
Figure 41.
In vivo noninvasive molecular PA Images of Cal27 tumors before and after the injection of AuNR1000-EGFR and AuNR1000. Ellipses indicate the tumor regions. (A) Time-course composite of US and PA images before and after AuNR1000-EGFR injection. US image in gray scale and PA image in red pseudo-color. (B) Time-course composite of US and PA images before and after AuNR1000 injection. (C) Averaged image intensities within the tumor region as a function of time after injections of AuNR1000-EGFR (blue solid line) and AuNR1000 (red dashed line). (Reprinted with permission from ref 18. Copyright 2008 The Optical Society of America.)
Figure 42 shows time-course co-registered ultrasonic (US, gray scale) and PA (red scale) images of OECM1 tumors before and after the injections of AuNR785 and AuNR785-HER2, independently. Within the tumor region, the PA image contrast obviously increased 1 hr to 17 hr post-injection of AuNR785-HER2 as compared to the contrast prior to the injection (Figure 42A). When AuNR785 was injected, there is no apparent difference in PA images between pre- and post-injections (Figure 42B). The time-dependant PA signal enhancement within the tumor region was quantified in Figure 42C. The contrast using AuNR785-HER2 is maximally ~2 dB higher than that using AuNR785 at 14 hr post-injection.
Figure 42.
In vivo noninvasive molecular PA Images of OECM1 tumors before and after the injection of AuNR785-HER2 and AuNR785. Ellipses indicate the tumor regions. (A) Time-course composite of US and PA images before and after AuNR785-HER2 injection. US image in gray scale and PA image in red pseudo-color. (B) Time-course composite of US and PA images before and after AuNR785 injection. (C) Averaged image intensities within the tumor region as a function of time after injections of AuNR785-HER2 (blue solid line) and AuNR785 (red dashed line). (Reprinted with permission from ref 18. Copyright 2008 The Optical Society of America.)
In another demonstration, 100 µL of a 979-pM gold nanorods (AuNRs) solution was injected intradermally in the left forepaw pads of Sprague Dawley rats (~ 400 g) to noninvasively image sentinel lymph nodes in vivo. The deep reflection-mode PA imaging system (see section 2.2.2) was employed. The AuNRs used for this study had a 10 nm diameter, a 41 nm length, and a peak absorption wavelength of 807 nm. Figure 43A shows a photograph of the axilla of the rat after the hair was removed before PA imaging. Figure 43B shows a photograph of the same region with skin removed and shows the SLN containing AuNRs after the PA imaging, and the top and bottom views of the excised SLN. The control image is shown in Figure 43D captured prior to the injection of AuNRs. The surrounding vasculature is clearly seen in the control image. The SLN was not detectable until 19 hr post-injection (Figure 43E and F). At 46 hr post-injection, the SLN was clearly seen with good contrast in, shown Figure 43G. The depth-resolved B-scan along the dotted line in Figure 43G shows the depth information of SLN and blood vessels in Figure 43C.
Figure 43.
In vivo noninvasive PA images of the axilla, showing the vasculature and sentinel lymph node. (A) Photograph of the axilla with hair removed before imaging. (B) Photograph of the axilla with tissue removed. SLN is indicated by an arrow. Insets are a top view and a bottom view of the excised SLN, respectively. (C) B-scan acquired along the dotted line in (G). (D) PA image taken before the injection as a control. (E) PA image at 1.5 h post-injection. (F) PA image at 19 h injection. (G). PA image acquired at 46 h post-injection. (Reprinted with permission from ref 113. Copyright 2009 Elsevier.)
4.2.4. Single-walled carbon nanotubes19,116–118
Although the toxicity of carbon nantubes is still an ongoing debate in biomedical applications,119–121 single-walled carbon nanotubes (SWNTs) were tested in PA imaging as a contrast agent for molecular specific tumor targeting19,118 and sentinel lymph node mapping in vivo.116 SWNTs were also investigated as agents for photothermal therapy.122 The synthesis of SWNTs used in PA imaging is explained in detail in refs. 116,117.
A single-element focused ultrasound transducer based PAM system (5 MHz)19 was employed to investigate the feasibility of molecular PA imaging of malignant tumors using bioconjugated SWNTs in vivo. SWNTs (1–2 nm in diameter and 50–300 nm in length) were coupled to the RGD peptides123 (SWNT–RGD) through polyethylene glycol-5000 grafted phospholipid (PL–PEG5000) (Figure 44A). The SWNT–RGD targets to αvβ3 integrin overexpressed in tumor neovasculature. For control experiments, only PEGylated SWNTs (Plain SWNT) were synthesized without any biomarkers. Figure 44B shows the optical absorption profiles of oxy-hemoglobin (HbO2), deoxy-hemoglobin (Hb), plain-SWNT, and SWNT-RGD. These profiles suggest that 690 nm is preferable for PA imaging. The PA sensitivity measured using SWNTs in biological tissues is 50 nM, that is, the PA signal from tissues (background) was equal to the PA signal from 50 nM of SWNTs (SNR = 1).
Figure 44.
(A) Illustration of plain-SWNT and SWNT–RGD. (B) Photoacoustic spectra of plain-SWNT and SWNT-RGD overlaid on optical spectra of oxyhemoglobin (HbO2) and deoxyhemoblobin (Hb). (Reprinted with permission from ref 19. Copyright 2008 Nature.)
200 µL of SWNT-RGD at a concentration of 1.2 mM was intravenously injected via the tail-vein to U87MG tumor xenografts bearing mice (n = 4). The same amount and concentration of plain-SWNT was intravenously injected as well (n = 4). A series of US and PA images around the tumor bearing region were acquired before and up to 4 h after injection. Figure 45A shows the time-dependant increase of PA signals in mice after the injection of SWNT–RGD and plain-SWNT. The PA images of mice injected with SWNT-RGD shows significant signal enhancement within the tumor region. A differential image between the PA images taken at 4 h post-injection and the image taken before injection clearly prove the accumulation of SWNT-RGD within the tumor, compared to the differential image using plain-SWNT. The PA signal increase was quantified as a function of time (Figure 45B). On average, the PA signals using SWNT-RGD is ~ 8 times greater than using plain-SWNT at 4 h post-injection.
Figure 45.
In vivo noninvasive molecular PA images of U87MG tumors before and after the injection of SWNTs-RGD and plain-SWNTs. The structural ultrasound image is shown in gray scale and the PA image is shown in green scale. (A) Time-course composite of US and PA images before and after SWNT-RGD and plain-SWNT. Subtraction image: PA image at 4 h post-injection – control PA image. White arrows in the left column indicate the PA signals in the mouse injected with plain-SWNT. (B) Averaged image intensities within the tumor region as a function of time after injection of SWNTs-RGD (n = 4, red solid line) and plain-SWNTs (n = 4, blue solid line). (Reprinted with permission from ref 19. Copyright 2008 Nature.)
In another demonstration, 75 µL of a 500 nM SWNTs solution was intradermally injected in the left forepaw pads of Sprague Dawley rats (~ 250 – 350 g) to image sentinel lymph nodes in vivo noninvasively. The deep reflection-mode PA imaging system (see section 2.2.2) was employed. The optical wavelength of 807 nm was utilized. The control image captured prior to the injection of SWNTs is shown in Figure 46A. The surrounding vasculature is clearly seen in the control image. The SLN appeared immediately after the injection (Figure 46B). Figure 46C – E show the PA images of the same area 30, 55, and 85 min post-injection of SWNTs. The uptake kinetics of the SWNTs is shown in Figure 46F.
Figure 46.
In vivo noninvasive PA images of the axilla, showing the vasculature and sentinel lymph node. (A) The control PA image taken before the injection. (B) PA image taken immediate after the injection. (C) – (E) PA images at 30, 55, and 85 min post-injection, respectively. (F) The uptake kinetics of the SWNTs. (Reprinted with permission from ref 116. Copyright 2009 Institute of Physics.)
4.2.5. Colloidal gold nanobeacons124
Colloidal gold nanobeacons (GNBs) are soft, hollow colloidal particles containing smaller gold nanoparticels (2–4 nm) inside. Based on the high optical absorption in the visible and NIR regimes, GNBs can be used as molecular contrast agents in PA imaging. The GNBs have a nominal hydrodynamic diameter of 154 ± 10 nm (Figure 47). The benefit of the bigger size of GNBs than other gold nanostructures (< 50 nm) is that the GNBs have greater chance to stay in blood stream and lead to specific targeting. Smaller particles can rapidly distribute beyond the vasculature and into tissues and bind to nonspecific targets, consequently causing an unwanted signal increase in background. The fabrication process of GNBs is described in detail in the ref 124.
Figure 47.
Preparation of gold nanobeacons from octanethiol-functionalized gold nanoparticles (AuNPs). (Reprinted with permission from ref 124. Copyright 2009 Wiley-VCH Verlag GmbH & Co.)
A solution of GNBs (3 ml/kg) was intravenously injected to a Sprague Dawley rat to preliminarily test noninvasive in vivo blood-vessel imaging of a femoral vein. The deep reflection-mode PAM system (see section 2.2.2) was employed, using an optical wavelength of 766 nm. The control image captured prior to the injection of GNBs is shown in Figure 48A. The vasculature is clearly seen in the control image with a contrast-noise ratio (CNR) of 50. Figure 48B shows the PA image (CNR = 68) of the same area 156 min after the injection. The PA signal in blood vessels increased up to 60% after injection as compared to that in control image. Figure 48C shows the time-course PA signal enhancement after the injection.
Figure 48.
In vivo noninvasive PA vascular structural images of a rat. (A) Control PA image acquired before GNB injection. (B) PA image acquired 156 min after injection of GNBs. (C) Pharmacokinetics of GNBs in a blood vessel after injection (blue arrow: point of GNBs injection). (Reprinted with permission from ref 124. Copyright 2009 Wiley InterScience.)
4.2.6. Nanowontons125
Composite-material nanoparticles, “nanowontons”, were recently introduced at contrast agents for MRI and PAT. The nanowontons have a cobalt (Co) core for MRI and gold (Au) thin film coating. The nanowontons exhibit both ferromagnetic and optical responses, making them useful for dual-modality MRI and PAT studies. The shape and thickness of the Au capping layer is designed to match the peak optical absorption wavelength in the NIR (700 nm) regime. The fabrication process of nanowontons is explained in detail in the ref.125. The optical absorbance of nanowontons is shown in Figure 49A. Figure 49B shows the PA images of a tissue phantom containing 4 optically absorptive targets at various concentrations of nanowontons: 100, 50, 25, and 13 pM. The detection sensitivity of this system is on the order of 25 pM.
Figure 49.
PA image of nanowonton phantom. (A) Optical absorbance of nanowontons. (B) PA image of 4 absorbing objects containing nanowonton concentrations of 100 , 50, 25, and 13 pM, respectively, for objects A, B, C, and D. (Reprinted with permission from ref 125. Copyright 2009 National Academy of Sciences.)
4.2.7. Quantification of optical absorption cross-sections of gold nanostructures using photoacoustic sensing126
Gold nanostructures can have a strong extinction peak (localized surface plasmon resonance) in the visible and near-infrared (NIR) regimes. This extinction peak is comprised of two components: scattering and absorption. By changing the size, shape, and internal structure of the nanostructures, the relative magnitude of light being absorbed and scattered can be tuned. In general, different applications may require nanostructures to possess very specific optical properties. For example, optical scattering dominant nanostructures can be used as a contrast agent in optical coherence tomography, and optical absorbing dominant nanostructures are more valuable to PA imaging. Therefore, it is essential to know both the absorption (σa) and scattering (σs) cross-sections of a nanostructure for a specific biomedical application.
A conventional UV-vis-NIR spectrometer measures the extinction spectra of nanostructures, which eventually provides the extinction cross-section (σe, with σe = σa + σs) of the nanostructures. Currently, theoretical simulation is the dominant method to separate σe into σa and σs. The Mie theory has been used for spherical particles, while the discrete-dipole approximation (DDA) is for other shapes of nanostructures.
The σa of gold nanostructures can be experimentally measured using PA sensing. The PA signal is primarily sensitive to optical absorption and the signal is directly proportional to the absorption coefficient (µa) of the material. Therefore, PA signals from nanostructures at various concentrations can be converted into the corresponding µa by comparing it against a known linear calibration curve that (e.g., methylene blue or indocyanine green) describes the relationship between the PA signal and the µa of an organic dye. Then σa can be obtained by dividing µa by each corresponding concentration. When combined with the conventional UV-vis-NIR spectroscopic measurement, the σe, σa, and σs of the nanostructure can be determined, independently.
Table 2 shows that the ratios of absorption to extinction cross-sections (σa/σe) obtained from experimental results, which agree well with theoretical calculations. This agreement demonstrates that the PA sensing based technique can be used to measure the absorption and scattering cross-sections of gold nanostructures.
Table 2.
Comparison of the optical cross-sections of Au-based nanostructures obtained experimentally by photoacoustic imaging and theoretical calculation, respectively. (Reprinted with permission from ref 126. Copyright 2009 American Chemical Society.)
| Cross-section (10−15 m2) |
||||
|---|---|---|---|---|
| Extinction | Absorption | σa /σe | ||
| (σe) | (σa) | |||
| Nanocages | Experimental | 7.26± 0.06 | 5.96 ± 0.25 | 0.82 ± 0.04 |
| (45.0 nm) | Calculated | 19.88 | 16.26 | 0.82 |
| Nanocages | Experimental | 2.99 ± 0.04 | 3.05 ± 0.12 | 1 ± 0.04 |
| (32.0 nm) | Calculated | 6.39 | 6.02 | 0.94 |
| Nanorods | Experimental | 2.16 ± 0.02 | 1.87 ± 0.23 | 0.87 ± 0.11 |
| (44.0 × 19.8 nm2) | Calculated | 2.15 | 1.83 | 0.85 |
| Nanospheres | Experimental | 145 ±14.76 | - | - |
| (150 nm) | Calculated | 99.96 | 5.73 | 0.056 |
4.3. Reporter genes127,128
In gene expression imaging, an exogenous reporter gene can be incorporated into the genome of a tumor cell line and its expression can be controlled by a promoter. Eventually, the expression products of the reporter gene by the promoter can be used as contrast for imaging, either directly or indirectly via some assay. Since many diseases like cancer are related to genetic disorders, imaging of gene expression could potentially play an important role in molecular imaging.
The dark-field confocal PAM (50 MHz, see section 2.2.1) was employed to image the expression of lacZ reporter gene in a brain of a Sprague Dawley rat (80–100 g) in vivo. The lacZ reporter gene encodes β-galactosidase, an E. coli enzyme for lactose metabolism. 5-bromo-4-chloro-3-indolyl-β-d-galactoside (X-gal), a sensitive colorimetric assay, was used for β-galactosidase staining. A blue product is created when β-galactosidase cleaves the X-gal’s glycosidic linkage, and this blue product has strong optical absorption (Figure 50). Consequently, this provides strong contrast for PA imaging.
Figure 50.
Optical spectra of the blue product, oxyhemoglobin (HbO2), and deoxyhemoglobin (Hb). (Reprinted with permission from ref 127. Copyright 2007 Society of Photo-Optical Instrumentation Engineers.)
9L/lacZ gliosarcoma tumor cells were inoculated to the scalp of a rat. When the tumor was visible, 20 µL of an X-gal solution (20 mg/ml) was administrated near the tumor one day before PA imaging. Figure 51A shows the PA imaging at an optical wavelength of 635 nm of the lacZ-marked 9L gliosarcoma after X-gal staining. The tumor, enhanced by blue product, is clearly seen. Without X-gal staining, the tumor was not observable in the PA image. The surrounding microvasculature was imaged at the wavelength of 584 nm in Figure 51B. Figure 51C shows a composite image of both blood vessels (Figure 51B) and the tumor (Figure 51A) with enhanced contrast by the blue product.
Figure 51.
In vivo noninvasive PA mages of lacZ-marked tumor. (A) PA image acquired at 635 nm showing the tumor morphology after X-gal staining. (B) PA image acquired at 584 nm showing microvasculature. (C) A composite image of the surrounding vasculature (B) and the primary tumor (C). (Reprinted with permission from ref 128. Copyright 2008 World Scientific.)
4.4. Fluorescence proteins129
Fluorescence protein imaging has become increasingly important in biological and medical research.130 However, due to the shallow imaging depth (~1mm) of fluorescence microscopy, the applicability of fluorescence proteins is quite limited. As mentioned in section 4.1, PA signals are proportional to the product of the molar extinction coefficient and the nonradiative quantum yield (1 – fluorescence quantum yield) of a contrast agent. Thus, fluorescence proteins possessing less fluorescent quantum yields can be great candidates as contrast agents for PA imaging. Furthermore, since a deeper imaging depth is possible with PA imaging, molecular PA imaging with fluorescence proteins has great potential in biology and medicine. Table 3 summarizes the optical properties of several fluorescence proteins.
Table 3.
Optical properties of fluorescence proteins.131 FPs, fluorescence proteins; EX, excitation wavelength; EM, emission wavelength; FQY, fluorescence quantum yield; and NR-QY, nonradiative quantum yield (1 – FQY).
| FPs | EX [nm] |
EM [nm] |
Molar extinction coefficient [cm−1M−1] |
FQY [%] |
Molar extinction coefficient × NR-QY [cm−1M−1] |
|---|---|---|---|---|---|
| mCherry | 587 | 610 | 0.72 × 10⁵ | 22 | 0.56 × 10⁵ |
| tdTomato | 554 | 581 | 1.38 × 10⁵ | 69 | 0.42 × 10⁵ |
| mStraberry | 574 | 596 | 0.9 × 10⁵ | 29 | 0.64 × 10⁵ |
| J-Red | 584 | 610 | 0.44 × 10⁵ | 20 | 0.35 × 10⁵ |
| DsRed-Monomer | 556 | 586 | 0.35 × 10⁵ | 10 | 0.32 × 10⁵ |
| EGFP | 488 | 507 | 0.56 × 10⁵ | 60 | 0.22 × 10⁵ |
A single-element cylindrically focused ultrasound transducer based PACT system129 was employed to image the expression of mCherry in the head of an adult transgenic zebrafish in vivo. Figure 52A shows the morphological cross-sectional PA images of the head at various depths. The structural PA image in Figure 52B matches well with the corresponding histology in Figure 52C. The map of mCherry expression was overlaid on the structural PA image taken at 585 nm in Figure 52D. The mCherry expression is clearly seen in the PA image, which well correlates with the corresponding epifluorescence image of the dissected brain (Figure 52E).
Figure 52.
Three-dimensional in vivo PA images of the brain of an adult mCherry-expressing transgenic zebrafish. (A) Five transverse PA images taken at 585 nm. (B) A PA image and (C) its corresponding histological section. DM, dorsal fin musculature; B, hindbrain; N, lateral line nerve; O, operculum; S, skull bones; P, pharynx; H, heart; HM, hypobranchial musculature. (D) PA image of the brain with mCherry expression. (E) Corresponding fluorescent histology of a dissected brain. (Reprinted with permission from ref 129. Copyright 2009 Nature.)
5. Summary
In summary, two types of PAT modalities have been reviewed: 1) inverse-algorithm based PACT and 2) direct-raster scanning based PAM. PAT has the following features. 1) PAT breaks through the fundamental imaging depth limit of high-resolution optical microscopy. Both the imaging depth and the spatial resolution are scalable with ultrasonic frequency and can be tuned for specific imaging requirements. 2) The image contrast of PAT is primarily derived from optical absorption, unlike pure optical microscopy. 3) With ultrasonic arrays, PAT can acquire images in real time. 4) PAT uses nonionizing radiation, is safe for humans, and is ready for use in clinical applications. 5) PAT provides morphological and functional (oxygen saturation of hemoglobin and total hemoglobin concentration) imaging using intrinsic contrast (hemoglobin or melanin). 6) PAT provides functional (sentinel lymph node mapping) and molecular (tumor specific) imaging using exogenous contrast agents (organic dyes, nanoparticles, reporter genes, or fluorescent proteins).
Acknowledgement
The authors appreciate Professor James Ballard’s close reading of the manuscript and Song Hu for a cover art. This work was sponsored in part by National Institutes of Health grants R01 EB000712, R01 EB008085, R01 CA113453901, U54 CA136398, and 5P60 DK02057933. L.W. has a financial interest in Microphotoacoustics, Inc. and Endra, Inc., which, however, did not support this work.
Biographies

Chulhong Kim, Ph.D.
Dr. Chulhong Kim studied for his Ph.D. degree at Washington University in St. Louis, St. Louis, Missouri under the supervision of Dr. Lihong V. Wang, Gene K. Beare Distinguished Professor. He is currently working at the Optical Imaging Laboratory as a postdoctoral research associate. His research interests are the development of novel biomedical imaging techniques including Photoacoustic imaging, Ultrasound-modulated optical tomography, Fluorescence imaging, Laser speckle contrast imaging, and Ultrasonic imaging.

Christopher Favazza, Ph. D.
Dr. Christopher P. Favazza received his Ph.D. from Washington University in St. Louis, under the guidance of Dr. Ramki Kalyanaraman. He is currently an NIH postdoctoral research associate working in the Optical Imaging Laboratory at Washington University in St. Louis. His research interests include new clinical applications of biomedical imaging techniques (Photoacoustic tomography, Laser speckle contrast imaging, and Ultrasound) in dermatology and microcirculation.

Lihong V. Wang, Ph.D.
Dr. Lihong Wang studied for his Ph.D. degree at Rice University, Houston, Texas under the tutelage of Drs. Robert Curl, Richard Smalley and Frank Tittel. He currently holds the Gene K. Beare Distinguished Professorship in the Department of Biomedical Engineering at Washington University in St. Louis. He has authored and co-authored two books, including one of the first textbooks in the field of biomedical optics. He edited the first comprehensive book on biomedical photoacoustic tomography. He has published 206 peer-reviewed journal articles and delivered 228 keynote, plenary, and invited talks. He is a fellow of the American Institute for Medical and Biological Engineering, the Optical Society of America, the Institute of Electrical and Electronics Engineers, and the Society of Photo-Optical Instrumentation Engineers. He was appointed as the Editor-in-Chief of the Journal of Biomedical Optics. He serves as an equal co-chair for the annual conference on Photons plus Ultrasound, the 2010 Gordon Conference on Lasers in Medicine and Biology, and the 2010 OSA Topical Meeting on Biomedical Optics. He serves as an equal co-chair for the International Biomedical Optics Society. He has served as a study section chair or grant reviewer for NIH and NSF. He is currently a chartered member on an NIH study section. He serves as the founding chair of the scientific advisory board for a company commercializing his invention. His research on non-ionizing biophotonic imaging has been funded with a cumulative budget of >$26M (principal investigator for 21 research grants) by NIH, NSF, and other funding agencies. He was a recipient of the NIH FIRST award and NSF CAREER award. His laboratory invented or discovered frequency-swept ultrasound-modulated optical tomography, dark-field confocal photoacoustic microscopy (PAM), optical-resolution PAM, photoacoustic Doppler sensing, photoacoustic reporter gene imaging, focused scanning microwave-induced thermoacoustic tomography, exact reconstruction algorithms for photoacoustic or thermoacoustic tomography, sonoluminescence tomography, Mueller-matrix optical coherence tomography, optical coherence computed tomography, and oblique-incidence reflectometry. In particular, PAM broke through the long-standing diffusion limit in penetration of conventional optical microscopy and reached super-depths for noninvasive biochemical, functional, and molecular imaging in living tissue at high resolution. His Monte Carlo model of photon transport in scattering media has been used worldwide.
References
- 1.Bell AG. Am. J. Sci. 1880;20:305. [Google Scholar]
- 2.Denk W, Strickler JH, Webb WW. Science. 1990;248:73. doi: 10.1126/science.2321027. [DOI] [PubMed] [Google Scholar]
- 3.Huang D, Swanson EA, Lin CP, Schuman JS, Stinson WG, Chang W, Hee MR, Flotte T, Gregory K, Puliafito CP, Fujimoto JG. Science. 1991;254:1178. doi: 10.1126/science.1957169. [DOI] [PMC free article] [PubMed] [Google Scholar]
- 4.Singh A, Gopinathan KP. Curr. Sci. India. 1998;74:841. [Google Scholar]
- 5.Zeff BW, White BR, Dehghani H, Schlaggar BL, Culver JP. Proc. Natl. Acad. Sci. U. S. A. 2007;104:12169. doi: 10.1073/pnas.0611266104. [DOI] [PMC free article] [PubMed] [Google Scholar]
- 6.Wang XD, Pang YJ, Ku G, Xie XY, Stoica G, Wang LHV. Nat. Biotechnol. 2003;21:803. doi: 10.1038/nbt839. [DOI] [PubMed] [Google Scholar]
- 7.Gamelin J, Maurudis A, Aguirre A, Huang F, Guo P, Wang LV, Zhu Q. Opt. Express. 2009;17:10489. doi: 10.1364/oe.17.010489. [DOI] [PMC free article] [PubMed] [Google Scholar]
- 8.Gamelin J, Aguirre A, Maurudis A, Huang F, Castillo D, Wang LV, Zhu Q. J. Biomed. Opt. 2008;13:024007. doi: 10.1117/1.2907157. [DOI] [PMC free article] [PubMed] [Google Scholar]
- 9.Zhang HF, Maslov K, Stoica G, Wang LHV. Nat. Biotechnol. 2006;24:848. doi: 10.1038/nbt1220. [DOI] [PubMed] [Google Scholar]
- 10.Maslov K, Stoica G, Wang LV. Opt. Lett. 2005;30:625. doi: 10.1364/ol.30.000625. [DOI] [PubMed] [Google Scholar]
- 11.Song KH, Wang LV. J. Biomed. Opt. 2007;12:060503. doi: 10.1117/1.2818045. [DOI] [PubMed] [Google Scholar]
- 12.Maslov K, Zhang HF, Hu S, Wang LV. Opt. Lett. 2008;33:929. doi: 10.1364/ol.33.000929. [DOI] [PubMed] [Google Scholar]
- 13.Ku G, Wang XD, Xie XY, Stoica G, Wang LHV. Appl. Optics. 2005;44:770. doi: 10.1364/ao.44.000770. [DOI] [PubMed] [Google Scholar]
- 14.Song KH, Wang LV. Med. Phys. 2008;35:4524. doi: 10.1118/1.2977534. [DOI] [PMC free article] [PubMed] [Google Scholar]
- 15.Wang X, Xie X, Ku G, Wang LV, Stoica G. J. Biomed. Opt. 2006;11:024015. doi: 10.1117/1.2192804. [DOI] [PubMed] [Google Scholar]
- 16.Zhang HF, Maslov K, Sivaramakrishnan M, Stoica G, Wang LHV. Appl. Phys. Lett. 2007;90:053901. [Google Scholar]
- 17.Zemp RJ, Song L, Bitton R, Shung KK, Wang LV. Opt. Express. 2008;16:18551. doi: 10.1364/oe.16.18551. [DOI] [PMC free article] [PubMed] [Google Scholar]
- 18.Li PC, Wang CRC, Shieh DB, Wei CW, Liao CK, Poe C, Jhan S, Ding AA, Wu YN. Opt. Express. 2008;16:18605. doi: 10.1364/oe.16.018605. [DOI] [PubMed] [Google Scholar]
- 19.De la Zerda A, Zavaleta C, Keren S, Vaithilingam S, Bodapati S, Liu Z, Levi J, Smith BR, Ma TJ, Oralkan O, Cheng Z, Chen X, Dai H, Khuri-Yakub BT, Gambhir SS. Nat. Nanotechnol. 2008;3:557. doi: 10.1038/nnano.2008.231. [DOI] [PMC free article] [PubMed] [Google Scholar]
- 20.Xu M, Wang LV. Phys. Rev. E. 2005;71:016706. doi: 10.1103/PhysRevE.71.016706. [DOI] [PubMed] [Google Scholar]
- 21.Kostli KP, Frenz M, Weber HP, Paltauf G, Schmidt-Kloiber H. Appl. Optics. 2001;40:3800. doi: 10.1364/ao.40.003800. [DOI] [PubMed] [Google Scholar]
- 22.American national standard for safe use of lasers (ANSI Z136.1–2000) Laser Institute of America; 2000. [Google Scholar]
- 23.Song L, K M, Bitton R, Shung KK, Wang LV. J. Biomed. Opt. 2008;13:054028. doi: 10.1117/1.2976141. [DOI] [PMC free article] [PubMed] [Google Scholar]
- 24.Bitton R, Zemp RJ, Yen J, Wang LV, Shung KK. IEEE T. Med. Imaging. 2009;28:1190. doi: 10.1109/TMI.2008.2011899. [DOI] [PMC free article] [PubMed] [Google Scholar]
- 25.Zhang HF, Maslov K, Wang LV. Nat. Protoc. 2007;2:797. doi: 10.1038/nprot.2007.108. [DOI] [PubMed] [Google Scholar]
- 26.Oraevsky AA, Karabutov AA. In: Biomedical Photonics Handbook. Vo-Dinh T, editor. CRC Press; 2003. Vol. PMT125. [Google Scholar]
- 27.Stein EW, Maslov K, Wang LV. J. Appl. Phys. 2009;105:102027. doi: 10.1063/1.3116134. [DOI] [PMC free article] [PubMed] [Google Scholar]
- 28.Zharov VP, Galanzha EI, Shashkov EV, Khlebtsov NG, Tuchin VV. Opt. Lett. 2007;31:3623. doi: 10.1364/ol.31.003623. [DOI] [PubMed] [Google Scholar]
- 29.Wang LV, Wu HI. Biomedical Optics: Principles and Imaging. Hoboken, New Jersey: John Wiley & Sons, Inc; 2007. [Google Scholar]
- 30.Vanzetta I, Grinvald A. Science. 1999;286:1555. doi: 10.1126/science.286.5444.1555. [DOI] [PubMed] [Google Scholar]
- 31.Chandrakala C, Fraker DL. Cancer Lett. 2005;211:225. [Google Scholar]
- 32.Tandara AA, Mustoe TA. World J. Surg. 2004;28:294. doi: 10.1007/s00268-003-7400-2. [DOI] [PubMed] [Google Scholar]
- 33.Foo SS, Abbott DF, Lawrentschuk N, Scott AM. Mol. Imaging. Biol. 2004;6:291. doi: 10.1016/j.mibio.2004.06.007. [DOI] [PubMed] [Google Scholar]
- 34.Chance B, Borer E, Evans A, Holtom G, Kent J, Maris M, Mccully K, Northrop J, Shinkwin M. Ann. NY. Acad. Sci. 1988;551:1. doi: 10.1111/j.1749-6632.1988.tb22316.x. [DOI] [PubMed] [Google Scholar]
- 35.Prasad PV, Edelman RR, Epstein FH. Circulation. 1996;94:3271. doi: 10.1161/01.cir.94.12.3271. [DOI] [PubMed] [Google Scholar]
- 36.Kuppusamy P, Afeworki M, Shankar RA, Coffin D, Krishna MC, Hahn SM, Mitchell JB, Zweier JL. Cancer Res. 1998;58:1562. [PubMed] [Google Scholar]
- 37.Cher LM, Murone C, Lawrentschuk N, Ramdave S, Papenfuss A, Hannah A, O'Keefe GJ, Sachinidis JI, Berlangieri SU, Fabinyi G, Scott AM. J. Nucl. Med. 2006;47:410. [PubMed] [Google Scholar]
- 38.Li L, Yu JM, Xing LG, Ma KF, Zhu H, Guo HB, Sun XD, Li JB, Yang GR, Li WL, Yue JB, Li BS. Am. J. Clin. Oncol.-Canc. 2006;29:628. doi: 10.1097/01.coc.0000242345.71582.e0. [DOI] [PubMed] [Google Scholar]
- 39.Jensen D. The principles of physiology. New York: Appleton-Century-Crofts; 1976. [Google Scholar]
- 40.Duong TQ, Iadecola C, Kim SG. Magnet. Reson. Med. 2001;45:61. doi: 10.1002/1522-2594(200101)45:1<61::aid-mrm1010>3.0.co;2-8. [DOI] [PubMed] [Google Scholar]
- 41.Stein EW, Maslov K, Wang LVH. J. Biomed. Opt. 2009;14:020520. doi: 10.1117/1.3095799. [DOI] [PMC free article] [PubMed] [Google Scholar]
- 42.Li ML, Oh JT, Xie XY, Ku G, Wang W, Li C, Lungu G, Stoica G, Wang LV. P. IEEE. 2008;96:481. [Google Scholar]
- 43.Hanahan D, Weinberg RA. Cell. 2000;100:57. doi: 10.1016/s0092-8674(00)81683-9. [DOI] [PubMed] [Google Scholar]
- 44.Bergers G, Benjamin LE. Nat. Rev. Cancer. 2003;3:401. doi: 10.1038/nrc1093. [DOI] [PubMed] [Google Scholar]
- 45.Hall DG, Stoica G. Clin. Exp. Metastas. 1994;12:283. doi: 10.1007/BF01753835. [DOI] [PubMed] [Google Scholar]
- 46.Maeda H, Fang J, Inutsuka T, Kitamoto Y. Int. Immunopharmacol. 2003;3:319. doi: 10.1016/S1567-5769(02)00271-0. [DOI] [PubMed] [Google Scholar]
- 47.Vaupel P, Harrison L. Oncologist. 2004;9:4. doi: 10.1634/theoncologist.9-90005-4. [DOI] [PubMed] [Google Scholar]
- 48.Vaupel P, Thews O, Hoeckel M. Med. Oncol. 2001;18:243. doi: 10.1385/MO:18:4:243. [DOI] [PubMed] [Google Scholar]
- 49.Lal S, Lacroix M, Tofilon P, Fuller GN, Sawaya R, Lang FF. J. Neurosurg. 2000;92:326. doi: 10.3171/jns.2000.92.2.0326. [DOI] [PubMed] [Google Scholar]
- 50.Hu S, Maslov K, Wang LHV. Med. Phys. 2009;36:2320. doi: 10.1118/1.3137572. [DOI] [PMC free article] [PubMed] [Google Scholar]
- 51.Jain RK, Munn LL, Fukumura D. Nat. Rev. Cancer. 2002;2:266. doi: 10.1038/nrc778. [DOI] [PubMed] [Google Scholar]
- 52.Fukumura D, Jain RK. Apmis. 2008;116:695. doi: 10.1111/j.1600-0463.2008.01148.x. [DOI] [PMC free article] [PubMed] [Google Scholar]
- 53.Deisseroth K, Feng GP, Majewska AK, Miesenbock G, Ting A, Schnitzer MJ. J. Neurosci. 2006;26:10380. doi: 10.1523/JNEUROSCI.3863-06.2006. [DOI] [PMC free article] [PubMed] [Google Scholar]
- 54.Zepeda A, Arias C, Sengpiel F. J. Neurosci. Meth. 2004;136:1. doi: 10.1016/j.jneumeth.2004.02.025. [DOI] [PubMed] [Google Scholar]
- 55.Chin GA, Diegelmann RF, Schultx GS. Wound Healing. Taylor & Francis: Boca Raton; 2005. [Google Scholar]
- 56.Ku G, Wang LV. Opt. Lett. 2005;30:507. doi: 10.1364/ol.30.000507. [DOI] [PubMed] [Google Scholar]
- 57.Wang X, Ku G, Wegiel MA, Bornhop DJ, Stoica G, Wang LV. Opt. Lett. 2004;29:730. doi: 10.1364/ol.29.000730. [DOI] [PubMed] [Google Scholar]
- 58.Luetkemeier MJ, Fattor JA. Clin. Chem. 2001;47:1843. [PubMed] [Google Scholar]
- 59.Reindl S, Penzkofer A, Gong SH, Landthaler M, Szeimies RM, Abels C, Bäumler W. J. Photoch. Photobio. A. 1997;105:65. [Google Scholar]
- 60.Landsman ML, Kwant G, Mook GA, Zijlstra WG. J. Appl. Physiol. 1976;40:575. doi: 10.1152/jappl.1976.40.4.575. [DOI] [PubMed] [Google Scholar]
- 61.Zalipsky S, Brandeis E, Newman MS, Woodle MC. FEBS Lett. 1994;353:71. doi: 10.1016/0014-5793(94)01013-7. [DOI] [PubMed] [Google Scholar]
- 62.LiCor.com. Nebraska, USA: IRDye®, Infrared Dyes; [accessed July 3, 2009]. http://www.licor.com. [Google Scholar]
- 63.Wang W, Ke S, Wu Q, Charnsangavej C, Gurfinkel M, Gelovani JG, Abbruzzese JL, Sevick-Muraca EM, Li C. Mol. Imaging. 2004;3:343. doi: 10.1162/15353500200404148. [DOI] [PubMed] [Google Scholar]
- 64.Brooks PC, Clark RA, Cheresh DA. Science. 1994;264:569. doi: 10.1126/science.7512751. [DOI] [PubMed] [Google Scholar]
- 65.Song KH, Stein EW, Margenthaler JA, Wang LV. J. Biomed. Opt. 2008;13:054033. doi: 10.1117/1.2976427. [DOI] [PMC free article] [PubMed] [Google Scholar]
- 66.Prahl S, editor. Methylene blue; 2007. [accessed July 03, 2009]. http://omlc.ogi.edu/ [Google Scholar]
- 67.Wikipedia.org. Methylene blue; [accessed July 03, 2009]. http://en.wikipedia.org. [Google Scholar]
- 68.Abe H, Wagner SJ, Kuwabara M, Kamo N, Ikebuchi K, Sekiguchi S. Photochem. Photobiol. 1997;65:873. doi: 10.1111/j.1751-1097.1997.tb01937.x. [DOI] [PubMed] [Google Scholar]
- 69.Schneider JE, Jr, Tabatabaie T, Maidt L, Smith RH, Nguyen X, Pye Q, Floyd RA. Photochem. Photobiol. 1998;67:350. [PubMed] [Google Scholar]
- 70.Kobayashi H, Kawamoto S, Sakai Y, Choyke PL, Star RA, Brechbiel MW, Sato N, Tagaya Y, Morris JC, Waldmann TA. J. Natl. Cancer Inst. 2004;96:703. doi: 10.1093/jnci/djh124. [DOI] [PubMed] [Google Scholar]
- 71.McMasters KM, Tuttle TM, Carlson DJ, Brown CM, Noyes RD, Glaser RL, Vennekotter DJ, Turk PS, Tate PS, Sardi A, Cerrito PB, Edwards MJ. J. Clin. Oncol. 2000;18:2560. doi: 10.1200/JCO.2000.18.13.2560. [DOI] [PubMed] [Google Scholar]
- 72.Purushotham AD, Upponi S, Klevesath MB, Bobrow L, Millar K, Myles JP, Duffy SW. J. Clin. Oncol. 2005;23:4312. doi: 10.1200/JCO.2005.03.228. [DOI] [PubMed] [Google Scholar]
- 73.Krishnamurthy S, Sneige N, Bedi DG, Edieken BS, Fornage BD, Kuerer HM, Singletary SE, Hunt KK. Cancer. 2002;95:982. doi: 10.1002/cncr.10786. [DOI] [PubMed] [Google Scholar]
- 74.Liu Y, Truini C, Ariyan S. Ann. Surg. Oncol. 2008;15:2412. doi: 10.1245/s10434-008-9953-7. [DOI] [PubMed] [Google Scholar]
- 75.Panyam J, Labhasetwar V. Adv. Drug Deliv. Rev. 2003;55:329. doi: 10.1016/s0169-409x(02)00228-4. [DOI] [PubMed] [Google Scholar]
- 76.Sahoo SK, Labhasetwar V. Drug Discov. Today. 2003;8:1112. doi: 10.1016/s1359-6446(03)02903-9. [DOI] [PubMed] [Google Scholar]
- 77.Gao X, Cui Y, Levenson RM, Chung LW, Nie S. Nat. Biotechnol. 2004;22:969. doi: 10.1038/nbt994. [DOI] [PubMed] [Google Scholar]
- 78.True LD, Gao X. J. Mol. Diagn. 2007;9:7. doi: 10.2353/jmoldx.2007.060186. [DOI] [PMC free article] [PubMed] [Google Scholar]
- 79.Harisinghani MG, Barentsz J, Hahn PF, Deserno WM, Tabatabaei S, van de kaa CH, de la Rosette J, Weissleder R. N. Engl. J. Med. 2003;348:2491. doi: 10.1056/NEJMoa022749. [DOI] [PubMed] [Google Scholar]
- 80.Winter PM, Caruthers SD, Kassner A, Harris TD, Chinen LK, Allen JS, Lacy EK, Zhang H, Robertson JD, Wickline SA, Lanza GM. Cancer Res. 2003;63:5838. [PubMed] [Google Scholar]
- 81.Kim S, Lim YT, Soltesz EG, De Grand AM, Lee J, Nakayama A, Parker JA, Mihaljevic T, Laurence RG, Dor DM, Cohn LH, Bawendi MG, Frangioni JV. Nat. Biotechnol. 2004;22:93. doi: 10.1038/nbt920. [DOI] [PMC free article] [PubMed] [Google Scholar]
- 82.Wang YW, Xie XY, Wang XD, Ku G, Gill KL, O'Neal DP, Stoica G, Wang LV. Nano Lett. 2004;4:1689. [Google Scholar]
- 83.Harisinghani M. Lancet Oncol. 2008;9:814. doi: 10.1016/S1470-2045(08)70215-8. [DOI] [PubMed] [Google Scholar]
- 84.Heesakkers RA, Hovels AM, Jager GJ, van den Bosch HC, Witjes JA, Raat HP, Severens JL, Adang EM, van der Kaa CH, Futterer JJ, Barentsz J. Lancet Oncol. 2008;9:850. doi: 10.1016/S1470-2045(08)70203-1. [DOI] [PubMed] [Google Scholar]
- 85.Kobayashi H, Brechbiel MW. Curr. Pharm. Biotechnol. 2004;5:539. doi: 10.2174/1389201043376571. [DOI] [PubMed] [Google Scholar]
- 86.Rabin O, Manuel Perez J, Grimm J, Wojtkiewicz G, Weissleder R. Nat. Mater. 2006;5:118. doi: 10.1038/nmat1571. [DOI] [PubMed] [Google Scholar]
- 87.Hovels AM, Heesakkers RA, Adang EM, Jager GJ, Barentsz JO. Eur. Radiol. 2004;14:1707. doi: 10.1007/s00330-004-2374-5. [DOI] [PubMed] [Google Scholar]
- 88.Hu M, Chen JY, Li ZY, Au L, Hartland GV, Li XD, Marquez M, Xia YN. Chem. Soc. Rev. 2006;35:1084. doi: 10.1039/b517615h. [DOI] [PubMed] [Google Scholar]
- 89.Song KH, Kim C, Cobley CM, Xia Y, Wang LV. Nano Lett. 2009;9:183. doi: 10.1021/nl802746w. [DOI] [PMC free article] [PubMed] [Google Scholar]
- 90.Yang X, Skrabalak SE, Li ZY, Xia Y, Wang LV. Nano Lett. 2007;7:3798. doi: 10.1021/nl072349r. [DOI] [PubMed] [Google Scholar]
- 91.Chen J, Saeki F, Wiley BJ, Cang H, Cobb MJ, Li ZY, Au L, Zhang H, Kimmey MB, Li X, Xia Y. Nano Lett. 2005;5:473. doi: 10.1021/nl047950t. [DOI] [PubMed] [Google Scholar]
- 92.Skrabalak SE, Chen J, Au L, Lu X, Li X, Xia Y. Adv. Mater. 2007;19:3177. doi: 10.1002/adma.200701972. [DOI] [PMC free article] [PubMed] [Google Scholar]
- 93.Cuenca AG, Jiang H, Hochwald SN, Delano M, Cance WG, Grobmyer SR. Cancer. 2006;107:459. doi: 10.1002/cncr.22035. [DOI] [PubMed] [Google Scholar]
- 94.Sun YG, Xia YN. J. Am. Chem. Soc. 2004;126:3892. doi: 10.1021/ja039734c. [DOI] [PubMed] [Google Scholar]
- 95.Chen JY, McLellan JM, Siekkinen A, Xiong YJ, Li ZY, Xia YN. J. Am. Chem. Soc. 2006;128:14776. doi: 10.1021/ja066023g. [DOI] [PMC free article] [PubMed] [Google Scholar]
- 96.Skrabalak SE, Chen JY, Sun YG, Lu XM, Au L, Cobley CM, Xia YN. Accounts. Chem. Res. 2008;41:1587. doi: 10.1021/ar800018v. [DOI] [PMC free article] [PubMed] [Google Scholar]
- 97.Sun Y, Xia Y. Science. 2002;298:2176. doi: 10.1126/science.1077229. [DOI] [PubMed] [Google Scholar]
- 98.Sun YG, Mayers B, Xia YN. Adv. Mater. 2003;15:641. [Google Scholar]
- 99.Sun YG, Mayers BT, Xia YN. Nano Lett. 2002;2:481. [Google Scholar]
- 100.Sun YG, Xia YA. Nano Lett. 2003;3:1569. [Google Scholar]
- 101.Siekkinen AR, McLellan JM, Chen JY, Xia YN. Chem. Phys. Lett. 2006;432:491. doi: 10.1016/j.cplett.2006.10.095. [DOI] [PMC free article] [PubMed] [Google Scholar]
- 102.Skrabalak SE, Au L, Li XD, Xia Y. Nat. Protoc. 2007;2:2182. doi: 10.1038/nprot.2007.326. [DOI] [PubMed] [Google Scholar]
- 103.Wiley B, Herricks T, Sun YG, Xia YN. Nano Lett. 2004;4:2057. [Google Scholar]
- 104.Chen JY, Wiley B, Li ZY, Campbell D, Saeki F, Cang H, Au L, Lee J, Li XD, Xia YN. Adv. Mater. 2005;17:2255. [Google Scholar]
- 105.Li ML, Wang JC, Schwartz JA, Gill-Sharp KL, Stoica G, Wang LHV. J. Biomed. Opt. 2009;14:010507. doi: 10.1117/1.3081556. [DOI] [PMC free article] [PubMed] [Google Scholar]
- 106.Mallidi S, Larson T, Aaron J, Sokolov K, Emelianov S. Opt. Express. 2007;15:6583. doi: 10.1364/oe.15.006583. [DOI] [PubMed] [Google Scholar]
- 107.Oldenburg SJ, Jackson JB, Westcott SL, Halas NJ. Appl. Phys. Lett. 1999;75:2897. [Google Scholar]
- 108.O'Neal DP, Hirsch LR, Halas NJ, Payne JD, West JL. Cancer Lett. 2004;209:171. doi: 10.1016/j.canlet.2004.02.004. [DOI] [PubMed] [Google Scholar]
- 109.Aaron J, Nitin N, Travis K, Kumar S, Collier T, Park SY, Jose-Yacaman M, Coghlan L, Follen M, Richards-Kortum R, Sokolov K. J. Biomed. Opt. 2007;12:034007. doi: 10.1117/1.2737351. [DOI] [PubMed] [Google Scholar]
- 110.Agarwal A, Huang SW, O'Donnell M, Day KC, Day M, Kotov N, Ashkenazi S. J. Appl. Phys. 2007;102:064701. [Google Scholar]
- 111.Eghtedari M, Oraevsky A, Copland JA, Kotov NA, Conjusteau A, Motamedi M. Nano Lett. 2007;7:1914. doi: 10.1021/nl070557d. [DOI] [PubMed] [Google Scholar]
- 112.Kim K, Huang SW, Ashkenazi S, O'Donnell M, Agarwal A, Kotov NA, Denny MF, Kaplan MJ. Appl. Phys. Lett. 2007;90:223901. [Google Scholar]
- 113.Song KH, Kim C, Maslov K, Wang LV. Eur. J. Radiol. 2009;70:227. doi: 10.1016/j.ejrad.2009.01.045. [DOI] [PMC free article] [PubMed] [Google Scholar]
- 114.Huang XH, El-Sayed IH, Qian W, El-Sayed MA. J. Am. Chem. Soc. 2006;128:2115. doi: 10.1021/ja057254a. [DOI] [PubMed] [Google Scholar]
- 115.Klimiuk PA, Sierakowski S, Latosiewicz R, Cylwik JP, Cylwik B, Skowronski J, Chwiecko J. Ann. Rheum. Dis. 2002;61:804. doi: 10.1136/ard.61.9.804. [DOI] [PMC free article] [PubMed] [Google Scholar]
- 116.Pramanik M, Song KH, Swierczewska M, Green D, Sitharaman B, Wang LV. Phys. Med. Biol. 2009;54:3291. doi: 10.1088/0031-9155/54/11/001. [DOI] [PMC free article] [PubMed] [Google Scholar]
- 117.Pramanik M, Swierczewska M, Green D, Sitharaman B, Wang LV. J. Biomed. Opt. 2009;14:034018. doi: 10.1117/1.3147407. [DOI] [PMC free article] [PubMed] [Google Scholar]
- 118.Xiang L, Yuan Y, Xing D, Ou Z, Yang S, Zhou F. J. Biomed. Opt. 2009;14:021008. doi: 10.1117/1.3078809. [DOI] [PubMed] [Google Scholar]
- 119.Schipper ML, Nakayama-Ratchford N, Davis CR, Kam NWS, Chu P, Liu Z, Sun XM, Dai HJ, Gambhir SS. Nat. Nanotechnol. 2008;3:216. doi: 10.1038/nnano.2008.68. [DOI] [PubMed] [Google Scholar]
- 120.Warheit DB, Laurence BR, Reed KL, Roach DH, Reynolds GA, Webb TR. Toxicol. Sci. 2004;77:117. doi: 10.1093/toxsci/kfg228. [DOI] [PubMed] [Google Scholar]
- 121.Zhao YL, Xing GM, Chai ZF. Nat. Nanotechnol. 2008;3:191. doi: 10.1038/nnano.2008.77. [DOI] [PubMed] [Google Scholar]
- 122.Zhou F, Xing D, Ou Z, Wu B, Resasco DE, Chen WR. J. Biomed. Opt. 2009;14:021009. doi: 10.1117/1.3078803. [DOI] [PMC free article] [PubMed] [Google Scholar]
- 123.Liu Z, Cai WB, He LN, Nakayama N, Chen K, Sun XM, Chen XY, Dai HJ. Nat. Nanotechnol. 2007;2:47. doi: 10.1038/nnano.2006.170. [DOI] [PubMed] [Google Scholar]
- 124.Pan DP, Pramanik M, Senpan A, Yang XM, Song KH, Scott MJ, Zhang HY, Gaffney PJ, Wickline SA, Wang LV, Lanza GM. Angew. Chem. Int. Edit. 2009;48:4170. doi: 10.1002/anie.200805947. [DOI] [PMC free article] [PubMed] [Google Scholar]
- 125.Bouchard LS, Anwar MS, Liu GL, Hann B, Xie ZH, Gray JW, Wang X, Pines A, Chen FF. Proc. Natl. Acad. Sci. U. S. A. 2009;106:4085. doi: 10.1073/pnas.0813019106. [DOI] [PMC free article] [PubMed] [Google Scholar]
- 126.Cho EC, Kim C, Zhou F, Cobley CM, Song KH, Chen JY, Li ZY, Wang LHV, Xia YN. J. Phys. Chem. C. 2009;113:9023. doi: 10.1021/jp903343p. [DOI] [PMC free article] [PubMed] [Google Scholar]
- 127.Li L, Zemp RJ, Lungu G, Stoica G, Wang LV. J. Biomed. Opt. 2007;12:020504. doi: 10.1117/1.2717531. [DOI] [PubMed] [Google Scholar]
- 128.Li L, Zhang HF, Zemp RJ, Maslov K, Wang LV. J. Innovative Opt. Health Sci. 2008;1:207. doi: 10.1142/S1793545808000212. [DOI] [PMC free article] [PubMed] [Google Scholar]
- 129.Razansky D, Distel M, Vinegoni C, Ma R, Perrimon N, Koster RW, Ntziachristos V. Nat. Photonics. 2009;3:412. [Google Scholar]
- 130.Giepmans BNG, Adams SR, Ellisman MH, Tsien RY. Science. 2006;312:217. doi: 10.1126/science.1124618. [DOI] [PubMed] [Google Scholar]
- 131.Shaner NC, Steinbach PA, Tsien RY. Nat. Methods. 2005;2:905. doi: 10.1038/nmeth819. [DOI] [PubMed] [Google Scholar]


