

Abstract
Diastolic Ca leak from the sarcoplasmic reticulum (SR) of ventricular myocytes reduces the SR Ca content, stabilizing the activity of the SR Ca release channel ryanodine receptor for the next beat. SR Ca leak has been visualized globally using whole-cell fluorescence, or locally using confocal microscopy, but never both ways. When using confocal microscopy, leak is imaged as “Ca sparks,” which are fluorescent objects generated by the local reaction-diffusion of released Ca and cytosolic indicator. Here, we used confocal microscopy and simultaneously measured the global ryanodine-receptor-mediated leak rate (Jleak) and Ca sparks in intact mouse ventricular myocytes. We found that spark frequency and Jleak are correlated, as expected if both are manifestations of a common phenomenon. However, we also found that sparks explain approximately half of Jleak. Our strategy unmasks the presence of a subresolution (i.e., nonspark) release of potential physiological relevance.
Introduction
Diastolic Ca release from the sarcoplasmic reticulum (SR) in intact ventricular myocytes has been visualized in the form of relatively stereotypical local Ca-dependent fluorescent events termed “Ca sparks” (1). Ca sparks are stochastic in nature, and likely represent the coordinated opening of multiple ryanodine receptors (RyRs) within a couplon. The consensus definition of a couplon (2) requires it to be the functional grouping of clustered RyRs with one or a few L-type Ca channels and other regulatory proteins (many belonging to the junctional SR). However, Ca sparks are also originated in the absence of sarcolemmal (SL) Ca influx, because the Ca released through an open clustered RyR can serve as a trigger. Additionally, the visualization of RyR clusters that are not associated to a surface membrane led to the inclusion of the couplon within a more general category: the Ca release unit (2).
Spark-related release could, theoretically, account for the entire diastolic SR Ca leak (3), although this has never been examined in detail. Alternatively, Ca could leak as nonspark release. The existence of this eventless release could have implications regarding the subcellular anatomy and physiology of the cell (4).
Here, we quantify the contribution of sparks and nonspark release to diastolic Ca leak. Our studies are motivated by the proposal of an eventless form of release of physiological significance (4). Such non-spark-related release might represent a noncanonical form which appears due either to alternative anatomical arrangement of the RyRs or altered channel coupling or gating. Although nonspark release has been described previously, in skeletal (5) and cardiac (6) muscles as well as in cardiac vesicles (7), it has not been given a precise physiological meaning, nor has the extent to which it contributes to leak been quantified. The existence of such a form of diastolic release could, therefore, have physiological, pharmacological, and pathophysiological significance.
Throughout this study, nonspark events are understood as RyR openings that cause such small, narrow, or brief fluorescent signals that these signals cannot be separated from the background noise and still be identified as originated from a release event. In this sense, nonsparks might also be called “subresolution release events” or “quarks” (8). Note that Ca embers, recorded for example in rat skeletal muscle under very artificial conditions (9), escape the current definition of a nonspark because embers can be unequivocally identified and their origin traced to RyRs.
In this report, both RyR-dependent total SR Ca leak and SR Ca leak due to sparks were measured in intact cells using a well-established protocol (10). Two reconstruction analyses were applied to the average spark obtained during these measurements in order to calculate the spark-related leak. We conclude that Ca sparks cannot explain the entire SR Ca leak in intact mouse myocytes.
Methods
Cell isolation, indicator loading, and solutions
Mouse ventricular myocytes were isolated using a standard enzymatic technique. Briefly, mice were heparinized using a total of 1000 USP units and 5 min later they were sacrificed by a lethal dose of Nembutal. After removal of the beating hearts, the organs were retroperfused through the aorta and perfused for 5 min with a nominally Ca-free tyrode of composition (mM, unless specified): NaCl, 140; KCl, 4; MgCl2, 1; HEPES, 5; Glucose, 10; heparin, 1% (v/v); pH 7.4 with NaOH. This was followed by enzymatic digestion using 0.12 mg/mL of Blenzyme type IV in the above solution. Upon digestion, hearts were minced and gently agitated to obtain the cells. All solutions were saturated with oxygen. The treatment of animals followed the standards established and controlled by the IACUC at Rush University (Chicago, IL).
Once the cells were isolated, [Ca] was gradually raised up to 1 mM using heparin-free tyrode. Cells were plated in laminin-coated coverslips. Indicator loading was achieved by incubation of the plated myocytes with 10 μM Fluo 4 AM and 0.02% (w/v) pluronic acid in 1 mM Ca normal tyrode, at room temperature. The time varied with the dye stock used, and ranged between 20 and 45 min; 35–45 min at room temperature were given to complete deesterification, in dye-free and pluronic-free solution.
The composition of the experimental solutions was:
Normal tyrode: NaCl, 140 mM; KCl, 4 mM; MgCl2, 1 mM; HEPES, 5 mM; Glucose, 10 mM; CaCl2, 1 mM; pH 7.4 with NaOH.
0 mM Na+, 0 mM Ca2+ normal Tyrode solution: LiCl, 140 mM; KCl, 4 mM; MgCl2, 1 mM; HEPES, 5 mM; Glucose, 10 mM; EGTA, 10 mM; pH 7.4 with LiOH.
To prepare our tetracaine solution (0 Na+, 0 Ca2+ normal Tyrode solution + tetracaine), 1 mM tetracaine was added to the 0 Na+, 0 Ca2+ normal Tyrode solution at room temperature and the pH was adjusted to its original value using HCl. To prepare our caffeine solution (0 Na+, 0 Ca2+ normal Tyrode solution + caffeine), 10 mM caffeine was added to the 0 Na+, 0 Ca2+ normal Tyrode solution at room temperature.
All the chemicals within the experimental solutions were obtained from Sigma-Aldrich (St. Louis, MO). The Fluo 4 AM was obtained from Invitrogen (Carlsbad, CA) and the pluronic acid from Molecular Probes (Eugene, OR). The Blenzyme type IV and the laminin were purchased from Roche Diagnostics (Indianapolis, IN). The heparin was from Baxter Healthcare (Deerfield, IL).
Confocal microscopy
The approach to measure Jleak has been previously described (10,11) and is diagramed in Fig. 1. Fluo-loaded, isolated ventricular myocytes were field-stimulated continuously at 0.5 Hz in physiological solution (1 mM Ca Tyrode), ensuring a steady-state SR load. Stimulation was terminated and the external medium rapidly replaced with 0 Na+, 0 Ca2+ normal Tyrode solution in the presence of 1 mM tetracaine. The concentration of tetracaine used here blocks the RyRs but has no effects on the sarcoendoplasmic reticulum Ca pump (SERCA) uptake (12). Therefore, the leak of Ca measured here is RyR-mediated and tetracaine-sensitive. The cell was subsequently perfused for 30 s with Na-free and Ca-free solution, and then exposed to 10 mM caffeine to measure the SR Ca2+ content. All images were collected in the linescan (xt) mode. Signals in the presence of tetracaine were corrected for a 5% quench.
Figure 1.
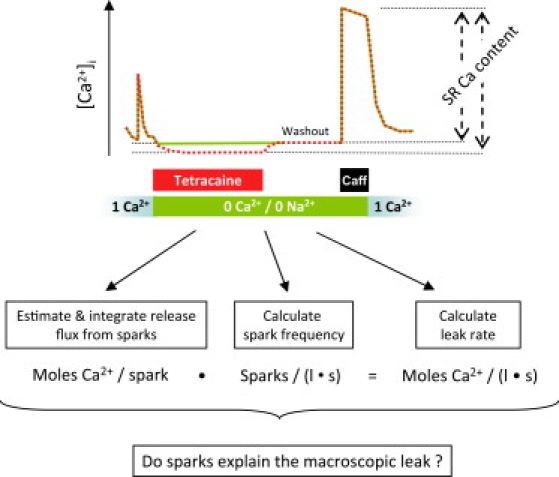
Schematic drawing of the leak-spark measurement. Also shown is an outline of the question being examined. If all the RyR-dependent Ca leak can be accounted for by sparks, then the leak rate should be numerically equal to the average amount of Ca released per spark multiplied by the spark frequency.
Jleak determination
Calculation of Jleak was done as previously described (10). Perfusion of cells with 0 Na+, 0 Ca2+ normal Tyrode solution for short periods of time blocks the Na+/Ca2+ exchanger and eliminates the current from SL Ca channels. This maneuver renders the cellular Ca content essentially constant during the perfusion time. The relevant fluxes, in this new situation, are only those through the SR membrane. Additionally, when the reversible RyR receptor blocker, tetracaine, is present, the situation further simplifies, leaving the SR Ca pump-mediated uptake as the only active flux. The tetracaine-dependent shift of Ca from the cytosol to the SR due to channel blockage is proportional to the RyR-dependent leak (10).
Free [Ca] ([Ca]i) was calculated using a pseudo-ratio (1) under the assumption that the diastolic [Ca] ([Ca]d) at 0.5 Hz is 120 nM,
| (1) |
where F is fluorescence and Fd is the diastolic fluorescence. Total cytosolic [Ca2+] ([Ca]T) was calculated as the sum of three terms:
-
1.
[Ca2+]i,
-
2.
The Ca:Dye complex (where the maximum binding capacity, Bmax(Fluo), is 150 μM, and KD(Fluo) = 1.1 μM), and
-
3.
The cytosolic Ca buffering (where Bmax = 272 μM; KD = 0.673 μM):
| (2) |
Total SR [Ca] ([Ca]SRT) was calculated as the difference between peak [Ca2+]T during caffeine and the resting [Ca2+]T during application of 0 Na+, 0 Ca2+ normal Tyrode solution. This SR load is expressed in μmoles of Ca per liter cytosol, excluding mitochondria. The conversion factor is 18.1, or 100 μmoles Ca2+/L cytosol = 1.81 mmoles Ca2+/ L SR. It arises from the ratio between the cytosolic volume (∼65% of the cell volume) and the SR volume (∼3.6% of the cell volume).
As equated below, the rate of change of the SR calcium content (JSR) depends on the Ca uptake and leak from the SR (first and second right-side terms, respectively),
| (3) |
where [Ca]SR and [Ca]cyto are the free [Ca] in the SR and the cytosol expressed in the same units, Kmf and Kmr are the Km values for SERCA forward and reverse unidirectional fluxes, kleak is the permeability constant of the SR membrane for calcium, Vmax is the maximum flux rate (assumed 137 μM/s for both unidirectional fluxes), and H is the Hill coefficient (assumed to be 0.75 for both unidirectional fluxes). The uptake model is a phenomenological one, used here because of its descriptive power. The parameters are taken from Shannon et al. (13).
Given the above parameters, [Ca]i and a Kd value for Ca binding in the SR of 630 μM (14), in the steady state in the presence of tetracaine (i.e., kleak = 0, JSR = 0), the Bmax for SR Ca binding may be calculated from the relation in Eq. 3 and the expression:
| (4) |
Using this Bmax, the SR Ca gradient may be calculated in the absence of tetracaine and the leak rate obtained. The reader is referred to Shannon et al. (10) for further details.
Spark analysis
Spark detection algorithm
Sparks were imaged during perfusion with 0 Na+, 0 Ca2+ normal Tyrode solution as part of the leak measurement protocol described above. They were detected using a standard algorithm in the image-processing language IDL (Research Systems, Boulder, CO). The algorithm performs detection within filtered images using standard, user-defined criteria (15). The spark frequency for any given cell was routinely calculated from the last 4–5 linescan images (4–5 s). Cells were considered to have zero spark frequency if there were no sparks detected during this period. The last three images in 0 Na+, 0 Ca2+ normal Tyrode solution + tetracaine were also checked for the appearance of sparks. Sparks were never detected in the presence of tetracaine.
Calculation of the spark frequency in units pL−1 s−1
The spark frequency in units (100 μm)−1 s−1 was converted to units pL−1 s−1 by assigning a scanned volume to the sparks. Scanned volume (VSV) was defined as a volume such that the image of a stereotypical spark that originates within it meets the detection criteria of the algorithm. To calculate this, it was assumed that a flat yz ellipse is scanned at every x pixel, so that the sampled volume arises by multiplying the area of the yz ellipse and the length of the scanned line (xsl). The task, then, is to find the length of the y and z radii and calculate the product
| (5) |
where ySV and zSV are the radii of VSV along the y and z axes, respectively. Such an estimation has been previously made by Zhou et al. (16), who simulated a Ca spark of similar average amplitude to the one obtained in this study, and used both the point spread function of our microscope and a spark detector of similar criteria (data not shown). The simulated spark, understood as a radially symmetric Ca:Dye distribution that evolves with time, was scanned at increasingly greater y and z distances from the release source. This decreases the observed amplitude of the detected spark. At the distances of 0.9 μm in the y direction and 1.15 μm in the z direction, the observed amplitude of the spark (now understood as an image) did not meet the criteria of the detection algorithm. These limits defined ySV and zSV, above.
Using the above criteria, 100 μm xsl translate into a scanned volume of 325 fL and one spark (100 μm)−1 s−1 translates into 3.07 sparks pL−1 s−1.
Reconstruction of the release current
Two reconstruction approaches were used in an attempt to estimate the release current. Both used the same averaged spark as input. This composite spark was constructed by extracting as many events as possible (i.e., except for the events at the very edges of the cell or image). The average spark was built by centering the events at their peaks and averaging the symmetrized fluorescent signals. Averaging was done independently of event duration.
Confocal theory establishes that, in the absence of any spatial information, the amplitude of a spark population is ∼2–2.5 times larger than the average observed amplitude due to detection of out-of-focus events (17). Therefore the “averaged spark” referred to throughout the rest of the report is this composite spark with the signal multiplied by 2.1. This factor was chosen because the average observed amplitude was 0.97 and the average amplitude of the three biggest sparks was 2.54. Hence, it was believed that using a 2.5 factor overestimates the release current. Should the current choice be erroneous, then the maximum possible underestimation is (2.5–2.1):2.1, or 19%.
Backward calculation (Method 1, Fig. 4)
Figure 4.
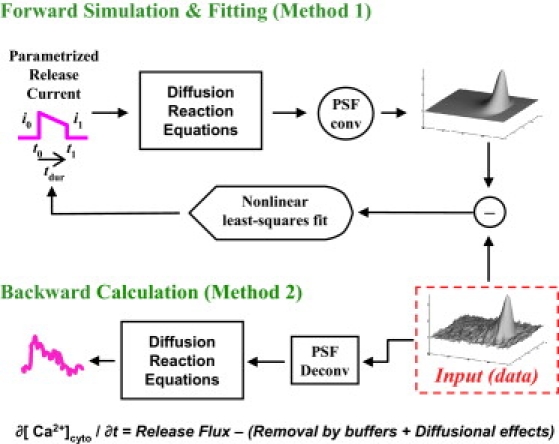
(Top) Forward simulation and least-square fitting similar in intent to the one made by Soeller and Cannell (18). Fit parameters are: [t0,tdur] = times of current beginning and release duration; and [i0,i1] = current intensities at the beginning and termination of release. (Bottom) Backward procedure, similar to that done by Ríos et al. (15).
The first reconstruction algorithm is similar to that of Rios et al. (15), with parameters for cytosolic buffers listed in Table 1. This approach is called “backward” because it starts from F(x,t), the measured consequence of Ca release and scanning, and proceeds to calculate [Ca](x,t) and flux(x,t) moving backward throughout the causation sequence. Briefly, the procedure consists in first deblurring F(x,t) to correct for the distortion introduced by the imaging system; then deriving [Ca](x,t) from the deblurred fluorescence; and then calculating flux(x,t) by numerically manipulating the differential equations that relate the local evolution of Ca to release flux and removal fluxes (including diffusion, binding to buffers, and active transport). These removal fluxes are given simple mathematical formulations, with parameters that are adjusted until known properties of the release flux (like rapid start and concentration of sources into a small volume) are achieved. The calculation yields a flux density, which must be volume-integrated to give the release current. In the above description, x represents space along the scanned line, but actual calculations are carried out in three dimensions of space, under the assumption that the release events are radially symmetric. Please see the original reference for discussion and justification of assumptions (15).
Table 1.
Common parameters for the release reconstruction algorithms
| Concentration (μM) | kon (μM × ms)−1 | koff (ms)−1 | Diffusion coefficient (μm2/ms) | Comments | ||
|---|---|---|---|---|---|---|
| Ca2+ free | Depends on average spark (92.6 nM) | 0.3 | Kushmerick and Podolsky (30) | |||
| Mg2+ free | 1000 (constant) | Romani and Scarpa (31) | ||||
| CaM | 24 | 0.1 | 0.038 | 0.00042 | Sipido and Wier (32); aggregate Ca binding | |
| ATP | 5000 | Ca2+ | 0.15 | 30 | 0.14 | Concentration, Bers (3); KD(Ca2+,Mg2+), koff(Ca) and diffusion coefficient, Baylor and Hollingworth (33); koff(Mg2+) from Zhou et al. (9) |
| Mg2+ | 0.00195 | 0.195 | ||||
| SL inner sites | 42 | 0.1 | 1.3 | Post and Langer (34) | ||
| Troponin | 70 | 0.039 | 0.02 | Sipido and Wier (32); Ca only | ||
| SERCA | 47 | 0.115 | 0.1 | Balke et al. (35); Vmax = 1 μM/s | ||
The backward calculation involves deconvolution and differentiation, both of which amplify high-frequency noise. Two changes of the original procedure were necessary to reduce the noise to manageable levels: smoothing of spatial derivatives of Ca:Dye and Ca concentration, and partial deblurring. Partial deblurring assumed a point spread function of the imaging system with spatial spread that is less than the measured one. Specifically, the full width at half-maximum of the point spread function was assumed to be 0.25 μm in the xy plane and 0.75 μm in the z direction, whereas the measured values were 0.47 in xy and 1.44 in z.
Forward simulation and fit (Method 2, Fig. 4)
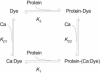
The second approach calculated the Ca release flux by a process of forward simulation and least-squares fitting, similar in intent to the one performed by Soeller and Cannell (18). The reconstruction started with a parameterized release current of known characteristics as input to an homogeneous reaction-diffusion system with properties reproducing the cytosol (Table 1). Dye binding to proteins, which results in changes in dye reactivity with Ca, followed the scheme from Harkins et al. (19) using a total protein concentration of 3 mM (Table 2). The computer-generated spark was then scanned in focus, so that its microscope-distorted image could be compared with the real data. The comparison generated a matrix of residual values, which the program minimized by altering the release current parameters until fit convergence was attained.
Table 2.
Specific dye-binding schemes (dissociation constants indicated) used for the release reconstruction algorithms
| From Harkins et al. (19) and Soeller and Cannell (18) | Forward simulation and fit (Method 1) | Backward calculation (Method 2) | |
|---|---|---|---|
| [Protein] (μM) | 3000 | — | |
| [Dye]total | 150 | 150 | |
| Diffusion coefficient (Dye and Ca:Dye, μm2/ms) | 0.15 | 0.02 | |
 |
kon-D1(μM2 × ms)−1 | 0.35 | 0.032 |
| koff-D1(ms)−1 | 0.1775 | 0.0352 | |
| kon-1 | 0.01 | ||
| koff-1 | 13.8 | ||
| kon-2 | 0.015 | ||
| koff-2 | 5.5 | ||
| kon-D2 | 0.0225 | ||
| koff-D2 | 0.043 | ||
The assumed release current was trapezoidal, with parameters t0, tdur, i0, and i1 representing, respectively: the time of current initiation; the duration of the release; the current intensity at the beginning of the release; and the current intensity at the end of the release (see Fig. 4, top).
Results
SR Ca leak in sparking and nonsparking cells
Fig. 2 is a series of x-t images that show the response of a mouse ventricular myocyte to the leak protocol outlined in Methods (Fig. 1). The first image (top, left) contains the Ca-dependent fluorescence during the last steady-state electrical field stimulation at 0.5 Hz. Each subsequent scan from left to right demonstrates the diastolic fluorescence in 0 Na+, 0 Ca2+ normal Tyrode solution + tetracaine (as indicated in the bars above the images). The absence of both extracellular Na and Ca blocks the obligatory Na-Ca exchanger, preventing transport of Ca from the cell and therefore trapping it inside (20). Tetracaine blocks the RyR, preventing the Ca from leaking out of the SR through this channel. As the SR Ca pump continues to operate but the uptake is no longer balanced by a substantial leak, Ca is shifted from the cytosol to the SR, causing a decrease in [Ca]i (also see Fig. 1).
Figure 2.
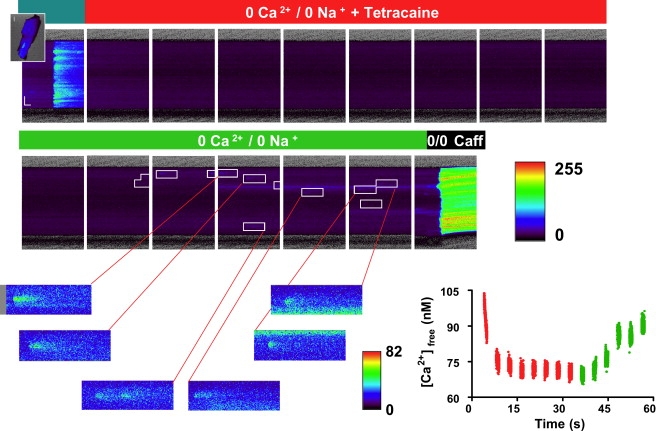
Response of a mouse ventricular myocyte to the experimental protocol. The cells are loaded with Fluo-4 and the panels show Ca-dependent fluorescence, collected as linescan (x-t) images. The figure illustrates the response to 0 Na, 0 Ca normal Tyrode solution with (top) and without (bottom) tetracaine. The leftmost panel is the last steady-state stimulation before rapid switch to the indicated solution. The rightmost panel is the response to caffeine. Arrows indicate Ca sparks. (Lower-right graph) Average [Ca] during perfusion with 0 Na, 0 Ca normal Tyrode solution with or without tetracaine.
The bottom row of images begins with the rapid switch to 0 Na+, 0 Ca2+ normal Tyrode solution and washout of tetracaine. With the leak through the RyR now restored, Ca shifts rapidly from the SR back into the cytosol. The last image in the row (bottom, right) is the rapid switch to 10 mM caffeine and the subsequent response, from which the SR Ca content can be calculated (see Methods). The difference in [Ca]SRT with and without tetracaine block of the RyR is proportional to the SR Ca leak rate. The rate is calculated via the method of Shannon et al. (10).
Ca sparks at steady state were detected during the period of the protocol in which the cell was perfused with 0 Na+, 0 Ca2+ normal Tyrode solution. These sparks were analyzed as described in Methods. No sparks were ever detected in the presence of tetracaine.
The summary results are shown in Fig. 3. Cells were split into two groups—those that showed spark activity and those that showed no sparks. Cells that did not spark showed a diastolic SR Ca leak (6.3 ± 1.1 μmol/L cytosol/s) that was no different from that in cells in which spark activity was detectable (7.1 ± 1.0 μmol/L cytosol/s). The result strongly suggests that SR Ca leak cannot be entirely accounted for by the presence of sparks at rest.
Figure 3.
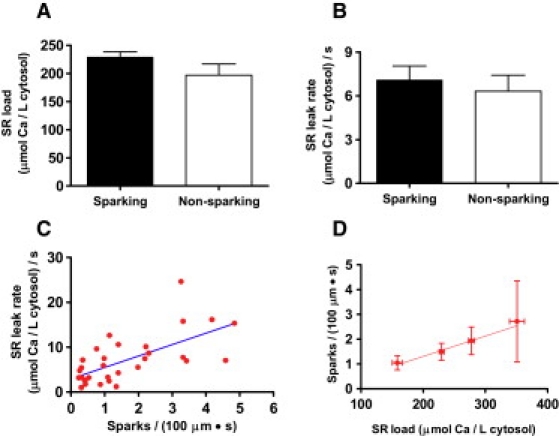
(A) SR load in sparking and nonsparking cells. (B) Jleak was similar in both cell types at the same SR Ca load (mean ± SE, n = 31 sparking and 15 nonsparking cells). (C) Jleak increased with spark frequency in sparking cells. (D) Average spark frequency increased as the average SR Ca load did (n = 7, 17, 5, and 2 for each bin, respectively). According to the scanned volume calculation (see Methods), 1 spark × (100 μm)−1 × s−1 translates into 3.07 sparks × pL−1 × s−1.
One possible explanation for this difference would be a reduction in [Ca]SRT in the nonsparking cells. Such a reduction would result in a decrease in the SR Ca gradient and, therefore, the current through any single RyR channel. Because sparks are generally accepted to be the result of multiple channels firing in a junction, a reduced single-channel RyR flux would be less likely to increase junctional [Ca] to the point where Ca-induced Ca release would take place in adjacent channels ((4); see also below), thus making it less likely that a spark would be generated. Indeed, the frequency of events did increase in sparking cells with [Ca]SRT (Fig. 3 D) and an increase in the SR Ca leak rate was observed as the spark frequency rose (Fig. 3 C).
However, the data indicate that this cannot be the only factor determining whether sparks are observed. Though there was a slight trend downward, the [Ca]SRT was not statistically different between those cells showing events and those not showing events (Fig. 3 A). Furthermore, a significant decrease in [Ca]SRT should result in a decrease in the cellular leak rate. As stated above, no such difference was observed between the two groups. Therefore, although increased [Ca]SRT resulted in an increase in spark frequency, it is unlikely to be the entire explanation for the total absence of events in nonsparking cells.
Calculation of Ca spark-dependent SR Ca leak
We set out to calculate the amount of Jleak that could be accounted for by sparks in those cells which exhibited events. Ca spark flux was therefore calculated as a first step.
Ca spark flux was calculated in two different ways (Fig. 4). First, forward simulation (top) and least-squares fitting by using a parameterized release current was carried out (Method 1). The fit parameters were:
The current was, therefore, trapezoidal in shape with the initial and terminating current and the duration determined by the fit. This release form allows for a decay in the current, perhaps due to a decrease in the Ca gradient across the membrane as Ca is lost from the SR.
Fig. 5 shows the results of this analysis. Fig. 5 A shows the average signal generated after aligning the events at the peaks. The best fit parameters from this signal indicated an initial release of 4.4 pA, which declined to 2.9 pA over a duration of 24.4 ms before release completely terminated. Integrating the spark Ca release signal (Fig. 5 E), it was found that 0.46 attomoles of Ca were released per event. Fig. 5 B shows the spark that is simulated using these parameters. The majority of the residual signal is located near the time of initiation of the spark (Fig. 5 C). It is likely that this is due to the instantaneous nature of the hypothetical release waveform as well as the fact that the release source could not change its width (0.1 μm) over time. In any case, the residual signal is relatively minor.
Figure 5.
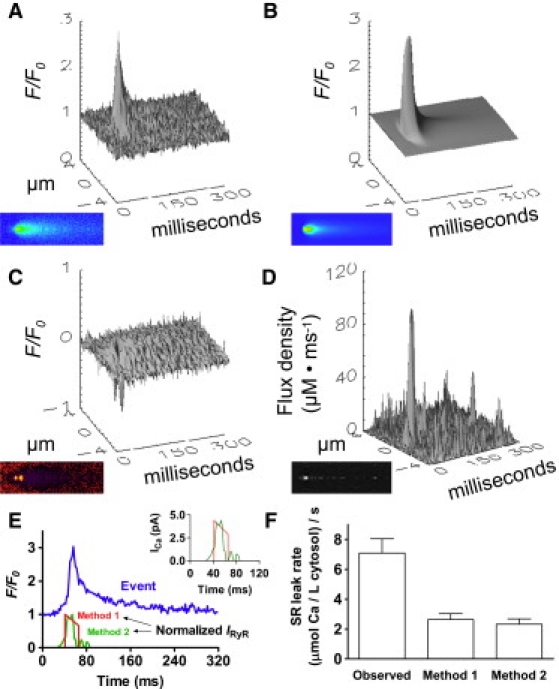
(A) Amount of Ca released per spark as estimated by forward simulation and fitting (Fig. 4, Method 1) and by backward calculation (Fig. 4, Method 2), both applied to the input spark. (B) Method 1 iteratively adjusted release parameters, generating a synthetic spark by least-square fitting. (C) Difference between the input data and the fitted data. The amount of Ca released per spark, calculated by time integration of the best-fit release current, was 0.46 attomoles. (D) Output release flux density obtained using the spark from panel A and Method 2. The amount obtained after time integration of the release current was 0.41 attomoles Ca. (E) Time course of the release currents as obtained by the two methods. (F) Comparison of the measured Jleak in sparking cells (left column) to the rate of leak strictly due to Ca sparks using Method 1 (middle column) and Method 2 (right column). Spark-dependent leak is the amount of Ca released per spark multiplied by spark frequency.
Fig. 4 (bottom) shows the second procedure for determining out the Ca flux. It illustrates the backward procedure (Method 2), where release flux density is calculated from fluorescence. This is done by numerically manipulating the diffusion-reaction equations that describe the evolution of the released calcium (see Methods).
The signal generated using this technique was somewhat noisy (Fig. 5 D). However, the technique has an advantage in that it does not require assumptions about the release waveform, thus allowing for a more gradual initiation and nonlinear decline of the current. This is, indeed, what was observed. Integrating the signal (Fig. 5 E) yields 0.41 attomoles of Ca released per spark, an amount very similar to that calculated using the forward simulation and fit above.
Having estimated the amount of Ca released per spark in two different ways, we converted these numbers to the diastolic Ca release rate due only to Ca sparks (Fig. 5 F). This was done by multiplying the amount of Ca2+ released per spark by the spark frequency per unit volume (see Fig. 1, bottom). An estimation for missed events was explicitly included in the calculation, apart from it being implicit within the scanned volume estimation. The final result had units of μmole/L cytosol/s, similar to the observed Jleak. Using Method 1, we determined the spark-dependent leak rate to be 2.64 μmol/L cytosol/s. Method two yielded a similar value of 2.33 μmol/L cytosol/s. Both of these values are considerably lower than the average Jleak of 7.1 ± 1.0 μmol/L cytosol/s observed in sparking cells. The data suggest that a considerable fraction of the observed diastolic release is due to processes other than sparks.
Discussion
This study was undertaken to investigate the role that Ca sparks play in the generation of SR Ca leak flux. In particular, we tested the possibility that, due to the arrangement and/or gating characteristics of ryanodine receptors in proximity to one another, all leak flux could be explained by sparks. Indeed, in theory it might be possible to calculate a macroscopic leak rate that can be reasonably well explained by sparks (3). However, the evidence presented here does not support this hypothesis. Diastolic SR Ca release flux was observed in cardiac myocytes that produced no sparks. Indeed, even in sparking myocytes, only roughly half of the RyR-dependent Jleak could be accounted for by spark flux. We conclude that nonspark release, defined as in the Introduction, must be present and must account for a significant portion of the SR Ca leak.
Technical aspects of the study
The blockage of RyRs is accomplished by the use of tetracaine. The blockage is rapid and easily reversible by washout. The major disadvantage of its use and the use of other substances like it is the nonspecific nature of the block. However, this is largely or completely offset by the use of 0 Na, 0 Ca normal Tyrode solution during the measurement, thus isolating the SR and making the effects upon other tetracaine-sensitive channels irrelevant (e.g., voltage-gated Na channels and Ca channels). On the other hand, there are reports demonstrating that millimolar tetracaine levels can significantly influence the skeletal SERCA isoform (e.g., (21)) and membrane ATPases in general. This effect has not been reported when the isoform is the SERCA2a in the presence of 1 mM tetracaine ((12); see also Fig. 7 in (22) for a lack of effects in the back-flux).
Tetracaine has been shown to block RyR channels at mM concentrations in artificial lipid bilayer experiments, and we expect it to be nearly 100% effective at eliminating flux. In support of this assumption, Ca sparks were never seen in the presence of tetracaine at any time during any of the experiments. Although the SR Ca load can increase to overcome tetracaine-dependent block at lower concentrations, it has been shown that this does not happen at mM tetracaine over a 2-min time course (12). It should be noted that the calculation of the SR Ca leak rate from the data depends upon this fact. Should the block be incomplete or should non-RyR-dependent forms of SR Ca leak (e.g., IP3 channels) be present to a significant extent, the leak rate will be underestimated by the technique. The leak rates calculated here should, therefore, be considered a lower limit within these bounds and, if anything, the percentage of the SR Ca leak which is accounted for by Ca sparks should be lower than that reported.
Another potentially confounding factor in the experiments is the degree of dye loading within the cell. One could argue that a large degree of loading could add to the cytosolic buffering capacity with the addition of a dye with relatively fast kinetics. Such an addition might buffer out large, focal increases in Ca, leading to the disappearance of Ca sparks. This is, however, unlikely to be the case. Loading conditions for all cells were monitored, as well as the signals generated in both groups. In particular, cells which exhibited sparks did not have a higher signal/noise ratio than cells that did not have events—something which would be expected if cytosolic dye loading was significantly different between the groups (data not shown).
Because of the difficulty of determining the actual Ca flux from the spark data, two different methods to estimate spark Ca flux were used, each with its advantages and disadvantages.
The first method combined a forward simulation with a fitter where the flux parameters were determined by a least-squares fit to the data. The major advantage of using this method was that a smooth flux was determined. However, the method as we formulated it also requires that a release form have minimal degrees of freedom. This waveform may not accurately describe the actual physiological shape. In addition, the sparks in the study were centered at the peaks, the point that is known the most accurately. This results in a degree of distortion, particularly near this point (Fig. 5). The distortion may confound the fitting algorithm, which, as a result, may not be able to fully account for the shape of the spark. It was for this reason that care was taken to generate a residual representing the difference between the fit and the actual data (Fig. 5 C). This residual flux is greatest near the beginning of the spark, where the model assumes an instantaneous release. However, limitations notwithstanding, the residual was relatively small and indicated that, although not perfect, the model was a reasonable description of the data.
The second method involved back-calculation of Ca flux through the standard subtraction of other known fluxes involved in spark generation and decline. This method has the advantage of allowing a free-form determination of the shape and time course of the underlying Ca current. On the other hand, the noise in the calculation is considerably higher than the first method, thus decreasing its accuracy. Because each method has advantages which offset the disadvantages of the other, each complements the other, combining to give a reasonable overall picture of the situation. In this way, the amount of Ca released per spark was conservatively estimated and could not entirely account for RyR-dependent SR Ca leak in sparking cells.
One major concern in our analysis is the choice of model parameters. To address this issue, a sensitivity analysis was performed focusing on 1), the indicator parameters (because fluorescence is the observed signal); 2), the uptake parameters; and 3), other endogenous buffering parameters. A decrease of the dye's apparent affinity for Ca (to 2.57 μM (19)) resulted in practically unchanged global leak rates. When a similar change was applied to the release flux reconstructions (by halving koff-2 and doubling koff-D2 in the forward calculation; see Table 2), the amount of Ca released that is necessary to explain the average spark was reduced. Doubling [Fluo 4] did not affect the calculated global Jleak, but increased the amount of Ca released per spark by 25–50%. Similarly, halving the dye concentration did not alter the global Jleak, but reduced the Ca released per spark by 25–30%. Regarding the uptake parameters, the influence on the amount of Ca released per spark was minimal (i.e., sparks are shaped more strongly by diffusion and buffering), but the influence on Jleak was sizable. Increases in the Hill coefficient (range 0.75–2.5) had small effects on the average Jleak (± 15%), but there were ≤30% increases in the dispersion. Our standard value (0.75) was the one that provided the lowest dispersion and intermediate Jleak values. Regarding the Jleak-versus-spark-frequency relationship, calculations using our standard value had a higher Pearson correlation coefficient than calculations using a Hill coefficient of 2, with no change in the conclusions of the study (data not shown). The effects of Vmax were linear, whereas Km alterations resulted in mild changes (∼25% increase of the average Jleak per halving of the Km). To finish, the endogenous buffer concentrations altered the global leak rates very little, because the leak analysis is based on free [Ca]. The release flux reconstructions were altered by the buffering parameters, but only when all the endogenous buffer concentrations were raised at once. Doubling the concentration of all buffering parameters (including the SERCA) increased the amount of Ca released per spark by 50%. Tripling the endogenous buffer concentrations resulted in a near-doubled amount of Ca released per spark.
Given the above sensitivity analysis, we would emphasize that, although our parameter choices have generally been reasonable, when given the choice we have decided upon conservative values that would tend to disprove our conclusions. One may assume, therefore, that our spark-related leak flux values would tend to be high rather than low.
Mechanistic considerations
It is, perhaps, noteworthy that the spark release flux in sparking cells fit the trapezoidal current shape reasonably well (Fig. 5). Using the initial current of 4.4 pA and a terminating current of 2.9 pA and assuming a unitary Ca current through a single ryanodine receptor of 0.5 pA (23), the peak in the release implies the presence of 9–11 open channels per spark at initiation. The current then falls due to junctional SR Ca depletion of ∼40% of the total (1,24). Data therefore suggest that the number of open channels remains constant, suggesting the possibility that they open and close in a coordinated manner to terminate the flux at roughly half of the initial current.
Must a Ca2+ spark represent gating of multiple RyRs? To address this possibility, we used our forward calculation to model in-focus Ca2+ release events under three different circumstances where the single RyR current was 0.5 pA and the source radius was 100 nm. We modeled:
Waveform 1. The opening of a single RyR for 10 ms (an unrealistically long open time for a single channel).
Waveform 2. The simultaneous activation of two RyRs for 5 ms, followed by closing of one channel whereas the other remains open for 5 ms more.
Waveform 3. The simultaneous opening of two RyRs for 10 ms.
The resulting fluorescence signals were inserted into simulated images at the average signal/noise ratio. Signals generated by release waveforms 1 and 2 were never detected, whereas waveform 3, was detected 8% of the time. This modeling suggests that our approach is self-consistent in that the release generated under these conditions is always subresolution. Our results very much agree with previous simulations from others in this regard (e.g., Fig. 4 in (25)). In addition, if our approach renders realistic results, it means that a substantial fraction of Jleak originates from nonspark release events, which are likely caused by short simultaneous opening of one or two RyRs.
The appearance of Ca sparks could depend upon the SR Ca load. In theory, a larger free SR Ca could result in a higher single RyR current into the junctional cleft. This could lead to gating of surrounding RyRs, resulting in a large coordinated release of Ca and the appearance of Ca sparks. However, SR Ca loads were comparable in sparking and nonsparking cells, indicating that this is unlikely to be the case here or, that if it is, the difference is within the detection limit for caffeine release measurement. There was, on the other hand, good correlation among both the SR Ca load and leak rate and spark frequency, perhaps indicating that RyR Ca current was not without effect. The relationship between Jleak/SR Ca load and spark frequency was not obviously nonlinear over the range tested, something one might also predict would be the case. Combined with the idea that there was no threshold load for Ca spark appearance, the data suggest that there may have been a fundamental difference in the state of the RyR resulting in the two distinct populations of cells. This difference, whatever it may be, could be of physiological significance.
One possibility is that noncoordinated channels are located outside of the cleft, perhaps in parajunctional locations. Indeed, they could be located in SR which is not closely associated with the sarcolemmal membrane at all. Corbular SR has been estimated to contain up to 30–40% of the RyR in ventricular muscle (26,3). RyR in such a location might be less closely associated and the [Ca] might not reach a level quite as high outside of the diffusionally restricted space of the junctional cleft. Such RyR clusters would be difficult to visualize using standard techniques such as electron microscopy because of their relative scarcity within a relatively large volume of the cell (that located outside the junctional space at the Z-lines).
Another theory that has gained attention in recent years is the one in which RyRs are coupled through the mediation of the protein FKBP12.6 (27,28). Differential phosphorylation states of the junctional RyRs could cause such channels to demonstrate less coordination and therefore, visibly silent release by fewer channels than those that are coupled together.
Physiological implications
The SR Ca leak is higher both in certain physiological states such as high adrenergic tone (11) and in pathological states such as heart failure (29). The existence of eventless leak, which is the result of noncoordinated release, raises the possibility for such release to be regulated differently than Ca sparks. Coordinated release should result in a release current/[Ca] relationship that is relatively steep (4). Noncoordinated RyR-mediated release (from single channels or small clusters) would produce a relationship that rises more gradually (i.e., a smaller Hill coefficient), having higher current at lower [Ca] and lower current above the EC50. Such gating characteristics might be expected to be more arrhythmogenic.
The value Jleak is quite small relative to the systolic Ca fluxes. Using our value of 6.3 μmol/L cytosol/s (i.e., a current of 26 pA) and a unitary current of 0.5 pA (23), the total number of open RyRs at rest is only 52 out of roughly 2,000,000 total within one 32-pL cell (3). This is an opening probability of only 0.003%. However, even a portion of this small flux can have powerful effects. It is conceivable for Ca microdomains to act as regulators of sarcolemmal processes, perhaps within caveolae or in similarly spatially restricted compartments. The possibility that two types of leak exist may indicate that these have different roles depending upon subcellular location and functional characteristics.
In conclusion, this report has made a quantitative argument for the existence of small, possibly nonspark diastolic SR Ca release. This nonspark release makes up a relatively large proportion of the total SR Ca leak. We suggest that this release may be physiologically and pathophysiologically important and warrants further study.
Acknowledgments
This research was supported by National Institutes of Health grant No. NIH R01-HL071893 and supported in part by the Intramural Research Program of the National Institute on Aging, National Institutes of Health, Bethesda, Maryland.
References
- 1.Cheng H., Lederer W.J., Cannell M.B. Calcium sparks: elementary events underlying excitation-contraction coupling in heart muscle. Science. 1993;262:740–744. doi: 10.1126/science.8235594. [DOI] [PubMed] [Google Scholar]
- 2.Franzini-Armstrong C., Protasi F., Ramesh V. Shape, size, and distribution of Ca2+ release units and couplons in skeletal and cardiac muscles. Biophys. J. 1999;77:1528–1539. doi: 10.1016/S0006-3495(99)77000-1. [DOI] [PMC free article] [PubMed] [Google Scholar]
- 3.Bers D.M. 2nd Ed. Kluwer Academic, Dordrecht; The Netherlands: 2001. Excitation-Contraction Coupling and Cardiac Contractile Force. [Google Scholar]
- 4.Sobie E.A., Guatimosim S., Lederer W.J. The Ca2+ leak paradox and rogue ryanodine receptors: SR Ca2+ efflux theory and practice. Prog. Biophys. Mol. Biol. 2006;90:172–185. doi: 10.1016/j.pbiomolbio.2005.06.010. [DOI] [PMC free article] [PubMed] [Google Scholar]
- 5.Shirokova N., Ríos E. Small event Ca2+ release: a probable precursor of Ca2+ sparks in frog skeletal muscle. J. Physiol. 1997;502:3–11. doi: 10.1111/j.1469-7793.1997.003bl.x. [DOI] [PMC free article] [PubMed] [Google Scholar]
- 6.Lipp P., Egger M., Niggli E. Spatial characteristics of sarcoplasmic reticulum Ca2+ release events triggered by L-type Ca2+ current and Na+ current in guinea-pig cardiac myocytes. J. Physiol. 2002;542:383–393. doi: 10.1113/jphysiol.2001.013382. [DOI] [PMC free article] [PubMed] [Google Scholar]
- 7.Shannon T.R., Bers D.M., Niggli E. Confocal imaging of CICR events from isolated and immobilized SR vesicles. Cell Calcium. 2005;38:497–505. doi: 10.1016/j.ceca.2005.07.002. [DOI] [PubMed] [Google Scholar]
- 8.Lipp P., Niggli E. Submicroscopic calcium signals as fundamental events of excitation—contraction coupling in guinea-pig cardiac myocytes. J. Physiol. 1996;492:31–38. doi: 10.1113/jphysiol.1996.sp021286. [DOI] [PMC free article] [PubMed] [Google Scholar]
- 9.Zhou J., Brum G., Rios E. Ca2+ sparks and embers of mammalian muscle. Properties of the sources. J. Gen. Physiol. 2003;122:95–114. doi: 10.1085/jgp.200308796. [DOI] [PMC free article] [PubMed] [Google Scholar]
- 10.Shannon T.R., Ginsburg K.S., Bers D.M. Quantitative assessment of the SR Ca2+ leak-load relationship. Circ. Res. 2002;91:594–600. doi: 10.1161/01.res.0000036914.12686.28. [DOI] [PubMed] [Google Scholar]
- 11.Curran J., Hinton M.J., Shannon T.R. Beta-adrenergic enhancement of sarcoplasmic reticulum calcium leak in cardiac myocytes is mediated by calcium/calmodulin-dependent protein kinase. Circ. Res. 2007;100:391–398. doi: 10.1161/01.RES.0000258172.74570.e6. [DOI] [PubMed] [Google Scholar]
- 12.Györke S., Lukyanenko V., Györke I. Dual effects of tetracaine on spontaneous calcium release in rat ventricular myocytes. J. Physiol. 1997;500:297–309. doi: 10.1113/jphysiol.1997.sp022021. [DOI] [PMC free article] [PubMed] [Google Scholar]
- 13.Shannon T.R., Ginsburg K.S., Bers D.M. Reverse mode of the sarcoplasmic reticulum calcium pump and load-dependent cytosolic calcium decline in voltage-clamped cardiac ventricular myocytes. Biophys. J. 2000;78:322–333. doi: 10.1016/S0006-3495(00)76595-7. [DOI] [PMC free article] [PubMed] [Google Scholar]
- 14.Shannon T.R., Bers D.M. Assessment of intra-SR free [Ca] and buffering in rat heart. Biophys. J. 1997;73:1524–1531. doi: 10.1016/S0006-3495(97)78184-0. [DOI] [PMC free article] [PubMed] [Google Scholar]
- 15.Ríos E., Stern M.D., Shirokova N. Calcium release flux underlying Ca2+ sparks of frog skeletal muscle. J. Gen. Physiol. 1999;114:31–48. doi: 10.1085/jgp.114.1.31. [DOI] [PMC free article] [PubMed] [Google Scholar]
- 16.Zhou J., Launikonis B.S., Brum G. Regulation of Ca2+ sparks by Ca2+ and Mg2+ in mammalian and amphibian muscle. An RyR isoform-specific role in excitation-contraction coupling? J. Gen. Physiol. 2004;124:409–428. doi: 10.1085/jgp.200409105. [DOI] [PMC free article] [PubMed] [Google Scholar]
- 17.Ríos E., Shirokova N., González A. A preferred amplitude of calcium sparks in skeletal muscle. Biophys. J. 2001;80:169–183. doi: 10.1016/S0006-3495(01)76005-5. [DOI] [PMC free article] [PubMed] [Google Scholar]
- 18.Soeller C., Cannell M.B. Estimation of the sarcoplasmic reticulum Ca2+ release flux underlying Ca2+ sparks. Biophys. J. 2002;82:2396–2414. doi: 10.1016/S0006-3495(02)75584-7. [DOI] [PMC free article] [PubMed] [Google Scholar]
- 19.Harkins A.B., Kurebayashi N., Baylor S.M. Resting myoplasmic free calcium in frog skeletal muscle fibers estimated with fluo-3. Biophys. J. 1993;65:865–881. doi: 10.1016/S0006-3495(93)81112-3. [DOI] [PMC free article] [PubMed] [Google Scholar]
- 20.Bassani R.A., Bassani J.W., Bers D.M. Mitochondrial and sarcolemmal Ca2+ transport reduce [Ca2+]i during caffeine contractures in rabbit cardiac myocytes. J. Physiol. 1992;453:591–608. doi: 10.1113/jphysiol.1992.sp019246. [DOI] [PMC free article] [PubMed] [Google Scholar]
- 21.Suko J., Winkler F., Hellmann G. Aspects of the mechanism of action of local anesthetics on the sarcoplasmic reticulum of skeletal muscle. Biochim. Biophys. Acta. 1976;443:571–586. doi: 10.1016/0005-2736(76)90474-0. [DOI] [PubMed] [Google Scholar]
- 22.Kuum M., Kaasik A., Veksler V. Energetic state is a strong regulator of sarcoplasmic reticulum Ca2+ loss in cardiac muscle: different efficiencies of different energy sources. Cardiovasc. Res. 2009;83:89–96. doi: 10.1093/cvr/cvp125. [DOI] [PubMed] [Google Scholar]
- 23.Kettlun C., González A., Fill M. Unitary Ca2+ current through mammalian cardiac and amphibian skeletal muscle ryanodine receptor channels under near-physiological ionic conditions. J. Gen. Physiol. 2003;122:407–417. doi: 10.1085/jgp.200308843. [DOI] [PMC free article] [PubMed] [Google Scholar]
- 24.Shannon T.R., Guo T., Bers D.M. Ca2+ scraps: local depletions of free [Ca2+] in cardiac sarcoplasmic reticulum during contractions leave substantial Ca2+ reserve. Circ. Res. 2003;93:40–45. doi: 10.1161/01.RES.0000079967.11815.19. [DOI] [PubMed] [Google Scholar]
- 25.Sobie E.A., Dilly K.W., Jafri M.S. Termination of cardiac Ca2+ sparks: an investigative mathematical model of calcium-induced calcium release. Biophys. J. 2002;83:59–78. doi: 10.1016/s0006-3495(02)75149-7. [DOI] [PMC free article] [PubMed] [Google Scholar]
- 26.Jorgensen A.O., Shen A.C., Campbell K.P. The Ca2+-release channel/ryanodine receptor is localized in junctional and corbular sarcoplasmic reticulum in cardiac muscle. J. Cell Biol. 1993;120:969–980. doi: 10.1083/jcb.120.4.969. [DOI] [PMC free article] [PubMed] [Google Scholar]
- 27.Marx S.O., Gaburjakova J., Marks A.R. Coupled gating between cardiac calcium release channels (ryanodine receptors) Circ. Res. 2001;88:1151–1158. doi: 10.1161/hh1101.091268. [DOI] [PubMed] [Google Scholar]
- 28.Marx S.O., Reiken S., Marks A.R. PKa phosphorylation dissociates FKBP12.6 from the calcium release channel (ryanodine receptor): defective regulation in failing hearts. Cell. 2000;101:365–376. doi: 10.1016/s0092-8674(00)80847-8. [DOI] [PubMed] [Google Scholar]
- 29.Shannon T.R., Pogwizd S.M., Bers D.M. Elevated sarcoplasmic reticulum Ca2+ leak in intact ventricular myocytes from rabbits in heart failure. Circ. Res. 2003;93:592–594. doi: 10.1161/01.RES.0000093399.11734.B3. [DOI] [PubMed] [Google Scholar]
- 30.Kushmerick M.J., Podolsky R.J. Ionic mobility in muscle cells. Science. 1969;166:1297–1298. doi: 10.1126/science.166.3910.1297. [DOI] [PubMed] [Google Scholar]
- 31.Romani A.M., Scarpa A. Regulation of cellular magnesium. Front. Biosci. 2000;5:D720–D734. doi: 10.2741/romani. [DOI] [PubMed] [Google Scholar]
- 32.Sipido K.R., Wier W.G. Flux of Ca2+ across the sarcoplasmic reticulum of guinea-pig cardiac cells during excitation-contraction coupling. J. Physiol. 1991;435:605–630. doi: 10.1113/jphysiol.1991.sp018528. [DOI] [PMC free article] [PubMed] [Google Scholar]
- 33.Baylor S.M., Hollingworth S. Model of sarcomeric Ca2+ movements, including ATP Ca2+ binding and diffusion, during activation of frog skeletal muscle. J. Gen. Physiol. 1998;112:297–316. doi: 10.1085/jgp.112.3.297. [DOI] [PMC free article] [PubMed] [Google Scholar]
- 34.Post J.A., Langer G.A. Sarcolemmal calcium binding sites in heart: I. Molecular origin in “gas-dissected” sarcolemma. J. Membr. Biol. 1992;129:49–57. doi: 10.1007/BF00232054. [DOI] [PubMed] [Google Scholar]
- 35.Balke C.W., Egan T.M., Wier W.G. Processes that remove calcium from the cytoplasm during excitation-contraction coupling in intact rat heart cells. J. Physiol. 1994;474:447–462. doi: 10.1113/jphysiol.1994.sp020036. [DOI] [PMC free article] [PubMed] [Google Scholar]