

Abstract
A major current focus of structural work on G-protein-coupled receptors (GPCRs) pertains to the investigation of their active states. However, for virtually all GPCRs, active agonist-bound intermediate states have been difficult to characterize experimentally owing to their higher conformational flexibility, and thus intrinsic instability, as compared to inactive inverse agonist-bound states. In this work, we explored possible activation pathways of the prototypic GPCR bovine rhodopsin by means of biased molecular dynamics simulations. Specifically, we used an explicit atomistic representation of the receptor and its environment, and sampled the conformational transition from the crystal structure of a photoactivated deprotonated state of rhodopsin to the low pH crystal structure of opsin in the presence of 11-trans-retinal, using adiabatic biased molecular dynamics simulations. We then reconstructed the system free-energy landscape along the predetermined transition trajectories using a path collective variable approach based on metadynamics. Our results suggest that the two experimental endpoints of rhodopsin/opsin are connected by at least two different pathways, and that the conformational transition is populated by at least four metastable states of the receptor, characterized by a different amplitude of the outward movement of transmembrane helix 6.
Introduction
G-protein-coupled receptors (GPCRs) are the largest family of membrane proteins involved in communication between the interior and exterior of cells, thus playing a central role in pharmacology, neurobiology, and sensory physiology. Rhodopsin—the protein that enables vision in low-light conditions by converting photostimuli into biochemical signals in the rod cell—represents a prototype for what is, by far, the largest and most diverse family of GPCRs. Similar to all the GPCRs, rhodopsin consists of seven transmembrane (TM) α-helices connected by alternating intracellular (IC) and extracellular (EC) loops. Unlike other GPCRs, however, rhodopsin is covalently bound to its natural ligand 11-cis-retinal via a protonated Schiff-base (SB) linkage to a residue in the protein TM7 helix (i.e., residue K2967.43 in bovine rhodopsin, with the superscript referring to Ballesteros and Weinstein's generic numbering scheme (1)). The 11-cis isomer of the retinal chromophore acts as an inverse agonist and stabilizes rhodopsin in its inactive (dark) state, of which several crystal structures are available in the literature (recently reviewed in (2)). Absorption of a photon by dark rhodopsin produces a fast isomerization of 11-cis-retinal to 11-trans-retinal, which initiates a series of conformational changes in the receptor leading to activation.
Despite the numerous studies on rhodopsin (3), the molecular details of its activation mechanism are not fully understood. The general view is that, after chromophore isomerization, rhodopsin transforms itself into different photointermediate states with characteristic ultraviolet/visible absorption spectra. Specifically, these photointermediate states are: bathorhodopsin; a blue-shifted intermediate; lumirhodopsin (LUMI); metarhodopsin I (MI); metarhodopsin II (MII); metarhodopsin III (MIII); and ligand-free opsin, with LUMI being the first intermediate state in which the retinal is found in its 11-trans form. Two forms of inactive MI appear to exist—MIa and MIb—with the latter capable of binding, but not activating, the G-protein transducin (Gt) (4). The active form of rhodopsin bound to 11-trans-retinal, i.e., MII, also exists in two forms in a pH-dependent equilibrium—MIIa and MIIb—with only the latter capable of activating Gt (5).
Two protonation-dependent switches occur during the transition from the inactive MI to the active MII states (for a recent review, see (6)):
-
1.
Disruption of an inactivating salt bridge between the all-trans-retinylidene SB and a complex counterion composed of E1133.28 and E181 (EC2) by internal proton transfer to the E1133.28 during the transition from MI to MIIa; and
-
2.
Proton uptake at E1343.49 in the E(D)RY motif, after separation of the cytoplasmic ends of TM3 and TM6 relative to each other upon TM6 outward motion during the transition from MIIa to MIIb (7), and leading to the MIIbH+ state.
This movement is accompanied by the rupture of the salt bridge, or ionic lock, between the charged side chains of E2476.30 in TM6 and the E1343.49/R1353.50 pair in the E(D)RY motif of rhodopsin. Breaking of this interaction has repeatedly been shown to occur upon GPCR activation (e.g., for a review see (8)). Phosphorylation of MII by rhodopsin kinase and the subsequent binding to arrestin (9) influence the formation of inactive products at the end of the rhodopsin activation/inactivation cycle, such as MIII, which contains a protonated all-trans-retinylidene SB, ligand-free opsin, and free all-trans-retinal.
Some of the early photointermediates of rhodopsin have been thermally trapped in forms that could be characterized structurally either by x-ray crystallography or electron cryo-microscopy. Three-dimensional crystal structures of bathorhodopsin (10) and LUMI (11), together with a structural model for MI based on cryo-electron microscopy of two-dimensional crystals (12), demonstrate that the TM helix bundle of rhodopsin does not undergo significant conformational changes during early photoactivation. No large structural rearrangements, but only alterations in portions of IC2 and IC3 and in the density corresponding to the β-ionone ring of 11-trans-retinal, were observed in the structural model of a rhodopsin intermediate containing a deprotonated SB based on low-resolution diffraction data from illuminated rhodopsin crystals (13). However, the possibility cannot be ruled out that the crystal lattice limits the magnitude of the changes observed in this and other light-activated rhodopsin structures (3). Notably, a recent high-resolution double electron-electron resonance (DEER) spectroscopy analysis of distance changes between pairs of nitroxide side chains introduced in helices at the cytoplasmic surface of rhodopsin suggested a 5 Å outward movement of TM6 and smaller, albeit significant, movements of TM1, TM7, and the C-terminal portion after H8 upon activation (14).
In contrast to the early photoactivated states of rhodopsin, no high-resolution crystal structures of either active MIIb or the complex between MIIbH+ and Gt have been solved yet. The recent crystal structures of ligand-free opsin at low pH (15), or bound to a carboxy-terminal peptide of Gt (16), are proposed to retain several characteristic features of an active state. A dramatic rigid-body movement is observed in these structures at the cytoplasmic end of TM6, which appears to be shifted >6 Å outwards, and closer to TM5. In this new conformation of TM6, the ionic lock is broken, and new interactions are formed between R1353.50 and Y2235.58, as well as between E2476.30 and K2315.66. This rearrangement of the ionic-lock residues is different from that seen in the recent crystal structures of a photoactivated deprotonated intermediate of rhodopsin (13), and in the recently available non-rhodopsin crystal structures of β2-adrenergic receptor, β1-adrenergic receptor, and adenosine A2A receptor (see (17) for a review). Notably, the missing ionic lock in the crystal structures of adrenergic and adenosine receptors was restored during recent long molecular dynamics (MD) simulations of these receptors in a lipid bilayer under physiological conditions (18–21).
As important as the recent high-resolution x-ray crystal structures of GPCRs have been for a structural understanding of GPCR function, the spectrum of conformations that a GPCR can assume depends upon the ligand to which it binds and/or the proteins/lipids with which it interacts. It is quite large, and thus calls for biophysical approaches that are capable of efficiently sampling the conformational space of these inherently flexible systems. Several MD simulation studies (nanosecond-to-microsecond range) have allowed the description of the dynamic properties of inactive rhodopsin and of some of its early photointermediates in lipid bilayers and membrane mimetics (see (22) for a recent review). Given the absence of experimental structural information about the MII active form of rhodopsin and the limited timescales accessible to standard MD compared to the experimental timescale of MII formation (>1 ms (23)), several investigators, including ourselves, have applied various computational strategies. These strategies use experimental known distance constraints to predict activated models of GPCRs (see (22) for a recent review, and (24) for the latest article).
In this work, we study the conformational transition from the crystal structure of the photoactivated deprotonated intermediate corresponding to the Protein DataBank (PDB) code 2I37 (13) to the low pH crystal structure of opsin (PDB code: 3CAP) (15). This is performed in the presence of 11-trans-retinal and an explicit hydrated 1-palmitoyl-2-oleoyl-sn-glycero-3-phosphocholine (POPC) membrane bilayer, using adiabatic biased MD (ABMD) simulations (25,26). The assumption is that these two crystal structures are constituent parts of the rhodopsin activation pathway. The thermodynamic behavior of the system is then evaluated by well-tempered metadynamics (27), an enhanced sampling algorithm within the framework of classical MD that focuses on adding a non-Markovian (history-dependent) bias to the interaction potential in the space defined by a few collective variables (CVs). Specifically, we used as reaction coordinates both the position along and the distance from the preidentified transition trajectories from ABMD, and carried out simulations with either a charged or an uncharged residue E1343.49 within the E(D)RY motif. The results point to at least four common metastable states of rhodopsin between the two experimental endpoints used for simulation. Two of these states may correspond to active conformations of rhodopsin, as they are characterized by a significant separation of the cytoplasmic ends of TM3 and TM6 relative to each other, which is known to be caused by TM6 outward motion during the transition from MIIa to MIIb (7). Based on these predicted conformations, we tested the role of specific residues (e.g., K2315.66) in locking rhodopsin in a certain state using metadynamics.
Materials and Methods
All calculations described in this section were performed using GROMACS 4.0.2 (28), enhanced with the PLUMED plug-in (29).
System setup and force field
Rhodopsin molecular structure was obtained from the chain A of the published crystal structure of a photoactivated deprotonated intermediate conformation of the protein (PDB code: 2I37), and was described using the optimized potentials for liquid simulations-all atom (OPLS-AA) force field. Loop residues 230–238 and 311–313 that were missing from the crystal structure were built ab initio using the ROSETTA loop algorithm (30); the missing C-terminal residues were not included in the simulations. Based on a validated computational approach for the calculation of pKa values (31), the following protonation states were assigned to histidine residues in the structure: ɛ-protonation to H651.60, H1524.41, H1955.30, and H2786.61, and δ-protonation to H1002.67 and H2115.46. Residues here and throughout the text are numbered both according to their position in the bovine rhodopsin sequence and to the Ballesteros-Weinstein generic numbering scheme (1) reported as a superscript. In this two-number scheme, the first number (from 1 to 7) indicates the helix the residue belongs to, while the second number represents the residue position in that helix relative to its most conserved residue, which has an assigned number of 50. To induce conformational transition to a fully active state of the receptor, the SB was simulated in its deprotonated state, whereas residues involved in the first of two protonation-dependent switches (6), i.e., E1133.28, E1223.37, and D832.50, were protonated. To obtain a stable 11-trans form of the retinal throughout the simulations, the dihedral potential of the chromophore's C11-C12 bond was set to a minimum in its trans form. Given the possibility for a proton uptake at E1343.49 from the intracellular solvent (6), we have carried out either simulations with a negatively charged or an uncharged E1343.49 residue. For the latter simulations, one Na+ ion was removed to maintain the system neutral. Additional simulations were carried out on mutant K2315.66A in the same conditions, neutralizing the system with the appropriate number of Na+ ions.
To reduce the computational cost of an MD simulation of rhodopsin in an explicit hydrated POPC membrane bilayer, a combined united-atom and all-atom model by Tieleman et al. (32) was applied. Specifically, reparameterized Berger united-atom lipid dihedral parameters (33) were used for the POPC molecules in combination with the OPLS-AA parameters (34) for rhodopsin and the ligand. A (75 × 75 × 91 Å) pure POPC lipid patch was hydrated with SPC/E water molecules and equilibrated for 50 nanoseconds (ns) by MD, using this mixed force field. Bovine rhodopsin was inserted into this membrane patch following the protocol described by Kandt et al. (35). Specifically, the POPC bilayer and box size were inflated and, after insertion of rhodopsin, compressed by a series of scaling steps alternating with energy minimization. The process was terminated upon reaching convergence of the surface area per lipid in the xy plane, and of the deuterium order parameter profile to their published values (36), resulting in a 79 × 79 × 91 Å unit cell. Two palmitoyl groups were covalently attached to the C-terminus residues of the protein before insertion in the membrane. Finally, the system, consisting of 345 amino acid residues of bovine rhodopsin, 130 POPC molecules, and two palmitoyl groups, was hydrated with 9322 SPC/E water molecules (37), with four Na+ ions added to ensure charge neutrality. Thus, the resulting system of 45,322 total atoms was used as a starting conformation for MD simulations in the NPT ensemble (constant pressure and temperature) under periodic boundary conditions, using the Parrinello-Rahman algorithm (38). This employed a barostat time constant of 1.0 picoseconds (ps) to maintain a constant pressure of 1 bar, and the Nosé-Hoover algorithm (39) with a time constant of 1.0 ps to maintain a constant temperature of 300 K. A series of five 0.1-ns relaxation runs was first performed with increasingly weaker positional restraints on the protein, followed by an unrestrained 2.0-ns equilibration. During the subsequent simulation runs (see below), the dynamic equations were integrated using a leap-frog algorithm (28) with a time step of 0.002 ps. The LINCS algorithm (40) was used to preserve the bond lengths, and the SETTLE algorithm (41) was used to maintain the geometry of the water molecules. Lennard-Jones interactions were treated with a twin-range cutoff of 0.9:1.4 nm and an integration time step of 2 fs; the neighbor list was updated every 10 steps. Electrostatic interactions were described using the particle-mesh Ewald method (42), with a cutoff of 0.9 nm for real-space interactions, and a 0.12-nm grid with fourth-order B-spline interpolation for reciprocal-space interactions.
Adiabatic biased MD runs
To describe the transition between the photoactivated deprotonated crystal structure of rhodopsin bound to 11-trans-retinal (PDB: 2I37) and a conformation at the end of the rhodopsin activation/inactivation cycle, i.e., the low pH opsin crystal structure (PDB: 3CAP), we applied an ABMD algorithm (25,26). Like targeted molecular dynamics (TMD) (43), ABMD generates transitions between conformational endpoints in single trajectories by applying a constraint that reduces the root-mean-square deviation (RMSD) between initial and target conformations. However, because in TMD the minimization of the RMSD is always favored over the minimization of the energy (i.e., RMSD from the target conformation is decreased by a preset value at each MD step), this method does not necessarily follow the lowest energy pathway (44). More efficient TMD-based algorithms for the simulation of conformational transitions (e.g., the restricted perturbation TMD method (44)) have been proposed in the literature. Among them is the ABMD algorithm (25,26), which ensures exploration of low energy pathways by applying a time-dependent biasing potential, the unique feature of which is to keep the total potential energy of the system continuous during the MD run. Thus, following the main concepts described in the literature (25,26), we defined the quantity χ(R,t) as
| (1) |
where R(t) is the conformation of the molecule at time t during the simulation, R(T) is the target conformation, and dTM(R(t), R(T)) indicates the mean-square deviation (MSD) of the Cα atoms of the 163 TM residues between the two structures. Thus, χ is positive if the conformation R(t) is farther away from the target than the closest structure sampled at time t. To drive the system toward the opsin target conformation R(T), we applied the time-dependent bias potential, as
| (2) |
where H is the Heaviside function, and k is an elastic constant. According to Eq. 2, the bias acts only if χ is positive, i.e., whenever the MSD of the TM region of rhodopsin from the corresponding region in the opsin structure exceeds the minimum value achieved during simulation. To identify the smallest harmonic bias needed to carry out a reasonably slow path calculation, we carried out different ABMD simulations with different values of the elastic constant. Specifically, we carried out four sets of 10 simulations using different starting velocities and elastic constants (k = 0.2, 0.02, 0.01, or 0.002 kJ/nm2 applied to 163 TM residues). A similar but independent harmonic bias was also applied to the side-chain angle of W2656.48 to promote the toggle switch expected upon activation. The first set of simulations (k = 0.2 kJ/nm2) reached the final state in ∼0.5 ns, the second one (k = 0.02 kJ/nm2) in ∼2 ns, and the third (k = 0.01 kJ/nm2) in ∼3 ns, while the fourth set of simulations (k = 0.002 kJ/nm2) did not move significantly away from the starting conformation within a 10-ns time frame.
To obtain the least perturbed paths in a reasonable time frame, we carried out 10 different 3 ns-long simulations with an elastic constant of 0.01 kJ/nm2, and independently drawn Maxwellian initial velocities, for a total of 30 ns. Thus, all resulting trajectories were pooled, and the sampled conformations grouped using average-linkage agglomerative hierarchical clustering based on the RMSD of the TM domain. Grouping of all sampled conformations ensured independence from a specific stochastic representation of the transition deriving from ABMD. Clustering was required to define path collective variables for further metadynamics simulations (see below). Thus, to select the maximum number of clusters k that would define monodimensional paths, we calculated the permanence probability pk(i) (i=1,2,…,k) for each cluster, i.e., the probability by which the conformations of a given trajectory remain in a specific cluster. We then calculated the overall product pk(1) pk(2) … pk(k) of all clusters. A value of this product close to 1 means that switching between clusters is rare, and the clusters are visited in a sequential fashion by the conformations of a given trajectory. If the number of clusters k is large, the product decreases, indicating that the conformations rapidly switch between at least two clusters. To avoid rapid switching between clusters and to achieve a product closer to 1, we obtained a maximum number of clusters k = 4 (product = 0.85).
Fig. S1 of the Supporting Material shows the sequence of clusters visited by the receptor along the 10 different ABMD trajectories. As shown in this figure, these 10 trajectories can be classified into two groups of qualitatively different conformational transitions (A and B in Fig. S1), which all end in cluster 3 (orange and dark green in trajectories of transitions A and B, respectively). All structures sampled in these trajectories were then analyzed by embedding them in a two-dimensional Euclidean metric space using classical linear multidimensional scaling (45). Briefly, classical multidimensional scaling consists of a dimensional reduction algorithm that allows mapping the complex multidimensional data (coordinates of the structures) on a low-dimensional manifold (e.g., bidimensional points whose distance provides a rough estimate of the MSD between the structures). More details about this algorithm are provided in the Supporting Material.
Metadynamics simulations
To obtain information about the relative stability of the states populated by rhodopsin during transition from its photoactivated deprotonated crystal structure to the target opsin conformation, we performed metadynamics simulations, using as CVs the position (s) along, and the distance (z) from, the ABMD-predetermined trajectories. For each of the two different conformational transitions that derived from the ABMD simulations (A and B in Fig. S1), we defined path collective variables using the sequence of the most populated clusters for either transition A (three clusters) or B (four clusters). To achieve smoother descriptions of the conformational transitions, we linearly interpolated the structures, and obtained k = 10 uniformly spaced reference conformations R(i) with 1 ≤ i ≤ k. These reference frames, k, were used to define as CV the position of the protein (0 ≤ s ≤ 1) along the predetermined transition trajectory, according to Eq. 3,
| (3) |
where the constant exponent λ was chosen in such a way that λ × δ ≅ 1, having called δ = 〈dTM(R(i),R(i±1))〉 the average distance between two adjacent frames in the transition discretization. Z is a normalization factor defined by Eq. 4:
| (4) |
The same framework also allowed us to define a CV (see Eq. 5, below) that describes the distance of the protein conformation from the ABMD predetermined conformational transitions. Such an additional dimension is crucial to allow the global description of transitions different from the one used to define the reference path (46,47):
| (5) |
The well-tempered metadynamics algorithm (27) in its direct formulation was used to reconstruct the free-energy of rhodopsin as a function of the two variables defined in Eqs. 3 and 5. Specifically, an initial Gaussian height W0 = 0.1 kcal/mol and a deposition rate t0 = 1 ps were chosen. According to the well-tempered metadynamics prescription, the bias was updated by adding Gaussian contributions with a total height of
| (6) |
where T is the simulation temperature, Vt(s,z) is the bias potential at time t for the values s and z of the CVs, and the bias factor f was chosen to be 15 to allow the system to overcome barriers of the order of 15 kT ∼ 9 kcal/mol.
To have a qualitative idea of the error associated with these calculations, we carried out the well-tempered metadynamics simulation three times, starting from different initial conformations extracted from the ABMD runs. The simulation length was 80 ns for each of the different metadynamics runs carried out in this study for both wild-type and mutant rhodopsin (K2315.66A) with either a charged or an uncharged residue E1343.49 within the E(D)RY motif. To restrain the sampling to the region of interest, the value of the variable z was calculated for all the states along the trajectories generated using ABMD, and a steep repulsive wall was placed at its maximum value zMax = 0.1 Å2 during the metadynamics simulations. To enable a more direct comparison between the free-energy landscapes reconstructed for the two different reference transition trajectories (A and B in Fig. S1) identified in this study, a common value of λ = 0.1 nm−2 was chosen. Convergence of the reconstructed free-energy was monitored by inspecting the free-energy profile, and plotting as a function of the time the predicted free-energy difference between the minima revolving around the experimental endpoints. Fig. S2 and Fig. S4 report these differences for each of the simulations (charged or uncharged E1343.49) carried out for wild-type or mutant rhodopsin, respectively. As shown in these figures, free-energy estimates converge to similar values (within 0.3 kcal/mol) during the last 20 ns of simulation. An additional support for simulation convergence comes from the observed frequent recrossing of the values of the collective variables during time, as shown in Fig. S4.
Results and Discussion
In this article, we describe the results of a new computational strategy that combines ABMD simulations with metadynamics analysis to explore the thermodynamics of late activation events of bovine rhodopsin.
Membrane environment
To accurately model conformational transitions in GPCRs, a complete explicit description of their environment is in order. In fact, the viscoelastic properties of the membrane can strongly influence the photoactivation cycle of rhodopsin (48). Specifically, lipids with polyunsaturated chains can destabilize the native state of rhodopsin, whereas rhodopsin reconstituted in fully saturated lipids exhibits impaired activation. Similarly, cholesterol molecules can stabilize the receptor, thus slowing its kinetics (e.g., see (49)).
Recent computational studies have confirmed the role of the membrane scaffold on the dynamic properties of rhodopsin (e.g., see (50)). In the simulations described hereafter, we considered a representation of the rhodopsin solvation system including a hydrated unsaturated POPC membrane bilayer, and two palmitoyl groups bound to the protein C-terminus. The latter were considered in the rhodopsin modeling and simulations because these groups are found to be bound to rhodopsin under physiological conditions, as a result of posttranslational fatty acid acylation of two cysteines at the cytoplasmic end of the receptor.
Transition from photoactivated deprotonated to opsinlike states
Ten statistically independent 3-ns-long ABMD simulations were performed between the photoactivated deprotonated crystal structure of rhodopsin (PDB: 2I37) and the low pH crystal structure of opsin (PDB: 3CAP) in the presence of 11-trans-retinal, and of an explicit hydrated POPC lipid bilayer. To capture the essence of the conformations sampled, we performed a cluster analysis and described each trajectory using the temporal sequence of cluster occupancy (see Materials and Methods for details). Inspection of the timelines reported in Fig. S1 shows that trajectories 1–7 (brown-to-yellow color in Fig. S1) share a common pattern of occupancy, going through the same clusters in the same temporal sequence (clusters 1-2-3) with only sporadic visits to cluster 4 from cluster 2. The same is true for the remaining three simulations (trajectories 8–10; clusters 1-2-4-3), also reported in Fig. S1 (purple-to-green color). Thus, the 10 trajectories could be divided into two groups, termed here A (transition described by the first seven trajectories) and B (transition described by the last three trajectories).
We then elucidated the topology of the conformational space sampled by ABMD by embedding the multidimensional structures resulting from representative trajectories of transitions A and B (i.e., trajectories #1 and #8 in Fig. S1, respectively) in a low dimensional Euclidean space using multidimensional scaling. The resulting plot (reported in Fig. 1) shows a dot (brown-to-yellow for A and purple-to-green for B) for each of the sampled conformations along the two representative trajectories. Coordinates of these conformations have been mapped on a two-dimensional plane in such a way that distances among the different dots provide a rough estimate of the MSD among different TM domains. As shown in Fig. 1, these conformations form four definite clusters (clusters 1–4) for both transitions A and B. To relate the sampled conformations to the experimental endpoints used in the simulations, the crystal structures of bovine rhodopsin/opsin corresponding to PDB codes 2I37 and 3CAP were also embedded in the same fashion, and their position with respect to the conformations sampled is indicated with arrows and black dots in Fig. 1. As expected, the opsin target structure 3CAP falls close to the cluster at the end of the ABMD runs, while the starting photoactivated deprotonated crystal structure 2I37 is very close to the first cluster of sampled conformations.
Figure 1.
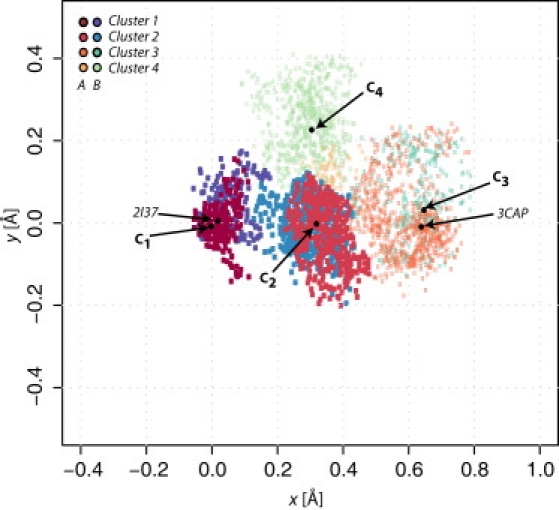
Multidimensional embedding of two ABMD trajectories, representative of transitions A and B, progressing chiefly through four clusters (brown-to-yellow and purple-to-light green, respectively). Of note, clusters C1–C4 are obtained from the pooled trajectories of 10 ABMD simulations. (Black dots) Points corresponding to the cluster centroids and to the experimental structures of 2I37 and 3CAP.
Metastable states along possible activation pathways
As described in Materials and Methods, ABMD representative trajectories of transitions A and B were used to define the reaction coordinates for metadynamics runs to explore the thermodynamics of the late events of rhodopsin activation. The RMSD of the TM region of the receptor with respect to selected conformations (centers of clusters in Fig. 1) along the representative trajectory of transition A was used to derive two collective variables (see details in Materials and Methods) that described the progression (s) of the system from the experimental photoactivated deprotonated conformation of rhodopsin to the opsin state, and its distance (z) from it. These two collective variables were used to run metadynamics simulations on wild-type rhodopsin/opsin with either a charged or an uncharged residue E1343.49 within the E(D)RY motif, and to reconstruct the free-energy of the system as it moved along the different states.
The reconstructed free-energy surfaces of transition A after 80-ns simulations (see Fig. 2, A and B, for average free-energy surfaces based on three different simulations of wild-type rhodopsin with a charged or uncharged E1343.49, respectively) confirm that the proposed late activation pathway of rhodopsin involves at least four states, including a photoactivated deprotonated conformation similar to 2I37 (state 1), and an opsinlike conformation similar to 3CAP (state 3). Integration of these average free-energy surfaces yielded the monodimensional plots of Fig. S5, A–C, where the blue lines refer to the three simulations with charged E1343.49, and the red lines are representative of the three simulations with uncharged E1343.49. As seen in Fig. S5 C showing a comparison between average values of these simulations, state 1 (2I37-like) has a slightly higher free-energy in the simulations with uncharged E1343.49, whereas, in the same simulations, state 3 acquires a free-energy similar to the combined states 2/4. In contrast, the simulations with charged E1343.49 show a less stable state 3 compared to combined states 2/4 and state 1.
Figure 2.
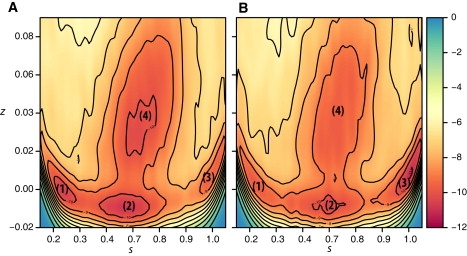
Average two-dimensional energy surfaces of wild-type rhodopsin with (A) a charged or (B) an uncharged residue E1343.49 as a function of the two path collective variables s and z that describe the progression along the transition trajectory A obtained by ABMD. Contour interval is 1 kcal/mol. Averages are based on sets of three different simulations starting from different conformations.
For a structural characterization of these states, we compared structural differences at specific positions between each state and the inactive rhodopsin structure corresponding to PDB code 1GZM. Similar to experimentally measured distance changes (performed by DEER spectroscopy (14)) that occurred upon activation (see column 8 of Table S1, where negative values indicate inward movements, and positive values suggest outward movements), we measured distance changes at specific positions between 1GZM and any of the following structures: 2I37, state 1, state 2, state 3, state 4, or 3CAP (reported in columns 2, 3, 4, 5, 6, and 7 of Table S1, respectively). Specifically, these distances were measured between selected rhodopsin residues (reported in column 1) and the center of the receptor (defined as the point halfway between the location of residues 74 and 252 in the inactive state of rhodopsin). Nevertheless, these calculated values should be considered with caution as they refer to biased estimates, and are therefore not weighted with a proper Boltzmann's factor.
State 1, located around s ≈ 0.2 and 0 ≤ z ≤ 0.01 Å2 in Fig. 2 A, and very close to the starting photoactivated deprotonated conformation, was found to lie in a local free-energy minimum separated by a barrier of 1.8 kcal/mol from the adjacent metastable state (state 2 in Fig. 2 A). The conformations that populate this basin, once extracted and visually inspected, are found to be structurally homogeneous and to form a compact cluster. Not surprisingly, these conformations are similar to the representative conformations of C1 (see Fig. 1), used to define the collective variables. The two key residues R1353.50 and E2476.30 are sufficiently close to have the ability to form the distinctive ionic lock, which is a characteristic feature of inactive structures of GPCRs (see Fig. 3 A). A comparison of columns 2 (distance changes in 2I37) and 3 (distance changes in state 1) of Table S1 confirms the structural similarity between our identified state 1 and the 2I37 crystal structure.
Figure 3.
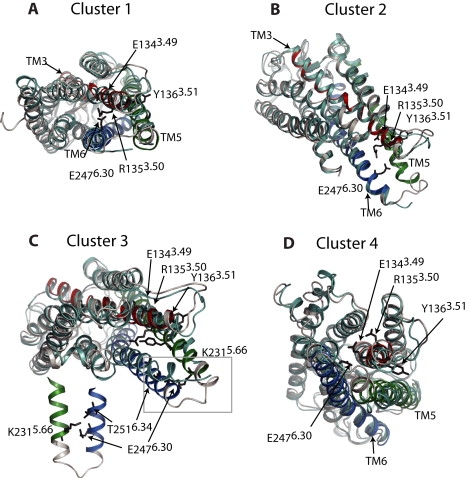
Structural features of representative conformations of wild-type rhodopsin extracted from the low free-energy basins illustrated in Fig. 2A. The structures are compared with the 2I37 structure (in cyan). Helices TM3, TM5, and TM6 (in red, green, and blue, respectively) are highlighted, and residues discussed in Results and Discussion are depicted as black sticks.
In addition to state 1, the simulation identified two other metastable states at small values of z, termed state 2 and state 3 in Fig. 2 A. State 2 (0.4 ≤ s ≤ 0.8 and z ≈ 0 Å2 in Fig. 2 A) features a large displacement of the TM helices, especially TM6, which moves outward ∼4 Å (see Table S1, column 5) upon the release of the lock between R1353.50 and E2476.30 (Fig. 3 B). The W2656.48 toggle switch is also observed in this state. State 3 (s ≈ 0.9 and 0 ≤ z ≤ 0.01 Å2 in Fig. 2 A), resembles the opsin conformation. The sixth column of Table S1 reports the values of the aforementioned distance variations calculated for this state with respect to the 1GZM conformation. As in the opsin conformation, whose distance changes are reported in column 7 of the table, state 3 shows a sensible inward movement of helix TM5 (−1.9 Å), and much more pronounced outward movements of TM6 (4.9 Å) and IC3 (5.6 Å) with respect to state 2. A superposition between state 3 of the receptor and its initial 2I37 conformation (see Fig. 3 C) shows that TM3 does not change its position in the bundle, but rather TM6 moves outwards. Owing to the large change in the TM3/TM6 relative position, the ionic lock between the two charged residues R1353.50 and E2476.30 in rhodopsin state 3 is broken, with the glutamic acid now participating in a robust hydrogen-bonded network involving residues T2516.34 and K2315.66 (see Fig. 3 C, inset), which appears to stabilize the interaction between helices TM5 and TM6 in this metastable state. Unlike the opsin structure, state 3, which has an 11-trans retinal bound to it, exhibits the W2656.48 toggle switch attributed to an active structure. In light of recent solid-state nuclear magnetic resonance measurements suggesting a displacement of the EC2 loop from the retinal binding site upon activation (51), we analyzed the conformation that this loop acquired in the proposed active states 2 and 3. In state 2 (less pronounced outward movement of TM6), EC2 did not undergo a significant conformational change with respect to a rhodopsin inactive structure. On the other hand, in state 3 (more pronounced outward movement of TM6), the loop exhibited distances from both the protein and the chromophore that were in line with the reported nuclear magnetic resonance data. For instance, the distance between the Cα atom of the EC2 G188 residue and the C19 carbon of the retinal polyene chain increased to 6.0 Å from a 4.8 Å distance measured between the same atoms in the inactive rhodopsin structure 1GZM. Also in agreement with experimental data, preexisting contacts between S186 in EC2, and the C12 and C20 atoms in the retinal, as well as between the EC2 residue G188 and the TM residue Y2686.51, are broken in state 3 (but not in state 2), suggesting that the shift of the retinal and the rearrangement of the loop occurs simultaneously to the larger outward movement of TM6 in this state. However, at variance with the experimental data, the distance between the EC2 residue Y178 and the TM residue G1143.29 did not increase beyond 5.5 Å in state 3.
Although completely different pathways may still exist, the proposed combined ABMD-metadynamics approach provides an efficient exploration of the conformational space of rhodopsin through its use of collective variables (e.g., z) that allow deviations from predetermined transition paths. For instance, exploration of the reconstructed free-energy surface of transition A (Fig. 2 A) at larger values of z identified a well-defined and localized state 4 (s ≈ 0.8 and 0.02 ≤ z ≤ 0.03 Å2), far from the conformations of the representative trajectory of transition A that were used to define the collective variables for metadynamics. State 4 is characterized by slight distance changes (<2.5 Å in column 4 of Table S1), which are nevertheless sufficient to break the ionic lock at the cytoplasmic side (Fig. 3 D). Visual inspection of the conformations in the free-energy basin 4 confirms their similarity to the structures visited in C4 of the ABMD runs 8–10 that define transition B (see Fig. 1). To further show the similarity between these structures, we performed a second set of metadynamics simulations on the B transition (Fig. S1), using path collective variables derived from the alternative representative trajectory from ABMD. The reconstructed average free-energy of transition B is reported as a function of these variables in Fig. S6. Conformations extracted from the basins identified by these metadynamics simulations were indeed similar to those characterized by the first set of metadynamics runs using frames from transition A.
Mutations stabilizing different amplitudes of TM6 opening
The aforementioned results provide insights into the interactions that stabilize the metastable intermediates sampled by rhodopsin during late activation events. Thus, specific mutants might be designed that feature engineered stabilities with respect to wild-type rhodopsin. Given the importance of accurate structural information on intermediate states, we searched for mutations that would lock the receptor in specific conformations, possibly facilitating their experimental characterization.
A contact map difference between conformations extracted from states 2 and 3, pointed to K2315.66 as the residue whose contacts differed the most between the two proposed active states of rhodopsin exhibiting a significant separation of TM6 apart from TM3. We could not find in the literature any experimental information on mutations at this position. Notably, the recent opsin crystal structures drew attention to the K2315.66 residue as it participated in a new interaction with E2476.30. This interaction was maintained in all conformations extracted from the energy basin of state 3.
To test the importance of this interaction in stabilizing an opsinlike conformation, we repeated the metadynamics simulations described for wild-type rhodopsin using a model of a mutant receptor, in which the key residue K2315.66 was mutated to alanine, thus neutralizing the interaction between the cytoplasmic ends of helices TM5 and TM6 in their outermost conformation, achieved in basin 3. The rationale behind this proposed mutation is that an enthalpic destabilization of state 3 would lead to a larger fraction of receptors being locked in the previous state 2, thus increasing the chances for us to obtain relevant experimental information on this state. The resulting average free-energy, reconstructed from three different metadynamics simulations as a function of the variables s and z defined above, is depicted in Fig. S7. Although the overall topology of the free-energy surface is very similar to that of wild-type rhodopsin (Fig. 2), the predicted destabilization of state 3 in the mutant simulations is particularly evident from the data reported in Fig. S5, D–F, where the blue lines refer to the simulations of the K2315.66A mutant with charged E1343.49 and the red lines are representative of the K2315.66A mutant simulations with uncharged E1343.49.
Conclusions
To the best of our knowledge, this is the first time that possible activation pathways and metastable active states of GPCRs are proposed as the result of free-energy calculations from biased MD simulations toward an opsinlike conformation. The results of ABMD simulations on bovine rhodopsin point to at least two different transitions between an experimental photoactivated deprotonated state of the receptor and an opsinlike state in the presence of 11-trans-retinal. The thermodynamic behavior of the system along these proposed activation pathways was evaluated by several different metadynamics runs, using as reaction coordinates both the position along, and the distance from, preidentified representative transition trajectories obtained by ABMD. At least four common metastable states were confirmed between the crystallographic structures 2I37 and 3CAP. Based on intramolecular distance analysis and comparison to experimental values obtained by DEER spectroscopy, we propose that two of these metastable states are putative active states along the pathway describing late activation events of rhodopsin. Structural analysis of the two minima exhibiting significant outward movement of TM6 (states 2 and 3) suggested a specific residue (K2315.66) whose mutation would contribute more significantly to the stabilization of one state over the other. In fact, additional metadynamics simulations carried out on the K2315.66A mutant revealed a less stable state 3 for this system, which appeared to be trapped into a more stable state 2. Based on inferences from these simulations, we propose this mutant as worth of experimental testing, as its experimental characterization may shed new light into mechanisms of allosteric modulation of rhodopsin function.
Supporting Material
Additional methods, one table, and seven figures are available at http://www.biophysj.org/biophysj/supplemental/S0006-3495(10)00212-2.
Supporting Material
Acknowledgments
The authors are grateful to Dr. Krzysztof Palczewski for useful discussions, and to Dr. Jennifer Johnston for comments on the manuscript.
This work was supported by National Institutes of Health grant No. DA020032 and No. DA026434 from the National Institute on Drug Abuse. The computations were supported in part by the National Science Foundation through TeraGrid advanced computing resources provided by TeraGrid Resource Allocations Committee program No. MCB080077.
References
- 1.Ballesteros J., Weinstein H. Integrated methods for the construction of three dimensional models and computational probing of structure function relations in G protein-coupled receptors. In: Sealfon C.P., editor. Methods in Neurosciences. Academic Press; San Diego, CA: 1995. [Google Scholar]
- 2.Bortolato A., Mobarec J.C., Filizola M. Progress in elucidating the structural and dynamic character of G protein-coupled receptor oligomers for use in drug discovery. Curr. Pharm. Des. 2009;15:4017–4025. doi: 10.2174/138161209789824768. [DOI] [PMC free article] [PubMed] [Google Scholar]
- 3.Ridge K.D., Palczewski K. Visual rhodopsin sees the light: structure and mechanism of G protein signaling. J. Biol. Chem. 2007;282:9297–9301. doi: 10.1074/jbc.R600032200. [DOI] [PubMed] [Google Scholar]
- 4.Morizumi T., Imai H., Shichida Y. Direct observation of the complex formation of GDP-bound transducin with the rhodopsin intermediate having a visible absorption maximum in rod outer segment membranes. Biochemistry. 2005;44:9936–9943. doi: 10.1021/bi0504512. [DOI] [PubMed] [Google Scholar]
- 5.Arnis S., Hofmann K.P. Two different forms of metarhodopsin II: Schiff base deprotonation precedes proton uptake and signaling state. Proc. Natl. Acad. Sci. USA. 1993;90:7849–7853. doi: 10.1073/pnas.90.16.7849. [DOI] [PMC free article] [PubMed] [Google Scholar]
- 6.Lüdeke S., Mahalingam M., Vogel R. Rhodopsin activation switches in a native membrane environment. Photochem. Photobiol. 2009;85:437–441. doi: 10.1111/j.1751-1097.2008.00490.x. [DOI] [PubMed] [Google Scholar]
- 7.Knierim B., Hofmann K.P., Hubbell W.L. Sequence of late molecular events in the activation of rhodopsin. Proc. Natl. Acad. Sci. USA. 2007;104:20290–20295. doi: 10.1073/pnas.0710393104. [DOI] [PMC free article] [PubMed] [Google Scholar]
- 8.Kobilka B.K., Deupi X. Conformational complexity of G-protein-coupled receptors. Trends Pharmacol. Sci. 2007;28:397–406. doi: 10.1016/j.tips.2007.06.003. [DOI] [PubMed] [Google Scholar]
- 9.Sommer M.E., Smith W.C., Farrens D.L. Dynamics of arrestin-rhodopsin interactions: arrestin and retinal release are directly linked events. J. Biol. Chem. 2005;280:6861–6871. doi: 10.1074/jbc.M411341200. [DOI] [PubMed] [Google Scholar]
- 10.Nakamichi H., Okada T. Crystallographic analysis of primary visual photochemistry. Angew. Chem. Int. Ed. Engl. 2006;45:4270–4273. doi: 10.1002/anie.200600595. [DOI] [PubMed] [Google Scholar]
- 11.Nakamichi H., Okada T. Local peptide movement in the photoreaction intermediate of rhodopsin. Proc. Natl. Acad. Sci. USA. 2006;103:12729–12734. doi: 10.1073/pnas.0601765103. [DOI] [PMC free article] [PubMed] [Google Scholar]
- 12.Ruprecht J.J., Mielke T., Schertler G.F. Electron crystallography reveals the structure of metarhodopsin I. EMBO J. 2004;23:3609–3620. doi: 10.1038/sj.emboj.7600374. [DOI] [PMC free article] [PubMed] [Google Scholar]
- 13.Salom D., Lodowski D.T., Palczewski K. Crystal structure of a photoactivated deprotonated intermediate of rhodopsin. Proc. Natl. Acad. Sci. USA. 2006;103:16123–16128. doi: 10.1073/pnas.0608022103. [DOI] [PMC free article] [PubMed] [Google Scholar]
- 14.Altenbach C., Kusnetzow A.K., Hubbell W.L. High-resolution distance mapping in rhodopsin reveals the pattern of helix movement due to activation. Proc. Natl. Acad. Sci. USA. 2008;105:7439–7444. doi: 10.1073/pnas.0802515105. [DOI] [PMC free article] [PubMed] [Google Scholar]
- 15.Park J.H., Scheerer P., Ernst O.P. Crystal structure of the ligand-free G-protein-coupled receptor opsin. Nature. 2008;454:183–187. doi: 10.1038/nature07063. [DOI] [PubMed] [Google Scholar]
- 16.Scheerer P., Park J.H., Ernst O.P. Crystal structure of opsin in its G-protein-interacting conformation. Nature. 2008;455:497–502. doi: 10.1038/nature07330. [DOI] [PubMed] [Google Scholar]
- 17.Lodowski D.T., Angel T.E., Palczewski K. Comparative analysis of GPCR crystal structures. Photochem. Photobiol. 2009;85:425–430. doi: 10.1111/j.1751-1097.2008.00516.x. [DOI] [PMC free article] [PubMed] [Google Scholar]
- 18.Vanni S., Neri M., Rothlisberger U. Observation of “ionic lock” formation in molecular dynamics simulations of wild-type β1 and β2 adrenergic receptors. Biochemistry. 2009;48:4789–4797. doi: 10.1021/bi900299f. [DOI] [PubMed] [Google Scholar]
- 19.Dror R.O., Arlow D.H., Shaw D.E. Identification of two distinct inactive conformations of the β2-adrenergic receptor reconciles structural and biochemical observations. Proc. Natl. Acad. Sci. USA. 2009;106:4689–4694. doi: 10.1073/pnas.0811065106. [DOI] [PMC free article] [PubMed] [Google Scholar]
- 20.Romo T.D., Grossfield A., Pitman M.C. Concerted interconversion between ionic lock substates of the β2 adrenergic receptor revealed by microsecond timescale molecular dynamics. Biophys. J. 2010;98:76–84. doi: 10.1016/j.bpj.2009.09.046. [DOI] [PMC free article] [PubMed] [Google Scholar]
- 21.Lyman E., Higgs C., Voth G.A. A role for a specific cholesterol interaction in stabilizing the Apo configuration of the human A2A adenosine receptor. Structure. 2009;17:1660–1668. doi: 10.1016/j.str.2009.10.010. [DOI] [PMC free article] [PubMed] [Google Scholar]
- 22.Mobarec J.C., Filizola M. Advances in the development and application of computational methodologies for structural modeling of G-protein-coupled receptors. Expert Opin. Drug Discov. 2008;3:343–355. doi: 10.1517/17460441.3.3.343. [DOI] [PMC free article] [PubMed] [Google Scholar]
- 23.Thorgeirsson T.E., Lewis J.W., Kliger D.S. Effects of temperature on rhodopsin photointermediates from lumirhodopsin to metarhodopsin II. Biochemistry. 1993;32:13861–13872. doi: 10.1021/bi00213a015. [DOI] [PubMed] [Google Scholar]
- 24.Hornak V., Ahuja S., Smith S.O. Light activation of rhodopsin: insights from molecular dynamics simulations guided by solid-state NMR distance restraints. J. Mol. Biol. 2009 doi: 10.1016/j.jmb.2009.12.003. 2009 Dec 11 [Epub ahead of print] [DOI] [PMC free article] [PubMed] [Google Scholar]
- 25.Marchi M., Ballone P. Adiabatic bias molecular dynamics: a method to navigate the conformational space of complex molecular systems. J. Chem. Phys. 1999;110:3697–3702. [Google Scholar]
- 26.Paci E., Karplus M. Forced unfolding of fibronectin type 3 modules: an analysis by biased molecular dynamics simulations. J. Mol. Biol. 1999;288:441–459. doi: 10.1006/jmbi.1999.2670. [DOI] [PubMed] [Google Scholar]
- 27.Barducci A., Bussi G., Parrinello M. Well-tempered metadynamics: a smoothly converging and tunable free-energy method. Phys. Rev. Lett. 2008;100:020603. doi: 10.1103/PhysRevLett.100.020603. [DOI] [PubMed] [Google Scholar]
- 28.Van Der Spoel D., Lindahl E., Berendsen H.J. GROMACS: fast, flexible, and free. J. Comput. Chem. 2005;26:1701–1718. doi: 10.1002/jcc.20291. [DOI] [PubMed] [Google Scholar]
- 29.Bonomi M., Branduardi D., Parrinello M. PLUMED: a portable plugin for free-energy calculations with molecular dynamics. Comput. Phys. Commun. 2009;180:1961–1972. [Google Scholar]
- 30.Wang C., Bradley P., Baker D. Protein-protein docking with backbone flexibility. J. Mol. Biol. 2007;373:503–519. doi: 10.1016/j.jmb.2007.07.050. [DOI] [PubMed] [Google Scholar]
- 31.Periole X., Ceruso M.A., Mehler E.L. Acid-base equilibria in rhodopsin: dependence of the protonation state of Glu134 on its environment. Biochemistry. 2004;43:6858–6864. doi: 10.1021/bi049949e. [DOI] [PubMed] [Google Scholar]
- 32.Tieleman D.P., MacCallum J.L., Monticelli L. Membrane protein simulations with a united-atom lipid and all-atom protein model: lipid-protein interactions, side chain transfer free energies and model proteins. J. Phys. Condens. Matter. 2006;18:1221–1234. doi: 10.1088/0953-8984/18/28/S07. [DOI] [PubMed] [Google Scholar]
- 33.Berger O., Edholm O., Jähnig F. Molecular dynamics simulations of a fluid bilayer of dipalmitoylphosphatidylcholine at full hydration, constant pressure, and constant temperature. Biophys. J. 1997;72:2002–2013. doi: 10.1016/S0006-3495(97)78845-3. [DOI] [PMC free article] [PubMed] [Google Scholar]
- 34.Jorgensen W.L., Tirado-Rives J. The OPLS potential functions for proteins. Energy minimizations for crystals of cyclic peptides and crambin. J. Am. Chem. Soc. 1988;110:1657–1666. doi: 10.1021/ja00214a001. [DOI] [PubMed] [Google Scholar]
- 35.Kandt C., Ash W.L., Tieleman D.P. Setting up and running molecular dynamics simulations of membrane proteins. Methods. 2007;41:475–488. doi: 10.1016/j.ymeth.2006.08.006. [DOI] [PubMed] [Google Scholar]
- 36.Seelig A., Seelig J. Effect of a single cis double bond on the structures of a phospholipid bilayer. Biochemistry. 1977;16:45–50. doi: 10.1021/bi00620a008. [DOI] [PubMed] [Google Scholar]
- 37.Berendsen H.J.C., Grigera J.R., Straatsma T.P. The missing term in effective pair potentials. J. Phys. Chem. 1987;91:6269–6271. [Google Scholar]
- 38.Parrinello M., Rahman A. Crystal structure and pair potentials: a molecular-dynamics study. Phys. Rev. Lett. 1980;45:1196–1199. [Google Scholar]
- 39.Nose S., Klein M.L. Constant pressure molecular dynamics for molecular systems. Mol. Phys. 1983;50:1055–1076. [Google Scholar]
- 40.Hess B., Bekker H., Fraaije J.G.E.M. LINCS: a linear constraint solver for molecular simulations. J. Comput. Chem. 1997;18:1463–1472. [Google Scholar]
- 41.Miyamoto S., Kollman P.A. SETTLE: an analytical version of the SHAKE and RATTLE algorithm for rigid water models. J. Comput. Chem. 1992;13:952–962. [Google Scholar]
- 42.Darden T., York D., Pedersen L. Particle mesh Ewald. (PME): an N log(N) method for Ewald sums in large systems. J. Chem. Phys. 1993;98:10089–10092. [Google Scholar]
- 43.Schlitter J., Engels M., Krüger P. Targeted molecular dynamics: a new approach for searching pathways of conformational transitions. J. Mol. Graph. 1994;12:84–89. doi: 10.1016/0263-7855(94)80072-3. [DOI] [PubMed] [Google Scholar]
- 44.van der Vaart A., Karplus M. Simulation of conformational transitions by the restricted perturbation-targeted molecular dynamics method. J. Chem. Phys. 2005;122:114903. doi: 10.1063/1.1861885. [DOI] [PubMed] [Google Scholar]
- 45.Cox T.F., Cox M.A.A. Chapman & Hall; London: 1994. Multidimensional Scaling. [Google Scholar]
- 46.Branduardi D., Gervasio F.L., Parrinello M. From A to B in free energy space. J. Chem. Phys. 2007;126:054103. doi: 10.1063/1.2432340. [DOI] [PubMed] [Google Scholar]
- 47.Bonomi M., Branduardi D., Parrinello M. The unfolded ensemble and folding mechanism of the C-terminal GB1 β-hairpin. J. Am. Chem. Soc. 2008;130:13938–13944. doi: 10.1021/ja803652f. [DOI] [PubMed] [Google Scholar]
- 48.Vogel R., Ruprecht J., Siebert F. Rhodopsin photoproducts in 2D crystals. J. Mol. Biol. 2004;338:597–609. doi: 10.1016/j.jmb.2004.03.006. [DOI] [PubMed] [Google Scholar]
- 49.Niu S.L., Mitchell D.C., Litman B.J. Manipulation of cholesterol levels in rod disk membranes by methyl-β-cyclodextrin: effects on receptor activation. J. Biol. Chem. 2002;277:20139–20145. doi: 10.1074/jbc.M200594200. [DOI] [PubMed] [Google Scholar]
- 50.Khelashvili G., Grossfield A., Weinstein H. Structural and dynamic effects of cholesterol at preferred sites of interaction with rhodopsin identified from microsecond length molecular dynamics simulations. Proteins. 2008;76:403–417. doi: 10.1002/prot.22355. [DOI] [PMC free article] [PubMed] [Google Scholar]
- 51.Ahuja S., Hornak V., Eilers M. Helix movement is coupled to displacement of the second extracellular loop in rhodopsin activation. Nat. Struct. Mol. Biol. 2009;16:168–175. doi: 10.1038/nsmb.1549. [DOI] [PMC free article] [PubMed] [Google Scholar]
Associated Data
This section collects any data citations, data availability statements, or supplementary materials included in this article.