Abstract
Primary organic aerosol (POA) and associated vapors can play an important role in determining the formation and properties of secondary organic aerosol (SOA). If SOA and POA are miscible, POA will significantly enhance SOA formation and some POA vapor will incorporate into SOA particles. When the two are not miscible, condensation of SOA on POA particles forms particles with complex morphology. In addition, POA vapor can adsorb to the surface of SOA particles increasing their mass and affecting their evaporation rates. To gain insight into SOA/POA interactions we present a detailed experimental investigation of the morphologies of SOA particles formed during ozonolysis of α-pinene in the presence of dioctyl phthalate (DOP) particles, serving as a simplified model of hydrophobic POA, using a single-particle mass spectrometer. Ultraviolet laser depth-profiling experiments were used to characterize two different types of mixed SOA/DOP particles: those formed by condensation of the oxidized α-pinene products on size-selected DOP particles and by condensation of DOP on size-selected α-pinene SOA particles. The results show that the hydrophilic SOA and hydrophobic DOP do not mix but instead form layered phases. In addition, an examination of homogeneously nucleated SOA particles formed in the presence of DOP vapor shows them to have an adsorbed DOP coating layer that is ∼4 nm thick and carries 12% of the particles mass. These results may have implications for SOA formation and behavior in the atmosphere, where numerous organic compounds with various volatilities and different polarities are present.
Keywords: secondary organic aerosol, single-particle mass spectrometry, morphology
Anthropogenic aerosol particles in large urban areas are implicated in air quality and health-related problems and are a source of significant uncertainty in our current understanding of climate change at regional and global scales (1). Recent field studies indicate that organic aerosols (OA) constitute anywhere between 20 and 90% of the total dry fine particulate mass (2). Secondary organic aerosol (SOA), generated from the oxidation reaction products of volatile and semivolatile organic compounds (SVOC), is thought to constitute between 64 and 95% of the total OA mass (3). The development of SOA formation models at present represent a major research activity aimed at reconciling the significant differences between field measured SOA concentrations and those predicted by current SOA models in both polluted urban and regional areas (4). Although a number of attempts have been made to explain this discrepancy, none have yet closed the gap between predicted and observed SOA concentrations (4–6).
SOA formation can be enhanced in the presence of primary organic aerosols (POA) that serve as additional organic mass to absorb greater amounts of oxidized organic molecules, thus lowering their vapor pressures and increasing SOA formation yields. For POA to absorb SOA, a single well-mixed SOA + POA phase must form. However, Song et al. (7) found that SOA formation during ozonolysis of α-pinene is not enhanced by the presence of aerosols composed of dioctyl phthalate or lubricating oil and inferred that these model POA systems, which are mostly composed of hydrophobic organics, and SOA exist in separate phases in the mixed particles. A recent study (8) provides some indirect evidence that was interpreted to suggest that diesel exhaust particles and biogenic SOA can form a mixed organic phase, while a mixture of SOA particles and POA composed of motor oil and diesel fuel do not mix. Although these indirect methods provide some useful information on the mixing state of POA + SOA particles, a direct experimental determination of the real morphology of different mixed particles is still required. This type of information would help guide SOA formation models that use empirical fits to laboratory data to calculate yields and partitioning coefficients (4, 5, 9) and have recently incorporated an option to include or exclude phase separation between POA and SOA phases (10).
We have previously demonstrated a particle depth-profiling technique by using a single-particle mass spectrometer [SPLAT II (11)] to record the mass spectra (MS) of size-selected aerosol particles at different UV laser powers (12). Because low laser powers preferentially ablate and ionize surface molecules, this technique makes it possible to identify which compounds are present on the surface and can therefore distinguish between mixed and layered structures. In the present work, this technique is applied to characterize the morphologies of internally mixed particles composed of SOA, formed by the reaction of α-pinene with ozone, which is a common oxidation reaction that produces atmospheric SOA (12–14), and the hydrophobic dioctyl phthalate (DOP), which serves here as a simplified proxy for hydrophobic organic POA. By using DOP this study builds on the work of Song et al. (7) to provide a simple starting point for understanding the interactions of hydrophobic organics with multicomponent hydrophilic SOA. It is further notable that DOP is a good model system for the hydrophobic species that comprise urban anthropogenic POA (13). By generating and characterizing both SOA-coated DOP and DOP-coated SOA particles at low UV laser power (where the preference for surface ionization is most evident), we show that these internally mixed particles have distinct separate phases, indicating that the hydrophilic SOA does not mix with the hydrophobic DOP.
Furthermore, we show that it is important to consider the effect(s) of insoluble gas-phase organic compounds on SOA particles. Organic vapor adsorption onto ambient particles is a rather well-known mechanism of gas-particle partitioning that is most commonly described using Junge-Pankow adsorption model (14, 15). This process is responsible, for example, for the uptake and long-range transport of toxic persistent organic pollutants. Current SOA models, however, focus primarily on the process of absorption and mixing states of the different phases in the aerosol (6). In this context, we present detailed measurements of the composition and morphology of SOA particles formed by homogeneous nucleation in the presence of DOP vapor that indicate that these 158 nm particles are encapsulated by a ∼4 nm thick layer of surface-adsorbed DOP. In addition, we find that SOA particles briefly exposed to DOP vapor after their formation and growth acquire a thinner DOP coat that is about a monolayer thick. This provides direct experimental verification that DOP, an SVOC, is adsorbed on the SOA particle surface and should be considered. We further conclude that whether SOA forms by homogeneous nucleation or by condensation on DOP particles, it acquires a thin DOP coat and can exist in metastable, layered phases. The observation of adsorption during SOA formation could have important ramifications for understanding the behavior of SOA and, in general, for bridging the gap between experiments and simulations of SOA formation and behavior in the atmosphere.
Results and Discussion
The Morphology of SOA-Coated NaCl Particles and the Phase of α-Pinene SOA.
In previous studies of particle morphologies using SPLAT II, dry NaCl particles were coated by either pyrene or DOP (12). Pyrene [solid at room temperature (RT)] and DOP (liquid at RT) are both hydrophobic substances and do not mix with the insoluble NaCl core. Also, pyrene and DOP, like NaCl, have a high propensity to form ions by UV-laser ablation, and importantly, the simplicity of the NaCl mass spectral signature makes it possible to unambiguously track the NaCl MS signals over all laser powers despite the fact that the organic molecule MS are complex and highly dependent on laser power (16). At lower laser power the MS signals are dominated by the surface molecules, while at high laser power the particle is almost completely ablated and ionized and the core is observable (12). Thus, it is possible to determine which substance is on the surface and even whether the coating covers the entire particle surface using this technique.
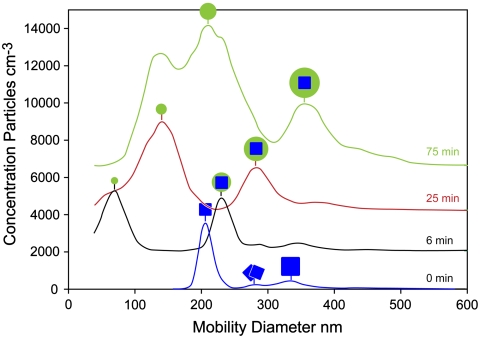
We first consider the morphology of NaCl particles coated with oxidation products from the ozonolysis of α-pinene. This set of measurements provides the means to determine the SOA phase and yields direct information on the efficacy of the depth-profiling technique as applied to the organics that comprise SOA. SOA formed by α-pinene oxidation with ozone contains a mixture of polar organics [mostly acids (17, 18)], which NaCl may be slightly soluble in, as has been observed for mixed OA-NaNO3 particles (19). In the set of experiments whose results are presented in Figs. 1–3, dry, size-selected NaCl particles with mobility diameter of 200 nm (dm) were introduced into a Teflon bag into which α-pinene and ozone were added. The oxidized reaction products can either condense on the NaCl particles or form new particles by homogeneous nucleation. The particle mobility size distributions as a function of reaction time are shown in Fig. 1. Before the reaction starts at (t = 0) the bag contains only NaCl particles, most of which are 200 nm in diameter. Two additional small peaks at 280 nm and 321 nm correspond to dimers and doubly charged NaCl particles, respectively, as marked. Six minutes after the reaction, homogeneous SOA nucleation leads to a new peak at 80 nm, and as the NaCl particles are coated their diameter increases. After 75 min, the diameter of the SOA-coated NaCl particles stabilizes at 360 nm, which corresponds to an 80 nm thick coat of SOA. It is clear from Fig. 1 that the homogeneously nucleated SOA particles can easily be separated from SOA-coated NaCl particles.
Fig. 1.
Mobility size distributions of NaCl and SOA-containing particles as a function of reaction time.
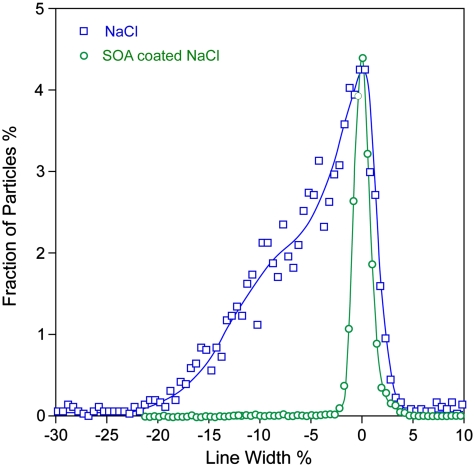
Fig. 2.
Vacuum aerodynamic diameter (dva) distributions of coated and uncoated NaCl particles as measured by SPLAT. The two distributions are shown scaled to their maximum dva to demonstrate the significant differences in distribution line-widths, and thus, particle shapes.
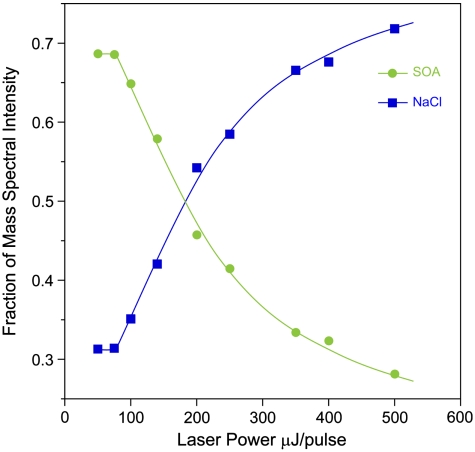
Fig. 3.
Relative intensities of NaCl and SOA mass spectral peaks in the MS of SOA-coated NaCl particles as a function of laser power.
We used a differential mobility analyzer (DMA) to select SOA-coated NaCl particles at dm = 360 nm and SPLAT II (11) to measure their vacuum aerodynamic size (dva) distributions and MS. The dva size distributions of coated NaCl particles and uncoated NaCl particles are shown in Fig. 2. The dva distribution of the uncoated NaCl particles is broad and asymmetric indicating that they are aspherical (20). The distribution of the coated particles is narrow (FWHM 5%) and symmetric, indicating that the coated particles are spherical (20). The mean dva of the coated particles is 477 nm, yielding a density of 1.33 g cm-3, consistent with SOA density of 1.21 g cm-3 (20) and a dynamic shape factor of 1.08 for the dry NaCl (12). We have previously shown that SOA particles formed by α-pinene oxidation with ozone are spherical and noted that they could be solid spheres (20). The observation that coating aspherical NaCl particles by SOA results in spherical particles strongly suggests that the mixture of organics that comprise this SOA is liquid.
We used depth-profiling to determine the morphology of the coated NaCl particles by recording the MS of the coated particles with different laser powers. While the SOA MS are complex, mass peaks characteristic of NaCl, observed at m/z of 23 (Na+), 46 ( ), 81 (Na2Cl+), and 139 (
 ), are easily distinguished from MS signals corresponding to SOA. The relative intensities of the NaCl and SOA mass peaks from the SOA-coated NaCl particles are shown as a function of laser power in Fig. 3. At low laser power, the NaCl signal is much lower than the SOA signal, and as the power increases, the relative NaCl signal increases. Based on the acquired MS of pure NaCl and SOA particles as function of laser power, we determine that the NaCl and SOA particles have similar ablation-ionization thresholds and ion signal power dependence and conclude that the differences in NaCl-to-SOA signal ratios as laser power increases are due primarily to the particle morphology. The intensity pattern in Fig. 3 is typical of what we have seen before for coated NaCl particles in the depth-profiling studies and shows that SOA is on the particle surface.
From Fig. 3 it is clear that significant NaCl signal is present even at the lowest laser power (relative intensity of 0.32), in contrast to previous experiments of NaCl particles coated with DOP. This behavior most likely indicates that NaCl is slightly soluble in the hydrophilic SOA, although it is possible that the low ionization cross section of the SOA material means that some UV photons can reach the particle core at low laser power. In any case, the depth-profiling experiment conclusively identifies the particle morphology: the SOA relative signal is much higher at low laser power, because the surface molecules are preferentially ablated and ionized.
DOP/SOA and SOA/DOP Particles.
The morphology of internally mixed DOP/SOA particles is of interest because of their relevance to OA in the atmosphere. The question we address here is whether the mixture of hydrophilic compounds that constitutes α-pinene SOA dissolves in DOP, or form instead layered particles composed of separate phases.
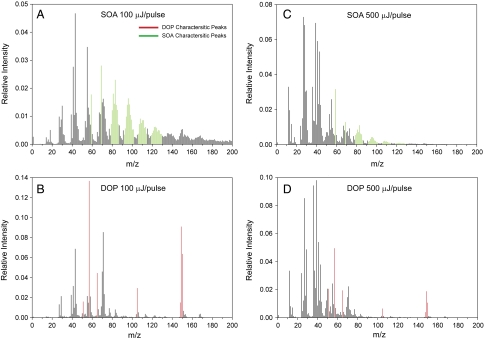
We first note that an important requirement of the depth-profiling technique is the ability to use MS to distinguish the relevant chemical compositions in the particles. While this is straightforward for the NaCl/SOA system (vide supra), several complicating factors arise in mixed organic particles. These are illustrated in Fig. 4, which shows the MS of pure SOA and DOP at low (Fig. 4 A and B) and intermediate (Fig. 4 C and D) laser powers. The MS pattern of each species is dependent on the UV laser power, with higher laser power resulting in greater fragmentation and yielding more low-mass ions. Despite the complications, it is possible to identify some mass peaks characteristic of DOP and SOA, as indicated in Fig. 4 in red and green, respectively. The specified mass peaks can be used to distinguish chemical compositions in internally mixed DOP/SOA particles. A close inspection shows that many peaks characteristic of SOA are also observed, albeit in lower intensity, in the DOP MS (e.g., m/z 83), demonstrating the need for background subtraction when analyzing the MS of mixed particles.
Fig. 4.
Mass spectra of pure 195 nm DOP particles and pure 200 nm SOA particles at laser powers of 100 μJ/pulse and 500 μJ/pulse, as marked. Characteristic SOA and DOP peaks are indicated in green and red, respectively.
A depth-profiling experiment on the DOP/SOA particles like that presented in Fig. 3 for SOA/NaCl particles would entail analyzing the changes in MS intensities as a function of laser power. For the DOP/SOA particles, such an analysis is complicated by the large changes in MS at different laser power and the fact that many low-mass ions, dominant in the MS at high laser power, are the same for both compounds. It is possible, however, to circumvent these problems by generating particles of two opposite morphologies: one with SOA-coated DOP and the other with DOP-coated SOA. The former can be produced by oxidizing α-pinene with ozone in the presence of the size-selected DOP particles and the latter generated by passing pure size-selected SOA particles, formed in a clean, DOP-free bag, over heated DOP. If SOA and DOP form a homogeneous single phase, the relative MS intensities at any given laser power should be independent of particle type and instead reflect only concentrations. If on the other hand the two substances are immiscible and form separate phases within particles with opposite morphologies, a comparison between their low laser-power MS should provide a clear indication of layered morphology. Since only one of these two morphological forms can be thermodynamically stable, we must consider the possibility that they might equilibrate before the MS are recorded and would yield virtually identical MS.
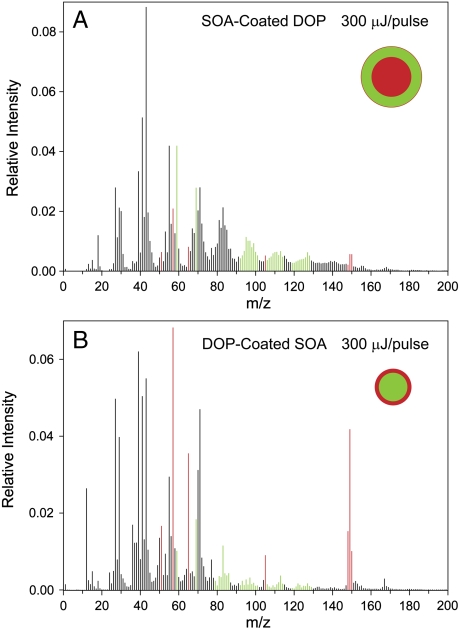
The MS of these two particle types, recorded at 300 μJ/pulse, are shown in Fig. 5 A and B. Fig. 5A is of particles composed of 29% DOP and 71% SOA generated by coating 195 nm DOP particles with a 50 nm layer of SOA. Fig. 5B is of particles composed of 48% SOA and 52% DOP formed by coating 140 nm SOA particles with a 20 nm layer of DOP. The MS in Fig. 5 clearly show that the substance on the particle surface exhibits higher intensity (to a much greater degree than could be explained simply by the relative compositions), and moreover, the relative SOA/DOP intensity pattern remains stable for many hours. Thus, these data provide evidence that SOA is not miscible in DOP and that the particles are structured in separate, layered phases. The fact that the two different particle morphologies remain stable for a number of hours indicates that the transformation to the thermodynamically stable form is very slow, on an atmospherically relevant timescale.
Fig. 5.
Mass spectra of SOA-coated DOP particles (A) and DOP-coated SOA particles (B), recorded at laser power of 300 μJ/pulse.
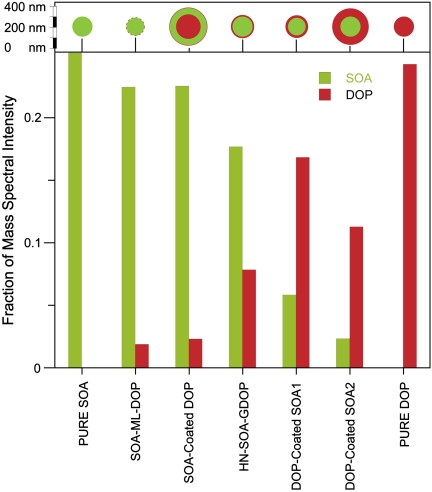
Fig. 6 provides, in bar graph form, a summary of the data extracted from Fig. 5 and the results of similar analysis of other pure and internally mixed SOA/DOP particles. Here again, comparison between SOA-coated DOP and two types of DOP-coated SOA particles shows that the surface material exhibits higher MS intensity.
Fig. 6.
Relative intensity of DOP and SOA characteristic MS peaks at 300 μJ/pulse for seven different types of particles characterized in this work. (Upper) A schematic of particle sizes and morphologies drawn to scale.
As with the NaCl/SOA particles, when SOA is generated in the presence of DOP particles a significant fraction of the oxidized organics form SOA particles by homogeneous nucleation, except that in this case they nucleate and grow in the presence of gas-phase DOP (HN-SOA-GDOP). From Fig. 6, the MS of these SOA particles exhibit strong intensity in the DOP signal. Moreover, a comparison between the MS of HN-SOA-GDOP and the MS of SOA-coated DOP particles shows that at 300 μJ/pulse the former has higher DOP intensity. In other words, the data demonstrate that when SOA particles form and grow in the presence of gas-phase DOP, which must be present in the Teflon bag at a vapor pressure of 1.25 × 10⁻⁷ Torr or less (21), they adsorb a significant amount of DOP.
To help estimate the thickness of the DOP coat acquired by the SOA particles formed by homogeneous nucleation in the presence of the gas-phase DOP (HN-SOA-GDOP), we generated SOA particles in the absence of DOP and passed these pure SOA particles over DOP at RT. As expected, these SOA particles are coated with a DOP layer that is too thin to be unambiguously observed as a change in dm or dva but is easily detected in the MS, especially at very low laser power. This thinly coated particle type (labeled SOA-ML-DOP) offers an additional data point that is used to develop a consistent scale of SOA/DOP MS intensities, in which all the observed coated particle types are included.
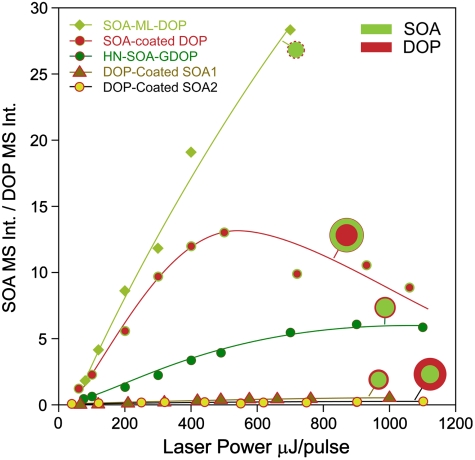
We make use of the data observed at all laser powers, which are presented in Fig. 7 in a plot of the ratio of the SOA-to-DOP characteristic MS intensities as a function of laser power for the five types of coated particles used in this study. The data show that the SOA-ML-DOP particles have, as expected, the highest SOA MS signals followed by SOA-coated DOP particles. The data for these SOA-coated DOP particles also show that when the laser power is increased above 500 μJ/pulse, the relative DOP intensity from SOA-coated DOP particles significantly increases with laser power, suggesting that at these laser powers the DOP core becomes observable. This behavior strongly suggests that the DOP signal observed in these particles at lower power is due to a small amount of surface adsorbed DOP. This means that while the original 195 nm DOP seed remains beneath a thick SOA coat, the SOA-coated DOP particles actually have a thin, but detectable, DOP coat, as illustrated by the cartoons in Figs. 5–7.
Fig. 7.
The ratio of the SOA/DOP characteristic mass spectral peak intensities as a function of laser power for different particle types.
Using observations compiled from all particle types at all laser powers, we estimate the unknown DOP coating thicknesses based on the absolute MS intensities, the relative SOA/DOP MS intensities, particle densities, and observed changes in dm and dva. We conclude that the thin DOP coating on the “clean” SOA particle exposed to DOP at RT is approximately a monolayer thick (slightly less than 1 nm). The set of bars labeled SOA-ML-DOP in Fig. 6 show that this class of particles has much lower DOP MS signals as compared to HN-SOA-GDOP. Based on this monolayer estimate, we find that the HN-SOA-GDOP particles are coated with a ∼4 nm thick DOP layer, which is consistent with the fact that they were measured to have a density of 1.19 ± 0.02 g cm-3 as compared with pure SOA particles whose density is 1.21 ± 0.02 g cm-3. Although 4 nm is a relatively thin layer it is worth noting that it carries ∼12% of the particle mass. A further comparison between all MS at laser powers below 100 μJ indicates that the DOP layer on the SOA-coated DOP particles is only ∼1.5 times that of SOA-ML-DOP particles.
Returning to Fig. 6, we note that the relative DOP intensity in SOA-coated DOP particles is lower than that observed in HN-SOA-GDOP. A simple explanation is that these particles, whose relative DOP content is about twice that of the HN-SOA-GDOP particles, have most of their DOP underneath a thick SOA coat making it difficult to observe the core at laser powers below 300 μJ/pulse.
Discussion.
Depth-profiling of SOA-coated NaCl particles indicate that SOA-coated NaCl particles are spherical and that NaCl is slightly soluble in SOA. Further, the line-shape of the dva size distribution indicates that the chemical mixture that constitutes this SOA is in the liquid phase. The experimental results for the internally mixed SOA/DOP particles (both the MS and density data), summarized in Fig. 6, demonstrate that these two organics are immiscible and thus form layered particles. Despite the complexities arising from overlap in mass signals from the two organic molecules, and the extensive size- and composition-dependent fragmentation at high UV laser power, sharp contrasts between the results for well-defined, monodisperse SOA-coated DOP and DOP-coated SOA particles show that the coating molecules are on the surface while the seed remains in the particle interior. The finding that mixed OA may form layered rather than single-phase mixed particles signifies the need to consider the POA properties when modeling SOA/POA interactions.
Furthermore, it is important to note that at least one of the layered particles morphologies is metastable. Based on the expected diffusion rates, these particles would be expected to transform to the most stable morphology within seconds. While we did not investigate the timescales required for the particles to reach equilibrium, it is clear that the metastable phase separation persists on the order of many hours, which is long enough to be important for consideration in atmospheric aerosol models.
The present experiments clearly show that SOA condenses onto hydrophobic compounds. But, the present study also shows that as SOA forms, whether by homogeneous nucleation or by condensation onto DOP particles, it acquires a coating of DOP by surface adsorption from the gas phase. In other words, the HN-SOA-DOP and SOA-coated DOP particle types exist in layered states. Thus, we provide direct experimental evidence that insoluble molecules like DOP can affect SOA particles through surface adsorption (14, 15). This is relevant to atmospheric aerosols, because a potentially large number of hydrophobic organic molecules are present in the atmosphere and, similar to DOP, could play a role in determining the properties of SOA particles. Such an organic coating can add to the particle mass and eventual fate, by slowing evaporation and thereby impacting the gas-particle partitioning. Indeed, this would be similar to the process by which thin SOA coatings increase the water retention of NaNO3 particles, discussed recently by Zelenyuk et al (22). Cappa et al (19) showed that homogeneously mixed organic particles do not follow ideal or near-ideal solution-vapor pressure laws, and we note here that, on an atmospherically relevant timescale, surface coatings and phase separations observed in all DOP/SOA particle types in this study may cause deviations from what was assumed to be a well-mixed system. In addition, previous studies of OA-coated particles have shown that heterogeneous aerosol reactions (e.g., involving N2O5) are slowed by thin organic coatings on particles (23, 24). An organic coat like DOP could also protect SOA from heterogeneous chemistry with, for example, OH or O3.
A final remark is that many questions naturally arise from our observation that insoluble organic compounds can coat SOA during and after particle formation: How much is adsorbed? We have shown that surface interaction alone can result in a ∼4 nm thick coat, or ∼15% of the SOA volume from a single compound, but is this typical? What happens when there are many insoluble organics present? And how does this coat affect the SOA properties? These questions open new routes for investigation.
Conclusions
We investigated the morphology of internally mixed particles containing SOA from the O3 oxidation of α-pinene using a laser ablation single-particle mass spectrometer. The densities and asphericities, deduced from the dva, help infer the particle shapes, and UV-laser depth-profiling identifies which molecules are on the particle surface and which are in the interior. This methodology was first applied to SOA-coated NaCl particles. The results show that the SOA forms an exterior, liquid coating in which some NaCl is partially dissolved.
We used this technique to answer fundamental questions about the morphology of mixed organic particles containing DOP, a hydrophobic organic compound used in this work as a representative of hydrophobic POA and the hydrophilic mixture of chemicals in α-pinene SOA. By comparing and contrasting the MS intensities for SOA-coated DOP and DOP-coated SOA particles, we demonstrate that the two organic phases are separate. Observing these two morphologies for hours indicates that transformation of either of these to the thermodynamically stable form is slow. We have also observed that SOA particles exposed to DOP vapor and SOA coated onto DOP seeds both acquire a thin coat of DOP. When SOA particles homogeneously nucleate in the presence of DOP vapor, the formed particles have a ∼4 nm DOP coat. The finding that DOP tends to adsorb to SOA is surprising and may potentially have important relevance to OA in the atmosphere, where many insoluble compounds may be present. The thin outer coating of nonoxidized organic molecules could affect SOA evaporation rates and protect it from heterogeneous chemistry with OH or O3.
Materials and Methods
Particle Generation and Formation.
Pure and SOA-coated NaCl and DOP particles.
NaCl particles were generated by atomization from a 0.5 M aqueous solution and dried with two diffusion driers, and 200 nm particles were selected with a DMA and loaded into the 100 L Teflon bag. DOP particles were generated by homogeneous nucleation of supersaturated DOP vapor during transport from the glass tube with heated neat DOP to a RT environment and size-selected (at 195 nm) with a DMA. SOA was generated by introducing 200 ppb of α-pinene and ∼500 ppb of O3 to a 100 L Teflon bag. ∼250 ppm of cyclohexane was used as an OH scavenger. The gas-phase α-pinene reacted with O3 and in the absence of seed particles, the oxidized organics formed SOA particles by homogeneous nucleation. In the presence of preexisting seed particles (NaCl or DOP) some of the oxidized organics condensed on the size-selected seed particles. The size distributions of particles in the reaction bag were monitored with a scanning mobility particle sizer. Coating thickness on seed particles was controlled by empirically selecting the concentrations of α-pinene and seed particles.
DOP-coated SOA particles.
SOA particles were generated as described above and size-selected with a clean DMA and then passed over neat DOP. The size distribution of the SOA particles was monitored with a second DMA. At RT, the particles adsorbed a small amount of DOP, but not enough to detect a change in mobility diameter. The DOP was heated to ∼75–80 °C to create supersaturated vapor through which the SOA particles passed. No change in SOA particle diameter was observed at DOP temperatures below ∼75 °C, indicating that SOA did not evaporate significantly. Above 75 °C the SOA particles adsorbed DOP, and the coating thickness was controlled by changing the DOP temperature.
Measurements of Particle Compositions and Vacuum Aerodynamic Diameter.
Particles were size-selected with a DMA and sampled by SPLAT II, our single-particle mass spectrometer, which has been previously described in detail in other publications (11, 16). Briefly, the individual particle dva is determined by measuring its velocity. By measuring the position and the line-width of the dva distribution of DMA classified particles we obtain their densities or effective densities and determine whether they are spherical (20). Individual particles are ionized via ablation by an excimer laser (ArF, 193 nm) with 12 ns pulse duration and a focal spot that is ∼300 μm in diameter. For the depth-profiling experiments, the laser power was varied between 50 to over 1,000 μJ. MS were obtained using an angular reflectron time-of-flight mass spectrometer (R. M. Jordan, Inc., model D-850). Each data point presented here represents the analysis of ∼500–1,000 individual particle MS.
ACKNOWLEDGMENTS.
The authors would like to thank Dr. Manish Shrivastava for helpful discussions. This work was supported by the U.S. Department of Energy Office of Basic Energy Sciences, Division of Chemical Sciences, Geosciences, and Biosciences and Office of Biological and Environmental Research. This research was performed in the Environmental Molecular Sciences Laboratory, a national scientific user facility sponsored by the Department of Energy’s Office of Biological and Environmental Research at Pacific Northwest National Laboratory (PNNL). PNNL is operated by the U.S. Department of Energy by Battelle Memorial Institute under Contract DE-AC06-76RL0 1830.
Footnotes
The authors declare no conflict of interest.
This article is a PNAS Direct Submission.
References
- 1.Houghton JT, et al., editors. IPCC Climate Change 2007. Cambridge, UK: Cambridge Univ Press; 2007. The Scientific Basis, Contribution of Working Group I to the Third Assessment Report of the Intergovernmental Panel on Climate Change (IPCC) p. 944. [Google Scholar]
- 2.Kanakidou M, et al. Organic aerosol and global climate modelling: A review. Atmos Chem Phys. 2005;5:1053–1123. [Google Scholar]
- 3.Zhang Q, et al. Ubiquity and dominance of oxygenated species in organic aerosols in anthropogenically-influenced Northern Hemisphere midlatitudes. Geophys Res Lett. 2007;34(13):L13801. [Google Scholar]
- 4.de Gouw J, Jimenez JL. Organic aerosols in the Earth’s atmosphere. Environ Sci Technol. 2009;43:7614–7618. doi: 10.1021/es9006004. [DOI] [PubMed] [Google Scholar]
- 5.Robinson AL, et al. Rethinking organic aerosols: Semivolatile emissions and photochemical aging. Science. 2007;315(5816):1259–1262. doi: 10.1126/science.1133061. [DOI] [PubMed] [Google Scholar]
- 6.Donahue NM, Robinson AL, Pandis SN. Atmospheric organic particulate matter: From smoke to secondary organic aerosol. Atmos Environ. 2009;43:94–106. [Google Scholar]
- 7.Song C, et al. Effect of hydrophobic primary organic aerosols on secondary organic aerosol formation from ozonolysis of alpha-pinene. Geophys Res Lett. 2007;34(20):L20803. [Google Scholar]
- 8.Asa-Awuku A, Miracolo MA, Kroll JH, Robinson AL, Donahue NM. Mixing and phase partitioning of primary and secondary organic aerosols. Geophys Res Lett. 2009;36:L15827. [Google Scholar]
- 9.Odum JR, et al. Aromatics, reformulated gasoline, and atmospheric organic aerosol formation. Environ Sci Technol. 1997;31(7):1890–1897. [Google Scholar]
- 10.Dzepina K, et al. Evaluation of recently-proposed secondary organic aerosol models for a case study in Mexico City. Atmos Chem Phys. 2009;9:5681–5709. [Google Scholar]
- 11.Zelenyuk A, Yang J, Imre D, Choi E. SPLAT II: An aircraft compatible, ultra-sensitive, high precision instrument for in-situ characterization of the size and composition of fine and ultrafine particles. Aerosol Sci Tech. 2009;43:411–424. [Google Scholar]
- 12.Zelenyuk A, Yang J, Song C, Zaveri RA, Imre D. “Depth-profiling” and quantitative characterization of the size, composition, shape, density, and morphology of fine particles with SPLAT, a single-particle mass spectrometer. J Phys Chem A. 2008;112(4):669–677. doi: 10.1021/jp077308y. [DOI] [PubMed] [Google Scholar]
- 13.Canagaratna MR, et al. Chase studies of particulate emissions from in-use New York City vehicles. Aerosol Sci Tech. 2004;38:555–573. [Google Scholar]
- 14.Pankow JF. Review and comparative-analysis of the theories on partitioning between the gas and aerosol particulate phases in the atmosphere. Atmos Environ. 1987;21(11):2275–2283. [Google Scholar]
- 15.Pankow JF, Bidleman TF. Interdependence of the slopes and intercepts from log log correlations of measured gas particle partitioning and vapor-pressure. 1. Theory and analysis of available data. Atmos Environ Part A-Gen. 1992;26(6):1071–1080. [Google Scholar]
- 16.Zelenyuk A, Imre D. Beyond single particle mass spectrometry: Multidimensional characterisation of individual aerosol particles. Int Rev Phys Chem. 2009;28(2):309–358. [Google Scholar]
- 17.Yu J, Cocker DR, Griffin RJ, Flagan RC, Seinfeld JH. Gas-phase ozone oxidation of monoterpenes: Gaseous and particulate products. J Atmos Chem. 1999;34(2):207–258. [Google Scholar]
- 18.Chan MN, Chan AWH, Chhabra PS, Surratt JD, Seinfeld JH. Modeling of secondary organic aerosol yields from laboratory chamber data. Atmos Chem Phys. 2009;9(15):5669–5680. [Google Scholar]
- 19.Cappa CD, Lovejoy ER, Ravishankara AR. Evidence for liquid-like and nonideal behavior of a mixture of organic aerosol components. Proc Natl Acad Sci USA. 2008;105(48):18687–18691. doi: 10.1073/pnas.0802144105. [DOI] [PMC free article] [PubMed] [Google Scholar]
- 20.Zelenyuk A, Yang J, Song C, Zaveri RA, Imre D. A new real-time method for determining particles’ sphericity and density: Application to secondary organic aerosol formed by ozonolysis of alpha-pinene. Environ Sci Technol. 2008;42(21):8033–8038. doi: 10.1021/es8013562. [DOI] [PubMed] [Google Scholar]
- 21.Tang IN, Munkelwitz HR. Determination of vapor pressure from droplet evaporation kinetics. J Colloid Interf Sci. 1991;141(1):109–118. [Google Scholar]
- 22.Zelenyuk A, et al. Characterization of organic coatings on hygroscopic salt particles and their atmospheric impacts. Atmos Environ. 2010;44:1209–1218. [Google Scholar]
- 23.Anttila T, Kiendler-Scharr A, Mentel TF, Tillmann R. Size dependent partitioning of organic material: Evidence for the formation of organic coatings on aqueous aerosols. J Atmos Chem. 2007;57:215–237. [Google Scholar]
- 24.McNeill VF, Patterson J, Wolfe GM, Thornton JA. The effect of varying levels of surfactant on the reactive uptake of N2O5 to aqueous aerosol. Atmos Chem Phys. 2006;6:1635–1644. [Google Scholar]


