Abstract
Secondary organic aerosol (SOA) comprises a significant portion of atmospheric particular matter. The impact of particular matter on both human health and global climate has long been recognized. Despite its importance, there are still many unanswered questions regarding the formation and evolution of SOA in the atmosphere. This study uses a modeling approach to understand the preferred partitioning behavior of SOA species into aqueous or organic condensed phases. More specifically, this work uses statistical analyses of approximately 24,000 data values for each variable from a state of the art 3D airshed model. Spatial and temporal distributions of fractions of SOA residing in the aqueous phase (fAQ) in the South Coast Air Basin of California are presented. Typical values of fAQ within the basin near the surface range from 5 to 80%. Results show that the likelihood of large fAQ values is inversely proportional to the total SOA loading. Analysis of various meteorological parameters indicates that large fAQ values are predicted because modeled aqueous-phase SOA formation is less sensitive than that of organic-phase SOA to atmospheric conditions that are not conducive to SOA formation. There is a diurnal variation of fAQ near the surface: It tends to be larger during daytime hours than during nighttime hours. Results also indicate that the largest fAQ values are simulated in layers above ground level at night. In summary, one must consider SOA in both organic and aqueous phases for proper regional and global SOA budget estimation.
Keywords: aqueous phase, atmospheric modeling, urban aerosol
Atmospheric particulate matter (PM) plays crucial roles in the human health effects of air pollution, global climate through scattering and absorption of radiation and formation of clouds, and atmospheric chemistry through uptake and transport of ambient trace gases via heterogeneous processes and through augmentation of photochemistry (1). Atmospheric secondary organic aerosol (SOA) comprises a significant fraction of PM (2), but the current understanding of SOA formation and evolution is still lacking in many perspectives.
The experimental community has made significant contributions to the understanding of fundamental science related to SOA formation and evolution pathways through chamber experiments (3). In short, the formation of SOA is initiated by oxidation of volatile organic compounds (VOC) emitted from anthropogenic and biogenic sources (4, 5). Oxidized products with decreased volatility and/or increased solubility then partition into a condensed phase. The degradation of the VOC into semivolatile or nonvolatile products can require multiple steps, and the phase partitioning of these products depends on environmental variables that include temperature, relative humidity (R.H.), and the concentration and composition of preexisting PM. Depending on atmospheric conditions and the properties of the specific products, partitioning can occur into both aqueous and organic condensed phases (6, 7).
In addition, many contributions to the fundamental science have originated from the measurement, quantification, and speciation of ambient SOA. For example, the effort presented by Molina et al. (8) involved over 100 scientists from more than 30 institutions to perform extensive field measurements in Mexico City. Furthermore, Dreyfus et al. (9) performed more than 6,000 samples in Wilmington, Delaware, to link and quantify the contribution of specific sources to the total organic aerosol concentration/composition in the atmosphere. Such efforts provide invaluable data that have underscored the complexity of the SOA system.
The complexity of the mix of ambient particles and their interactions cannot be captured readily on the scale of typical experimental chambers. Measurements associated with field campaigns, on the other hand, often do not provide adequate information to develop accurate parameterizations for simulation of atmospheric SOA because of the nature of the measurements and the lack of temporal and spatial resolution. However, combining SOA yields and product identification for specific VOC from chamber experiments with observed ambient conditions from measurement campaigns allows for the estimation of the SOA budget in the atmosphere through numerical simulations using mechanistic modeling approaches that reflect the state of the science understanding. On regional to global scales, such models allow for simulation of the mass concentration, speciation, and size distribution of SOA and investigation of the influence of SOA on air quality (10). These models allow the investigation of SOA response to hypothetical atmospheric conditions or emission control scenarios and are well poised to address questions that are nearly unfeasible to consider experimentally.
In brief, the dynamics of atmospheric aerosols involve several complex coupled nonlinear chemical and physical processes. Whereas field studies and satellite observations are extremely important, they only provide a snapshot of atmospheric conditions at a given time and location. Laboratory studies focus on understanding of individual, often idealized, phenomena. To comprehend the behavior of the urban atmosphere as a whole, mathematical models are among the best tools available. Ambient SOA levels from numerical simulations, however, are often shown to underpredict observed values. For instance, the review by Molina et al. (8) stated that the efficiency of ambient SOA formation predicted by models may be as much as an order of magnitude smaller than that measured. The discrepancies between observed and modeled values raise the need to reexamine the behaviors of modules for SOA treatment within airshed models to improve model performance relative to field measurements.
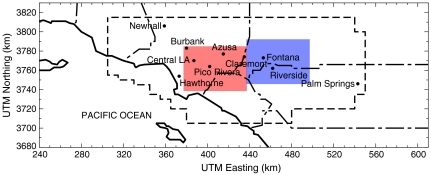
This work uses a computational approach designed to provide insight into the phase preference (aqueous or organic) for SOA formation of semivolatile organic compounds under ambient tropospheric conditions. It utilizes statistical techniques applied to three-dimensional airshed model results generated by the University of California, Irvine-California Institute of Technology (UCI–CIT) model that includes state of the science SOA modules. The test bed domain is the South Coast Air Basin (SoCAB) of California (Fig. 1). Through the airshed model results, the behavior of SOA partitioning is evaluated temporally and spatially. Whereas the focus of this work is on characterizing modeled SOA behavior through statistical analyses, the performance of SOA modules utilized by the UCI–CIT model has been validated previously in various studies (11–15), in which qualitatively good agreement between model results and observations were achieved.
Fig. 1.
Modeling domain for the UCI–CIT model: the South Coast Air Basin of California. The shaded regions represent designated upwind (Red) and downwind (Blue) locations used in this study.
To evaluate the relative importance of condensed aqueous-phase SOA to overall SOA levels, the fractions of SOA residing in the aqueous phase (fAQ) is calculated by dividing the concentration of SOA in the aqueous phase by the total SOA concentration at a given hour and location
 |
[1] |
where brackets represent mass concentrations in μg/m3 and the aq and org subscripts represent the phase into which the SOA species have partitioned, aqueous or organic. In other words, an fAQ of 1.0 corresponds to all SOA existing in an aqueous phase at that time and location, with no organic-phase SOA present; an fAQ of 0.0 corresponds to all SOA residing in an organic condensed phase. Note that this calculation does not include any semivolatile material that remains in the gas phase.
Results and Discussions
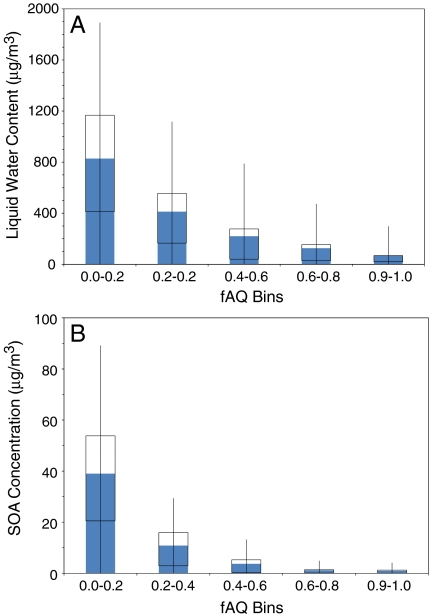
First, fAQ responses to ambient temperature and R.H. in the troposphere are examined. Whereas these factors are important to SOA formation and growth, modeling results do not show any distinct trend between diurnal temperature variations and fAQ across the modeling domain. Similarly, changes in R.H. do not present any clear correlation with SOA partitioning preference between the aqueous and organic phases. In addition, available liquid water content (LWC), which is related to both R.H. and the composition and concentration of hygroscopic aerosol, in the modeling domain is evaluated against fAQ. The distribution of LWC within five bins of fAQ ranging from 0.0 to 1.0 is shown in Fig. 2A. Whereas one may expect that large LWC would correlate to large relative SOA content in the aqueous phase, modeling results show otherwise. Domain cells with small fAQ exhibit the widest range of LWC distribution, whereas cells with large fAQ are limited to relatively small LWC. At first, this may seem counterintuitive because large LWC promotes SOA preference for the aqueous phase. However, this phenomenon indicates that the hydrophilic nature of the semivolatile organic compounds and their activity coefficients within a predominately hydrocarbon-like primary organic aerosol (POA) must be considered when predicting SOA phase preference.
Fig. 2.
Distributions of liquid water content (Upper) and SOA concentration (Lower) grouped by ranges of fAQ in 0.2 increments. The boxes in the plot represent the first and third quartiles of the distribution, the shaded bars show the means of the distribution, and the whiskers are 2 standard deviations above and below the mean, enclosing 95% of the data points.
Does this translate to large LWC coinciding with small SOA concentration? Fig. 2B, which exhibits an anticorrelated relationship between total SOA concentration and fAQ, shows otherwise. In other words, conditions favorable to large LWC also favor overall SOA formation. The fraction of SOA in an aqueous phase, on the other hand, varies inversely with both LWC and total SOA concentration. This anticorrelation is explained by the response of the total SOA to its two components, delineated by aqueous or organic phase.
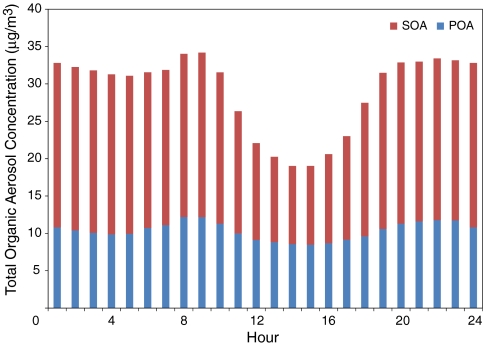
In addition, when large SOA concentrations are observed in the model, large relative contributions of the SOA component in the organic phase also are observed. Because POA provides a medium into which semivolatile organic compounds can be absorbed, the dynamics of the SOA component in the organic phase is, in part, determined by the POA present in the atmosphere, as shown in Fig. 3. At hours with large POA emissions, such as 0800 hours due to morning traffic, where POA is approximately 18% larger than the 24-hour average level, SOA level is also approximately 18% higher than its 24-hour average. As POA diminishes in the early afternoon by 18% of the 24-hour average, SOA level drastically decreases by 42% of the 24-hour average. However, it is believed that this drastic change is caused primarily by dilution. In fact, if POA emissions are forced to zero in the model, only a small overall change in predicted average SOA concentrations are observed, underscoring that it is photochemistry and formation of semivolatile material that drive formation of SOA. Because SOA concentrations in the organic phase tend to be much larger in magnitude relative to those in aqueous phase under larger SOA loadings, fAQ is greatly diminished. However, at smaller SOA loadings, SOA in the aqueous phase decreases by a relatively smaller percentage compared to SOA in the organic phase, so the relative importance of fAQ is enhanced greatly. The dramatic variations in the organic-phase concentration control the relative importance of the aqueous phase to SOA partitioning preference, more so than available LWC present.
Fig. 3.
Diurnal profile of domain-wide average POA and SOA concentrations.
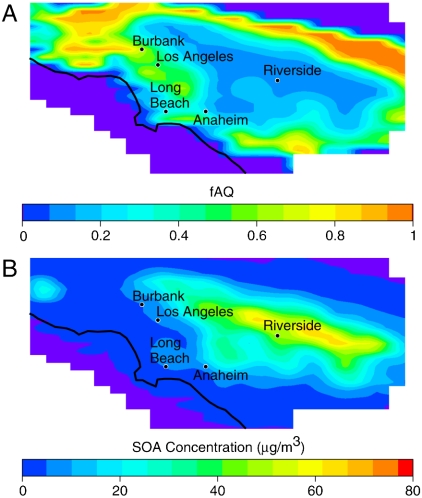
To further describe SOA partitioning preference in the modeling domain, the spatial distribution of fAQ is examined and illustrated in Fig. 4. This figure shows fAQ and total SOA at 1400 hours, when peak overall fAQ is observed. Comparing the two contour plots, the anticorrelation between fAQ and SOA concentration is consistent with the statistical analysis. In locations with large SOA loading, such as Riverside, only a small fraction is present in the aqueous phase. In locations with large contributions from the aqueous phase to overall SOA, such as Burbank, small SOA concentration is observed. In general, in upwind locations of the modeling domain, less photochemical processing has occurred due to the relative proximity of fresh emissions sources, which also leads to smaller ambient levels of inorganic aerosols such as nitrates, sulfates, and ammonium. As a result, upwind locations experience both decreased LWC due to lack of inorganic aerosol and SOA relative to downwind locations. However, the response of the SOA components is not affected linearly. That is, aqueous-phase SOA concentrations do not decrease as strongly as organic-phase SOA concentrations when moving from downwind to upwind locations. Therefore, fAQ increases in areas that experience fresh emissions.
Fig. 4.
Contour plots of domain-wide fAQ (A) and total SOA concentration (B) at 1400 hours.
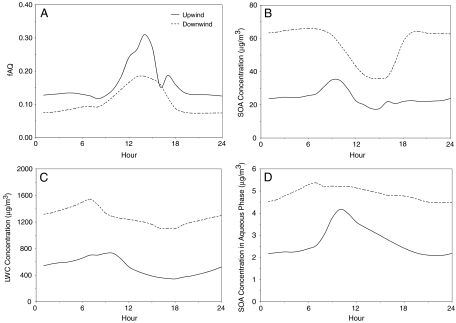
These phenomena also are observed by considering the temporal behavior of fAQ, LWC, and SOA concentration over upwind and downwind locations (Fig. 5). Over a 24-hour simulation period, the relative importance of SOA in the aqueous phase is consistently greater at upwind locations than downwind locations (Fig. 5A). Temporal anticorrelation of SOA concentration and fAQ is observed also, where fAQ increases at sunrise and peaks in the early afternoon, while SOA level peaks in the morning and reaches its minimum in the early afternoon (Fig. 5B). The diurnal variation in SOA levels is attributed to photolysis-driven chemistry during the day and favorable SOA formation conditions such as low temperature, low mixing height, and high R.H. at night. At sunrise, VOC emitted during morning rush hour produce semivolatile and nonvolatile products that partition into aerosol, mostly in the organic phase, causing a small dip in the time series at 0800 hours, especially for upwind locations where high traffic density is present. As the day progresses, SOA partitioning into aqueous phase becomes much more important as the production of SOA greatly diminishes due to the decreased availability of VOC and increased mixing heights during midday. At nighttime, both decreases in temperature and increases in R.H. promote SOA formation through decreases in semivolatile organic compound vapor pressures. The nighttime SOA formation is especially apparent in downwind locations, where the atmosphere is characterized by a buildup of a large level of pollutants. However, lower temperature also decreases the dissolution of organic matter in aqueous aerosols, resulting in diminishing SOA production in the aqueous phase. As shown in Fig. 5C and D, increases in LWC after sunset throughout the night is not reflected in SOA concentrations in the aqueous phase. They remain relatively stable for upwind locations, and downwind locations exhibit a decreasing trend from hours 18 to 24, despite the 25% increase in LWC during the same time span. Whereas nighttime meteorological conditions have some impact on SOA formation in the aqueous phase, its impact on overall SOA formation is not as strong as that of SOA in the organic phase, which composes roughly 90% of total SOA concentration. Hence, the aqueous phase at night becomes less important for SOA formation than the organic phase.
Fig. 5.
Diurnal pattern of average fAQ (A), average SOA concentrations (B), average LWC concentrations (C), and average SOA concentrations in aqueous phase (D) for upwind locations (Solid) and downwind locations (Dashed).
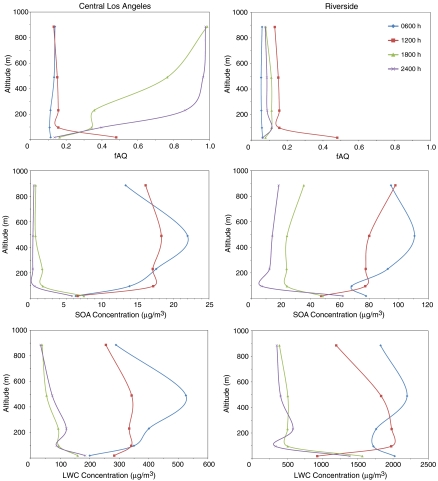
Vertical profiles of fAQ exhibit similar anticorrelations with SOA concentration profiles. Two specific locations have been chosen to study the evolution of characteristic vertical profiles of upwind vs. downwind locations over the course of a day: Central Los Angeles and Riverside (Fig. 6). For Central Los Angeles, the vertical profiles of both SOA and LWC during a simulation period of 24 h are characterized by positive gradients near the surface in the early morning and during the day time (0600 hours and 1200 hours) from aerosol buildup aloft at night and negative gradients in the evening (1800 hours and 2400 hours) due to aerosol formation and growth near the surface associated with limited mixing above the nocturnal boundary layer (NBL). As observed in the aforementioned analysis, SOA in the aqueous phase becomes relatively important when SOA concentration is small. In this case, while fAQ may not be significant during nighttime at the surface, it is much more important aloft, when the concentrations of SOA are small. As the evening progresses, semivolatile and nonvolatile organics are more processed, and SOA above the NBL resides mostly in the organic phase, reducing fAQ aloft. In Riverside, strong vertical SOA and LWC variations also are present, but the overall concentrations of SOA are generally large in magnitude across all vertical layers. Therefore, the vertical profile of fAQ is consistently small throughout the day. Only during midday when the SOA concentration is reduced significantly at the surface does fAQ significantly increase in Riverside.
Fig. 6.
Vertical profiles of fAQ, SOA concentrations, and LWC for Central Los Angeles (Left) and Riverside (Right) at 0600, 1200, 1800, and 2400 hours.
Conclusions
Using statistical analysis on approximately 24,000 data points for each variable that describe different ambient conditions and pollutant concentrations at each surface cell of the modeling domain for the SoCAB, possible factors that contribute to the preference of SOA to partition into an aqueous phase over an organic phase are examined. At the ground level, important meteorological parameters that drive SOA formation, such as temperature and R.H., are shown to play only a small role in determining SOA partitioning preference. By comparing fAQ and total SOA concentration, however, an anticorrelation between the two is discovered; a similar relationship is observed between fAQ and LWC. The inverse relationship between fAQ and LWC indicates that the hydrophilic nature of semivolatile organic compounds is more important than the actual available LWC, large values of which do not necessarily lead to large relative contributions of SOA in the aqueous phase. The anticorrelation between fAQ and SOA levels underscores the importance of SOA material partitioning into an aqueous phase when small SOA concentrations are present. Under circumstances in which large SOA concentrations are developed over time, the large increase in SOA concentrations are a result of partitioning mostly to the organic phase. Similarly, when SOA concentrations are reduced over time and space, SOA concentrations in the organic phase decreases much more significantly than do those in the aqueous phase, thus elevating the relative significance of the aqueous phase. This is emphasized in a comparison of upwind and downwind locations and in an investigation into the vertical profile of these phenomena. To conclude, to increase the validity of regional and global SOA predictions and assessments, it is important to consider partitioning into both aqueous and organic phases.
Materials and Methods
The domain for numerical simulation in this study is comprised of 994 5 km by 5 km square columns that extend to 1100 m in altitude. Each column is partitioned into 5 cells vertically that range in height: 0–38 m, 38–154 m, 154–308 m, 308–671 m, and 671–1100 m. The method of vertical discretization of the modeling domain is chosen to highlight boundary layer behaviors near the surface, which is especially important at night. A simulation period of 24 h is used so that diurnal variation of emissions and meteorological conditions is accounted. Statistical analyses are performed using meteorological conditions and pollutant concentrations at the end of each of the 24 h in a simulation day, in each of the 994 surface cells in the modeling domain. This means that approximately 24,000 data points in each vertical model level are considered for each pollutant concentration and meteorological variable.
The UCI–CIT airshed model utilizes the CalTech Atmospheric Chemistry Mechanism (CACM) (11, 16) module for the treatment of gas-phase chemistry. Not only does CACM simulate formation of ozone, nitrogen oxides, and other inorganic species of atmospheric relevance, but also it simulates the formation of products from the oxidation of parent volatile organic compounds by species such as ozone, nitrate, and hydroxyl radicals. Those oxidation products deemed capable of forming SOA based on extent of oxidation (17) are lumped according to source (biogenic vs. anthropogenic), dissociative capability, molecular size, and functionality. As a result, CACM predicts ten species that are used as surrogates for simulation of SOA formation (11). The concentrations of these surrogates are passed to the Model to Predict the Multiphase Partitioning of Organics (MPMPO) module (11, 18) for treatment of organic aerosol formation.
The basic assumption in MPMPO is that two aerosol phases are present: one aqueous and one organic. Both phases represent two different general particle types found in the atmosphere. In the organic phase, aerosol consists of a mixture of POA (linked to the emission inventory described subsequently) and SOA. In the aqueous phase, aerosol consists of liquid water, inorganic ions (e.g. sulfate, nitrate, ammonium, etc.), secondary organic molecules with some amount of solubility, and secondary organic ions associated with those molecules capable of dissociation. For partitioning of a CACM-predicted semivolatile organic oxidation product between the gas phase and a condensed organic phase, an activity-corrected Raoult’s law is used. This requires calculation of activity coefficients using UNIversal Functional Activity Coefficient (UNIFAC) (19), molecular weights of the surrogate compounds used (defined by their surrogate structure), and estimation of the temperature-dependent vapor pressures of the surrogate compounds used, which is performed using structure–activity relationships (20). For partitioning of the same species between the gas phase and an aerosol aqueous phase, an activity-corrected Henry’s law is used. In this case, acid dissociation constants are determined by analogy to compounds of similar structure with known constants, and temperature-dependent Henry’s law constants are derived from structure–activity relationships. For the aqueous phase, LWC and hydrogen ion concentration ([H+]) are required.
Aerosol calculations are performed as follows: The module Simulating the Composition of Atmospheric Particles at Equilibrium 2 (SCAPE2) (21, 22) is used to determine LWC and [H+] based on meteorological variables, emissions of primary inorganic aerosol precursors, preexisting (from the previous time step) inorganic material, and input of concentrations of nitric acid, sulfuric acid, and ammonia from CACM. Meteorological input, organic concentrations from CACM, LWC, and [H+] are passed to MPMPO. Based on the thermodynamic system and a mass balance (the sum of the concentrations in the gas phase, the aqueous phase, and the organic phase must be equal to that formed by CACM and what was present from the previous time step), MPMPO predicts iteratively the phase distribution of each surrogate.
Once an equilibrium prediction of phase distribution is achieved, additional water uptake by secondary organics in the aqueous phase is then considered using the Zdanovskii–Stokes–Robinson approximation; this additional amount of water and the concentrations of ionic organic material are passed back to SCAPE2 to determine if the change in water content or charged material causes changes in the inorganic aerosol distribution, which could then change the phase distribution of SOA species. In this way, LWC is used as an iterative variable between MPMPO and SCAPE2.
Once this iteration is complete, the final output from MPMPO includes the gas-phase concentrations, the aqueous-phase concentrations, and the organic-phase concentrations of the surrogate compounds. The gas-phase concentrations are passed back to CACM for the next gas-phase chemistry calculation. The aqueous-phase concentrations are summed over all size bins (distributed based on surface area in fine particles) to provide a total aqueous-phase SOA concentration at a given time and location; organic-phase concentrations are summed similarly. It should be noted that the distribution predicted by the combined CACM–MPMPO–SCAPE2 is with respect to the bulk equilibrium properties of the fine aerosol. This iteration process is described in Vutukuru et al. (13).
The meteorological conditions used here correspond to September 8, 1993, during which a pollution episode was observed by a special monitoring campaign. It should be stressed that using different meteorological conditions showed trends similar qualitatively to those presented here. The emission profiles implemented have been used to validate the performance of air quality models in the 2003 Air Quality Management Plan, an air quality improvement plan designed to meet the federal and California state Clean Air Acts. The initial conditions (IC) for the 24-hour simulation period were derived by simulating repeated days with the same meteorology and emissions until the diurnal profile is unchanged; that is, the contribution of IC was minimized (23).
Acknowledgments.
This work was supported in part by the AirUCI Environmental Molecular Science Institute, funded by National Science Foundation Grant CHE-431512.
Footnotes
The authors declare no conflict of interest.
This article is a PNAS Direct Submission.
References
- 1.Intergovernmental Panel on Climate Change (IPCC) Climate Change 2007: The Physical Science Basis. Cambridge: Cambridge Univ Press; 2007. [Google Scholar]
- 2.Zhang Q, et al. Ubiquity and dominance of oxygenated species in organic aerosols in anthropogenically-influenced Northern Hemisphere midlatitudes. Geophys Res Lett. 2007 doi: 10.1029/2007GL029979. [Google Scholar]
- 3.Kroll JH, Seinfeld JH. Chemistry of secondary organic aerosol: Formation and evolution of low-volatility organics in the atmosphere. Atmos Environ. 2008;42:3593–3624. [Google Scholar]
- 4.Odum JR, Jungkamp TPW, Griffin RJ, Flagan RC, Seinfeld JH. The atmospheric aerosol-forming potential of whole gasoline vapor. Science. 1997;276:96–99. doi: 10.1126/science.276.5309.96. [DOI] [PubMed] [Google Scholar]
- 5.Griffin RJ, Crocker DR, III, Flagan RC, Seinfeld JH. Organic aerosol formation from the oxidation of biogenic hydrocarbons. J Geophys Res. 1999;104:3555–3567. [Google Scholar]
- 6.Seinfeld JH, Pankow JF. Organic atmospheric organic material. Annu Rev Phys Chem. 2003;54:121–140. doi: 10.1146/annurev.physchem.54.011002.103756. [DOI] [PubMed] [Google Scholar]
- 7.Pankow JF. Gas/particle partitioning of neutral and ionizing compounds to single and multi-phase aerosol particles. 1. Unified modeling framework. Atmos Environ. 2003;37:3323–3333. [Google Scholar]
- 8.Molina LT, et al. Air quality in North America’s most populous city – overview of the MCMA-2003 campaign. Atmos Chem Phys. 2007;7:2447–2473. [Google Scholar]
- 9.Dreyfus MA, Adou K, Zucker SM, Johnston MV. Organic aerosol source apportionment from highly time-resolved molecular composition measurements. Atmos Environ. 2009;43:2901–2910. [Google Scholar]
- 10.Kanakidou M, et al. Organic aerosol and global climate modelling: A review. Atmos Chem Phys. 2005;5:1053–1123. [Google Scholar]
- 11.Griffin RJ, Dabdub D, Seinfeld JH. Development and initial evaluation of a dynamic species-resolved model for gas phase chemistry and size-resolved gas/particle partitioning associated with secondary organic aerosol formation. J Geophys Res. 2005 doi: 10.1029/2004JD005219. [Google Scholar]
- 12.Chen J, Mao H, Talbot RW, Griffin RJ. Application of the CACM and MPMPO modules using the CMAQ model for the Eastern United States. J Geophys Res. 2006 doi: 10.1029/2006JD007603. [Google Scholar]
- 13.Vutukuru S, Griffin RJ, Dabdub D. Simulation and analysis of secondary organic aerosol dynamics in the South Coast Air Basin of California. J Geophys Res. 2006 doi: 10.1029/2005JD006139. [Google Scholar]
- 14.Ying Q, Fraser MP, Griffin RJ, Chen J, Kleeman MJ. Verification of a source-oriented externally mixed air quality model during a severe photochemical smog episode. Atmos Environ. 2007;41:1521–1538. [Google Scholar]
- 15.Matsui H, et al. Secondary organic aerosol formation in urban air: Temporal variations and possible contributions from unidentified hydrocarbons. J Geophys Res. 2009 doi: 10.1029/2008JD010164. [Google Scholar]
- 16.Griffin RJ, Dabdub D, Seinfeld JH. Secondary organic aerosol: 1. Atmospheric chemical mechanism for production of molecular constituents. J Geophys Res. 2002 doi: 10.1029/2001JD000541. [Google Scholar]
- 17.Pun BK, Griffin RJ, Seigneur C, Seinfeld JH. Secondary organic aerosol: 2. Thermodynamic model for gas/particle partitioning of molecular constituents. J Geophys Res. 2002 doi: 10.1029/2001JD000542. [Google Scholar]
- 18.Griffin RJ, Nguyen K, Dabdub D, Seinfeld JH. A combined hydrophobic–hydrophilic module for predicting secondary organic aerosol formation. J Atmos Chem. 2003;44:171–190. [Google Scholar]
- 19.Fredenslund A, Gmehling J, Rasmussen P. Vapor-Liquid Equilibria Using UNIFAC: A Group-Contribution Method. New York: Elsevier Scientific Publishing; 1977. [Google Scholar]
- 20.Clegg SL, Kleeman MJ, Griffin RJ, Seinfeld JH. Effects of uncertainties in the thermodynamic properties of aerosol components in an air quality model—Part 2: Predictions of the vapour pressures of organic compounds. Atmos Chem Phys. 2008;8:1087–1103. [Google Scholar]
- 21.Kim YP, Seinfeld JH, Saxena P. Atmospheric gas-aerosol equilibrium I. Thermodynamic model. Aerosol Sci Technol. 1993;19:157–181. [Google Scholar]
- 22.Meng Z, Seinfeld JH, Saxena P, Kim YP. Atmospheric gas aerosol equilibrium 4. Thermodynamics of carbonates. Aerosol Sci Technol. 1995;23:131–154. [Google Scholar]
- 23.Carrreras-Sospedra M, Dabdub D, Rodriguez M, Brouwer J. Air quality modeling in the South Coast Air Basin of California: What do the numbers really mean? J Air Waste Manage. 2006;56:1184–1195. doi: 10.1080/10473289.2006.10464530. [DOI] [PubMed] [Google Scholar]


