

Abstract
The rapid accumulation of gene expression data has offered unprecedented opportunities to study human diseases. The National Center for Biotechnology Information Gene Expression Omnibus is currently the largest database that systematically documents the genome-wide molecular basis of diseases. However, thus far, this resource has been far from fully utilized. This paper describes the first study to transform public gene expression repositories into an automated disease diagnosis database. Particularly, we have developed a systematic framework, including a two-stage Bayesian learning approach, to achieve the diagnosis of one or multiple diseases for a query expression profile along a hierarchical disease taxonomy. Our approach, including standardizing cross-platform gene expression data and heterogeneous disease annotations, allows analyzing both sources of information in a unified probabilistic system. A high level of overall diagnostic accuracy was shown by cross validation. It was also demonstrated that the power of our method can increase significantly with the continued growth of public gene expression repositories. Finally, we showed how our disease diagnosis system can be used to characterize complex phenotypes and to construct a disease-drug connectivity map.
The rapid accumulation of high-throughput genomic data offers an unprecedented opportunity to study human diseases. The National Center for Biotechnology Information (NCBI) Gene Expression Omnibus (GEO) (1) with more than 330,000 gene expression profiles and an annual growth rate of 150%, is currently the largest database of its kind. The GEO systematically documents the molecular basis of many disease types, including heart disease, mental illness, infectious disease, and a wide variety of cancers. This repository could serve as a rich resource for diagnosis: by screening the enormous number of disease expression datasets in an automated fashion, it should be possible to rapidly narrow down disease candidates for a query expression profile. A screening approach such as this would be particularly useful when the potential disease is not obvious or lacks biochemical diagnostic tests.
We aim to turn the NCBI GEO expression repository into an automated disease diagnosis database, such that a query gene expression profile can be assigned to one or multiple disease concepts. This effort requires the effective integration of the two major information sources in the GEO database; namely quantitative expression data and complex phenotypic information. Such integrative analysis is essential to exploiting the full power of public gene expression databases and tackling the ultimate scientific goal of genomics research—linking genotypes to phenotypes. The problem of searching and querying microarray databases has attracted considerable attention. However, existing works either query only the expression data with an expression signature to identify relevant microarray datasets (2–4), or query only the phenotype meta-data with a specific phenotype term to search for datasets of related phenotypes (5 and 6). In this paper, going beyond such simple database query approaches, we describe an unified framework for jointly modeling the two information sources. By this means, the heterogeneous public repository is transformed into a database with standardized expression profiles and phenotype terms suitable for diagnosis purposes. An automated, Bayesian analysis of this database then links standardized query expression profiles to probable disease classes. This task is not trivial due to the large amount of complex heterogeneous data in public repositories, while it is less of a challenge if the microarray-based disease diagnosis studies were of limited scales (e.g., within a single laboratory (7 and 8) or targeting specific types of disease (9–11)).
Following a preprocessing phase (i.e., standardizing the cross-platform expression data and the complex phenotype information), we formulate the disease diagnosis question as a hierarchical multilabel classification (HMC) problem (12). That is, we categorize a standardized query gene expression profile into multiple disease classes following a hierarchical disease taxonomy. The standardization of a profile is based on its comparison against a control array in order to remove cross-platform/lab systematic variations. We developed a two-stage learning approach to achieve the diagnosis: we first build independent Bayesian classifiers for each disease class, then integrate their predictions within a Bayesian network model. The network model allows for collaborative error correction across classes in the disease hierarchy. This two-stage learning approach interprets both genomic and phenotypic data under a unified probabilistic framework, thereby constituting an advance over existing microarray diagnostic methods in both scale and depth.
To validate our approach, we collected 9,169 human microarray experiments from major platforms in the NCBI GEO database and constructed 110 disease classes. Cross validation demonstrates a high level of overall diagnostic accuracy (95%). Moreover, we show that the predictive power of our system is expected to increase significantly as public gene expression repositories continue to grow.
The proposed disease diagnosis system can also be applied to reveal unique relationships between diseases and drugs, if the query expression profile concerns the treatment effect of known drugs. Querying a large number of drug-treatment profiles against our diagnosis system, we established a disease-drug connectivity map. Interestingly, a large number of known drug side effects were recovered and many unique disease-drug associations were discovered. The principle here is similar to that of the landmark study by Lamb et al. (“connectivity map”) (13), where disease-drug connections were inferred by comparing a disease profile to a specifically constructed reference compendium of drug-treatment profiles. Our approach complements that work in the way that we provide a rigorous prediction scoring system, and more importantly, we make it possible to use the entire heterogeneous public gene expression data as the reference compendium.
Results
Construction of a Disease Diagnosis Database.
Our analysis scheme is sketched in Fig. 1. The first phase concerns data preprocessing and it involves two tasks: (i) standardizing the expression data to remove platform or laboratory differences, and (ii) transforming the heterogeneous phenotype information, embedded in texts, into a workable format.
Fig. 1.

Major steps of the disease diagnosis system: (1) Preprocess the public microarray repositories to build the diagnosis database with standardized expression and phenotype data. (2) Diagnose a query profile via a two-stage Bayesian approach: at the first stage, we build Bayesian classifiers for each UMLS concept; at the second stage, we integrate the individual predictions with a Bayesian network model to allow collaborative error-correction over all classes in the hierarchy (red nodes represent diagnosed disease concepts).
For the first task, we performed the standardization by ranking the expression values within each array profile, and then taking the logarithm of the expression rank ratio between two arrays, one of a disease and another of normal conditions, within the same dataset (14). The resulting log-rank-ratio vector is termed a standardized profile; its components reflect the level and direction of differential expression in disease-related genes. Given two standardized profiles, we measure their similarity by Pearson correlation. This measure is favored due to its sensitivity to large absolute values, which in our case correspond to highly differentially expressed genes. Our standardization is in principle similar to the Gene Set Enrichment Analysis (13). The rationale is that differentially expressed genes are likely to carry the most stable information on disease characteristics regardless of differences in platform or lab. With our method, researchers need not choose a threshold of significance for differentially expressed genes. Extensive testing has demonstrated the effectiveness of our method (SI Text). Note that a typical GEO dataset consists of several subsets, each subset having a group of replicated samples. We term the set of standardized profiles derived from all replicated arrays in a pair of disease and normal subsets, a standardized dataset. Naturally, the standardized profiles within a standardized dataset are considered replicates. For this initial study, we focus on those GEO datasets that contain at least one pair of disease and normal subsets. We note that the requirement of normal subsets poses a potential limitation for our standardization approach. Further discussions on our approach and its possible alternatives are in SI Text.
To standardize the disease information provided with microarray datasets, we use the Unified Medical Language System (UMLS) (15). Its associated text-mining tools (MetaMap) (16) allow for the automatic extraction of phenotype concepts from text annotations (17 and 18). Note that each microarray dataset has phenotype descriptions at both the dataset level and the subset level. In our Bayesian diagnosis analysis, we give the subset-level annotations a higher credence due to their stronger association with individual samples.
This preprocessing phase results in a new database consisting of standardized expression profiles and disease concepts (i.e., UMLS concepts). Hereafter, we refer to this collection as the “disease diagnosis database.” More details on constructing this database are in Methods and SI Text.
A Bayesian Framework for Automated Disease Diagnosis.
We formulate the task of automated disease diagnosis as a hierarchical multilabel classification problem. The goal is to place a query profile into one or multiple UMLS disease classes, following the hierarchical UMLS disease taxonomy. We introduce a two-stage Bayesian learning approach: first a classifier is built for each disease class, and then the predictions of individual classifiers are combined to allow collaborative error correction across classes in the hierarchy. We summarize the key steps of this method below; a complete description is in SI Text.
Given a query array to be diagnosed and a control array profiling a normal sample (of the same lab and platform), we derive the log-rank-ratio vector x; this is the standardized query profile. Let Qx,k = 1 when x is diagnostic of the UMLS concept Uk, and Qx,k = 0 otherwise. That is, Qx,k is a binary label indicating membership of x in the disease class k. To build a Bayesian classifier for disease class k, it is equivalent to derive the posterior distribution of Qx,k given the information including: (i) s = {sx,i,i = 1,…,M}, where M is the number of standardized datasets in our database, and sx,i is a list of similarity scores (i.e., Pearson correlation coefficients) quantifying the similarities between x and the profiles in the ith standardized dataset. (ii) e = {ei,k,i = 1,…,M}, where ei,k tells whether the UMLS concept Uk is an annotation of the ith standardized dataset (see Methods). We define ei,k = 2 if Uk occurs at the subset level (see Methods), ei,k = 1 if it occurs at the dataset level, and ei,k = 0 if the annotation does not occur.
The relationship between Qx,k, e and s is illustrated in Fig. 2. It is obvious that e provides no useful information to infer the value of Qx,k unless the similarity scores s are also known. That is P(Qx,k|e) = P(Qx,k). In these terms, the target Bayesian posterior can be expressed as
| [1] |
The prior P(Qx,k) can be empirically estimated from the database. The computation of P(s|Qx,k,e) is more involved due to the complex properties of e and s. For instance, the UMLS annotations e include items at the dataset and subset levels, and may also suffer from text-mining errors. To take into account such complexities and facilitate the modeling of P(s|Qx,k,e), we introduced a set of latent binary random variables T = {Ti,k} whose values are not observable but can be inferred from e: Ti,k = 1 when the ith standardized dataset is related to the UMLS concept Uk, and Ti,k = 0 otherwise. (The principles for defining P(T|e) are in Methods.) Accordingly, we can express the target posterior in Eq. 1 as
| [2] |
We now need to determine P(s|Qx,k,T). By assuming independence among the standardized datasets, we can decompose P(s|Qx,k,T) into the computation of individual terms P(sx,i|Qx,k,Ti,k), where sx,i is a vector denoting the similarity scores between x and the profiles in the ith standardized dataset(i = 1,…,M). Due to the difficulty in modeling and deriving P(sx,i|Qx,k,Ti,k) (SI Text), we alternatively considered the ratio P1(sx,i)/P0(sx,i), referred to simply as “P1/P0” hereafter. P1 denotes the distribution of sx,i when the query x and the ith standardized dataset are associated with a common disease, and P0 the distribution when they are not. We modeled P1/P0 by a log-linear regression: log(P1/P0) = λ0 + λ1 × Mean(sx,i) + ϵi, where λ0 and λ1 are estimated independently of the query profile and ϵi is a Gaussian error term. Further details are in Methods and SI Text.
Fig. 2.

Information chart for the posterior inference of Qx,k. We wish to estimate the probability that a query profile x is diagnosed with the UMLS concept Uk, given ei,k and sx,i with i = 1,…,M.
Putting all the details together, we can infer Qx,k (SI Text). This process is repeated for all UMLS disease classes. Those UMLS concepts with the posterior probability above a predefined threshold are considered significant, and generate an initial set of diagnostic annotations for the query profile x. Note that in practice, the query data may contain replicates of disease and normal arrays. In that situation, we derive the log-rank ratio vectors from all possible pairs of query disease and normal samples, and x represents a list of replicated standardized query profiles. sx,i will then include all the similarity scores between every replicated standardized query profile and every profile in the ith standardized dataset. The inclusion of replicates can enhance the robustness of the P1(sx,i)/P0(sx,i) estimation, but all other procedures remain the same. We also note that in Bayesian analysis, the effects of the prior distribution and the significance threshold selection tend to vanish as the data accumulate. We have also demonstrated that our Bayesian classifiers, built by carefully modeling the specific properties of noisy data such as e and s, outperformed Support Vector Machine, the most commonly used classification method (SI Text).
Next, we use the UMLS hierarchical disease taxonomy to leverage the predictions made for individual UMLS concepts. In particular, we exploit a Bayesian network model defined on the UMLS hierarchy to resolve inconsistencies in the initial set of diagnostic predictions (19) (details are in SI Text). Given the high level of information exchange and integration among the UMLS concepts along the disease hierarchy, this procedure is expected to improve the accuracy and robustness of the diagnosis.
Performance Assessment of the Automated Disease Diagnosis System.
To validate our framework, we used an initial set of GEO microarray datasets containing at least one disease subset and at least one normal subset. In total, we collected 9,169 microarray experiments and constructed 110 disease classes, each containing from 3 to 62 standardized datasets. The 110 classes covered a wide spectrum of diseases: cardiovascular disease, neoplasms, CNS disorders, skin disorders, and metabolic diseases, to name a few.
Using the leave-one-out cross-validation approach detailed in Methods, our diagnoses achieved an overall accuracy of 95% (precision 82% and recall 20%). The recall rate of 20% is comparable to that observed in an analogous hierarchical multilabel classification problem for predicting gene functions. In the mouse model, the best performance in such an application was achieved with a recall rate of 20% and a precision of 41%.(20). Varying the threshold for classification, we plot the precision and recall curves in Fig. 3A. Not surprisingly, the performance of our method is significantly enhanced after applying collaborative error correction along the disease hierarchy. An example diagnosis in the context of the UMLS hierarchy is depicted in Fig. 3B. The prediction results for a subset of prevalent diseases are listed in Table 1.
Fig. 3.

Validation results and case examples. (A) Precision-recall plots by pooled disease classes. The blue curve shows the performance after Stage I diagnosis, and the red curve shows the final performance after Stage II refinement. (B) An example illustrating the error correction by the Stage II refinement. The query profile studies uterine leiomyomas obtained from fibroid afflicted patients (GDS484). The profile is annotated with four concepts by UMLS text mapping: Connective/Soft Tissue Neoplasm, Muscle tissue neoplasm, fibroid tumor, and uterine fibroids. The Stage I diagnosis predicted four concepts (red nodes) with one false positive (lymphoblastic leukemia), and one false negative (uterine fibroids). The false positive prediction is later corrected by Stage II refinement. (C) The figure presents the 110 disease classes and their hierarchical relationships. The red nodes represent diagnosed disease concepts for GDS563: (1) Nervous system disorder (2) Neuromuscular diseases (3) Myopathy (4) Musculoskeletal diseases (5) Congenital, Hereditary, and Neonatal diseases and abnormalities (CHNDA) (6) Genetic diseases, inborn (7) Genetic diseases, x-linked (8) Muscular disorders, atrophic (9) Muscular dystrophies (10) Muscular Dystrophy, Duchenne. (D) The prediction performance decreases with the data reduction.
Table 1.
Prediction result of a subset of prevalent diseases
| Disease class | True accuracy | Recall | Precision | Datasets |
| Fibroid tumor | 1 | 1 | 1 | GDS2245, GDS484, GDS2246, GDS2737 |
| Head and neck neoplasms | 0.995 | 0.875 | 1 | GDS1070, GDS1321, GDS1665, GDS1584 |
| Thrombocytosis | 0.995 | 0.667 | 1 | GDS1376, GDS552, GDS761 |
| Renal cell carcinoma | 0.990 | 0.667 | 0.667 | GDS2245, GDS505, GDS2246 |
| Kidney neoplasms | 0.990 | 0.600 | 1 | GDS1282, GDS2245, GDS505, GDS2246 |
| Muscular dystrophies | 0.985 | 0.769 | 1 | GDS563, GDS262, GDS1956 |
| Connective/soft tissue neoplasm | 0.985 | 0.571 | 1 | GDS1282, GDS2245, GDS1209, GDS484, GDS2246, GDS2737 |
| X-linked genetic diseases | 0.979 | 0.714 | 1 | GDS563, GDS262, GDS539, GDS1956 |
We further exemplify the performance of our approach using the NCBI GEO dataset GDS563. This dataset was produced to identify modifying factors and pathogenic pathways involved in Duchenne Muscular Dystrophy (DMD). It consists of 24 microarrays from two subsets: 12 from DMD patients and 12 from unaffected control patients, which form a standardized dataset with 12 × 12 = 144 replicated standardized profiles. Masking the known phenotypic annotations and querying this standardized dataset against our database, we predicted 10 UMLS concepts (see Fig. 3C). All of the 10 predictions, positioned coherently along the UMLS hierarchy, agree 100% with the known annotations. Another example with less perfect yet more typical prediction performance is shown in SI Text.
A closer examination of the results shows further interesting features of our method. One example comes from the result for a query profiling the T-cells of HIV patients (GDS2649). Even though HIV is not included in the 110 disease classes of our diagnosis database due to the lack of sufficient training data, we obtain the relevant concept RNA virus infection that can describe the characteristic of the HIV disease. This implies that our system can not only diagnose known diseases, but may also identify important features of understudied or unknown diseases.
In general, the prediction performance on individual disease classes increases with the number of datasets in the class. For example, among disease classes containing only three datasets, the best precision achieved was 41% with a recall of 23%. For disease classes containing seven datasets, the same precision (41%) was achieved when the recall was 43%. In fact, for classes with seven datasets, the best achieved precision was 97% with 33% recall. To further confirm the important role of class size, we randomly reduced the number of datasets in the disease diagnosis database by 20%, 40%, or 80%. Fig. 3D demonstrates that both precision and recall significantly increase with the number of datasets. This behavior highlights the advantage of multiple dataset integration and demonstrates that the power of our approach can increase significantly with the continued growth of public gene expression repositories.
Construction of a Disease-Drug Connectivity Map.
Our approach can be generalized from disease diagnosis to building disease/phenotype connections when the query’s phenotype is known. The connections between drugs and diseases are of special interest. These can be discovered by applying our diagnosis system to queries involving drug (or small molecule) treatments. The diagnosis results would link the queries (involving drug-treatment effects) into one or more well-known disease classes, facilitating the establishment of unique links between diseases and drugs.
We constructed a connectivity map using 1,248 queries characterizing the phenotypic differences between “drug treated” and “untreated” subjects (these 1,248 queries were not in our established disease diagnosis database). We only kept predicted diseases that were not already included in the query’s annotations. A new drug-disease connection was considered significant if queries concerning a given drug treatment were predominantly classified into the same disease class (see Methods and SI Text for details). In total, we found 234 significant drug-disease links, unique to the queries’ phenotype description, connecting 99 drug concepts to 43 disease classes (Fig. 4).
Fig. 4.

Disease-drug connectivity map. The map contains 234 significant connections between 99 drug concepts (pink nodes) and 43 disease concepts (blue nodes). (A) The network structure of the connectivity map. (B) Close-up of the Doxorubicin subnetwork. (C) Close-up of the obesity subnetwork.
To verify that the linked diseases and drug treatments truly share common molecular mechanisms, we used an independent resource: the Online Mendelian Inheritance in Man database (OMIM) (21). For each disease or drug, we compiled a list of associated genes based on the knowledge in OMIM (SI Text). We then assessed the statistical significance of the “link” between a disease and a drug based on the intersection of the disease-related genes and the drug-related genes using the hypergeometric test. Strikingly, 42.4% of the significant drug-disease links identified emerge also as statistically significant by this criterion with hypergeometric p value ≤ 0.05.
On close examination, Fig. 4A (see SI Text for a detailed version) reveals many known drug side effects as well as some unique associations. To take an interesting example, we found that the anticancer drug, doxorubicin, is linked to several diseases besides cancer/tumor (Fig. 4B). A predicted connection to rheumatoid arthritis confirms the drug’s newly proposed role as an antiarthritic agent (22); a connection to skin disorder reflects its known side effect of skin erupts (23). Most notably, the connection to cardiovascular diseases points to doxorubicin’s potentially fatal toxicity to the heart muscles, which is cumulative over the patient’s lifetime (24). This dosage-limiting cardiotoxicity, whose mechanism is not yet understood, has so far severely limited the usage of doxorubicin. Previous work has suggested that doxorubicin may break down the myofilament protein titin, leading to myocyte cell death (25). Our prediction, based on a global differential gene expression comparison, suggests a more fundamental transcriptional mechanism: doxorubicin may trigger cardiomyocyte-specific expression signatures. In fact, two transcription regulators, GATA4 and CARP, have already been implicated in such cardiomyocyte changes (26). Our result thus points out a unique direction in the design of cardioprotection strategies that would allow wider application of this effective oncologic agent.
Also of interest are the numerous links between “obesity” and anticancer drugs shown in Fig. 4C. Cancer and obesity have both become increasingly prevalent, and a physical basis for this relationship can be found in certain shared key molecules such as insulin, PDGF, VEGF, and cytokines. Accumulating evidence suggests that leptin and adiponectin, key hormones in regulating appetite and metabolism, may play important roles in regulating cancer cell growth and proliferation (27). In fact, weight gain is a common side effect in women undergoing adjuvant chemotherapy for breast cancer (28). Previous findings suggest that weight gain during adjuvant chemotherapy is associated with increased recurrence and poorer survival (29). Thus, understanding the molecular mechanism of this side effect is of therapeutic importance. The global similarity between obesity-specific expression and anticancer drug-treatment expression may lead to the discovery of shared mechanisms at the transcription level, allowing optimized treatments to be designed.
Discussion
We have proposed a computational approach capable of transforming large public microarray repositories into an automated disease diagnosis database. Compared to existing studies on searching and querying microarray databases, which focus on either expression data or phenotype data alone (2–6), we model both data sources in a unified framework. Integrating these two data types requires a careful consideration of their complex properties as well as various sources of noise. We employ a two-stage probabilistic framework that assigns one or multiple disease and phenotype labels to a query profile. While most medical diagnostic tests narrowly focus on one or a few diseases and conditions, our approach promises the ability to distinguish a large number of conditions efficiently and in parallel. As the available training datasets become more numerous and homogenous, the classification power of our system should increase dramatically. The framework presented here will also benefit from ongoing efforts to develop more advanced UMLS text-mining tools, as well as an improved and more comprehensive community standard of phenotype annotations.
As demonstrated by our disease-drug connectivity map, our approach shows great promise as a tool for linking a broad range of phenotypes to diseases through shared molecular mechanisms. This potential can be enhanced by extending the scope of queries and the range of disease classes in our diagnosis database. For instance, queries could be crafted to reveal the subtle distinctions between related phenotypes such as “type I vs. type II diabetes”, “metastasis vs. nonmetastasis cancer”, or two differentiation stages of embryonic stem cells. It is likely that the major characteristics of such subtle distinctions could be jointly described by the disease classes in our diagnosis database. On the other hand, our diagnostic database can also be extended by adding phenotype classes beyond disease, for example stress response, drug perturbation, and cell differentiation. Further investigations along this direction could facilitate the construction of a phenotype connection map, and potentially redefine our views of disease and phenotype classification.
In our approach, the gene expression data are transformed into log-rank-ratio vectors, which are dimensionless and not tied to any technology platform. As such our system should also be applicable to mRNA-seq data when they become widely available in public repositories. On the other hand, the capability of mRNA-seq technology in measuring absolute gene expression levels may ultimately remove the requirement of control samples (for deriving the standardized profiles), and expand the set of queryable samples. Finally, as our Bayesian learning framework takes similarity scores between query profiles and database disease profiles as input, we expect our method would continue to be applicable as technology evolves, as long as such similarity scores are available.
Methods
Microarray Data Collection and Filtering.
We selected microarray datasets from the NCBI GEO database according to the following criteria: (i) all samples were of human origin; (ii) data were generated with one of the major platforms (e.g., Affymetrix HG-U95A, HG-U133A, or HG-U133 Plus 2) that share a large number (8,358) of common genes; (iii) each dataset contains at least one disease subset and at least one normal subset. This selection resulted in 100 GEO datasets, comprising 9,169 experiments.
Standardizing Expression Data and Phenotype Data.
As described in Results, we standardized the expression data by taking log-rank-ratios between disease and normal profiles. For instance, given a dataset containing a disease subset with m replicated samples and a normal subset with n replicated samples, we obtain mn log-rank-ratio vectors (standardized profiles) that together constitute a standardized dataset. The 100 GEO datasets selected for this study gave rise to 196 standardized datasets.
UMLS provides an extensive catalog of medical concepts, but in this study we concentrate on human disease concepts. We determine the phenotypic context of each GEO dataset from two sources (30): the Medical Subject Headings (MeSH) of its PubMed record, and the summary description in GEO. Both texts were parsed to identify relevant UMLS concepts using the MetaMap program (16). These concepts provide the dataset-level annotations. Furthermore, we parsed subset descriptions and sample descriptions to identify additional UMLS concepts. These UMLS concepts are the subset-level annotations. Example UMLS annotations can be found in SI Text. After discarding UML concepts that are too general or too rare (SI Text), we were left with 110 concepts, each representing a disease class.
Modeling the Latent Variables T.
We defined P(Ti,k|ei,k) according to the following principles: (i) P(Ti,k = 1|e) is larger if Uk is mapped to the ith standardized dataset at the GEO subset level (ei,k = 2) rather than the dataset level (ei,k = 1); (ii) P(Ti,k = 1|e) is smaller if many diverse UMLS concepts are mapped to the ith standardized dataset (that is, we discount noisy annotations); and (iii) we assign P(Ti,k = 1|e) a very small (close to zero) value if Uk is not mapped to the ith standardized dataset. More details are in SI Text. The last condition is designed to correct possible text-mining errors. The introduction of T to the model allows a researcher to assign varied levels of learning credence to the training data based on their confidence in the UMLS annotations. This property cannot be incorporated into traditional classification approaches.
The Log-Linear Regression.
The model structure is based on extensive observations that the mean value of sx,i is effective in distinguishing between P1(sx,i) and P0(sx,i). Our other efforts to model P1(sx,i)/P0(sx,i) included the following regression, which contains more factors related to the distribution of sx,i:
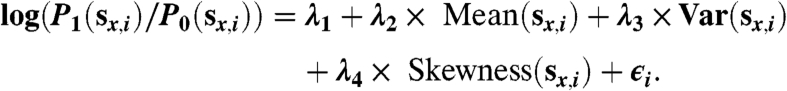 |
Studies using the available data did not reveal any clear advantage to using this model over that described in the text, which is not surprising since the mean value had already proven effective at distinguishing between P0(sx,i) and P1(sx,i). Any improvement on this regression would further increase the effectiveness of our method.
Cross-Validation Procedure.
We evaluated the performance of our disease diagnosis scheme as follows. Considering each GEO dataset in turn, we took all standardized profiles derived from that dataset out of the database and used the remaining data to train the model. The resulting system was then used to diagnose the left-out data. More details are in SI Text. We repeated this procedure for all 100 GEO datasets, and assessed the overall classification performance using three measures: (i) Precision = TP/(TP + TN), (ii) Recall = TP/(TP + FN), and (iii) Accuracy = (TP + TN)/(TP + TN + FP + FN). TP is the number of true positives, TN is the number of true negatives, FP is the number of false positives, and FN is the number of false negatives.
Significance Evaluation of the Disease-Drug Links.
We applied our disease diagnosis system/database to 1,248 queries involving drug treatments. The diagnosis results linked the queried drugs to one or more UMLS disease concepts. After removing redundant drug/disease concepts and excluding the disease classes that were already in the query’s known annotations, 1,720 unique disease-drug links were left for consideration. We evaluated each link using a hypergeometric test (SI Text). Due to the high level of data dependency and the possible violation of assumptions on the hypergeometric distribution, we adjusted the hypergeometric p value by a bootstrap p value (SI Text). Finally we identified 234 significant links (FDR < 0.3).
Supplementary Material
Acknowledgments.
We thank Dr. Ming-Chih J. Kao for his generous contribution of clinical knowledge to this study. We thank Dr. Frank Alber for his assistance in preparing the manuscript. We also thank the anonymous reviewers for their helpful comments. This project was supported by the National Institutes of Health Grants R01GM074163 (to X.J.Z.) and R21EY019094 (to H.H.), and the National Science Foundation Grants 0515936 and 0747475 (to X.J.Z.).
Footnotes
The authors declare no conflict of interest.
This article is a PNAS Direct Submission.
This article contains supporting information online at www.pnas.org/cgi/content/full/0912043107/DCSupplemental.
References
- 1.Edgar R, Domrachev M, Lash AE. Gene expression omnibus: NCBI gene expression and hybridization array data repository. Nucleic Acids Res. 2002;30:207–210. doi: 10.1093/nar/30.1.207. [DOI] [PMC free article] [PubMed] [Google Scholar]
- 2.Horton PB, Kiseleva L, Fujibuchi W. RaPiDS: an algorithm for rapid expression profile database search. Genome Inform Ser. 2006;17(2):67–76. [PubMed] [Google Scholar]
- 3.Tanner SW, Agarwal P. Gene vector analysis (Geneva): A unified method to detect differentially-regulated gene sets and similar microarray experiments. BMC Bioinformatics. 2008;9(1):348. doi: 10.1186/1471-2105-9-348. [DOI] [PMC free article] [PubMed] [Google Scholar]
- 4.Hibbs MA, et al. Exploring the functional landscape of gene expression: directed search of large microarray compendia. Bioinformatics. 2007;23(20):2692–2699. doi: 10.1093/bioinformatics/btm403. [DOI] [PubMed] [Google Scholar]
- 5.Zhu Y, et al. GEOmetadb: powerful alternative search engine for the Gene Expression Omnibus. Bioinformatics. 2008;24(23):2798–2800. doi: 10.1093/bioinformatics/btn520. [DOI] [PMC free article] [PubMed] [Google Scholar]
- 6.Shah NH, et al. Ontology-driven indexing of public datasets for translational bioinformatics. BMC Bioinformatics. 2009;10(Suppl 2):S1. doi: 10.1186/1471-2105-10-S2-S1. [DOI] [PMC free article] [PubMed] [Google Scholar]
- 7.Alizadeh AA, et al. Distinct types of diffuse large B-cell lymphoma identified by gene expression profiling. Nature. 2000;403:503–511. doi: 10.1038/35000501. [DOI] [PubMed] [Google Scholar]
- 8.Golub TR, et al. Molecular classification of cancer: class discovery and class prediction by gene expression monitoring. Science. 1999;286:531–537. doi: 10.1126/science.286.5439.531. [DOI] [PubMed] [Google Scholar]
- 9.Nilsson B, Andersson A, Johansson M, Fioretos T. Cross-platform classification in microarray-based leukemia diagnostics. Haematologica. 2006;91:821–824. [PubMed] [Google Scholar]
- 10.Stec J, et al. Comparison of the predictive accuracy of DNA array-based multigene classifiers across cDNA arrays and Affymetrix GeneChips. J Mol Diagn. 2005;7:357–367. doi: 10.1016/s1525-1578(10)60565-x. [DOI] [PMC free article] [PubMed] [Google Scholar]
- 11.Warnat P, Eils R, Brors B. Cross-platform analysis of cancer microarray data improves gene expression based classification of phenotypes. BMC Bioinformatics. 2005;6:265. doi: 10.1186/1471-2105-6-265. [DOI] [PMC free article] [PubMed] [Google Scholar]
- 12.Koller D, Sahami M. Hierarchically classifying documents using very few words. Proceedings of the 14th International Conference on Machine Learning (ICML) 1997:170–178. [Google Scholar]
- 13.Lamb J, et al. The Connectivity Map: using gene-expression signatures to connect small molecules, genes, and disease. Science. 2006;313:1929–1935. doi: 10.1126/science.1132939. [DOI] [PubMed] [Google Scholar]
- 14.Liu CC, et al. Integrative disease classification based on cross-platform microarray data. BMC Bioinformatics. 2009;10(Suppl 1):S25. doi: 10.1186/1471-2105-10-S1-S25. [DOI] [PMC free article] [PubMed] [Google Scholar]
- 15.Bodenreider O. The Unified Medical Language System (UMLS): integrating biomedical terminology. Nucleic Acids Res. 2004;32:D267–270. doi: 10.1093/nar/gkh061. [DOI] [PMC free article] [PubMed] [Google Scholar]
- 16.Aronson AR. Effective mapping of biomedical text to the UMLS Metathesaurus: the MetaMap program. Proceedings of the AMIA Symposium. 2001:17–21. [PMC free article] [PubMed] [Google Scholar]
- 17.Butte AJ, Kohane IS. Creation and implications of a phenome-genome network. Nat Biotechnol. 2006;24:55–62. doi: 10.1038/nbt1150. [DOI] [PMC free article] [PubMed] [Google Scholar]
- 18.Dudley JT, Tibshirani R, Deshpande T, Butte AJ. Disease signatures are robust across tissues and experiments. Molecular Systems Biology. 2009;5:307. doi: 10.1038/msb.2009.66. [DOI] [PMC free article] [PubMed] [Google Scholar]
- 19.Barutcuoglu Z, Schapire RE, Troyanskaya OG. Hierarchical multi-label prediction of gene function. Bioinformatics. 2006;22:830–836. doi: 10.1093/bioinformatics/btk048. [DOI] [PubMed] [Google Scholar]
- 20.Pena-Castillo L, et al. A critical assessment of Mus musculus gene function prediction using integrated genomic evidence. Genome Biol. 2008;9(Suppl 1):S2. doi: 10.1186/gb-2008-9-s1-s2. [DOI] [PMC free article] [PubMed] [Google Scholar]
- 21.Hamosh A, et al. Online Mendelian Inheritance in Man (OMIM), a knowledgebase of human genes and genetic disorders. Nucleic Acids Res. 2005;33(Database Issue):D514–D517. doi: 10.1093/nar/gki033. [DOI] [PMC free article] [PubMed] [Google Scholar]
- 22.Jackson JK, Higo T, Hunter WL, Burt HM. Topoisomerase inhibitors as anti-arthritic agents. Inflamm Res. 2008;57(3):126–134. doi: 10.1007/s00011-007-7163-6. [DOI] [PubMed] [Google Scholar]
- 23.Kim RJ, Peterson G, Kulp B, Zanotti KM, Markman M. Skin toxicity associated with pegylated liposomal doxorubicin (40 mg/m2) in the treatment of gynecologic cancers. Gynecol Oncol. 2005;97(2):374–378. doi: 10.1016/j.ygyno.2004.12.057. [DOI] [PubMed] [Google Scholar]
- 24.Shan K, Lincoff AM, Young JB. Anthracycline-induced cardiotoxicity. Annals of internal medicine. 1996;125(1):47–58. doi: 10.7326/0003-4819-125-1-199607010-00008. [DOI] [PubMed] [Google Scholar]
- 25.Peng X, Chen B, Lim CC, Sawyer DB. The cardiotoxicology of anthracycline chemotherapeutics: translating molecular mechanism into preventative medicine. Mol Interv. 2005;5(3):163–171. doi: 10.1124/mi.5.3.6. [DOI] [PubMed] [Google Scholar]
- 26.Horenstein MS, Vander Heide RS, L’Ecuyer TJ. Molecular basis of anthracycline-induced cardiotoxicity and its prevention. Mol Genet Metab. 2000;71:436–444. doi: 10.1006/mgme.2000.3043. [DOI] [PubMed] [Google Scholar]
- 27.Garofalo C, Surmacz E. Leptin and cancer. J cell physiol. 2006;207:12–22. doi: 10.1002/jcp.20472. [DOI] [PubMed] [Google Scholar]
- 28.Rio GD, et al. Weight gain in women with breast cancer treated with adjuvant cyclophosphomide, methotrexate and 5-fluorouracil. Analysis of resting energy expenditure and body composition. Breast Cancer Res Tr. 2002;73(3):267–273. doi: 10.1023/a:1015892714162. [DOI] [PubMed] [Google Scholar]
- 29.Camoriano JK, et al. Weight change in women treated with adjuvant therapy or observed following mastectomy for node-positive breast cancer. J Clin Oncol. 1990;8:1327–1334. doi: 10.1200/JCO.1990.8.8.1327. [DOI] [PubMed] [Google Scholar]
- 30.Butte AJ, Chen R. Finding disease-related genomic experiments within an international repository: First steps in translational bioinformatics; Proceedings of the AMIA Symposium; 2006. pp. 106–110. [PMC free article] [PubMed] [Google Scholar]
Associated Data
This section collects any data citations, data availability statements, or supplementary materials included in this article.