

Abstract
We describe an optical method capable of tracking a single fluorescent molecule with a flexible choice of high spatial accuracy (∼10–20 nm standard deviation or ∼20–40 nm full-width-at-half-maximum) and temporal resolution (< 1 ms). The fluorescence signal during individual passages of fluorescent molecules through a spot of excitation light allows the sequential localization and thus spatio-temporal tracking of the molecule if its fluorescence is collected on at least three separate point detectors arranged in close proximity. We show two-dimensional trajectories of individual, small organic dye labeled lipids diffusing in the plasma membrane of living cells and directly observe transient events of trapping on < 20 nm spatial scales. The trapping is cholesterol-assisted and much more pronounced for a sphingo- than for a phosphoglycero-lipid, with average trapping times of ∼15 ms and < 4 ms, respectively. The results support previous STED nanoscopy measurements and suggest that, at least for nontreated cells, the transient interaction of a single lipid is confined to macromolecular dimensions. Our experimental approach demonstrates that fast molecular movements can be tracked with minimal invasion, which can reveal new important details of cellular nano-organization.
Keywords: single molecule, tracking, membrane dynamics, lipid rafts
Many open questions in biology can be tackled only if the dynamics of individual molecules can be observed noninvasively in vivo and at the appropriate spatial and temporal scale (1–5). Over the years, specific labeling of the cell’s constituent parts with fluorescent markers has enabled deeper understanding in many areas of cell biology and allowed, for example, the spatio-temporal tracking of single particles (6, 7). However, to reach the desired spatial and temporal accuracy, single-particle tracking often applies bright but large and clumsy signal markers, which potentially influence the system under study. One notable example is the dynamics of proteins and lipids in cellular membranes and their organization into nanodomains, so-called “lipid rafts” (8–12). Since their proposal, the question of the existence and functional role of such cholesterol-mediated lipid assemblies has caused much controversy (13–16). Owing to the lack of suitable noninvasive techniques to detect these nanodomains in living cells, their spatial extent has been estimated at somewhere in the range of 5–200 nm (17), that is between molecular dimensions and the resolution limit of conventional fluorescence microscopy. Camera-based tracking of single lipids could provide more detailed insight (18–20). However, so far it either lacked temporal resolution or it made use of rather large gold beads as lipid labels, implying that the measurements may not give comprehensive answers to the open questions. Recently, stimulated-emission-depletion (STED) nanoscopy (21, 22), delivering subdiffraction resolution in live cells, provided direct evidence that certain lipids are transiently trapped in cholesterol-assisted molecular complexes (23, 24). In those experiments, which are evaluated by fluorescence correlation spectroscopy (FCS) (25–28), one exploits the property of STED that the observation area can be tuned continuously from a diffraction-limited diameter (240 nm) down to in this case ∼30 nm in full-width-at-half-maximum (FWHM). These studies revealed that the extent of the area in which the lipids dwell during trapping is < 20 nm in diameter (23). Here, we present an optical single-molecule tracking approach that is capable of following the fast lipid movements with minimal invasion. The setup is based on a confocal microscope, where the confocal pinhole is replaced by at least three separate point detectors arranged in close proximity. It allows a flexible choice of high spatial accuracy (< 30 nm) and temporal resolution (< 1 ms) for the use of small dye labeled lipids. Nanoscale trapping of fluorescent lipid analogs in the plasma membrane of living cells is revealed and is consistent with the previous STED-FCS data. The area in which a single lipid dwells during trapping is directly shown to be smaller in diameter than 20 nm; i.e., trapping occurs on macromolecular scales. The trapping is much more pronounced for a sphingo- than for a phosphoglycero-lipid, with average trapping times of about 15 ms and less than 4 ms, respectively. In contrast to camera-based lipid tracking experiments, our approach allows a flexible choice of spatial and temporal resolution and gives straight access to spectroscopic parameters. It may reveal previously undescribed important details of biological problems where dynamical molecular nano-organization is crucial.
Results
Direct Access to Biomolecular Dynamics by Fast Tracking.
We apply a far-field epi-illumination confocal microscope in conjunction with single-photon counting detectors. Fast sequential localization and thus spatio-temporal tracking of individual molecules is realized by collecting the fluorescence on at least three separate point detectors arranged in close proximity (Fig. 1A). By choosing the concentration of the fluorescent molecules low enough, we ensure that within our focal area of observation at the most one single fluorescent molecule is found at a time, which diffuses and thus explores its surroundings. If the molecule passes through the stationary focal area of our confocalized microscope, a burst of fluorescence photons is elicited by 633 nm continuous-wave laser excitation and imaged onto the input faces of three optical fibers, each coupled to a different detector. The fibers are arranged in closest packing such that their projection back into sample space forms a triangle with overlapping detection point-spread functions (PSFs) (Fig. S1). The use of several distinct detection pinholes to obtain localizations was suggested (29, 30) and also demonstrated (31, 32) with individual quantum dot probes in conjunction with fast translational feedback motion of the sample. Other sophisticated apparatus can track particles “on-the-fly” in 3D by scanning one or several laser spots in elliptical or circular orbits using feedback loops to keep the particle at the center of the observation field (33, 34). While these schemes have enabled extended observation times of tens of milliseconds to seconds, the rather large labels (quantum dots) may potentially influence the system under study. By contrast, our approach is equally well suited for small dye labels. As neither scanning nor feedback is required, our setup is rather simple, just using multiple pinholes, represented by the fibers, instead of a single one. Because of the limited observation area (diameter ∼250 nm), the trajectories in our scheme are short, yet we collect many hundreds of these trajectories in a measurement because single molecules quickly enter and leave the focal area.
Fig. 1.

Principle of fast confocalized single-molecule tracking. (A) Optical arrangement. Fluorescence excited in the focal region is imaged onto a quasi-confocal detection area of three densely packed fibers. Signals from the connected three avalanche photodiodes (APDs) are recorded in a single-photon counting mode. (B) Reference map encoding the relative distribution of photon counts on the three detectors for a fluorescent object as a function of position (x,y). This map was obtained by scanning a 40 nm fluorescent bead over a 500 nm × 500 nm observation region and combining the count information on all three channels. Colors denote detector affiliations.
Knowing the relative detection efficiencies of the three detector channels for objects placed at different points in the focal plane, the position of the fluorescent molecule can be traced from the signal distribution on the three detectors. To this end, we established a reference map (Fig. 1B) by scanning a fluorescent bead through the focus and recording the three detector signals as a function of the bead position. The single-molecule experiments were then performed as follows (see SI Text): Traces of photon data with information on single-photon arrival times and identification of the corresponding detector channel (1, 2, or 3) were recorded during typically 5–10 min. Individual molecular transits were identified (Fig. 2A) as the fluorescence bursts exceeding a threshold level of fivefold the background signal (offset) during the measurement. Binning photons, either in fixed time-steps or in groups of a fixed total photon number N per localization step, yields three count values S1, S2 and S3 in channels 1 to 3, respectively (Fig. 2B). This triple (S1,S2,S3) is compared to the reference map to find the coordinates (x,y) where it best matches the reference triple {(R1,R2,R3)} encoding the relative detection efficiencies. The best agreements of all recorded positions yield the trajectory  of the molecule (Fig. 2C). Employing a single-photon counter instead of a time-binned detector allows grouping the detected photons into sets of a desired number N, which allows a more reliable estimate of the accuracy of each localization. A point-like object (molecule) emitting N photons may ideally be localized with an error Δx,Δy≈FWHM·N-1/2, where FWHM is that of the detection PSF of the imaging system (35).
Fig. 2.

(A–C) Spatio-temporal information on fast diffusing individual molecules. (A) The fluorescence signal over time is detected on all three detectors. Molecular transits through the observation spot are identified and selected as bursts (Red) in fluorescence signal. (B) Comparison of the signal values (S1,S2,S3) of a selected burst with the reference map {(R1,R2,R3)} by a maximum likelihood scheme (colors denote detector affiliations) yields (C) the lateral position (x,y) and, by repetitive localization, a molecule trajectory  . (Scale bar, 100 nm.) (D) Localization accuracy σr versus photon number N. An isolated 24 nm fluorescent bead is localized repeatedly for a varying number of total photons N. The spread of 10,000 independent localizations in each case is examined (Inset, Scale bar, 100 nm). The radial standard deviation σr = (σx·σy)1/2 is found to scale with N-1/2 as expected.
Localization Performance.
Tests were performed to ensure that the localized position by our method, i.e., the allocated x and y coordinates based on photon data, is reliable and solely subject to the known error. Depending on the number of photons utilized in a single localization, the accuracy will vary. To demonstrate this, isolated 24 nm-sized fluorescent beads at rest were localized repeatedly utilizing a varying number of photons, and the spread of 10,000 independent localizations in each case was examined (Fig. 2D). The radial standard deviation σr = (σx·σy)1/2≈σx≈σy of the cloud of localized positions is a measure of the localization accuracy (SI Text) and was found to be σr = 12.2 nm for N = 250 photons, scaling with N-1/2 as expected. Fluorescent beads scanned linearly through the observation region were adequately localized (Fig. S2). The entirely background-free measurements of immobilized beads represent the absolute lower bound on the localization accuracy attainable with our apparatus. We verified that the localization procedure does not introduce any bias or inconsistency. The data triple (R1,R2,R3) of each point in the reference map was scaled to N photons. These scaled triplets were used as signal {(S1,S2,S3)} to be localized with the same reference map. In the central region, the localized positions deviated only by ∼3 nm or less from the known points (Fig. S3A). These deviations |ΔR| were thus insignificant compared with the photon-limited position accuracy σr≈10 nm of our experiments. An examination of > 70,000 localizations from single-molecule transits shows that their distribution on the map exhibits no discernible structure and is deemed uniform (Fig. S3B). Plotting the entry and exit points of ∼20,000 trajectories shows that most points reside on the periphery of the observation area (Fig. S4). However, because of the burst selection criteria, some of the entering molecules are first localized well on their way toward the center and some will not leave the observation area at the very edge. Comparing the number of nonperipheral localizations upon entry and exit reveals that about 2–3% of the fluorophores are bleached during the transit. Consequently, we have chosen a low enough excitation power so that the influence of bleaching is sufficiently small, allowing a bias-free statistical analysis of molecular diffusion and trapping (SI Text).
Tracking Plasma Membrane Lipids in Living Cells.
Lipid labeling of a phosphoglycero-lipid (phosphoethanolamine, PE) and of a sphingolipid (sphingomyelin, SM) by the hydrophobic organic dye Atto647N was the same as described previously (23) (Fig. S5). The fluorescent lipid analogs were inserted into the plasma membrane of living PtK2 cells by incubation with lipid-BSA-complexes (23). Control experiments ensured a concentration of the fluorescent lipids low enough for single-molecule measurements (Fig. S6). We placed the focus at random positions in the lower plasma membrane facing the cover slip and completed all measurements so swiftly (< 30 minutes) that no significant internalization or morphological changes in the cell could take place. Flat membrane regions remote from the central nucleus and discernible organelles were chosen to minimize the unwanted background. The present experiments were performed in cell medium at ∼23 °C. Lowering of the plasma membrane’s cholesterol content was realized by cholesterol oxidase (COase) treatment. For free diffusion controls we measured PE in a supported lipid bilayer model. Excellent signal to noise ratios of 200 and higher were obtained for the single-lipid transits (Fig. 2A). Having count rates of up to 1 MHz for molecules passing the center of the excitation spot, we chose N = 250 photons as a good compromise between experimental localization error and temporal resolution. Instantaneous count rates directly determine the effective temporal resolution at one instant, which is < 1 ms and for much of the trajectory < 0.5 ms.
Analysis of Lipid Trajectories.
The statistical analysis of the sets of trajectories we obtained by our method is designed to take into account the nontrivial diffusion behavior expected for membrane constituents in a living cell. Notably, the earlier dynamical study by STED nanoscopy (23, 24) revealed non-Brownian behavior for sphingolipids, with indications of much lower anomaly for phospholipids and for sphingolipids in cholesterol-depleted (COase-treated) membranes. This is fully confirmed by the mean squared displacement (MSD) of our tracking data (Fig. 3A). Rather than relying on the MSD, we build our analysis on the cumulative probability of square displacements (36). This approach allows us to superpose several, here two, regimes of diffusion and to determine their relative presence in the translational motion of the molecules. P(Δr2,Δt) shall denote the probability that a single-molecule will be found within a circle of radius Δr from its starting point after a time Δt. Typically, 300–3,000 trajectories are identified from a photon trace recorded for 5–10 min. Each trajectory represents a sequence of spatial positions  localized for N = 250 consecutive detected photons of a selected single-molecule burst. From
  , a set of values for the square displacements,
  , between two localizations separated by variable time lags Δt is obtained. With the corresponding set of time lags Δt, we may then construct a discrete probability density p(Δr2,Δt) by counting the number of square displacements between Δr2 and Δr2 + Δ(Δr2) and Δt to Δt + Δ(Δt) (SI Text). Single-photon information allows us to shift the time observation window in steps that are smaller than the temporal resolution, yielding more points and thus improved statistical significance. We can rule out bias by this “sliding-scale” analysis because we obtained similar results with an analysis including discrete time-resolution increments only.
Fig. 3.

Diffusion of small organic dye labeled lipids in the plasma membrane of living mammalian cells. (A) Mean squared displacement (MSD) vs. time lag Δt along trajectories for Atto647N-labeled lipids diffusing in a supported lipid bilayer (SLB) and in the plasma membrane of live mammalian PtK2 cells. The examples show PE, SM and SM after COase treatment. The deviation from a linear dependence MSD(Δt), indicating non-Brownian motion, is lowest for PE and largest for SM. The deviation from linear behavior starting at ∼(95 nm)2 for SLB is due to the finite observation area (of radius R = 110 nm in this case). (B) Typical examples of the cumulative probability P(Δr2,Δt) as a function of time lag Δt and squared displacement Δr2 for all cases. Number of trajectories: 972 (PE), 2518 (SM), 2879 (SM-COase), and 1764 (SLB). The faster the lipid diffuses, the quicker it explores space, i.e., the more P(Δr2,Δt) flattens with longer lag time. SM shows a clear signature of dominant trapping, which is substantially reduced after COase treatment. (C) Results of global fits to P(Δr2) to a model containing a freely diffusing and a strictly stationary regime. The fraction of time α spent in the mobile regime differed substantially between PE and SM. PE was largely mobile, though did show short trapping, while SM was frequently trapped and remained in the stationary regime for most of the time. Cholesterol depletion by COase treatment led to higher mobility of SM. Values of SM-COase vary more strongly as the COase impact is somewhat variable.
As a result of the finite observation radius R (in our implementation typically 120 nm), short step-lengths are reproduced more often than long ones. Naturally, the longest trackable step goes across the entire region with length 2R. We account for this reduced probability of observing long steps by correcting with the probability Ptrack(Δr,R) of detecting a step of length Δr for which both the initial and the end point lie within the circle of radius R. Ptrack is equivalent to the convolution (overlap integral) of two circles with radius R and center-to-center distance Δr (Fig. S7), that is
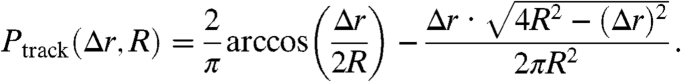 |
We divide the probability density p(Δr2,Δt) by Ptrack(Δr,R) before cumulation and normalization of the distribution.
Computing the cumulative probability P(Δr2,Δt) in this way, with increments Δ(Δt) = 0.1 ms and Δ(Δr2) = 50 nm2, reveals marked differences for both lipid classes (Fig. 3B). While PE diffuses and thus explores space quickly, i.e., P(Δr2) flattens with longer lag time, SM shows a clear signature of dominant trapping interactions and much less development of the spatial part of the distribution with growing lag time. Depletion of cholesterol by COase treatment reduces the trapping of SM, rendering its diffusional behavior similar to PE. The supported lipid bilayer control measurements exhibit free diffusion without obstacles as expected.
In assessing our data further, we chose the simplest possible physical model. It contains a mobile regime, represented by free Brownian motion with a characteristic diffusion coefficient D and a stationary regime during which the particle merely stays trapped at a fixed location. The cumulative probability P(Δr2,Δt)) then takes the form (36, 37)
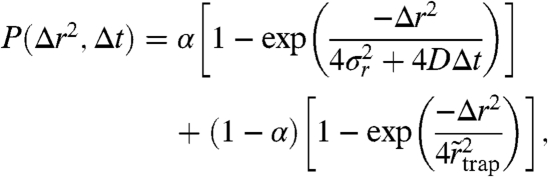 |
where α is the (time-)fraction of the free diffusion regime, σr is the experimental localization error, and  is a parameter allowing an estimate of the radius
 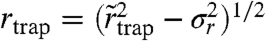 of the area within which the trapping interaction takes place (SI Text). The molecule in this model can, at any time, either be stationary or mobile. The results of global fits to the cumulative distribution of each dataset yielded the values as shown in Fig. 3C. In agreement with the previous STED data (23, 24), D varies in the range of 0.3–0.5 μm2/ s-1, and the time fractions of the two regimes differ significantly for the two classes of lipids. SM is dominated by the trapped regime (α ≈ 0.30), while PE is largely mobile (α ≈ 0.70) and SM under cholesterol depletion by COase nearly reaches PE characteristics (α ≈ 0.65); i.e., trapping is strongly reduced. The supported lipid bilayer measurements yield the result for free diffusion: α≈1, as anticipated.
The values of 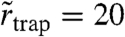 (SM), 22 (PE), and 21 nm (SM-COase) extracted from the global fits help us to give an estimate of the maximum range over which the molecule moves during the trapping. They are in the same range as the localization accuracy σr = 19 nm, which was consistently found for our experiments on the moving objects (SI Text). This demonstrates very localized trapping interactions with crude estimations of rtrap ≤ 10 nm (Table 1). The inferred trapping radii rtrap may contain either a true lateral degree of freedom within a finite-sized trap, but more likely reflect—at least in part—motion of the trap-lipid-complex during trapping. In any case, they reveal that trapping occurs on macromolecular scales and is possibly caused by transient molecular complexes such as lipid–protein interactions.
Table 1.
Results of single-molecule tracking of lipid diffusion
| D (μm2/s) | α | rtrap (nm) |
 (nm) (nm) |
 (ms) (ms) |
|
| SLB | 3.6 | 1 | - | - | - |
| PE | 0.4 | 0.7 | 11 | 3 | 3 |
| SM | 0.35 | 0.3 | 6 | 3 | 17 |
| SM+COase | 0.3 | 0.65 | 9 | 3 | 3 |
SLB: supported lipid bilayer; PE: Atto647N-phosphoethanolamine (live cell); SM: Atto647N-sphingomyelin (live cell); COase: SM diffusion after cholesterol depletion by COase treatment (live cell). D: free diffusion constant; α: time-fraction of free diffusion; rtrap: radius of trapping area determined by fitting P(Δr2,Δt) (N = 250);  : radius of trapping area determined by the magnifying analysis (N = 1,000);
  : trapping time determined by the magnifying analysis (N = 1,000). Standard deviations of values are approximately 10–30%.
To ensure that the dye label had no observable influence on the dynamic behavior of the lipids, two types of sphingomyelin were tested. The first one was labeled by replacing the native long acyl chain with a short acyl chain carrying the dye (see SM). The second type was labeled at the head group, i.e., in the water phase (Fig. S5). Both types were characterized by the same diffusion constant D, the same time fractions α as well as the same trapping radius rtrap (SI Text). These findings are in line with the observations of the previous STED-FCS measurements (23). One could speculate that an elevated excitation power may result in increased photobleaching, which should compromise the recording of long traces of trapped lipids (24). This may lead to an overestimation of the (time-)fraction α of the free diffusion regime. We have tested our method at various levels of excitation power (5–20 μW, i.e., intensities of 5–20 kW/cm2) and applied other approaches, such as FCS, to ensure that our results are not biased by bleaching. On the other hand, as for single-particle tracking in general (19, 31–34), too low a brightness of the single molecules, which in our case may result from too low an excitation power, also leads to an overestimation of the values of α because short traps can no longer be discerned from free diffusion. Consequently, we have chosen a laser power of 20 μW to elicit strong fluorescence response and limit bleaching. Since the values of α gained with our method in any case represent upper bounds, one can be confident that trapping occurs to at least the measured degree and that major differences between SM and PE diffusion are present (SI Text).
“Magnifying” Analysis of Lipid Trajectories.
We performed an alternative (magnifying) analysis based on the direct examination of individual trajectories. For free Brownian diffusion, as the lag time increases, it becomes increasingly unlikely that a molecule has not left a small circular domain. For a domain of diameter d = 60 nm, more than 97% of all molecules will have left the domain after Δt = 15 ms by Brownian motion, given the known diffusion constant D of the membrane lipids (alternatively, Δt = 3.7 ms for d = 30 nm). Focusing on the spatial extent of long traps, we declared those instances where the lipid still resided inside the circular domain after Δt as transient traps and approximated the extent of the trapping area by determination of the radial standard deviation 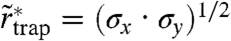 of the set of all localizations during this time (SI Text). An advantage of concentrating only on trapped events is that it allows us to increase the number of photons used for spatial localization to N = 1,000 and thus to increase the localization accuracy to
 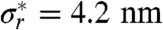 (SI Text). The histogram in Fig. 4A shows the distribution of determined values of
  of 8,724 selected trajectories of SM for a photon binning with N = 1,000 photons (d = 30 nm). From the average value of
  we can again estimate the area on which the trapping interaction takes place, with an average radius
  , which is even slightly lower than the trapping radius rtrap determined before. We determined similar values of
  for PE and for SM in cholesterol-depleted cells (Table 1). The trajectories selected for the magnifying analysis represent the longest traps, potentially taking up the largest area. This supports the notion that the trapping occurs on the macromolecular scale.
Fig. 4.

The direct examination of trajectories with prolonged residence within small regions (magnifying analysis) provided another estimate of the trapping area with radius  , as well as estimates of the trapping time. (A) Radial standard deviation
  of the set of all localizations during a selected trajectory and localization accuracy
  of the magnifying analysis resulted in
  for N = 1,000; i.e., trapping occurs on the macromolecular scale (data shown: SM). (B) Trapping durations ttrap (N = 1,000) for PE, SM-COase and SM with exponential fits yielding characteristic decay times of 3 (PE), 3 (SM-COase), and 17 ms (SM). The histograms were normalized to the amplitudes of the exponential fit. Insets show two examples of sets of all localizations during a selected trajectory. (Scale bar, 100 nm.)
Next, we plotted the distribution of trapping times ttrap of the trajectories selected from the magnifying analysis (N = 1,000) (SI Text), as shown for all three cases in Fig. 4B. Two results became obvious. First, the number of selected trajectories was lower for PE and SM-COase, stemming from the much lower extent of trapping. Second, the distribution of ttrap was shifted to shorter times in the case of PE or SM-COase, reflecting a much shorter trapping time than for SM. Fitting an exponential decay to the distribution of ttrap resulted in characteristic trapping times  for PE, 17 ms for SM and 3 ms for SM after COase treatment (Table 1). Because of the minimum accessible time of ∼4 ms of the alternative magnifying analysis, these values are, especially in the case of PE and of SM with COase treatment, a rather coarse estimation. In any case, these trapping times are similar to those gained through STED-FCS (23, 24).
Discussion, Conclusion, and Outlook
The dynamical localization of individual fluorescent molecules in two dimensions with simultaneous high spatial localization accuracy (σr = 10–20 nm) and temporal resolution (∼0.5 ms) constitutes a substantial improvement in in-vivo single-molecule-tracking. A major factor contributing to the high spatio-temporal resolution of our tracking approach is the state-of-the-art single-photon detection and recording that allows us to adjust the spatial and temporal resolution. In addition, we envisage that the single-photon mode will give access to other spectroscopic parameters such as fluorescence lifetime (e.g., via time-correlated single-photon counting), color, or polarization anisotropy. This is different from conventional camera-based tracking approaches, whose time resolution is linked to the camera’s frame rate and for which access to spectroscopic parameters is more difficult. Compared to the large field of view of a camera, our observation area is currently limited to ∼250 nm in diameter, also limiting the length of the trajectories observed. Yet, we collect many hundreds of single-molecule transits through the focal area in a single measurement. The potential of revisiting features of interest with matched spatio-temporal resolution was illustrated in this work by characterizing the spatial extent of the traps with increased localization accuracy.
Our method offers flexibility when it comes to choosing appropriate spatial and temporal accuracies to track the molecular motion of interest. Evidently, there are limits to achieving both equally well. When using groups of N photons from our photon stream to yield positions, the effective temporal resolution Δt, i.e., the time between two consecutive localizations, is given by Δt≈N/Q. The localization is subject to a similar uncertainty of ΔA≈APSF/N, where APSF is the area of the detection PSF. It follows that ΔA·Δt≈APSF/Q, i.e., the product of spatial localization accuracy and temporal resolution, is roughly constant in the experiment. ΔA·Δt varies slightly over the observation area as the count rate from the molecule is highest at the center of our excitation profile. It is interesting to note that similar considerations apply to single-molecule-switching-based far-field optical nanoscopy schemes. By choosing an appropriate N, it is thus possible to balance the spatial and the temporal accuracy as required. Single-molecule tracking is inherently challenged by the fact that too large ΔA or Δt result in an averaging out of strongly confined and/or short trapping events (19). Since the detection PSF (APSF) can hardly be reduced anymore, future improvements of the spatio-temporal resolution will mainly rely on higher detection rates Q. This can be achieved by brighter fluorophores (currently, Atto647N with Q ≤ 1 MHz), as implemented in numerous single-particle tracking experiments by applying large signal markers (19, 31–34), and/or an increased collection efficiency afforded by one or two opposing objectives of high NA, such as provided by a 4Pi microscope (38). Increasing Q by increasing the excitation power may be challenged by bleaching.
We highlight that our approach of using a localization reference map deals with point-like detectors in arbitrary relative configurations (the fibers need not be equidistant from each other). Arrays of more than three detectors may be used, covering a larger observation area, and axial (z) sensitivity could be achieved by a tetrahedral arrangement (30–32) or similar. Employing photoswitchable probe molecules within this method to control the density of fluorescing entities could enable the study of dynamics of individual molecules at comparatively high concentrations (29, 39–41). Effects of molecular orientation were not observed in this study. We cannot exclude them, but we anticipate that they should average out over the timescale of individual localizations (typically 0.5 ms) because of fast rotational diffusion in the molecular environment given.
Applied to rapidly diffusing plasma membrane lipids in living cells, our single-molecule tracking method revealed transient trapping on the macromolecular scale (rtrap < 10 nm). This is in agreement with the reported confinement to 20 nm diameter regions observed by STED-FCS (23, 24). Trapping of the sphingolipid SM is cholesterol-assisted and much more pronounced than that of the phosphoglycero-lipid PE. In contrast to PE, which exhibits a trapping for < 30% of the time, SM shows a deviation from free diffusion for about 70% of the time. This difference mainly stems from the pronounced trapping duration of > 15 ms for SM compared to < 4 ms for PE. As for the previous STED-FCS measurements (23, 24), our findings support the notion that a single lipid interacts only locally with other membrane components, potentially by transiently forming complexes with membrane proteins. While the complex (of several lipid and protein molecules) of which the trapped lipid is part may (temporarily) be larger, our data indicates that the lipid itself dwells only within < 20 nm diameter areas. External induction may amplify such domains (42).
The present method of quantifying molecular dynamics is complementary to STED-FCS (23, 24). The direct access to the spatio-temporal information of single-molecule trajectories is essential to infer the location and the time of transient molecular complex formation. However, the association and dissociation rates of complex formation are more difficult to assess because most short-lived complexes cannot be untangled from normal Brownian motion. Conversely, STED-FCS measures these rates quite easily, especially because it allows the observation of anomalous lipid diffusion through nanoscale foci of variable size. As a method operating with molecular ensembles, STED-FCS certainly has a series of advantages such as its ease of use, its ability to deal with various experimental conditions, and its short acquisition time.
Gaining information about individual complexes clearly is the realm of the present method. Studying the behavior of individual molecules means that there must not be more than a single molecule in the detection area at a given point in time. The experimental price to pay is the requirement of an adjusted label concentration and a longer acquisition time. Because the label concentration is about two orders of magnitude lower than with STED-FCS, the acquisition time (∼5–10 min) grows by about this factor to achieve comparable reliability. The agreement between the single-molecule tracking and STED-FCS results is remarkable, because the two methods employ different methodology and operate under different parameter conditions. In particular, the single-molecule tracking experiments were performed at much lower light levels (∼5–20 kW/cm2) than are found for the STED irradiation (10–100 MW/cm2). However, one must bear in mind that the low light levels are applied at a wavelength at which the dye absorbs light, whereas the more intense STED beam features a longer wavelength, i.e., a lower photon energy that is not really absorbed by the dye or the cell. Because we observed no difference, this is an indication that both approaches are valid, which reinforces our confidence in the STED measurements in living cells. Obviously, being complementary, both methods should also enable dynamical live-cell studies of other molecules, in particular of proteins.
Materials and Methods
Optical setup.
A confocal microscope was set up (Fig. 1A) using an oil immersion lens (100×, NA = 1.40, Leica) to focus the circularly polarized laser light into the sample (by overfilling the lens back aperture). The dyes were excited with a 633 nm continuous-wave (cw) Helium-Neon laser (Melles Griot) at a power P≈5–20 μW, i.e., focal peak intensities of ∼5–20 kW/cm2 set by a power controller unit (LPC; Brockton Electronics). The collected fluorescence passed through a dichroic mirror and filters and was imaged with a magnification of 200× onto the input faces of three optical fibers, each coupled to a single-photon avalanche photodiode (APD; SPCM-AQR-13-FC, PerkinElmer). The optical fibers were arranged in closest packing such that their backprojection into the sample forms a triangle with overlapping detection PSFs. We used multimode step-index fibers with 100 μm core diameter (CeramOptec) that were fused together at the common end, allowing an effective center-to-center detector separation of ∼125 μm. The central fiber was used in combination with two adjacent fibers (Fig. S1). The APD signals were recorded by a time-correlated single-photon counting module (SPC-830; Becker & Hickl). The channel information (1, 2, or 3) was preserved by a router (HRT-82; Becker & Hickl). All experiments were performed with a stationary focus and the sample stage at rest. We used a closed-loop piezostage (NanoMax; Melles Griot, or Tritor 102; Piezosystem Jena) for the recording of reference images and maps and for alignment procedures.
Samples.
We immobilized fluorescent crimson beads of mean diameters 24 nm and 40 nm (Invitrogen) for testing the localization accuracy and for recording the reference map. The beads were immobilized on coverslips with poly-L-lysine (0.1% wt/vol in water) solution and embedded in Mowiol. Sparse bead preparation enabled the imaging (localization) of individual beads. Supported lipid bilayers were prepared as in Chiantia et al. (43) (SI Text). We used the lipophilic organic dye Atto647N (excitation and emission maxima at 645 and 670 nm, respectively; Atto-Tec) as a marker in all experiments, whose structure (Fig. S5) has been determined in ref. 23. We applied the fluorescent lipid analogs phosphoglycero-lipid N-(Atto647N)-1,2-dipalmitoyl-sn-glycero-3-phosphoethanolamine (PE, Atto-Tec) and the sphingolipid N-(Atto647N)-sphingosylphosphocholine (N-Atto647N-sphingomyelin, SM, Atto-Tec). While PE is labeled at the head group, i.e., in the water phase, SM is labeled at the water-lipid interface, by replacing the native long acyl chain with a short acyl chain carrying the dye. We also applied a head-group labeled sphingomyelin (N-dodecanoylsphingosyl-[N′-(Atto647N)-phosphoethanolamine] (Atto647N-ceramide-phosphoethanolamine, CPE, Atto-Tec); structures given in Fig. S5. For membrane incorporation into the epithelial cell line PtK2 and the cholesterol oxidase (COase) treatment see ref. 23 and SI Text. Measurements were performed at room temperature in the lower plasma membrane facing the coverslip.
Supplementary Material
Acknowledgments.
We thank T. Gilat, R. Medda, and Dr. E. Rothermel for technical assistance with cell culture; Dr. C. Ringemann, V. Mueller, Dr. F. Pinaud (Paris), and Dr. G. Schwarzmann (Bonn) for fruitful discussions; J. Jethwa for reading of the manuscript; and J. Ehrig and Prof. P. Schwille (Dresden) for help with the supported lipid bilayers. M.L. is a fellow of the Alexander von Humboldt Foundation. This work was supported by the Leibniz-Prize (to S.W.H.).
Footnotes
The authors declare no conflict of interest.
This article is a PNAS Direct Submission.
This article contains supporting information online at www.pnas.org/cgi/content/full/0912894107/DCSupplemental.
References
- 1.Moerner WE, Orrit M. Illuminating single molecules in condensed matter. Science. 1999;283:1670–1676. doi: 10.1126/science.283.5408.1670. [DOI] [PubMed] [Google Scholar]
- 2.Ambrose WP, et al. Single molecule fluorescence spectroscopy at ambient temperature. Chem Rev. 1999;99:2929–2956. doi: 10.1021/cr980132z. [DOI] [PubMed] [Google Scholar]
- 3.Xie XS, Trautman JK. Optical studies of single molecules at room temperature. Annu Rev Phys Chem. 1998;49:441–480. doi: 10.1146/annurev.physchem.49.1.441. [DOI] [PubMed] [Google Scholar]
- 4.Moerner WE. New directions in single-molecule imaging and analysis. Proc Natl Acad Sci USA. 2007;104:12596–12602. doi: 10.1073/pnas.0610081104. [DOI] [PMC free article] [PubMed] [Google Scholar]
- 5.Joo C, Balci H, Ishitsuka Y, Buranachai C, Ha T. Advances in single-molecule fluorescence methods for molecular biology. Annu Rev Biochem. 2008;77:51–76. doi: 10.1146/annurev.biochem.77.070606.101543. [DOI] [PubMed] [Google Scholar]
- 6.Geerts H. Nanovid tracking: A new automatic method for the study of mobility in living cells based on colloidal gold and video microscopy. Biophys J. 1987;52:775–782. doi: 10.1016/S0006-3495(87)83271-X. [DOI] [PMC free article] [PubMed] [Google Scholar]
- 7.Sheetz MP, Turney S, Qian H, Elson EL. Nanometre-level analysis demonstrates that lipid flow does not drive membrane glycoprotein movements. Nature. 1989;340:284–288. doi: 10.1038/340284a0. [DOI] [PubMed] [Google Scholar]
- 8.Simons K, Ikonen E. Functional rafts in cell membranes. Nature. 1997;387:569–572. doi: 10.1038/42408. [DOI] [PubMed] [Google Scholar]
- 9.Brown DA, London E. Structure and function of sphingolipid- and cholesterolrich membrane rafts. J Biol Chem. 2000;275:17221–17224. doi: 10.1074/jbc.R000005200. [DOI] [PubMed] [Google Scholar]
- 10.Fielding CJ. Lipid Rafts and Caveolae. Weinheim, Germany: Wiley-VCH; 2006. [Google Scholar]
- 11.Jacobson K, Mouritsen OG, Anderson GW. Lipid rafts: At a crossroad between cell biology and physics. Nat Cell Biol. 2007;9:7–14. doi: 10.1038/ncb0107-7. [DOI] [PubMed] [Google Scholar]
- 12.Hanzal-Bayer MF, Hancock JF. Lipid rafts and membrane traffic. FEBS Lett. 2007;581:2098–2104. doi: 10.1016/j.febslet.2007.03.019. [DOI] [PubMed] [Google Scholar]
- 13.Munro S. Lipid rafts: Elusive or illusive? Cell. 2003;115:377–388. doi: 10.1016/s0092-8674(03)00882-1. [DOI] [PubMed] [Google Scholar]
- 14.Lommerse PHM, Spaink HP, Schmidt T. In vivo plasma membrane organization: Results of biophysical approaches. Biochim Biophys Acta. 2004;1664:119–131. doi: 10.1016/j.bbamem.2004.05.005. [DOI] [PubMed] [Google Scholar]
- 15.Hancock JF. Lipid rafts: Contentious only from simplistic standpoints. Nat Rev Mol Cell Bio. 2006;7:456–462. doi: 10.1038/nrm1925. [DOI] [PMC free article] [PubMed] [Google Scholar]
- 16.Shaw AS. Lipid rafts: Now you see them, now you don’t. Nat Immunol. 2006;7:1139–1142. doi: 10.1038/ni1405. [DOI] [PubMed] [Google Scholar]
- 17.Pike LJ. Rafts defined: A report on the Keystone symposium on lipid rafts and cell function. J Lipid Res. 2006;47:1597–1598. doi: 10.1194/jlr.E600002-JLR200. [DOI] [PubMed] [Google Scholar]
- 18.Schütz GJ, Kada G, Pastushenko VP, Schindler H. Properties of lipid microdomains in a muscle cell membrane visualized by single molecule microscopy. EMBO J. 2000;19:892–901. doi: 10.1093/emboj/19.5.892. [DOI] [PMC free article] [PubMed] [Google Scholar]
- 19.Fujiwara T, Ritchie K, Murakoshi H, Jacobson K, Kusumi A. Phospholipids undergo hop diffusion in compartmentalized cell membrane. J Cell Biol. 2002;157:1071–1081. doi: 10.1083/jcb.200202050. [DOI] [PMC free article] [PubMed] [Google Scholar]
- 20.Vrljic M, Nishimura SY, Moerner WE, McConnell HM. Cholesterol depletion suppresses the translational diffusion of class II major histocompatibility complex proteins in the plasma membrane. Biophys J. 2005;88:334–347. doi: 10.1529/biophysj.104.045989. [DOI] [PMC free article] [PubMed] [Google Scholar]
- 21.Hell SW, Wichmann J. Breaking the diffraction resolution limit by stimulated emission: Stimulated emission depletion microscopy. Opt Lett. 1994;19:780–782. doi: 10.1364/ol.19.000780. [DOI] [PubMed] [Google Scholar]
- 22.Klar TA, Jakobs S, Dyba M, Egner A, Hell SW. Fluorescence microscopy with diffraction resolution limit broken by stimulated emission. Proc Natl Acad Sci USA. 2000;97:8206–8210. doi: 10.1073/pnas.97.15.8206. [DOI] [PMC free article] [PubMed] [Google Scholar]
- 23.Eggeling C, et al. Direct observation of the nanoscale dynamics of membrane lipids in a living cell. Nature. 2009;457:1159–1163. doi: 10.1038/nature07596. [DOI] [PubMed] [Google Scholar]
- 24.Ringemann C, et al. Exploring single-molecule dynamics with fluorescence nanoscopy. New J Phys. 2009;11:103054. [Google Scholar]
- 25.Magde D, Elson E, Webb WW. Thermodynamic fluctuations in a reacting system—Measurement by fluorescence correlation spectroscopy. Phys Rev Lett. 1972;29:705–708. [Google Scholar]
- 26.Fahey PF, et al. Lateral diffusion in planar lipid bilayers. Science. 1977;195:305–306. doi: 10.1126/science.831279. [DOI] [PubMed] [Google Scholar]
- 27.Schwille P, Korlach J, Webb WW. Fluorescence correlation spectroscopy with single-molecule sensitivity on cell and model membranes. Cytometry. 1999;36:176–182. doi: 10.1002/(sici)1097-0320(19990701)36:3<176::aid-cyto5>3.0.co;2-f. [DOI] [PubMed] [Google Scholar]
- 28.Wawrezinieck L, Rigneault H, Marguet D, Lenne P-F. Fluorescence correlation spectroscopy: Diffusion laws to probe the submicron cell membrane organization. Biophys J. 2005;89:4029–4042. doi: 10.1529/biophysj.105.067959. [DOI] [PMC free article] [PubMed] [Google Scholar]
- 29.Hell SW. DE102006021317B3. German Patent No. 2006
- 30.Lessard GA, Goodwin PM, Werner JH. Three-dimensional tracking of fluorescent particles. Proc SPIE. 2006;6092:609205. (1-8) [Google Scholar]
- 31.Lessard GA, Goodwin PM, Werner JH. Three-dimensional tracking of individual quantum dots. Appl Phys Lett. 2007;91:224106. (1-3) [Google Scholar]
- 32.Wells NP, Lessard GA, Werner JH. Confocal, three-dimensional tracking of individual quantum dots in high-background environments. Anal Chem. 2008;80:9830–9834. doi: 10.1021/ac8021899. [DOI] [PMC free article] [PubMed] [Google Scholar]
- 33.Hellriegel C, Gratton E. Real-time multi-parameter spectroscopy and localization in three-dimensional single-particle tracking. J R Soc Interface. 2009;6:S3–S14. doi: 10.1098/rsif.2008.0313.focus. [DOI] [PMC free article] [PubMed] [Google Scholar]
- 34.McHale K, Berglund AJ, Mabuchi H. Quantum dot photon statistics measured by three-dimensional particle tracking. Nano Lett. 2007;7:3535–3539. doi: 10.1021/nl0723376. [DOI] [PubMed] [Google Scholar]
- 35.Thompson RE, Larson DR, Webb WW. Precise nanometer localization analysis for individual fluorescent probes. Biophys J. 2002;82:2775–2783. doi: 10.1016/S0006-3495(02)75618-X. [DOI] [PMC free article] [PubMed] [Google Scholar]
- 36.Schütz GJ, Schindler H, Schmidt Th. Single-molecule microscopy on model membranes reveals anomalous diffusion. Biophys J. 1997;73:1073–1080. doi: 10.1016/S0006-3495(97)78139-6. [DOI] [PMC free article] [PubMed] [Google Scholar]
- 37.Pinaud F, et al. Dynamic partitioning of a glycosyl-phosphatidylinositol-anchored protein in glycosphingolipid-rich microdomains imaged by single-quantum dot tracking. Traffic. 2009;10(6):691–712. doi: 10.1111/j.1600-0854.2009.00902.x. [DOI] [PMC free article] [PubMed] [Google Scholar]
- 38.Hell SW, Stelzer EHK. Properties of a 4Pi-confocal fluorescence microscope. J Opt Soc Am A. 1992;9:2159–2166. [Google Scholar]
- 39.Eggeling C, et al. Reversible photoswitching enables single-molecule fluorescence fluctuation spectroscopy at high molecular concentration. Microsc Res Techniq. 2007;70:1003–1009. doi: 10.1002/jemt.20505. [DOI] [PubMed] [Google Scholar]
- 40.Hess ST, et al. Dynamic clustered distribution of hemagglutinin resolved at 40 nm in living cell membranes discriminates between raft theories. Proc Natl Acad Sci USA. 2007;104:17370–17375. doi: 10.1073/pnas.0708066104. [DOI] [PMC free article] [PubMed] [Google Scholar]
- 41.Manley S, et al. High-density mapping of single-molecule trajectories with photoactivated localization microscopy. Nat Methods. 2008;5(2):155–157. doi: 10.1038/nmeth.1176. [DOI] [PubMed] [Google Scholar]
- 42.Lingwood D, Ries J, Schwille P, Simons K. Plasma membranes are poised for activation of raft phase coalescence at physiological temperature. Proc Natl Acad Sci USA. 2008;105:10005–10010. doi: 10.1073/pnas.0804374105. [DOI] [PMC free article] [PubMed] [Google Scholar]
- 43.Chiantia S, Ries J, Kahya N, Schwille P. Combined AFM and two-focus SFCS study of raft-exhibiting model membranes. ChemPhysChem. 2006;7:2409–2418. doi: 10.1002/cphc.200600464. [DOI] [PubMed] [Google Scholar]
Associated Data
This section collects any data citations, data availability statements, or supplementary materials included in this article.