

Abstract
Intracellular lipid droplets are associated with a myriad of afflictions including obesity, fatty liver disease, coronary artery disease, and infectious diseases (eg, HCV and tuberculosis). To develop high-content analysis (HCA) techniques to analyze lipid droplets and associated proteins, primary human preadipocytes were plated in 96-well dishes in the presence of rosiglitazone (rosi), a PPAR-© agonist that promotes adipogenesis. The cells were then labeled for nuclei, lipid droplets, and proteins such as perilipin, protein kinase C (PKC), and hormone-sensitive lipase (HSL). The cells were imaged via automated digital microscopy and algorithms were developed to quantify lipid droplet (Lipid Droplet algorithm) and protein expression and colocalization (Colocalization algorithm). The algorithms, which were incorporated into Vala Science Inc’s CyteSeer® image cytometry program, quantified the rosi-induced increases in lipid droplet number, size, and intensity, and the expression of perilipin with exceptional consistency (Z′ values of 0.54–0.71). Regarding colocalization with lipid droplets, Pearson’s correlation coefficients of 0.38 (highly colocalized), 0.16 (moderate), and −0.0010 (random) were found for perilipin, PKC, and HSL, respectively. For hepatocytes (AML12, HuH-7, and primary cells), the algorithms also quantified the stimulatory and inhibitory effect of oleic acid and triacsin C on lipid droplets (Z′s > 0.50) and ADFP expression/colocalization. Oleic acid-induced lipid droplets in HeLa cells and macrophages (THP-1) were also well quantified. The results suggest that HCA techniques can be utilized to quantify lipid droplets and associated proteins in many cell models relevant to a variety of diseases.
INTRODUCTION
Obesity in modern society has reached “pandemic” proportions and may be as high as 30% in the general US population.1–4 Alarmingly, there is a high incidence of obesity in children and adolescents5–7 indicating that obesity will be a significant health problem for the foreseeable future. In addition to reducing mobility, obesity is an underlying factor associated with a variety of life-threatening pathologies including diabetes, heart disease, and liver malfunction.
The cellular basis of obesity is increased triglyceride accumulation within adipocyte lipid droplets. Also, increased accumulation of lipid droplets within hepatocytes (steatosis) is the defining characteristic of both alcoholic and non-alcoholic fatty liver disease (NAFLD), conditions that can progress to cirrhosis and liver failure.8 , 9 Ominously, 20% to 35% of the general adult population in the United States may have NAFLD, and the incidence in obese individuals is ∼75%.10 NAFLD is closely associated with diabetes and the Metabolic Syndrome.8 , 11 , 12 Steatosis is also present in 50% of the patients infected with HCV13 and association of viral proteins with lipid droplets may be critical for viral replication.14 Lipid droplets are also prominent features of skeletal muscle cells,15 cardiac myocytes,16–18 and pancreatic β-cells.19 , 20 Lipid droplets within macrophages also play a critically important role in the etiology of coronary artery disease, as the accumulation of cholesterol esters within lipid droplets is a defining cellular event leading to production of “foam” cells and atherosclerotic plaques.21 , 22 Lipid droplets (lipid bodies) within macrophages are also implicated in the etiology of tuberculosis.23 , 24 Thus, in general, cells expressing an abnormally large number of lipid droplets are often impaired in function and associated with disease pathologies. An interesting exception is skeletal muscle, in which endurance exercise increases lipid droplet content.25 An emerging hypothesis is that lipid overload leads to “lipotoxicity” and this may underlie the broad manifestations of the Metabolic Syndrome.26–28 Development of novel tools to investigate lipid droplet and fatty acid metabolism is thus likely to be of interest to researchers in a variety of biomedical contexts.
Nascent lipid droplets form by the accumulation of neutral lipid within the membrane bilayer of the endoplasmic reticulum.29–31 In early stages of adipogenesis, lipid droplets nucleate at many loci throughout the cell, and, as the adipocytes mature, the lipid droplets coalesce, typically into one large centrally located droplet.32 Every step of lipid droplet formation and metabolism is regulated or influenced by proteins that associate with the lipid droplets. PAT proteins (named after the founding members of the family, which are perilipin, adipose differentiation-related protein (ADFP/adipophilin/perilipin2), and TIP47), are commonly associated with lipid droplets and orchestrate their formation and maturation.29–31 , 33 , 34 PAT proteins are expressed in a tissue-specific manner, with perilipin expression restricted to adipocytes and steroidogenic cells. ADFP is also expressed in liver, and is up-regulated in fatty liver disease.34–36
Fatty acids are released from lipid droplets via the action of lipases that include hormone-sensitive lipase (HSL) and the adipocyte triglyceride lipase (ATGL) family members.37–40 Perilipin may form a functional barrier to lipolysis, as lipolysis is increased in mice in which perilipin has been knocked out.41 Furthermore, perilipin is phosphorylated by cAMP-dependent protein kinase (PKA),42 and this is associated with translocation of perilipin from the lipid droplets to the cytoplasm in certain adipocyte model systems.43–45 Elevated cAMP, resulting from β-adrenergic stimulation, also leads to translocation of HSL from the cytoplasm to the lipid droplets in adipocytes.44 , 46 Perilipin may also help regulate lipolysis by ATGL.47 Thus, regulation of lipolysis is often associated with translocation of perilipin and lipases between the lipid droplet and cytoplasm.
The lipid droplet proteins discussed above likely represent just the “tip of the iceberg” regarding the proteins that associate with droplets and modulate triglyceride metabolism. Proteomic techniques have been used to enumerate the variety of lipid droplet-associated proteins in yeast,48 3T3-L1 cells,49 and 248 separate lipid droplet-associated proteins have been identified in Drosophila. 50 A similar approach has also been applied to mammalian hepatocytes.51 Lipid droplets likely represent “organizing centers” of the metabolic enzymes involved in triglyceride metabolism and are dynamically regulated in response to the energetic demands of the cells and organism. Given their emerging recognition of their importance, lipid droplets and associated proteins will undoubtedly be studied in ever-increasing detail for years to come.
High-content analysis (HCA) is an emerging technology in which candidate pharmaceuticals or genomic (RNAi or cDNA) libraries are tested for potential beneficial effects via assays performed on cells cultured on microtiter plates.52–65 The cells are then stained or labeled to visualize structures or proteins and photographed via robotic digital microscopy workstations. The images are analyzed for information by algorithms designed to identify and extract information relevant to the cell/disease model.66–69 Advances in automatic acquisition, measurement, comparison, and pattern classification tools for cellular images continue.69–77 The concept that digital images from both conventional and confocal microscopy can be analyzed by an evolving set of sophisticated image analysis algorithms is advancing, not only in the context of chemical and siRNA screening, but also in the context of modern quantitative approaches to microscopy-based cellular phenotypic characterization.78 , 79 Thousands of images representing hundreds of thousands of individual cells can be acquired via HCA workstations in a single experimental session. For example, a chemical library representing 109,000 compounds was recently screened for their ability to inhibit phagocytosis (PubChem BioAssay 1029). Of key importance are continued advances in quantitative image analysis algorithms that can extract the potential wealth of information contained within cell-based images relevant to understanding the disease state and identifying effective therapeutic compounds.
Lipid droplet metabolism represents an ideal subject for HCA, since, as discussed earlier, lipid droplets pervade an exceptional number of human pathologies. Furthermore, information relevant to disease states includes not only the number and size of the lipid droplets, but also the expression level and cellular location of proteins that associate with the lipid droplets. With the overall goal of developing HCA cytometry algorithms relevant to lipid droplet metabolism, the present study was conducted utilizing cell types that included primary human adipocytes, cells derived from hepatocytes (AML12 and HuH-7 cells), primary hepatocytes, HeLa, and differentiated macrophages (THP-1 cells). For the adipocytes, the phenomenon of PPAR-γ-induced adipogenesis was examined. For the hepatocytes, HeLa, and macrophages, lipid droplets were induced by addition of fatty acids to the culture media. The results demonstrate that quantitative image analysis techniques can be used to quantify lipid droplets and lipid droplet-associated proteins in a variety of cell contexts with great importance to human health.
MATERIALS AND METHODS
Cell Culture
Human preadipocytes were supplied from liposuction procedures by Zen-Bio (Research Triangle Park, NC). AML12, Hep G2, HeLa, and THP-1 cells were obtained from ATCC. HuH-7 cells were obtained from the Japan Health Sciences Foundation, Health Science Research Resources Bank. Primary rat hepatocytes were a generous gift of RegeneMed (San Diego, CA). Human preadipocytes were plated (13,000 cells/well, passage 2) on glass-bottomed 96-well dishes (Nunc) precoated with gelatin that was cross-linked with glutaraldehyde. To coat the dishes, wells were incubated with 1% porcine gelatin (Sigma G1890) for 15 min. Excess fluid was then aspirated, and 10 µL of a 0.5% glutaraldehyde solution was added to each well. Wells were then extensively rinsed (3×) with PBS, incubated with DMEM +10% FBS for 60 min, and rinsed 2× with phenol red-free culture medium (Gibco #31053-028). For AML12 (20,000 cells/well, passages 11–15), Hep G2, HuH-7 (20,000 cells/well, passage 50), HeLa (20,000/well), and THP-1 cells (20,000/well, passages 2–4), the wells were incubated with a 1/50 dilution of Matrigel, for 60 min, and rinsed 1× with PBS prior to plating.
Lipid Staining and Protein Labeling
Following exposure to test chemicals, cells were rinsed with PBS, and fixed with 4% paraformaldehyde (15 min, room temperature), followed by 15-min permeabilization with either 0.1% Triton-X (adipocytes) or 0.01% saponin (other cell types) plus 0.1% BSA prepared in PBS. Permeabilization and all other steps were performed with rotation at 37°C. After fixation, cells were incubated with Vala Science’s Lipid Staining reagent prepared in blocking buffer (10% normal goat serum, 3% bovine serum albumin, 0.02% sodium azide, in PBS) for 30 min to label neutral lipids in the green fluorescence channel. The samples were then rinsed 3 times with PBS, and stained for nuclei by incubating for 20 min in DAPI (250 ng/mL DAPI prepared in 10 mM Tris, 10 mM EDTA, 100 mM NaCl, 0.02% sodium azide, buffered to pH 7.4).
Vala Sciences Inc’s Perilipin and protein kinase C (PKC) reagent kits were used to label perilipin and PKC, which were visualized in the red fluorescent channel. For HSL, a chicken polyclonal was used (Chemicon, Ab3525), which was visualized with an Alexa594-goat anti-chicken (Molecular Probes, A11042). A goat polyclonal antibody obtained from Dr. Constantine Londos (NIH) was used to visualize ADFP in combination with a Cy3 donkey anti-goat antibody (Chemicon, AP180C).
Image Acquisition
Images were acquired with a Q3DM Eidaq 100 robotic microscopy instrument (equivalent to the Beckman Coulter IC100) running Beckman Coulter’s CytoShop 2.0. This instrument includes a Nikon Eclipse microscope with an automated stage interfaced to a fluorescence light source and filter wheel and cubes with filters for UV (DAPI), FITC, and rhodamine fluorescence. The workstation features a Windows computer, which controls stage positioning, and data acquisition. Images were acquired with a Hamamatsu Orca ERG progressive scan 1,344 × 1,024 cooled interline CCD camera, utilizing 2 × 2 binning. Typically, 4 images (representing a 2 × 2 contiguous image set) were acquired in the center of each well with either a 20× 0.5 NA (resulting in 0.6848 × 0.6848 µm2/pixel) or a 40× 0.75 NA “dry” objective (resulting in 0.344 × 0.344 µm2/pixel). Images were stored as gray-scale bit-mapped images (*.bmp).
Quantitative Triglyceride Assay
Triglyceride was measured using a total triglyceride assay kit (Zen-Bio, Inc.). Cultured cells were washed with buffer to remove residual medium and the cells lysed with lysis buffer. Accumulated triglyceride was digested with lipase for up to 3 h to release glycerol into the buffer. Aliquots were then removed and the amount of glycerol measured using Reagent A (Zen Bio, Inc.). The assay determines the amount of glycerol liberated from triglycerides by spectrophotometric detection at 540 nm and is linear over a glycerol concentration range of 0 to 200 µM.
Chemicals, Drugs, and Antibodies
DMEM was obtained from Media Tech Inc., and CellGro, respectively. Matrigel was from BD Biosciences (Cat. # 354234). Triacsin C was from Biomol (Cat # EI-218). Phorbol-12-myristate-13-acetate, used to induce differentiation of the THP-1 cells, was from Cal Biochem (catalog 524400).
Data Nomenclature
The nomenclature in CyteSeer® (Vala Sciences Inc, San Diego, CA) was developed to facilitate data reporting. During image acquisition, the same field of view was typically imaged in 3 separate optical channels, to selectively visualize the nuclei, lipid droplets, and protein; thus, the 3 images channels were abbreviated as the Ni, Li, and Pi, respectively (Table 1). From the nuclear image, the Nuclear Analysis algorithm identified the pixels associated with each nucleus, which defined the nuclear mask, Nm. Furthermore, from the size, position, and shape of the nuclei, the boundaries of each cell were estimated, to yield the whole cell mask, Wm. The cytoplasmic mask, Cm, was defined as Wm minus Nm. The lipid droplet mask, Lm, was defined all pixels associated with a cell identified as lipid droplets by the Lipid Droplet algorithm. Similarly, pixels identified as above threshold in the protein image by the Colocalization algorithm were defined as the protein mask, Pm. The area of each mask was reported on a “per cell” basis, as was the lipid droplet count (LDC). The mean diameter of the droplets (LDD) was estimated using a root mean square procedure.
Table 1. .
Definitions and Data Parameters From CyteSeer®’s Lipid Droplet and Colocalization Algorithms
| Image channels | Masks | Area and lipid droplets |
|---|---|---|
| Ni = Nuclear image (DAPI) | Nm = Nuclear | Ar Wm = Area Whole cell mask |
| Li = Lipid image | Wm = Whole cell | Ar Lm = Area Lipid mask |
| Pi = Protein image | Cm = Cytoplasm | Ar Pm = Area Protein mask |
| Lm = Lipid | LDC = Lipid Droplet Count | |
| Pm = Protein | LDD = Lipid Droplet Diameter |
| Pixel intensity | Colocalization |
| Tii = Total integrated pixel intensity Api = Average pixel intensity Mpi = Median pixel intensity |
 |
| Commonly used data parametersLi Lm = Total integrated pixel intensity, Lipid image, Lipid mask.
Li Lm = Average integrated pixel intensity, Lipid image, Lipid mask. Li Lm = Median pixel intensity, Lipid image, Lipid mask. r Li Pi Wm = Pearson’s correlation, Lipid image, Protein image, Whole cell mask. 1 Li Pi Wm = Manders’ M1, Lipid image, Protein image, Whole cell mask. 2 Li Pi Wm = Manders’ M2, Lipid image, Protein image, Whole cell . | |
Image channels and masks are abbreviated with 2 characters, where first letter refers to the cell structure being considered and the second letter (lower case) designates image (i) or mask (m), respectively; thus “Ni” is the nuclear image, whereas “Nm” is the nuclear mask. Area data (Ar) has units of µm2/cell. Lipid droplet count (LDC) is the number of lipid droplets per cell. Average and median pixel intensity (Api and Mpi) values ranged from 0 to 255, as the images in this study were 8-bit depth. Total integrated intensity is the sum of intensities for all pixels in the designated image and mask. For colocalization, Li and Laver refer to the individual and average pixel intensities of the lipid image whereas Li,coloc is the pixel intensity within the lipid image for pixels that are also above threshold in the protein image. Similarly, Pi and Paver refer to the individual, and average pixel intensities of the protein image and Pi,coloc is pixel intensity within the protein image for pixels that are also above threshold in the lipid image. Pearson’s correlation (Pr) and the Manders’ colocalization coefficients (M1 and M2) are dimensionless. Pr ranges from −1.0 (perfect exclusion) to 1.0 (perfect colocalization) with a value of 0 indicating a random distribution between the 2 labels; M1 and M2 range from 0 to 1.0.
For a given image and mask, three separate intensity parameters were reported, which included the total integrated pixel intensity (Tii), the average pixel intensity (Api), and the median pixel intensity (Mpi). Colocalization data was also reported between the lipid and protein images, corresponding to the Pearson’s correlation (Pr), and the Manders’ colocalization coefficients M1 and M2.80 Additional colocalization coefficients, corresponding to the Manders’ Overlap and Split Overlap coefficients, were also encoded in the Colocalization algorithm, but were not used in the present report. To represent the data parameters, the pixel intensity (or colocalization coefficient) is listed first followed by the image then mask. Thus, Tii Li Lm is the total integrated pixel intensity for the lipid image and lipid mask, and “Pr Li Pi Wm” is the Pearson’s correlation, lipid image, protein image, whole cell mask. In all, 62 different data parameters were reported for each cell by CyteSeer®’s Lipid Droplet algorithm; the Colocalization algorithm reported an additional 15 parameters relating to the protein channel and colocalization between the lipid and protein. Reports were created as *.csv files that were uploaded into Excel for analysis and included cell by cell readouts, in which data parameters were reported for every cell in a well, and well-by-well readouts, which represented the data averaged across all cells imaged in a well (see Table 2).
Table 2. .
Example Data Reports Generated by CyteSeer®
|
Cell by cell readout | |||||||
|---|---|---|---|---|---|---|---|
| Well | Cell ID | LDC | Area Lm | Ratio (Lm/Wm) | Tii Li Lm | Api Li Lm | Mpi Li Lm |
| A1 | 1 | 2 | 22 | 0.0168 | 1093 | 49.7 | 46 |
| A1 | 2 | 1 | 6 | 0.0036 | 207 | 34.5 | 35 |
| A1 | 3 | 0 | 0 | 0.0000 | 0 | 0.0 | 0 |
| A1 | 4 | 0 | 0 | 0.0000 | 0 | 0.0 | 0 |
| A1 | 5 | 1 | 14 | 0.0086 | 489 | 34.9 | 35 |
| A1 | 6 | 0 | 3 | 0.0012 | 70 | 23.3 | 22 |
|
·
· · | |||||||
| Well by well readout (mean values) | |||||||
|---|---|---|---|---|---|---|---|
| Well | NOC | LDC | Area Lm | Ratio (Lm/Wm) | Tii Li Lm | Api Li Lm | Mpi Li Lm |
| A1 | 914 | 1.12 | 12.5 | 0.010 | 530 | 32.0 | 31.2 |
| A2 | 842 | 4.62 | 304.1 | 0.221 | 15005 | 48.4 | 45.8 |
| A3 | 848 | 4.43 | 296.1 | 0.212 | 14322 | 47.4 | 44.8 |
| A4 | 958 | 4.32 | 263.2 | 0.209 | 13520 | 50.4 | 47.4 |
| A5 | 991 | 4.23 | 261.0 | 0.213 | 13277 | 50.0 | 47.1 |
| A6 | 1005 | 3.96 | 237.6 | 0.193 | 11478 | 47.6 | 45.1 |
|
·
· · | |||||||
Cell-by-cell readout: LDC, Area Lm, the Ratio of Area Lm/Area Wm, Tii Li Lm, Api Li Lm, and Mpi Li and Lm are reported for an experiment with AML12 cells. Data are shown for the first 6 cells from well A1 out of a total of 914 cells that were imaged and analyzed for this well. Area Lm is in pixel units. Well-by-well readout: The number of cells (NOC) analyzed per well is shown, along with the mean values of the data parameters (averaged across all cells that were imaged in the well) for the first 6 wells in this experiment (out of a total of 96 wells). Additional population statistics can also be reported for each data parameter including medians and standard deviations. A1 is a control well, A2 received oleic acid that stimulates lipid droplet formation. Wells A3–A6 received oleic acid plus increasing amounts of triacsin C, an inhibitor of lipid droplet formation (see Fig. 7 for summary data).
Statistical Analysis
To quantitatively assess the suitability of the various assays for subsequent use in HCA screening applications, Z′ values were calculated. Z′ is an index of the dynamic range of an assay, which is a function of the ratio of the sum of variabilities of the maximum and minimum control values and the difference between their means,81
![]()
where σ+ and σ− are the standard deviations (SDs) of the positive and negative controls, respectively, and µ+ and µ− are the corresponding means, respectively. Z′ has a theoretic range of negative infinity to 1.0 (an ideal assay in which there is no standard deviation and finite separation between means would yield Z′ = 1.0). Z′ values >0.2 are considered very good for an assay, and Z′ are conceptually much more stringent than P < 0.05 determination from a t-test (Z′ can be negative, yet P could be <0.05). Assays in which Z′ > 0.50 are considered excellent for high-throughput screening applications involving thousands to hundreds of thousands of test compounds, as there is very little chance that false positive hits will arise from random variation in the data.
Statistical tests used to test for differences between experimental groups included ANOVA, followed by the post hoc tests Dunnett’s test or Newman Keuls, and were performed with GraphPad Prism version 5.02. EC50 and IC50 determinations were performed using the least-squares curve fitting, log agonist vs. responses (3 parameters) option of GraphPad.
CyteSeer®’s Algorithms
The Lipid Droplet algorithm in Vala Science’s CyteSeer® Image analysis platform program uses the nuclear and lipid images to quantify the lipid droplets associated with each cell in the field of view. The algorithm was first developed with images obtained from human subcutaneous preadipocytes exposed to different doses of rosiglitazone (rosi), an anti-diabetic PPAR-γ agonist that strongly induces lipid droplet formation in this cell type, which were very well visualized by fluorescence microscopy (Fig. 1A and 1B). The prototype algorithm was developed in Matlab (Mathworks). Images were convolved with the 7 × 7 “Mexican top hat” filter82 to enhance contrast, and further intensity thresholded into binary masks of the lipid droplets (Fig. 1C and 1D). Matlab functions were used to calculate the area, the number, equivalent circle radius, the average intensity, and the standard deviation of the intensity of each lipid droplet. To validate results from the Lipid Droplet algorithm, samples cultured in an identical fashion were assayed for total triglycerides. Rosiglitazone was found to increase triglyceride production (as assayed biochemically) and lipid droplets (as assayed with the Lipid Droplet algorithm) with very similar dose–response relationships (Fig. 1E and 1F). Rosiglitazone also increased lipid droplet size and lipid staining intensity with a similar dose–response relationship (data not shown). Thus, the Lipid Droplet algorithm was ported into Java and incorporated into Vala Science’s CyteSeer® Image analysis platform program.
Fig. 1. .
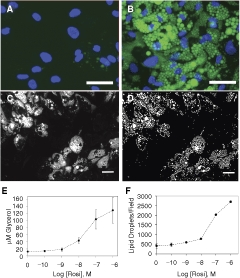
Development of the Lipid Droplet algorithm. Human primary preadipocytes were cultured in 96-well dishes in the absence or presence of 1 µM rosiglitazone for 14 days; the cells were then fixed, permeabilized, and labeled for nuclei and lipid droplets using Vala’s Lipid Droplet reagent kit, then imaged using a Beckman IC100 Image Cytometer outfitted with a 40× objective. (A) Control cells cultured in the absence of rosiglitazone; nuclei are blue and lipid droplets are green. (B) Cells exposed to 1 µM rosiglitazone. (C) Gray-scale image of the lipid droplet image obtained from rosi-treated cells. (D) A binary mask is shown, derived from C, in which the individual lipid droplets are identified. (E) The effect of rosi on triglycerol content is shown (each symbol is the mean ± SD, n = 8 wells). (F) The effect of rosi on lipid droplets/field of view is shown, as quantified by the Lipid Droplet algorithm (each symbol is the mean ± range, n = 2 wells). Scale bars are 50 µm.
Proteins that associate with lipid droplets are of high interest to the biomedical community as they control triglyceride metabolism and related processes. Thus, a related algorithm was developed (the Colocalization algorithm) to quantify the expression level of a protein visualized in a third channel, along with the degree to which the protein colocalizes with the lipid droplets. To generate cell samples for prototyping purposes, human preadipocytes were exposed for 19 days to a proprietary PPAR-γ agonist from Zen-Bio to induce lipid droplet formation, then fixed, and stained, as above, utilizing the Vala Lipid Staining reagent. The cells were then labeled for perilipin, which was found closely associated with the majority of the lipid droplets in cells treated with the PPAR-γ agonist.
CyteSeer® is Vala’s successor to Thora™, both of which perform true cell-by-cell cytometry.70 , 83 CyteSeer® incorporates a userfriendly GUI, cross-platform compatibility (PC, Macintosh, and Linux operating systems), improved data storage, and the Lipid Droplet and Colocalization algorithms.84 CyteSeer®’s novel image viewer (free via download from Vala’s Web site) displays images in user-selectable colors, as well as zoom and contrast controls. User-controlled sensitivity settings enable adjustment of the images segmentation algorithms to enable “fine-tuning” for differences between brightness, contrast, and signal-to-noise levels between various sets of images. An example field of view obtained from human preadipocytes exposed to a proprietary PPAR-γ agonist, is shown in Fig. 2. The Lipid Droplet algorithm produced a mask that identified the lipid droplets with good fidelity (compare Fig. 2A and 2B). Small outlying spots in the lipid mask typically represent small dim droplets in the original images. The perilipin label is very closely identified with the outer edges of the lipid droplets (Fig. 2C), and was well identified by the Colocalization algorithm (Fig. 2D). The protein mask, determined from the perilipin image, often coincides with entire lipid droplets, rather than just the edges of the droplets, which may be somewhat contrary to expectation. However, for the perilipin images, the pixel intensity values within the center of the lipid droplets are often significantly higher than the overall background of the images, leading to assignment of these pixels to the protein mask. The Lipid Droplet algorithm estimates the likely center point of each lipid droplet as the “Seed Mask” (Fig. 2E); typically, each droplet identified by visual inspection of the image was also represented by a single point.
Fig. 2. .
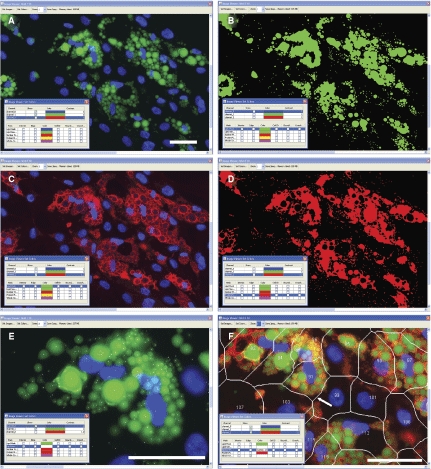
Incorporation of the Lipid Droplet, Perilipin, and Membrane Tessellation algorithms into CyteSeer®. Human preadipocytes were exposed to 1 µM of a proprietary PPAR-γ agonist (Zen-Bio) for 19 days, then stained for nuclei, lipid, and perilipin, and imaged with a 40× objective. (A) A representative field of view is shown, featuring the lipid (green) and nuclear (blue) image channels. (B) The Lipid Mask (green) derived by the Lipid Droplet algorithm encoded within CyteSeer® is shown. (C) The perilipin image is shown (red). (D) The Protein Mask derived by the Colocalization algorithm is shown. (E) The lipid and nuclear images are shown at a higher magnification, and the lipid droplet “seed mask” is overlaid (white spots). (F) The lipid, nuclear, and perilipin images are shown along with the cell boundary mask and cell identification numbers; the white arrow identifies a boundary between a cell that features extensive lipid droplets (Cell #91) versus a cell with few droplets (Cell #99). All panels were derived from the same field of view and represent screenshots from CyteSeer®’s Image Viewer. The scale bar is 50 µm.
To enable cell-by-cell analyses, and to estimate the boundaries between the cells, a variation of Vala’s proprietary Membrane algorithm84 tessellates cell border estimates and enables measurements of cell position, size, and pseudo-cell boundaries between the nuclear images. Since lipid droplets in adipocytes are typically closely associated with the nucleus, the tessellation-based algorithm performs reasonably well at assigning lipid droplets to the correct cell (Fig. 2F), as judged by visual inspection. Thus, by using the Lipid Droplet, Colocalization, and the Membrane Tessellation algorithms, CyteSeer® quantifies lipid droplets and perilipin expression on a true cell-by-cell basis.
Human preadipocytes, especially those that have just begun the adipogenesis program, often feature small lipid droplets that label much more dimly than the larger lipid droplets typically found in more mature cells. Such lipid droplets are readily identified by CyteSeer® and can be viewed by increasing the “contrast” adjustment of the Image Viewer (Fig. 3). The sensitivity of CyteSeer®’s algorithms can be adjusted for optimal quantification of images obtained under different conditions of labeling intensity and magnification.
Fig. 3. .
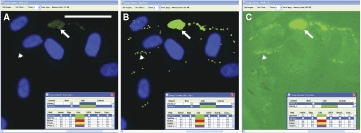
Sensitivity of the Lipid Droplet algorithm. Human preadipocytes were exposed to 0.33 nM rosiglitazone for 9 days, then labeled for nuclei and lipid droplets and imaged using a 40× objective. (A) A field of view is shown in which the brightness of the image is shown at default levels (contrast = 1 in CyteSeer®’s Image Viewer). (B) The same field of view is shown visualized for nuclei and the lipid droplet mask. (C) The same field of view is shown visualized for lipid droplets at contrast = 6 (pixel intensities multiplied by 6-fold and clipped at 255 for the 8-bit image). The arrow denotes a cluster of relatively bright lipid droplets, whereas the arrowhead denotes an example of lipid droplets, identified by CyteSeer®, which are only visible in C. The scale bar is 50 µm.
RESULTS
Quantification of Lipid Droplets in Human Adipocytes in an Automated Fashion by CyteSeer®
To test the hypothesis that CyteSeer® could quantify lipid droplets within adipocytes on a cell-by-cell basis under conditions appropriate for high-throughput screening, human subcutaneous preadipocytes were plated on a 96-well dish and exposed to rosi at concentrations ranging from 0 to 3,000 nM for 9 days; the cells were then fixed, permeabilized, and labeled for nuclei and lipid droplets using Vala reagents, and imaged with a Beckman IC100 Image Cytometer. Note that the 9-day exposure period represents a relatively short-time period for exposure to rosiglitazone, as 14 to 21 days of exposure are required for full maturation of the adipocyte phenotype. The shorter time point was chosen because the Lipid Droplet algorithm accurately identifies small lipid droplets that arise early during the adipogenesis program (see above). Also, since cells in outer wells of 96-well plates tend to behave inconsistently, perhaps due to differential evaporative or other “edge effects” (unpublished observations), cells in the outer wells were not treated with rosi, and were not considered for analysis.
In the absence of rosi, 26.1% of the preadipocytes developed lipid droplets (Fig. 4A). The percentage of cells expressing lipid droplets increased as a function of rosi concentration reached a maximum of 72.9% (∼3-fold of control) in the presence of 1,000 nM rosi, and the EC50 for this effect was 55.9 nM. Many other data parameters derived from the lipid image also increased in a similar manner, including LDC (which increased from ∼1/cell to 4/cell), the LDD (which increased from 2 to 9 µm), and Api Li Lm (which increased from 22 to 91 pixel intensity units) (Fig. 4B–4D). Ar Pm, the area of the Protein mask (in this case for perilipin), also increased with a similar dose–response and fold stimulation (increased 4-fold by 1,000 nM rosi, Fig. 4E). For all of these data parameters, Z′ values were ≥0.54 as calculated between the cells exposed to 0 vs. 1,000 nM rosi. These Z′ values are exceptionally high, especially for cell-based assays, and indicate that the methodology is suitable for high-throughput screening. Furthermore, since such high Z′ values can only be achieved when there is relatively little variability between the control and maximally stimulated samples, the assay proved to be exceptionally sensitive to effects of low concentrations of rosi. For example, a statistically significant increase (P < 0.05 vs. 0 rosi) in LDC was achieved with rosi = 1 nM (1 × 10⁻⁹ M, Fig. 4B) and 10 nM rosi led to statistically significant increases in the percentage of cells with lipid droplets (Fig. 4A), LDD (Fig. 4C), and Ar Pm (Fig. 4E). Lipid droplets obtained with 3,000 nM rosi were reduced compared to the values obtained with 1,000 nM rosi, suggesting that there may be a toxic effect associated with the higher concentration.
Fig. 4. .
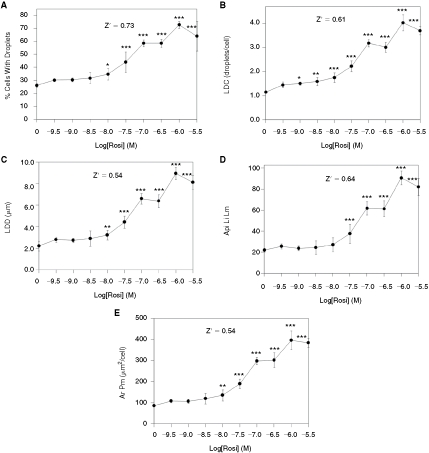
Quantification of lipid droplets and perilipin in primary human preadipocytes exposed to rosi. Cells were exposed to rosi for 9 days, then fixed, stained for lipid droplets, labeled for perilipin, and imaged with a 10× objective (8 images/well were obtained, corresponding to ∼2,000 cells/well). (A) The effect of rosi on the percentage of cells that expressed lipid droplets. (B) The average number of lipid droplets per cell (lipid droplet count). (C) The average lipid droplet diameter. (D) The average pixel intensity of the lipid image for the lipid droplet mask. (E) The average area of the protein mask (which corresponds to the perilipin mask in this experiment). Each bar is the mean ± SD for n = 6 wells. Z′ values were calculated between the sample groups corresponding to 0 vs. 1 µM (10−6 M) rosi. Asterisks (*, **, or ***) represent P < 0.05, P < 0.01, or P < 0.001, respectively, vs. the controls (ANOVA followed by Dunnett’s test).
Colocalization Analysis of Lipid Droplets and Proteins
A goal of the project was to develop the methodology to quantify colocalization between lipid droplets and proteins as this is of high interest in the lipid droplet field; additionally, quantifying subcellular locations of cellular structures or proteins is a potential strength of the HCA approach and very relevant to control of lipid metabolism. To test this approach, preadipocytes exposed to the proprietary PPAR-γ agonist for 14 days were visualized for lipid droplets and for proteins that varied in the degree to which they associate with lipid droplets, which included HSL, PKCα, or perilipin.
Unlike perilipin, HSL labeling did not colocalize with the droplets under the conditions used in this study; instead, HSL label was distributed throughout the cellular compartments, in a finely granular manner (Fig. 5A–5C). Consistent with the nature of the distribution of the HSL label, the Pr values calculated between the lipid and the HSL images were near zero, or slightly negative (see Fig. 5 for representative images and Table 3 for data). The results imply that the HSL label is randomly distributed with respect to the lipid stain. It has been established that β-adrenergic stimulation elicits migration of HSL to the lipid droplets in certain adipocyte model systems,46 and developing techniques to quantify this translocation is in progress (unpublished results). For the present study, the images representing HSL provide examples in which the labeling pattern is not associated with the lipid droplets, in contrast to the strong lipid droplet-associated labeling pattern obtained with perilipin.
Fig. 5. .
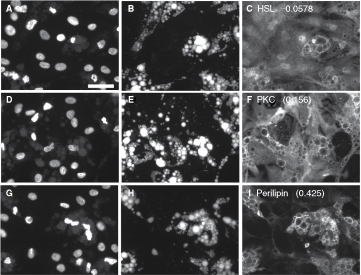
Quantification of protein–lipid droplet colocalization in human adipocytes. Human preadipocytes, plated in a 96-well dish, were exposed to 1,000 nM of a proprietary PPAR-γ agonist for 19 days, then fixed and stained for nuclei, lipid droplets, and certain proteins that vary in their association with lipid droplets. A, B, and C represent the same field of view imaged for nuclei, lipid, and hormone-sensitive lipase (HSL), respectively. D, E, and F represent cells visualized for nuclei, lipid, and PKC. G, H, and I represent cells visualized for nuclei, lipid, and perilipin. Pr Li Pi Wm averaged across all cells in the well are shown in C, F, and I (73 to 252 cells analyzed per well). Scale bar = 50 µm applies to all images (40×).
Table 3. .
Pr Li Pi Wm for Human Adipocytes as Quantified by CyteSeer®
|
Exp. 1 | ||||
|---|---|---|---|---|
| PPAR© agonist (µM) | ||||
| Protein | 0.1 | 1 | 10 | Mean ± SD |
| HSL | 0.0978 | −0.0578 | −0.0431 | −0.00103 ± 0.0859* (n = 3) |
| PKC | 0.156 | 0.156 | 0.167 | 0.160 ± 0.00635* (n = 3) |
| Perilipin | 0.368 | 0.425 | 0.429 | 0.377 ± 0.0483* (n = 5) |
| 0.322 | 0.342 | |||
|
Exp. 2 | |
|---|---|
| Rosi (1 µM) | |
| Perilipin | 0.480 ± 0.0691 (n = 5) |
| HCS CellMask™ | 0.186 ± 0.0437** (n = 5) |
For Exp. 1, each data point represents a single well (73–252 cells/well). Since the Pr Li Pi Wm values for each protein were relatively constant across all agonist concentrations, the data points obtained for each well were averaged for comparison (final column). *P < 0.05 vs. all other groups in Exp. 1 (ANOVA followed by Newman Keuls post hoc analysis). For Exp. 2, cells were exposed to 1 µM rosi for 17 days, then fixed and stained for lipids and labeled for either perilipin or HCS CellMask™; data points are the average ± SD for n = 5 wells/condition (150–234 cells/well). **P < 0.01, vs. perilipin (Student’s t-test).
Interestingly, the images of PKC distribution somewhat resemble the images of HSL, in that PKC is distributed throughout the cell; however, close examination reveals that the brightest labeling for PKC often occurred at the edges of the lipid droplets (Fig. 5D –5F); Pr Li Pi Wm values of 0.156 to 0.167 were found (Fig. 5F and Table 3), suggesting a mild association of PKC with the lipid droplets.
As is widely known and shown earlier, perilipin is closely associated with lipid droplets and scarcely detectable at other cellular locations; the Pr Li Pi Wm ranged from 0.322 to 0.429 for perilipin for this experiment, which were the highest values obtained for the experiment. This indicates partial colocalization of perilipin with the lipid label. A partial, rather than perfect, colocalization is expected since perilipin is localized on the edges of the droplets, but not within the center of the droplets where the lipid staining is the brightest. Thus, within the context of the entire cell, perilipin is colocalized with the lipid droplets; however, within the context of individual lipid droplets, perilipin expression is brightest near the edges of the droplets, where the lipid stain is faintest. Pr Li Pi Wm for perilipin did not appreciably change with the dose of rosi; thus, perilipin was always associated with lipid droplets, even under conditions in which perilipin and lipid droplet expression was low. This is consistent with the hypothesis that lipid droplets help stabilize perilipin, protecting it from degradation.85
Since the Pr Li Pi Wm values in this experiment were consistent for each dose of rosi, the values obtained for each protein obtained at the different concentrations of rosi were averaged, and then analyzed for statistically significant differences versus the other proteins. The average Pr Li Pi Wm values obtained for each protein differed from one another at P < 0.05 (Table 3, Exp. 1, final column).
In a related experiment, adipocytes treated with rosi (1,000 nM) were stained for lipid droplets and labeled for perilipin or stained for HCS CellMask™, a compound that is visualized in all cellular compartments. In this experiment (Table 3, Exp. 2), the Pr Li Pi Wm values for perilipin averaged 0.480. In contrast, HCS CellMask™, which was distributed throughout the cell, including the nucleus yielded an average Pr Li Pi Wm value of 0.186, and the results for HCS CellMask™ were significantly different from the perilipin values. Overall, these data demonstrate that Pr can be used to quantify the association of proteins with the lipid droplets, and this can be done in an automated fashion as part of an HCA procedure.
Quantification of Lipid Droplets in Hepatocytes
The image and data analysis strategies discussed earlier were developed to quantify lipid droplets and associated proteins that appear in adipocytes during the adipogenesis process. Hepatocytes also feature small lipid droplets, and such lipid droplets are the causative factor in fatty liver disease and may participate in the pathological responses elicited by HCV. To test if the Lipid Droplet and Colocalization algorithms can quantify lipid droplets and associated proteins in hepatocytes, experiments were carried out with AML12 cells, a murine hepatocyte-derived cell line, and also with HuH-7 and HepG2 cells, which are derived from human hepatocytes. A small pilot experiment was also carried out with primary rat hepatocytes. In these experiments the cells were incubated in the absence or presence of oleic acid, and stained for lipid droplets as well as for ADFP, a protein that is prevalent in hepatocytes that is known to associate with lipid droplets.
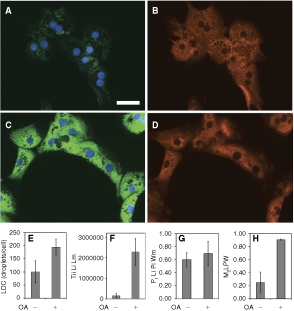
Control AML12 cells, maintained in the absence of oleic acid, expressed relatively few lipid droplets (Fig. 6A) but did feature significant ADFP labeling as an overall diffuse cytoplasmic label that also included numerous punctate structures (Fig. 6B); the punctual regions of ADFP label often correlated with lipid droplets, but much of the ADFP label did not obviously coincide with lipid staining. When images from control cells were analyzed and the masks developed for the lipid droplets and ADFP are compared, certain lipid droplets were co-labeled (as yellow regions in Fig. 6C), but much of the ADFP label was independent of the labeled lipid droplets. For oleic acid-treated AML12 cells, lipid droplets were abundant and distributed throughout the cell (Fig. 6D). Also, the ADFP label was brighter than for control cells, and the ADFP label was closely associated with the lipid droplets (Fig. 6D and 6E). Masks developed for the lipid droplets and ADFP for oleic acid-treated AML12 showed extensive overlap (yellow regions Fig. 6F). Cells exposed to oleic acid plus a maximally effective concentration of triacsin C (5.4 µM), an inhibitor of acyl-CoA synthetase, exhibited a phenotype much like cells cultured in the absence of oleic acid (Fig. 6G–6I). The inhibitory effect of triacsin C on lipid droplet formation is consistent with the likely role of acyl-CoA synthetase in lipid droplet formation.
Fig. 6. .

Effects of oleic acid (OA) and triacsin C (TC) on lipid droplet and ADFP expression in AML12 cells. Cells were cultured in a 96-well plate, then incubated with control media, 200 µM OA, or OA plus 5.4 µM TC, overnight. Cells were fixed, stained for lipid droplets, labeled for ADFP, then imaged (40×), and analyzed in an automated fashion. (A) Control cells are shown, visualized for lipid droplets (green). (B) The same field of view as A, visualized for ADFP (red). (C) The Lipid droplet (green) and Protein masks (red) calculated by CyteSeer® for A and B are shown along with the nuclei (blue). Images D, E, and F are from a field of view representing cells exposed to OA. G, H, and I are for cells exposed to OA plus 5.4 µM TC. Images A, D, and G were optimized for brightness and contrast in an identical manner, so that faint lipid droplets within A and G could be more easily seen; images B, E, and H were also optimized identically, to increase visualization of ADFP in B and H. In the original images for D and E, pixel intensities were not saturated. Scale bar in A is 50 µm, and applies to all panels.
As quantified by the Lipid Droplet algorithm for AML12 cells visualized with a 20× objective, control cells featured an average 1.1 lipid droplets per cell and oleic acid elicited a ∼4-fold increase in the number of lipid droplets (Fig. 7A). Oleic acid also elicited a 21.6-fold increase in the area of the lipid droplet mask/cell (Fig. 7B), a 21.0-fold increase in the ratio of the area of lipid mask to the whole cell area (Fig. 7C), and a 25.7-fold increase in the total integrated intensity of the lipid mask/cell (Fig. 7D), which represented the greatest fold-response among the data parameters. Data from this multi-comparison experiment were analyzed statistically via ANOVA followed by Newman Keuls post hoc analysis, which compares each condition in the experiment to every other condition in a pairwise manner. For all data parameters, the effect of oleic acid was highly statistically significant (P < 0.001) versus the control cells (no oleic acid). Triacsin C inhibited the effect of oleic acid with an IC50 of ∼1 µM (the IC50 values for the data parameters Ar Lm, Ar Lm/Ar Wm, and Tii Li Lm were 1.15, 1.00, and 0.86 µM, respectively), and statistically significant inhibitory effects (P < 0.05, compared to oleic acid, alone) of triacsin C versus oleic acid were found for doses as low as 0.08 µM (for the data parameter Ar Lm/Ar Wm, Fig. 7C).
Fig. 7. .
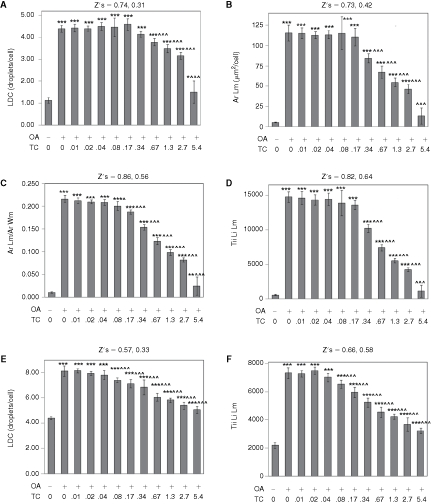
Quantification of oleic acid-induced lipid droplets in AML12 (A–D) and HuH-7 cells (E and F). Cells were treated overnight with 200 µM oleic acid (OA) and triacsin C (TC, µM), as indicated. (A) Lipid droplet count/cell (LDC) for AML12 cells. (B) Average area of the Lipid droplet mask. (C) Average area of the lipid droplet mask normalized to the average area of the whole cell mask. (D) Total integrated intensity of the lipid image over the lipid droplet mask. (E) Lipid droplet count (LDC) for HuH-7 cells. (F) Total integrated intensity of the lipid image over the lipid droplet mask for HuH-7 cells. For A to E, cells were imaged with a 20× objective, and 4 images were analyzed per well (representing 632 to 1,033 cells/well). For F, cells were imaged with a 10× objective, and 8 images were collected and analyzed per well (7,340–9,594 cells per well). For all panels, each bar represents the mean ± SD for n = 8 wells. The first Z′ is for the effect of OA (calculated between first and second columns); the second Z′ is for the effect of 5.4 µM TC in the presence of OA (calculated between the second and final columns). Asterisks (*, **, or ***) represent P < 0.05, P < 0.01, or P < 0.001, respectively, vs. the control wells (first column), ANOVA followed by Newman Keuls post hoc analysis. Carets (^, ^^, or ^^^) represent P < 0.05, P < 0.01, or P < 0.001, respectively, vs. wells treated with OA only (second column).
The data for the AML12 cells was exceptionally consistent. Z′ values of 0.74, 0.72, 0.86, and 0.82 were obtained, respectively, for LDC, Ar Lm, Ar Lm/Ar Wm, and Tii Li Lm for the effect of oleic acid for the data depicted in Fig. 7. The inhibitory effect of triacsin C on oleic acid-induced lipid droplet formation was also quantified with very low variability, especially for the Tii Li Lm parameter, yielding a Z′ value of 0.64 (Fig. 7D). These data demonstrate that AML12 cells will likely be very useful for screens conducted to identify compounds that either stimulate lipid droplet formation, when added alone, or antagonize oleic acid-induced lipid droplet formation, if added in the presence of oleic acid. Thus, the cell line appears ideal for identifying chemical probes for the lipid droplet formation pathway, and identifying chemicals that may antagonize hepatic lipid droplet formation, which might be relevant to fatty liver disease.
Lipid droplets in the HuH-7 human hepatocyte cell line were also very well visualized (data not shown), and these were quantified with good consistency by CyteSeer®. HuH-7 cells cultured in the absence of oleic acid featured an average of 4 lipid droplets/cell, and lipid droplet count was increased ∼2-fold by oleic acid (Fig. 7E). Thus, HuH-7 cells feature a greater number of lipid droplets/cell than AML12 cells under basal conditions. Oleic acid elicited a 3.3-fold increase in Tii Li Lm for HuH-7 cells (Fig. 7F). The effect of oleic acid was highly significant on all data parameters (P < 0.001). Triacsin C inhibited the effect of oleic acid on LDC and Tii Li Lm with an IC50s of 0.42 and 0.33 µM and the inhibitory effect of 0.08 µM triacsin C in the presence of oleic acid was highly significant (P < 0.001) for both data parameters. Excellent Z′ values were obtained for both the effect of oleic acid (0.66) and the effect of triacsin C in the presence of oleic acid (Z′ = 0.58, Fig. 7F). Thus, HuH-7 cells are also a likely candidate for high-throughput screens designed to identify chemical probes for the lipid droplet pathway, or to identify potential inhibitors of hepatic lipid droplet formation.
Colocalization Analysis of Lipid Droplets and ADFP in Hepatocytes
To quantify the colocalization of lipid droplets with ADFP, the plate from the previous experiment with AML12 cells was imaged with a 40× objective and the images analyzed by CyteSeer®’s Colocalization algorithm. To simplify the data presentation, the results are shown only for the control cells and for the cells treated with oleic acid, alone (Fig. 8). Since additional sample groups were present in the complete data set (eg, samples representing wells exposed to oleic acid plus lower doses of triacsin C), the data set from images scanned at 40× was statistically analyzed with Dunnett’s multiple comparison’s procedure that can be used to compare the control groups with selected experimental groups in multiple comparison experiments. For the images obtained at 40×, an average of 3.4 lipid droplets/cell were observed for the control cells, and this was increased 4.4-fold by oleic acid (Fig. 8A). The greater number of lipid droplets/cell versus the data depicted in Fig. 7 is likely due to the use of a higher powered objective (40×) for image acquisition in this scan (a 20× objective was used previously).
Fig. 8. .
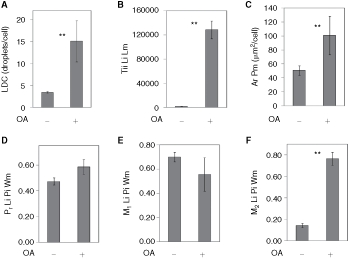
Analysis of lipid droplets and ADFP colocalization in AML12 cells. AML12 cells were cultured in the absence or presence of oleic acid (OA, 200 µM), processed as in Fig. 7, and imaged with a 40× objective. (A) Lipid droplet count (LDC). (B) Total integrated intensity of the lipid image for the lipid mask. (C) Area of the protein mask (ADFP in this experiment). (D) Pearson’s correlation coefficient for the lipid droplet and protein images calculated over the whole cell mask. E and F are the Manders’ M1 and M2 colocalization coefficients, also calculated for the whole cell mask. Each bar represents the mean ± SD for n = 7 or 8 wells, with an average of 413 cells/well. ** P < 0.01 vs. control (ANOVA followed by Dunnett’s test).
Lipid droplets tend to occur in clusters in AML12 cells. These clusters can appear as a large single droplet (sometimes irregularly shaped) at low magnification, but are resolved into discrete smaller droplets by higher magnification. Thus, imaging at a higher magnification yields a greater number of droplets per cell. Tii Li Lm was increased 81-fold by oleic acid with a Z′ value of 0.64 (Fig. 8B). The area of the cell identified as ADFP-positive by the Colocalization algorithm was increased 2-fold by oleic acid (Fig. 8C). The effects of oleic acid on LDC, Tii Li Lm, and Ar Pm were significant at P < 0.01.
Regarding colocalization of ADFP with the lipid droplets, Pr Li Pi Wm for control cells averaged 0.47, indicating a high degree of colocalization. For cells exposed to oleic acid, the mean value was somewhat elevated (0.58), but this degree of elevation did not meet the criteria of statistical significance in this multiple comparison experiment. The M1 colocalization coefficients were similar for control versus oleic acid-treated cells, and relatively high (mean values of 0.70 and 0.56, Fig. 8E). In contrast M2 averaged 0.14 for control versus 0.77 for oleic acid-treated cells (Fig. 8F), with very good consistency and this difference was statistical significance (P < 0.01) and yielded a Z′ value of 0.61. The Pr Li Pi Wm data suggest that, in general, the lipid droplets and ADFP are colocalized in AML12 cells. However, the Mander’s M1 and M2 coefficients provide insight into the situation. The relatively high values of the M1 coefficients, for example, indicate that for both control cells and oleic acid-treated cells, the majority of lipid staining intensity is correlated with the ADFP label. The M2 values, however, suggest that under control conditions, much of the ADFP label is not associated with lipid staining; however, for cells treated with oleic acid, which feature more lipid droplets and more ADFP, the majority of the ADFP label intensity is associated with the lipid stain.
Analysis of Lipid Droplets and ADFP in Primary Hepatocytes
A similar experiment was also performed with primary rat hepatocytes. Hepatocytes isolated from an adult rat were plated on a 96-well dish, then exposed to 200 µM oleic acid overnight, then fixed and stained for lipid droplets, and labeled for ADFP. More lipid droplets were found, per cell, for this cell type than for any of the hepatocyte-derived cell lines, and the droplets were well resolved by the imaging and by the automated algorithm. For the control cells, a relatively large number of small, weakly staining droplets were found (a mean of 101 per cell; Fig. 9A). ADFP was found both bordering the lipid droplets and, also, throughout the cytoplasm (Fig. 9B). For cells exposed to oleic acid (Fig. 9C and 9D), there was an average of 195 lipid droplets per cell (Fig. 9E), and the total integrated intensity of the lipid droplets (TLL) was 14-fold higher (Fig. 9F). In contrast, addition of oleic acid had only a mild effect on overall ADFP expression, as the area of the ADFP label was increased by just 11% (data not shown). The Pr Li Pi Wm for the colocalization of the lipid droplets and ADFP was 0.60 for control cells and this increased to 0.66 for cells treated with oleic acid (Fig. 9G). The M1 colocalization coefficient averaged 0.82 for control cells and 0.70 for cells treated with oleic acid (data not shown). The M2 coefficient averaged 0.25 for control cells and was increased to 0.90 by treatment with oleic acid (Fig. 9H). Thus, the colocalization constants calculated for lipid droplets and ADFP for the primary rat hepatocytes were very similar to those determined above for lipid droplets and ADFP in AML12 cells.
Fig. 9. .
Quantification of lipid droplets and ADFP in primary rat hepatocytes. Hepatocytes, prepared from an adult rat, were cultured for 2 days in DMEM + 10% FBS in a 96-well dish. The cells were exposed to 200 µM oleic acid (OA) overnight, then fixed and labeled for lipid droplets and ADFP. Control cells visualized (40×) for lipid droplets (green) plus nuclei (blue) are shown in A, and the corresponding ADFP (red) image is shown in B. OA-treated cells visualized in the same manner are shown in C and D. The scale bar is 50 µm and applies to A–D. The number of lipid droplet count (LDC) and the total integrated intensity of the lipid image at the lipid mask are shown in E and F, respectively. G and H depict the Pearson’s correlation and the Manders’ M2 coefficients calculated between the lipid droplet and protein images over the whole cell mask, respectively. For E–H, each bar represents the mean ± SD for n = 3 or 2 wells, respectively (5–112 cells/well were analyzed).
Analysis of Lipid Droplets HepG2 Cells
HepG2 cells were also tested using the same methodology. However, HepG2 cells were somewhat 3-dimensional and had a tendency to clump. The HepG2 featured a large amount of lipid droplets in the control state (images not shown), with the lipid droplets representing 18.8% of the cell area. Addition of oleic acid to the HepG2 cells resulted in approximate 2-fold increases in the percentage of lipid droplet area, lipid droplet count, and TLL (data not shown).
Quantification of Lipid Droplets in HeLa and THP-1 Cells
To test if CyteSeer® could quantify lipid droplet formation in HeLa (human cervical cancer-derived) and THP-1 cells (human macrophage-derived cells), the cells were treated with oleic acid and stained for neutral lipids via techniques identical to that used for the hepatocytes. In a time course experiment, HeLa cells were exposed to 150 µM oleic acid for time periods of 1, 2, 4, 7, and 24 h. As quantified by the Lipid Droplet algorithm, control HeLa cells contained an average of 3.2 lipid droplets per cell, and this was increased to 11.3 lipid droplets per cell at the 7 h time point (data not shown), which was the maximum number of droplet/cell that was observed for the experiment. The lipid droplet masks from HeLa cells were of high fidelity with regard to the lipid droplets (Fig. 10A and 10B). For HeLa cells, one of the most consistent data parameters derived from the image set was the difference between the median pixel intensity of the lipid image at the lipid mask and the median pixel intensity of the lipid image at the cytoplasmic mask (Mpi Li Lm–Mpi Li Cm); this data parameter was significantly increased ∼3-fold after just a 1 h exposure to oleic acid, and increased 16-fold over the course of the experiment with a Z′ value of 0.20 (Fig. 10E).
Fig. 10. .

Quantification of lipid droplets in HeLa and THP-1 cells. (A) HeLa cells are shown that have been stained for lipids (green) and nuclei (blue) following overnight exposure to 150 µM oleic acid. (B) The lipid droplet mask (green) derived from A is shown. (C) THP-1 cells maintained in 100 nM PMA to induce differentiation to macrophages, stained for lipids and nuclei following overnight exposure to 150 µM oleic acid are shown. (D) Lipid droplet mask (green) derived for the lipid droplets from C. (E) Time course of lipid accumulation in HeLa is shown; the Y-axis is the difference in intensity between the median pixel intensities of the lipid mask versus the cytoplasmic mask for the lipid image. (F) For THP-1 cells, the dose–response for oleic acid-induced accumulation of lipid is shown. The Y-axis is the ratio of the median pixel intensities of the lipid mask versus the cytoplasmic mask for the lipid image. For E and F, each bar represents the mean ± SD for n = 16 wells. Scale bars in A and D are 50 µm. *** P < 0.001 vs. controls, ANOVA followed by Dunnett’s test.
THP-1 cells were proliferated in suspension, and then differentiated to the macrophage phenotype by plating in the presence of 100 nM PMA. The cells were then exposed to different concentrations of oleic acid overnight. The Lipid Droplet algorithm readily identified lipid droplets in the THP-1 cells (Fig. 10C and 10D). Control cells featured an average of 4.0 lipid droplets/cell, and this was increased to 7.0 lipid droplets/cell by 150 µM oleic acid (data not shown). For the THP-1 cells the data parameter corresponding to Mpi Li Lm/Mpi Li Cm proved to be very consistent. For example, the lowest dose of oleic acid used in the experiment (19 µM) elicited a 30% increase in this parameter that was highly statistically significant (P < 0.001) and Z′ = 0.69 for the comparison between control cells and cells exposed to 300 µM oleic acid (Fig. 10F).
DISCUSSION
The present study describes the development of high-content/high-throughput methodology for quantifying lipid droplets and lipid droplet-associated proteins in adipocytes and other cell types. Lipid droplets and associated proteins are an ideal subject for high-content microscopy analysis, as the nuclei, droplets, and proteins are readily visualized in separate fluorescence channels in cells that have been cultured in a high-throughput fashion.
To develop our methodology, we initially chose primary subcutaneous preadipocytes, harvested from adult humans via liposuction, as a model system. These were induced to produce lipid droplets by exposing the cells to rosi or a proprietary PPAR-γ agonist. The preadipocytes adhered strongly to the multi-well dishes required for high-throughput automated microscopy and were relatively flat, so that images could be captured at a single focal plane that visualized most of the lipid droplets with good focus.
The Lipid Droplet algorithm was designed to recognize the very small droplets that originate in subcutaneous preadipocytes during the beginning of the adipogenesis differentiation pathway induced by PPAR-γ agonists. The algorithm quantified the effects of rosi with excellent consistency, yielding Z′ values >0.50 for a variety of data parameters. Thus, the assay is suitable for high-throughput screening of chemical libraries, containing hundreds of thousands of compounds. Relatedly, the consistency of the analysis achieved by the algorithm also allowed subtle effects to be quantified, such as the positive effects of low concentrations (1–10 nM) of rosi on the lipid droplets in the human adipocytes. A benefit of developing methods to quantify the small droplets associated with the beginnings of adipogenesis is that the algorithm also proved capable of quantifying lipid droplet formation in a variety of non-adipocytes, as shown here for hepatocytes, HeLa, and macrophages.
The use of colocalization analysis to quantify the association of proteins with lipid droplets provided a degree of quantification not typically considered in studies of PAT proteins. In adipocytes, cells were co-visualized for lipid and perilipin, a protein well known to be tightly associated with lipid droplets. Pearson’s correlation values determined between the lipid and protein images over the whole cell mask (Pr Li Pi Wm) for perilipin versus lipid droplets averaged approximately 0.37 to 0.48 in these experiments, indicating a high degree of colocalization. Pr Li Pi Wm is likely influenced by two relationships that have opposite effects on the coefficient: the considerable overlap in the lipid droplet and perilipin images within each cell represents a positive influence on Pr Li PI Wm. However, the inverse relationship between lipid intensity (brightest in the center) and perilipin intensity (dimmest in the center) within each lipid droplet acts to diminish Pr Li Pi Wm. Thus, Pr Li PI Wm values in the 0.35 to 0.50 range are likely to be as high as can be obtained for the PAT protein family for adipocytes imaged using the conventional fluorescence microscopy approach used in this study. In contrast, Pr Li Pi Wm values near zero were obtained for lipid droplets versus the HSL label for adipocytes in control culture medium, indicating a random distribution between the lipid droplet stain and the HSL label.
The immunolabeling pattern for PKC in adipocytes yielded Pr Li Pi Wm values that were intermediate between perilipin and the HSL, suggesting some degree of association of PKC with the lipid droplets. Both PKC-α and PKC-β are present in adipocytes.86 Further, PKC isoforms regulate a variety of processes related to lipid droplet biology including expression of the PAT protein TIP47,87 adipocyte differentiation,88 magnolol-induced lipolysis,89 and cholesterol-induced targeting of caveolin to lipid droplets.90 The analysis described in the current study is the first, to our knowledge, to imply an association of PKC with lipid droplets in human subcutaneous adipocytes.
Colocalization analysis of ADFP and lipid droplets in hepatocytes provides insight into the likely mechanism via which ADFP participates in lipid droplet metabolism. In the absence of oleic acid, the AML12 cells displayed significant label for ADFP, even though lipid droplets were relatively sparse. The M1 coefficient, which provided an index of the degree to which the lipid droplet fluorescent label was associated with ADFP label, was high (eg, ∼0.7), indicating that most of the lipids were associated with ADFP in the control cells. In contrast, the M2 coefficient, which provides an index of the percentage of ADFP fluorescence intensity that is associated with lipid droplets, was low under control conditions indicating that much of the ADFP was independent of the relatively few and small lipid droplets found in the absence of oleic acid. When oleic acid was added, yielding larger and more numerous droplets, the M2 coefficient strongly increased. This is the relationship that would be expected for a protein that is present prior to lipid droplet formation, and which migrates to the surface of droplets at early stages of droplet formation, as has been previously observed for ADFP.30 , 91
Of the hepatocyte-derived cell lines considered in this study, under control conditions, AML12 cells expressed the fewest and smallest droplets, followed by the HuH-7 cells, and HepG2 cells. This is consistent with the origin of each cell line. AML12 cells were derived from a transgenic mouse overexpressing TGF-α92 and are mitotic, but retain many features of normal hepatocytes. Both HuH-793 and HepG294 cells, however, were derived from hepatocellular carcinomas. Lipid droplets are common in hepatocellular carcinomas as the enzymatic pathways responsible for lipid droplet formation are up-regulated in this cancer type95; furthermore, fatty liver disease and Metabolic Syndrome are risk factors for hepatocellular carcinoma.96 Thus, the AML12 cells likely represent a model for “normal” liver, whereas HuH-7 and HepG2 might best be considered models for fatty liver. Our results suggest that AML12 and HuH-7 are readily suitable for high-throughput/high-content-based screening strategies to screen chemical or genomic libraries for probes or genes that increase or inhibit lipid droplet formation in the context of the hepatocyte. Primary rat hepatocytes also responded to oleic acid with a very strong increase in lipid labeling. The colocalization analysis of lipid droplets and ADFP label yielded similar results for the primary hepatocytes and AML12 cells, which is further evidence of the near-normal phenotype of the AML12 cell line.
The results with the macrophages suggest that this methodology can be used to screen macrophage-type cells for probes or genes that influence lipid droplet metabolism in the context of coronary artery disease21 , 97 and tuberculosis,23 , 24 two diseases in which “foam” cells (macrophages loaded with lipid droplets) play a strong role in the respective etiologies.
Image-based high-content screens designed to probe lipid droplet metabolic pathways via use of siRNA libraries and related techniques have recently been performed for Drosophila S2 and KC167 cell lines and have identified Coat Protein Complex I (COPI) proteins as important mediators of lipid droplet formation98 , 99; furthermore, the relevance of these findings to mammalian cells was confirmed with AML12 and 3T3-L1 cells.99 Also, image-based analysis of lipid droplets in yeast deletion strains has identified a lipid droplet regulating function for seipin, a protein mutated in patients with Berardinelli-Seip congential lipodystrophy, a condition in which adipose tissue is severely reduced.100 In these previous studies, digital images were acquired from the relevant cell models, and the images laboriously analyzed by visual inspection, or by custom-designed image analysis algorithms. The Java-encoded algorithms used in this study are portable to a variety of computer operating systems (PC, Macintosh, Linux), can be operated in a “batch” mode to analyze images acquired from hundreds of multiple-well dishes, and includes the ability to quantify colocalization of lipid droplets with proteins or any cellular structure that can be visualized by fluorescent-labeling techniques. Future directions will include development of algorithms to quantify the spatial distribution of droplets within the cell and the analysis of lipid droplets in tissue sections.
Contributor Information
Patrick M. McDonough, Vala Sciences Inc., San Diego, California..
Ramses M. Agustin, The Burnham Institute for Medical Research, La Jolla, California.
Randall S. Ingermanson, Vala Sciences Inc., San Diego, California.
Patricia A. Loy, Vala Sciences Inc., San Diego, California.
Benjamin M. Buehrer, Zen-Bio, Inc., Research Triangle Park, North Carolina.
James B. Nicoll, Zen-Bio, Inc., Research Triangle Park, North Carolina.
Natalie L. Prigozhina, The Burnham Institute for Medical Research, La Jolla, California.
Ivana Mikic, The Burnham Institute for Medical Research, La Jolla, California..
Jeffrey H. Price, Vala Sciences Inc., San Diego, California. The Burnham Institute for Medical Research, La Jolla, California.
ACKNOWLEDGMENTS
We thank Dr. Brian A. Naughton (RegeneMed Inc.) for the generous gift of primary rat hepatocytes. We thank Dr. Constantine Londos for the generous gift of the anti-ADFP antibody. This research was supported, in part, by National Institutes of Health grants 1R43DK074333 (P.M.M.).
AUTHOR DISCLOSURE STATEMENT
No competing financial interests exist.
REFERENCES
- 1.Haffner SM. Relationship of metabolic risk factors and development of cardiovascular disease and diabetes. Obesity (Silver Spring) 2006;14((Suppl 3)):121S–127S. doi: 10.1038/oby.2006.291. [DOI] [PubMed] [Google Scholar]
- 2.Hensrud DD, Klein S. Extreme obesity: a new medical crisis in the United States. Mayo Clin Proc. 2006;81((10 Suppl)):S5–S10. doi: 10.1016/s0025-6196(11)61175-0. [DOI] [PubMed] [Google Scholar]
- 3.Francischetti EA, Genelhu VA. Obesity-hypertension: an ongoing pandemic. Int J Clin Pract. 2007;61((2)):269–280. doi: 10.1111/j.1742-1241.2006.01262.x. [DOI] [PubMed] [Google Scholar]
- 4.Hill JO, Peters JC, Wyatt HR. The role of public policy in treating the epidemic of global obesity. Clin Pharmacol Ther. 2007;81((5)):772–775. doi: 10.1038/sj.clpt.6100107. [DOI] [PubMed] [Google Scholar]
- 5.Dehghan M, Akhtar-Danesh N, Merchant AT. Childhood obesity, prevalence and prevention. Nutr J. 2005;4:24. doi: 10.1186/1475-2891-4-24. [DOI] [PMC free article] [PubMed] [Google Scholar]
- 6.Orio F, Jr., Palomba S, Cascella T, Savastano S, Lombardi G, Colao A. Cardiovascular complications of obesity in adolescents. J Endocrinol Invest. 2007;30((1)):70–80. doi: 10.1007/BF03347399. [DOI] [PubMed] [Google Scholar]
- 7.Wyatt SB, Winters KP, Dubbert PM. Overweight and obesity: prevalence, consequences, and causes of a growing public health problem. Am J Med Sci. 2006;331((4)):166–174. doi: 10.1097/00000441-200604000-00002. [DOI] [PubMed] [Google Scholar]
- 8.Neuschwander-Tetri BA. Fatty liver and the metabolic syndrome. Curr Opin Gastroenterol. 2007;23((2)):193–198. doi: 10.1097/MOG.0b013e32801421a9. [DOI] [PubMed] [Google Scholar]
- 9.Saadeh S. Nonalcoholic Fatty liver disease and obesity. Nutr Clin Pract. 2007;22((1)):1–10. doi: 10.1177/011542650702200101. [DOI] [PubMed] [Google Scholar]
- 10.Reddy JK, Rao MS. Lipid metabolism and liver inflammation. II. Fatty liver disease and fatty acid oxidation. Am J Physiol Gastrointest Liver Physiol. 2006;290((5)):G852–G858. doi: 10.1152/ajpgi.00521.2005. [DOI] [PubMed] [Google Scholar]
- 11.Moscatiello S, Manini R, Marchesini G. Diabetes and liver disease: an ominous association. Nutr Metab Cardiovasc Dis. 2007;17((1)):63–70. doi: 10.1016/j.numecd.2006.08.004. [DOI] [PubMed] [Google Scholar]
- 12.Targher G, Bertolini L, Padovani R, Rodella S, Tessari R, Zenari L, et al. Prevalence of nonalcoholic fatty liver disease and its association with cardiovascular disease among type 2 diabetic patients. Diabetes Care. 2007;30((5)):1212–1218. doi: 10.2337/dc06-2247. [DOI] [PubMed] [Google Scholar]
- 13.Bondini S, Younossi ZM. Non-alcoholic fatty liver disease and hepatitis C infection. Minerva Gastroenterol Dietol. 2006;52((2)):135–143. [PubMed] [Google Scholar]
- 14.Boulant S, Targett-Adams P, McLauchlan J. Disrupting the association of hepatitis C virus core protein with lipid droplets correlates with a loss in production of infectious virus. J Gen Virol. 2007;88((Pt 8)):2204–2213. doi: 10.1099/vir.0.82898-0. [DOI] [PubMed] [Google Scholar]
- 15.Schrauwen-Hinderling VB, Hesselink MK, Schrauwen P, Kooi ME. Intramyocellular lipid content in human skeletal muscle. Obesity (Silver Spring) 2006;14((3)):357–367. doi: 10.1038/oby.2006.47. [DOI] [PubMed] [Google Scholar]
- 16.Sharma S, Adrogue JV, Golfman L, Uray I, Lemm J, Youker K, et al. Intramyocardial lipid accumulation in the failing human heart resembles the lipotoxic rat heart. FASEB J. 2004;18((14)):1692–1700. doi: 10.1096/fj.04-2263com. [DOI] [PubMed] [Google Scholar]
- 17.Christoffersen C, Bollano E, Lindegaard ML, Bartels ED, Goetze JP, Andersen CB, et al. Cardiac lipid accumulation associated with diastolic dysfunction in obese mice. Endocrinology. 2003;144((8)):3483–3490. doi: 10.1210/en.2003-0242. [DOI] [PubMed] [Google Scholar]
- 18.Ueno M, Suzuki J, Zenimaru Y, Takahashi S, Koizumi T, Noriki S, et al. Cardiac overexpression of hormone-sensitive lipase inhibits myocardial steatosis and fibrosis in streptozotocin diabetic mice. Am J Physiol Endocrinol Metab. 2008;294((6)):E1109–E1118. doi: 10.1152/ajpendo.00016.2008. [DOI] [PubMed] [Google Scholar]
- 19.Man ZW, Zhu M, Noma Y, Toide K, Sato T, Asahi Y, et al. Impaired beta-cell function and deposition of fat droplets in the pancreas as a consequence of hypertriglyceridemia in OLETF rat, a model of spontaneous NIDDM. Diabetes. 1997;46((11)):1718–1724. doi: 10.2337/diab.46.11.1718. [DOI] [PubMed] [Google Scholar]
- 20.Fex M, Nitert MD, Wierup N, Sundler F, Ling C, Mulder H. Enhanced mitochondrial metabolism may account for the adaptation to insulin resistance in islets from C57BL/6J mice fed a high-fat diet. Diabetologia. 2007;50((1)):74–83. doi: 10.1007/s00125-006-0464-4. [DOI] [PubMed] [Google Scholar]
- 21.Choudhury RP, Lee JM, Greaves DR. Mechanisms of disease: macrophage-derived foam cells emerging as therapeutic targets in atherosclerosis. Nat Clin Pract Cardiovasc Med. 2005;2((6)):309–315. doi: 10.1038/ncpcardio0195. [DOI] [PubMed] [Google Scholar]
- 22.Larigauderie G, Cuaz-Perolin C, Younes AB, Furman C, Lasselin C, Copin C, et al. Adipophilin increases triglyceride storage in human macrophages by stimulation of biosynthesis and inhibition of beta-oxidation. FEBS J. 2006;273((15)):3498–3510. doi: 10.1111/j.1742-4658.2006.05357.x. [DOI] [PubMed] [Google Scholar]
- 23.Ordway D, Henao-Tamayo M, Orme IM, Gonzalez-Juarrero M. Foamy macrophages within lung granulomas of mice infected with Mycobacterium tuberculosis express molecules characteristic of dendritic cells and antiapoptotic markers of the TNF receptor-associated factor family. J Immunol. 2005;175((6)):3873–3881. doi: 10.4049/jimmunol.175.6.3873. [DOI] [PubMed] [Google Scholar]
- 24.D’Avila H, Melo RC, Parreira GG, Werneck-Barroso E, Castro-Faria-Neto HC, Bozza PT. Mycobacterium bovis bacillus Calmette-Guerin induces TLR2-mediated formation of lipid bodies: intracellular domains for eicosanoid synthesis in vivo . J Immunol. 2006;176((5)):3087–3097. doi: 10.4049/jimmunol.176.5.3087. [DOI] [PubMed] [Google Scholar]
- 25.Tarnopolsky MA, Rennie CD, Robertshaw HA, Fedak-Tarnopolsky SN, Devries MC, Hamadeh MJ. Influence of endurance exercise training and sex on intramyocellular lipid and mitochondrial ultrastructure, substrate use, and mitochondrial enzyme activity. Am J Physiol Regul Integr Comp Physiol. 2007;292((3)):R1271–R1278. doi: 10.1152/ajpregu.00472.2006. [DOI] [PubMed] [Google Scholar]
- 26.Weinberg JM. Lipotoxicity. Kidney Int. 2006;70((9)):1560–1566. doi: 10.1038/sj.ki.5001834. [DOI] [PubMed] [Google Scholar]
- 27.Kusunoki J, Kanatani A, Moller DE. Modulation of fatty acid metabolism as a potential approach to the treatment of obesity and the metabolic syndrome. Endocrine. 2006;29((1)):91–100. doi: 10.1385/ENDO:29:1:91. [DOI] [PubMed] [Google Scholar]
- 28.Ghosh S, Rodrigues B. Cardiac cell death in early diabetes and its modulation by dietary fatty acids. Biochim Biophys Acta. 2006;1761((10)):1148–1162. doi: 10.1016/j.bbalip.2006.08.010. [DOI] [PubMed] [Google Scholar]
- 29.Robenek MJ, Severs NJ, Schlattmann K, Plenz G, Zimmer KP, Troyer D, et al.: Lipids partition caveolin-1 from ER membranes into lipid droplets: updating the model of lipid droplet biogenesis. FASEB J 2004;18(7):866–868 [DOI] [PubMed] [Google Scholar]
- 30.Wolins NE, Quaynor BK, Skinner JR, Schoenfish MJ, Tzekov A, Bickel PE. S3–12, Adipophilin, and TIP47 package lipid in adipocytes. J Biol Chem. 2005;280((19)):19146–19155. doi: 10.1074/jbc.M500978200. [DOI] [PubMed] [Google Scholar]
- 31.Wolins NE, Brasaemle DL, Bickel PE. A proposed model of fat packaging by exchangeable lipid droplet proteins. FEBS Lett. 2006;580((23)):5484–5491. doi: 10.1016/j.febslet.2006.08.040. [DOI] [PubMed] [Google Scholar]
- 32.Song H, O’Connor KC, Papadopoulos KD, Jansen DA. Differentiation kinetics of in vitro 3T3-L1 preadipocyte cultures. Tissue Eng. 2002;8((6)):1071–1081. doi: 10.1089/107632702320934164. [DOI] [PubMed] [Google Scholar]
- 33.Hickenbottom SJ, Kimmel AR, Londos C, Hurley JH. Structure of a lipid droplet protein; the PAT family member TIP47. Structure. 2004;12((7)):1199–1207. doi: 10.1016/j.str.2004.04.021. [DOI] [PubMed] [Google Scholar]
- 34.Chang BH, Li L, Paul A, Taniguchi S, Nannegari V, Heird WC, et al. Protection against fatty liver but normal adipogenesis in mice lacking adipose differentiation-related protein. Mol Cell Biol. 2006;26((3)):1063–1076. doi: 10.1128/MCB.26.3.1063-1076.2006. [DOI] [PMC free article] [PubMed] [Google Scholar]
- 35.Motomura W, Inoue M, Ohtake T, Takahashi N, Nagamine M, Tanno S, et al. Up-regulation of ADRP in fatty liver in human and liver steatosis in mice fed with high fat diet. Biochem Biophys Res Commun. 2006;340((4)):1111–1118. doi: 10.1016/j.bbrc.2005.12.121. [DOI] [PubMed] [Google Scholar]
- 36.Chang BH, Chan L. Regulation of Triglyceride Metabolism. III. Emerging role of lipid droplet protein ADFP in health and disease. Am J Physiol Gastrointest Liver Physiol. 2007;292((6)):G1465–G1468. doi: 10.1152/ajpgi.00566.2006. [DOI] [PubMed] [Google Scholar]
- 37.Shen WJ, Patel S, Yu Z, Jue D, Kraemer FB. Effects of rosiglitazone and high fat diet on lipase/esterase expression in adipose tissue. Biochim Biophys Acta. 2007;1771((2)):177–184. doi: 10.1016/j.bbalip.2006.11.009. [DOI] [PMC free article] [PubMed] [Google Scholar]
- 38.Jocken JW, Langin D, Smit E, Saris WH, Valle C, Hul GB, et al. Adipose triglyceride lipase and hormone-sensitive lipase protein expression is decreased in the obese insulin-resistant state. J Clin Endocrinol Metab. 2007;92((6)):2292–2299. doi: 10.1210/jc.2006-1318. [DOI] [PubMed] [Google Scholar]
- 39.Jaworski K, Sarkadi-Nagy E, Duncan RE, Ahmadian M, Sul HS. Regulation of triglyceride metabolism. IV. Hormonal regulation of lipolysis in adipose tissue. Am J Physiol Gastrointest Liver Physiol. 2007;293((1)):G1–G4. doi: 10.1152/ajpgi.00554.2006. [DOI] [PMC free article] [PubMed] [Google Scholar]
- 40.Gronke S, Mildner A, Fellert S, Tennagels N, Petry S, Müller G, et al. Brummer lipase is an evolutionary conserved fat storage regulator in Drosophila. Cell Metab. 2005;1((5)):323–330. doi: 10.1016/j.cmet.2005.04.003. [DOI] [PubMed] [Google Scholar]
- 41.Saha PK, Kojima H, Martinez-Botas J, Sunehag AL, Chan L. Metabolic adaptations in the absence of perilipin: increased beta-oxidation and decreased hepatic glucose production associated with peripheral insulin resistance but normal glucose tolerance in perilipin-null mice. J Biol Chem. 2004;279((34)):35150–35158. doi: 10.1074/jbc.M405499200. [DOI] [PubMed] [Google Scholar]
- 42.Londos C, Sztalryd C, Tansey JT, Kimmel AR. Role of PAT proteins in lipid metabolism. Biochimie. 2005;87((1)):45–49. doi: 10.1016/j.biochi.2004.12.010. [DOI] [PubMed] [Google Scholar]
- 43.Londos C, Brasaemle DL, Schultz CJ, Segrest JP, Kimmel AR. Perilipins, ADRP, and other proteins that associate with intracellular neutral lipid droplets in animal cells. Semin Cell Dev Biol. 1999;10((1)):51–58. doi: 10.1006/scdb.1998.0275. [DOI] [PubMed] [Google Scholar]
- 44.Clifford GM, Londos C, Kraemer FB, Vernon RG, Yeaman SJ. Translocation of hormone-sensitive lipase and perilipin upon lipolytic stimulation of rat adipocytes. J Biol Chem. 2000;275((7)):5011–5015. doi: 10.1074/jbc.275.7.5011. [DOI] [PubMed] [Google Scholar]
- 45.Chung S, Brown JM, Sandberg MB, McIntosh M. Trans-10,cis-12 CLA increases adipocyte lipolysis and alterslipid droplet-associated proteins role of mTOR and ERK signaling. J Lipid Res. 2005;46((5)):885–895. doi: 10.1194/jlr.M400476-JLR200. [DOI] [PMC free article] [PubMed] [Google Scholar]
- 46.Brasaemle DL, Levin DM, Adler-Wailes DC, Londos C. The lipolytic stimulation of 3T3-L1 adipocytes promotes the translocation of hormone-sensitive lipase to the surfaces of lipid storage droplets. Biochim Biophys Acta. 2000;1483((2)):251–262. doi: 10.1016/s1388-1981(99)00179-1. [DOI] [PubMed] [Google Scholar]
- 47.Miyoshi H, Perfield JW, II Souza SC, Shen WJ, Zhang HH, Stancheva ZS, et al. Control of adipose triglyceride lipase action by serine 517 of perilipin A globally regulates protein kinase A-stimulated lipolysis in adipocytes. J Biol Chem. 2007;282((2)):996–1002. doi: 10.1074/jbc.M605770200. [DOI] [PubMed] [Google Scholar]
- 48.Athenstaedt K, Zweytick D, Jandrositz A, Kohlwein SD, Daum G.Identification and characterization of major lipid particle proteins of the yeast Saccharomyces cerevisiae J Bacteriol1999181(20)6441–6448. [DOI] [PMC free article] [PubMed] [Google Scholar]
- 49.Brasaemle DL, Dolios G, Shapiro L, Wang R. Proteomic analysis of proteins associated with lipid droplets of basal and lipolytically stimulated 3T3-L1 adipocytes. J Biol Chem. 2004;279((45)):46835–46842. doi: 10.1074/jbc.M409340200. [DOI] [PubMed] [Google Scholar]
- 50.Beller M, Riedel D, Jansch L, Dieterich G, Wehland J, Jäckle H, et al. Characterization of the Drosophila lipid droplet subproteome. Mol Cell Proteomics. 2006;5((6)):1082–1094. doi: 10.1074/mcp.M600011-MCP200. [DOI] [PubMed] [Google Scholar]
- 51.Turro S, Ingelmo-Torres M, Estanyol JM, Tebar F, Fernández MA, Albor CV, et al. Identification and characterization of associated with lipid droplet protein 1: A novel membrane-associated protein that resides on hepatic lipid droplets. Traffic. 2006;7((9)):1254–1269. doi: 10.1111/j.1600-0854.2006.00465.x. [DOI] [PubMed] [Google Scholar]
- 52.Aza-Blanc P, Cooper CL, Wagner K, Batalov S, Deveraux QL, Cooke MP. Identification of modulators of TRAIL-induced apoptosis via RNAi-based phenotypic screening. Mol Cell. 2003;12((3)):627–637. doi: 10.1016/s1097-2765(03)00348-4. [DOI] [PubMed] [Google Scholar]
- 53.Berno V, Hinojos CA, Amazit L, Szafran AT, Mancini MA. High-resolution, high-throughput microscopy analyses of nuclear receptor and coregulator function. Methods Enzymol. 2006;414:188–210. doi: 10.1016/S0076-6879(06)14011-2. [DOI] [PubMed] [Google Scholar]
- 54.Bettencourt-Dias M, Giet R, Sinka R, Mazumdar A, Lock WG, Balloux F, et al. Genome-wide survey of protein kinases required for cell cycle progression. Nature. 2004;432((7020)):980–987. doi: 10.1038/nature03160. [DOI] [PubMed] [Google Scholar]
- 55.Carpenter AE, Sabatini DM. Systematic genome-wide screens of gene function. Nat Rev Genet. 2004;5((1)):11–22. doi: 10.1038/nrg1248. [DOI] [PubMed] [Google Scholar]
- 56.Cho CY, Koo SH, Wang Y, Callaway S, Hedrick S, Mak PA, et al. Identification of the tyrosine phosphatase PTP-MEG2 as an antagonist of hepatic insulin signaling. Cell Metab. 2006;3((5)):367–378. doi: 10.1016/j.cmet.2006.03.006. [DOI] [PubMed] [Google Scholar]
- 57.Harada JN, Bower KE, Orth AP, Callaway S, Nelson CG, Laris C, et al. Identification of novel mammalian growth regulatory factors by genome-scale quantitative image analysis. Genome Res. 2005;15((8)):1136–1144. doi: 10.1101/gr.3889305. [DOI] [PMC free article] [PubMed] [Google Scholar]
- 58.Huang Q, Raya A, DeJesus P, Chao SH, Quon KC, Caldwell JS, et al. Identification of p53 regulators by genome-wide functional analysis. Proc Natl Acad Sci USA. 2004;101((10)):3456–3461. doi: 10.1073/pnas.0308562100. [DOI] [PMC free article] [PubMed] [Google Scholar]
- 59.Iourgenko V, Zhang W, Mickanin C, Daly I, Jiang C, Hexham JM, et al. Identification of a family of cAMP response element-binding protein coactivators by genome-scale functional analysis in mammalian cells. Proc Natl Acad Sci USA. 2003;100((21)):12147–12152. doi: 10.1073/pnas.1932773100. [DOI] [PMC free article] [PubMed] [Google Scholar]
- 60.Marcelli M, Stenoien DL, Szafran AT, Simeoni S, Agoulnik IU, Weigel NL, et al. Quantifying effects of ligands on androgen receptor nuclear translocation, intranuclear dynamics, and solubility. J Cell Biochem. 2006;98((4)):770–788. doi: 10.1002/jcb.20593. [DOI] [PubMed] [Google Scholar]
- 61.Mukherji M, Bell R, Supekova L, Wang Y, Orth AP, Batalov S, et al. Genome-wide functional analysis of human cell-cycle regulators. Proc Natl Acad Sci USA. 2006;103((40)):14819–14824. doi: 10.1073/pnas.0604320103. [DOI] [PMC free article] [PubMed] [Google Scholar]
- 62.Rines DR, Tu B, Miraglia L, Welch GL, Zhang J, Hull MV, et al. High-content screening of functional genomic libraries. Methods Enzymol. 2006;414:530–565. doi: 10.1016/S0076-6879(06)14028-8. [DOI] [PubMed] [Google Scholar]
- 63.Sharp ZD, Mancini MG, Hinojos CA, Dai F, Berno V, Szafran AT, et al. Estrogen-receptor-alpha exchange and chromatin dynamics are ligand- and domain-dependent. J Cell Sci. 2006;119((Pt 19)):4101–4116. doi: 10.1242/jcs.03161. [DOI] [PubMed] [Google Scholar]
- 64.Zheng L, Liu J, Batalov S, Zhou D, Orth A, Ding S, et al. An approach to genomewide screens of expressed small interfering RNAs in mammalian cells. Proc Natl Acad Sci USA. 2004;101((1)):135–140. doi: 10.1073/pnas.2136685100. [DOI] [PMC free article] [PubMed] [Google Scholar]
- 65.Dragunow M. High-content analysis in neuroscience. Nat Rev Neurosci. 2008;9((10)):779–788. doi: 10.1038/nrn2492. [DOI] [PubMed] [Google Scholar]
- 66.Haney SA, LaPan P, Pan J, Zhang J. High-content screening moves to the front of the line. Drug Discov Today. 2006;11((19–20)):889–894. doi: 10.1016/j.drudis.2006.08.015. [DOI] [PubMed] [Google Scholar]
- 67.Giuliano KA, Johnston PA, Gough A, Taylor DL. Systems cell biology based on high-content screening. Methods Enzymol. 2006;414:601–619. doi: 10.1016/S0076-6879(06)14031-8. [DOI] [PubMed] [Google Scholar]
- 68.Nicholson RL, Welch M, Ladlow M, Spring DR: Small-molecule screening. advances in microarraying and cell-imaging technologies. ACS Chem Biol. 2007;2((1)):24–30. doi: 10.1021/cb600321j. [DOI] [PubMed] [Google Scholar]
- 69.Morelock MM, Hunter EA, Moran TJ, Heynen S, Laris C, Thieleking M, et al. Statistics of assay validation in high throughput cell imaging of nuclear factor kappaB nuclear translocation. Assay Drug Dev Technol. 2005;3((5)):483–499. doi: 10.1089/adt.2005.3.483. [DOI] [PubMed] [Google Scholar]
- 70.Prigozhina NL, Zhong L, Hunter EA, Mikic´ I, Callaway S, Roop DR, et al. Plasma membrane assays and three-compartment image cytometry for high content screening. Assay Drug Dev Technol. 2007;5((1)):29–48. doi: 10.1089/adt.2006.024. [DOI] [PubMed] [Google Scholar]
- 71.Carpenter AE, Jones TR, Lamprecht MR, Clarke C, Kang IH, Friman O, et al. CellProfiler: image analysis software for identifying and quantifying cell phenotypes. Genome Biol. 2006;7((10)):R100. doi: 10.1186/gb-2006-7-10-r100. [DOI] [PMC free article] [PubMed] [Google Scholar]
- 72.Chen X, Murphy RF. Objective clustering of proteins based on subcellular location patterns. J Biomed Biotechnol. 2005;2005((2)):87–95. doi: 10.1155/JBB.2005.87. [DOI] [PMC free article] [PubMed] [Google Scholar]
- 73.Hunter EA, Callaway WS, Price JH. Software Framework for Scanning Cytometry. Proc. Of SPIE, Optical Diagnostics of Living Cells III. 2000;3921:41–52. [Google Scholar]
- 74.Price JH, Goodacre A, Hahn K, Hodgson L, Hunter EA, Krajewski S, et al. Advances in molecular labeling, high throughput imaging and machine intelligence portend powerful functional cellular biochemistry tools. J Cell Biochem Suppl. 2002;39:194–210. doi: 10.1002/jcb.10448. [DOI] [PubMed] [Google Scholar]
- 75.Roques EJ, Murphy RF. Objective evaluation of differences in protein subcellular distribution. Traffic. 2002;3((1)):61–65. doi: 10.1034/j.1600-0854.2002.30108.x. [DOI] [PubMed] [Google Scholar]
- 76.Shen F, Hodgson L, Rabinovich A, Pertz O, Hahn K, Price JH. Functional proteometrics for cell migration. Cytometry A. 2006;69((7)):563–572. doi: 10.1002/cyto.a.20283. [DOI] [PubMed] [Google Scholar]
- 77.Shen F, Price JH. Toward complete laser ablation of melanoma contaminant cells in a co-culture outgrowth model via image cytometry. Cytometry A. 2006;69((7)):573–581. doi: 10.1002/cyto.a.20290. [DOI] [PubMed] [Google Scholar]
- 78.Tarnok A. Slide-based cytometry for cytomics—a minireview. Cytometry A. 2006;69((7)):555–562. doi: 10.1002/cyto.a.20317. [DOI] [PubMed] [Google Scholar]
- 79.Carpenter AE. Software opens the door to quantitative imaging. Nat Methods. 2007;4((2)):120–121. doi: 10.1038/nmeth0207-120. [DOI] [PubMed] [Google Scholar]
- 80.Manders EMM, Verbeek FJ, Aten JA. Measurement of co-localization of objects in dual-colour confocal images. J Microsc. 1993;169:375–382. doi: 10.1111/j.1365-2818.1993.tb03313.x. [DOI] [PubMed] [Google Scholar]
- 81.Zhang JH, Chung TD, Oldenburg KR. A simple statistical parameter for use in evaluation and validation of high throughput screening assays. J Biomol Screen. 1999;4((2)):67–73. doi: 10.1177/108705719900400206. [DOI] [PubMed] [Google Scholar]
- 82.Russ JC. CRC Press; Boca Raton: 1992. The Image Processing Handbook. [Google Scholar]
- 83.Mikic I, Planey S, Zhang J, Ceballos C, Seron T, von Massenbach B, et al. A live cell, image-based approach to understanding the enzymology and pharmacology of 2-bromopalmitate and palmitoylation. Methods Enzymol. 2006;414:150–187. doi: 10.1016/S0076-6879(06)14010-0. [DOI] [PubMed] [Google Scholar]
- 84.Hunter EA, McDonough PM, Mikic I, Price JH, Hunter EA, McDonough PM, et al. Vala Sciences, Inc., assignee. System, Method and Kit for Processing a Magnified Image of Biological Material to Identify Components of a Biological Object, PCT Patent Application WO/2007/061971
- 85.Xu G, Sztalryd C, Londos C. Degradation of perilipin is mediated through ubiquitination-proteasome pathway. Biochim Biophys Acta. 2006;1761((1)):83–90. doi: 10.1016/j.bbalip.2005.12.005. [DOI] [PubMed] [Google Scholar]
- 86.Nakamura J. Protein kinase CbetaI interacts with the beta1-adrenergic signaling pathway to attenuate lipolysis in rat adipocytes. Biochim Biophys Acta. 2008;1781((5)):277–281. doi: 10.1016/j.bbalip.2008.03.007. [DOI] [PubMed] [Google Scholar]
- 87.Than NG, Sumegi B, Bellyei S, Berki T, Szekeres G, Janaky T, et al. Lipid droplet and milk lipid globule membrane associated placental protein 17b (PP17b) is involved in apoptotic and differentiation processes of human epithelial cervical carcinoma cells. Eur J Biochem. 2003;270((6)):1176–1188. doi: 10.1046/j.1432-1033.2003.03475.x. [DOI] [PubMed] [Google Scholar]
- 88.Hauner H, Petruschke T, Gries FA. Endothelin-1 inhibits the adipose differentiation of cultured human adipocyte precursor cells. Metabolism. 1994;43((2)):227–232. doi: 10.1016/0026-0495(94)90250-x. [DOI] [PubMed] [Google Scholar]
- 89.Huang SH, Shen WJ, Yeo HL, Wang SM. Signaling pathway of magnolol-stimulated lipolysis in sterol ester-loaded 3T3-L1 preadipocyes. J Cell Biochem. 2004;91((5)):1021–1029. doi: 10.1002/jcb.10788. [DOI] [PubMed] [Google Scholar]
- 90.Le Lay S, Hajduch E, Lindsay MR, Le Lièpvre X, Thiele C, Ferré P, etal Cholesterol-induced caveolin targeting to lipid droplets in adipocytes. a role for caveolar endocytosis. Traffic. 2006;7((5)):549–561. doi: 10.1111/j.1600-0854.2006.00406.x. [DOI] [PubMed] [Google Scholar]
- 91.Listenberger LL, Ostermeyer-Fay AG, Goldberg EB, Brown WJ, Brown DA. Adipocyte differentiation-related protein reduces the lipid droplet association of adipose triglyceride lipase and slows triacylglycerol turnover. J Lipid Res. 2007;48((12)):2751–2761. doi: 10.1194/jlr.M700359-JLR200. [DOI] [PubMed] [Google Scholar]
- 92.Wu JC, Merlino G, Fausto N. Establishment and characterization of differentiated, nontransformed hepatocyte cell lines derived from mice transgenic for transforming growth factor alpha. Proc Natl Acad Sci USA. 1994;91((2)):674–678. doi: 10.1073/pnas.91.2.674. [DOI] [PMC free article] [PubMed] [Google Scholar]
- 93.Nakabayashi H, Taketa K, Miyano K, Yamane T, Sato J. Growth of human hepatoma cells lines with differentiated functions in chemically defined medium. Cancer Res. 1982;42((9)):3858–3863. [PubMed] [Google Scholar]
- 94.Schwartz AL, Fridovich SE, Knowles BB, Lodish HF. Characterization of the asialoglycoprotein receptor in a continuous hepatoma line. J Biol Chem. 1981;256((17)):8878–8881. [PubMed] [Google Scholar]
- 95.Yahagi N, Shimano H, Hasegawa K, Ohashi K, Matsuzaka T, Najima Y, et al. Co-ordinate activation of lipogenic enzymes in hepatocellular carcinoma. Eur J Cancer. 2005;41((9)):1316–1322. doi: 10.1016/j.ejca.2004.12.037. [DOI] [PubMed] [Google Scholar]
- 96.de Alwis NM, Day CP. Non-alcoholic fatty liver disease: the mist gradually clears. J Hepatol. 2008;48((Suppl 1)):S104–S112. doi: 10.1016/j.jhep.2008.01.009. [DOI] [PubMed] [Google Scholar]
- 97.Pennings M, Meurs I, Ye D, Out R, Hoekstra M, Van Berkel TJ, et al. Regulation of cholesterol homeostasis in macrophages and consequences for atherosclerotic lesion development. FEBS Lett. 2006;580((23)):5588–5596. doi: 10.1016/j.febslet.2006.08.022. [DOI] [PubMed] [Google Scholar]
- 98.Guo Y, Walther TC, Rao M, Stuurman N, Goshima G, Terayama K, et al. Functional genomic screen reveals genes involved in lipid-droplet formation and utilization. Nature. 2008;453((7195)):657–661. doi: 10.1038/nature06928. [DOI] [PMC free article] [PubMed] [Google Scholar]
- 99.Beller M, Sztalryd C, Southall N, Bell M, Jäckle H, Auld DS, et al. COPI complex is a regulator of lipid homeostasis. PLoS Biol. 2008;6((11)):e292. doi: 10.1371/journal.pbio.0060292. [DOI] [PMC free article] [PubMed] [Google Scholar]
- 100.Szymanski KM, Binns D, Bartz R, Grishin NV, Li WP, Agarwal AK, et al. The lipodystrophy protein seipin is found at endoplasmic reticulum lipid droplet junctions and is important for droplet morphology. Proc Natl Acad Sci USA. 2007;104((52)):20890–20895. doi: 10.1073/pnas.0704154104. [DOI] [PMC free article] [PubMed] [Google Scholar]