

Abstract
It is widely recognized that key positions throughout a protein’s structure contribute unequally to function. In light of recent studies that suggest protein dynamics are required for function, a number of these residues may serve to promote motions required for ligand binding and catalysis. In the present NMR study, the conformational dynamics of the dihydrofolate reductase (DHFR) mutant M42W, in the presence of methotrexate and NADPH, are characterized and compared to the wild-type enzyme. M42 is distal to the active site, yet the M42W substitution regulates catalysis and ligand affinity, and is therefore analogous to an allosteric modulator of DHFR function. To gain understanding of how this mutation regulates activity, we employ a “pandynamic” strategy by measuring conformational fluctuations of backbone amide and side-chain methyl groups on multiple timescales. Changes in ps-ns dynamics indicate that the mutational effects are propagated throughout a network of interacting residues within DHFR, consistent with a role for M42 as a dynamic communication hub. On the μs-ms timescale, mutation increases the rate of switching in the catalytic core. Mutation also introduces switching in the adenosine binding subdomain that occurs at a higher frequency than in the catalytic core, and which correlates with the rate of product release for M42W-DHFR. Finally, a structurally inferred analysis of side-chain dynamics suggests that the M42W mutation dampens motional contributions from non-local effects. These data show that the M42W mutation alters the dynamics of DHFR and are consistent with theoretical analysis that suggests the mutation disrupts motion that promotes catalysis.
Conformational dynamics are intimately linked to highly evolved processes such as ligand binding, catalysis and product release (1-4). Therefore, it is likely that conserved amino acids contribute to these motions on multiple timescales (5-7). To test this hypothesis, we have systematically examined the dynamics of E. coli dihydrofolate reductase (DHFR) M42W (methionine 42 to tryptophan mutant) using state-of-the-art nuclear magnetic resonance (NMR) spin relaxation techniques. M42 is highly conserved among bacterial DHFRs and amino acid substitutions at position 42 alter every aspect of the catalytic cycle (8-11).
DHFR has long served as a model system for examining the relationships between enzyme sequence, structure and function (for a review see (1)). DHFR catalyzes the NADPH dependent reduction of 7,8-dihydrofolate to 5,6,7,8-tetrahydrofolate, a metabolic precursor of purine bases and certain amino acids. It is a monomeric enzyme composed of 159 amino acids that can be divided into two subdomains: the adenosine binding domain and the loops domain (Figure 1A) (2). Structural analysis indicates DHFR cycles between two distinct, ligand dependent structural states termed “closed” and “occluded” in reference to the conformation of the Met20 loop (2). In the closed conformation, substrate and cofactor are positioned within the active site poised for catalysis, whereas in the occluded conformation the Met20 loop blocks cofactor access to the reactive center. The rate of exchange between these conformational states correlates with the rate of catalysis and product release, suggesting a dynamic mechanism for enzyme function (3, 14).
Figure 1.

M42W-DHFR in complex with NADPH and MTX adopts the catalytic closed conformation. (A) The structure of DHFR in complex with MTX (orange) and NADPH (yellow) is shown in the closed conformation. The yellow sphere indicates M42 and the functional loops are labeled. DHFR is a single domain protein that can be divided in to two subdomains: the adensosine binding domain (gray) and the loops domain (blue). (B) Residual dipolar couplings indicate M42W-DHFR is in the closed conformation. Wild-type and M42W E:NADPH:MTX dipolar couplings are plotted. The Q-factors for the closed (PDB: 1rx3) and occluded (PDB:1rx5) complexes are shown in the correlation plot.
One of the most interesting and well-known features of DHFR is that its kinetics can be modulated by distal mutations, such as M42W (8, 9, 11). As shown in Figure 1A, M42 is located in the hydrophobic core of the adenosine binding subdomain, approximately 10 Å from the reactive center and 14 Å from the “catalytic residue”, D27. M42W drastically decreases the rate of hydride transfer and increases the rate of product dissociation, making chemistry the rate-limiting step of catalysis (3). Furthermore, the mutation introduces a catalytically significant structural prearrangement step into the reaction cycle (3). Thus, M42W can be thought of as a long-range effector, analogous to an allosteric regulator of DHFR catalysis.
If dynamical fluctuations are required for enzyme catalysis, it is to be expected that kinetically significant mutations modulate these motions (2, 15). Molecular dynamics simulations of M42W-DHFR indicate the dynamics within the closed conformation are indeed altered (4). Specifically, the mutation disrupts a network of coordinated motion that promotes hydride transfer (8, 17). Unfortunately, the exact mechanism by which the distal perturbation is transferred to the active site remains unknown and experimental data addressing this problem is sparse.
We have previously shown that perturbation within the active site of DHFR is propagated to distal regions of the protein, including the adenosine binding subdomain that contains M42 (5). In that study we reported the subnanosecond and micro- to millisecond dynamics of DHFR in response to binding the drugs methotrexate (MTX) or trimethoprim (TMP) to the wild-type holoenzyme (WT:NADPH). Changes in NMR derived backbone and side-chain ps-ns order parameters indicated that long-range dynamics are influenced by ligand binding (5). Concurrently, conformational switching on the micro- to millisecond timescale is quenched by drug binding. In essence, the conformational dynamics within the closed ground state and the transition into higher energy states are controlled by molecular interactions within the active site (5).
In this report, we turn our attention to changes in DHFR dynamics related to the M42W mutation. While other mutations such as M42F alter the rate of catalysis (koff), the M42W substitution is the only mutation that alters the rate of hydride transfer (3, 6). Thus, this model system provides a unique opportunity to study the dynamics that may lead to decreasing the rate of chemistry. Using NMR spin relaxation methods, we examine the ps-ns and μs-ms dynamics of M42W-DHFR in complex with NADPH and MTX, using both backbone and side-chain groups as probes. This “pandynamic” approach takes full advantage of the excellent sensitivity of NMR spectroscopy to molecular motion on different timescales and for different types of atomic groups. Comparison to the wild-type ternary complex provides a detailed map of changes in motion due to mutation. Furthermore, because the ternary MTX complex is a mimic for the transition state (2), the observed dynamic changes may be particularly relevant to catalysis. We find that the mutation modulates backbone and side-chain dynamics within the adenosine binding domain but also in the active site and loops domain. We also present an analysis that suggests M42W attenuates non-local influence on the ps-ns dynamics of the enzyme. Finally, the mutation changes the rate of μs-ms conformational switching within the catalytic core and introduces an additional slow motional mode on the same timescale as product release observed in the M42W enzyme. Taken together, these results suggest that M42 acts as a dynamic hub, connecting the loops and adenosine binding subdomains, and that manipulation of these interactions may modulate function. Our data supports the hypothesis that M42W changes the rate of hydride transfer and product release by modulating DHFR’s highly evolved conformational fluctuations (8, 11, 16, 19).
Materials and Methods
Protein purification and NMR sample preparation
The M42W mutation was performed using the QuickChange Mutagenesis Protocol (Stratagene). Plasmid DNA was sequenced at the UNC Genomic Analysis Facility. Either Isotopically labeled M42W-DHFR was expressed and purified using the same protocol as the wild-type protein discussed elsewhere (5). 15N-labeled protein (no deuteration) was used for the CPMG relaxation dispersion experiments. The concentration of M42W-DHFR was assayed spectrophotometrically (ε280 = 34,100 M-1cm-1 (6)).
All NMR experiments were performed on 1 mM protein samples in buffer containing 70 mM HEPES pH 7.6, 20 mM KCl, 1 mM EDTA, 1 mM DTT, 20 mM NADPH, 3-5 mM MTX, 20 mM glucose-6-phosphate, and 10 U glucose-6-phosphate dehydrogenase. The concentrations of NADPH and MTX were determined spectrophotometrically using published extinction coefficients (7). The protein samples were placed in an amber NMR tube and flame sealed under argon.
NMR Experiments
All NMR experiments were performed at 298 K (calibrated with neat methanol) on Varian INOVA spectrometers. Backbone Cβ, Cα, N, and H chemical shifts for non-proline residues were assigned using gradient-enhanced HNCACB, CBCA(CO)NH, and HNCA experiments collected at 500 MHz (8). Side-chain methyl resonances were assigned using the 3D HCCH3-TOCSY experiment (9). Methionine resonances were assigned based on the wild-type chemical shifts (5). NMR data were processed using NMRPipe and analyzed using NMRDraw (10) and NMRView (11) software packages. The PINE software aided backbone resonance assignments (12).
Relaxation dispersion measurements were carried out using 15N CPMG based relaxation dispersion pulse sequences (13) on 500 and 700 MHz spectrometers equipped with cryogenic probes. Fifteen relaxation time points, including two duplicate planes, were collected at CPMG field strengths (1/τ) ranging from 100 to 1800 s-1. A reference experiment omitting the 40 ms constant time relaxation period was also collected in order to calculate the effective R2 values (14).
Standard backbone 15N R1, R2, and {1H}-15N NOE (15) and side-chain Dz and Dy (16) relaxation spectra were acquired as described previously (5). Backbone relaxation was performed at 500 and 600 MHz whereas side-chain relaxation experiments were performed at 600 and 700 MHz.
Residual Dipolar Coupling Analysis
Residual dipolar couplings were measured using the 2D IPAP-HSQC experiment at 500 MHz (17). M42W-DHFR was aligned using a stretched acrylamide gel (18) as described previously (5). Peak positions in the IPAP-HSQC experiment were extracted using the NMRPipe modules ipap.tcl and nlinLS (10). Dipolar coupling values were calculated by subtracting the isotropic and anisotropic coupling values. Quality factors (Q) were calculated using the program REDCAT (19). All residues for which RDCs could be calculated were included in Q calculations, except position 22, which typically is in large disagreement with the crystal structures used.
Lipari-Szabo model-free analysis
Ps-ns backbone amide and side-chain methyl dynamics were characterized using the Lipari-Szabo model-free formalism (20). Consistent with wild-type DHFR, the isotropic rotational correlation time for M42W-DHFR is 10.2 ns. Rotational anisotropy was calculated using the local Di method (21) using the DHFR structure 1rx3. The backbone relaxation data was fit using an anisotropic correction (D║/D┴ = 1.14) to minimize model selection error (22). Backbone relaxation data were best-fitted to the five model-free models using the in-house program relxn2.2 assuming a 1.02 Å 1H-15N bond distance and -170 ppm 15N chemical shift anisotropy. The correct model was selected using Akaike’s information criterion (23). Side-chain model-free parameters were best fitted using relxn2.2 assuming a quadrapolar coupling constant of 165 kHz.
Relaxation Dispersion Analysis
Conformational exchange on the μs-ms timescale results in a change in R2eff as a function of τcp. Only residues that display an overall change in R2,eff greater than 2 s-1 were analyzed. Relaxation dispersion data were best fitted to models assuming no conformational exchange (R2,eff = R20) and a simple two-state model. A statistical F-test was used to identify residues that exhibit chemical exchange (alpha critical = 0.01). Residues that did not pass the F-test were removed from the data set. As previously described by our group and others, residues 129-134 and 155-159 in DHFR report on ligand independent conformational exchange (3, 14, 18). These residues were not considered in any global fit reported herein. The effective R2 rates as a function of τcp-1 were best fitted to the Carver-Richards equation for two-state exchange (24) using the in-house program exrate2.0, as described previously (5). The Bayesian information criterion (23) was used to group values for global fitting.
Statistical hypothesis testing and comparison with calculated order parameters
Fisher’s exact test was used for contingency table analysis (25). The p-value was calculated using the fisher.test routine implemented in R version 2.7.1 (http://www.r-project.org).
S2model values were calculated using the on-line server (http://spinportal.magnet.fsu.edu/methylsidechains2/methylsidechains2.html) provided by Brüschweiler and coworkers (26) using the crystal structure 1rx3 (WT:NADPH:MTX). Calculations performed using the structures 1rx1 (WT:NADPH) and 1rx2 (WT:NADP+:folate) resulted in nearly identical results (data not shown). Correlation coefficients were calculated using Excel 2003 (Microsoft Inc.). Fisher’s r to z transform (equations 1 and 2) was used to compare two correlation coefficients.
| (1) |
| (2) |
In this case we were interested in testing the hypothesis H0: r1 = r2, Ha: r1 > r2. Therefore, a one-tailed p-value is appropriate and was calculated from the derived z-score using the R function pnorm.
Results
The ternary M42W-DHFR complex adopts the closed conformation in solution
As shown in Figure 1A, methionine 42 is located in the hydrophobic core of the protein and is highly conserved among bacterial DHFRs (8, 40). The van der Waals volume of the tryptophan side chain is ~30 Å3 larger than methionine, making it pertinent to examine the structural consequences of M42W. Backbone residual dipolar couplings are a powerful tool to assess structural perturbations caused by point mutations (27). The mutant and wild-type RDCs are linearly correlated (R2 = 0.96) indicating very little if any structural rearrangement occurs upon mutation (Figure 1B). The “quality factor” Q presented by Bax and coworkers (28) provides a metric for comparing the experimental RDCs to the crystal structures for “closed” and “occluded” DHFR (PDB 1rx3 and 1rx5, respectively). The results indicate the overall structure of M42W-DHFR is similar to the closed crystal structure (Q = 0.29). By comparison, Q = 0.44 when the experimental data is compared to a model of the occluded structure.
The possibility remains that the low Q value obtained for the “closed” model does not reflect the actual level of structural rearrangement around the point of mutation. One could easily envision a situation in which structural perturbation within the adenosine binding subdomain is masked in the global Q value by high agreement in the loops subdomain. To examine this scenario, the RDCs were separated into two groups: residues in the adenosine binding subdomain (38-107) and loops domain (1-37, 108-159) (2). Q-values were calculated for both subdomains using the same alignment tensor. It should be mentioned that the alignment tensor does not significantly change if we consider the adenosine binding and loops subdomains as individual bodies (data not shown). We find that the Q value for the adenosine binding subdomain agrees very well with the crystal structure (Q = 0.25). Furthermore, the agreement is better for the adenosine binding subdomain than for the loops subdomain (Q = 0.33). From this analysis, we can conclude the backbone structure of DHFR is generally not perturbed by the M42W mutation.
Lipari-Szabo analysis of backbone ps-ns dynamics
The backbone dynamics of the ternary M42W complex were measured using 15N R1, R2, and {1H}-15N steady state NOE parameters (15) at 1H spectrometer frequencies of 500 and 600 MHz. The relaxation data were interpreted using the Lipari-Szabo model-free formalism, which yields a generalized order parameter (S2) and internal correlation time (τe) for each residue (20). The S2 can range from 0 to 1 indicating completely isotropic or fixed dynamics of the bond vector, respectively. Model-free parameters were calculated for 112 of the 148 non-proline residues in M42W-DHFR. AIC statistics (23) were used to identify residues that require an additional term (Rex) to compensate for elevated R2 rates due to conformational exchange (μs-ms dynamics) or an extended model that accounts for slower nanosecond motion requiring a fast (S2f) and slow (S2s) order parameter (Model 5) (29). These results are summarized in Figure 2A and the supplemental information (Table S1). M42W increases the number of residues that require Rex to fit the data: 26 compared to 12 in the wild-type MTX ternary complex (5). The presence of increased slower motion (μs-ms) is confirmed by inspecting the outliers in a R1R2 plot (30). As shown in Figure 2B, residues between 32-40 and 46-50 generally have elevated R1R2 values compared to wild type. Most of the backbone relaxation is satisfactorily described by model-free parameterization with the exceptions of K32, L36, D37 and E129. In each case, model 5 (S2f, S2s, τe) was statistically selected but the obvious presence of elevated R2 rates precluded reliable fits of the data. Therefore, we conclude the motion in these regions is complex and cannot be satisfactorily described by Lipari-Szabo model-free.
Figure 2.
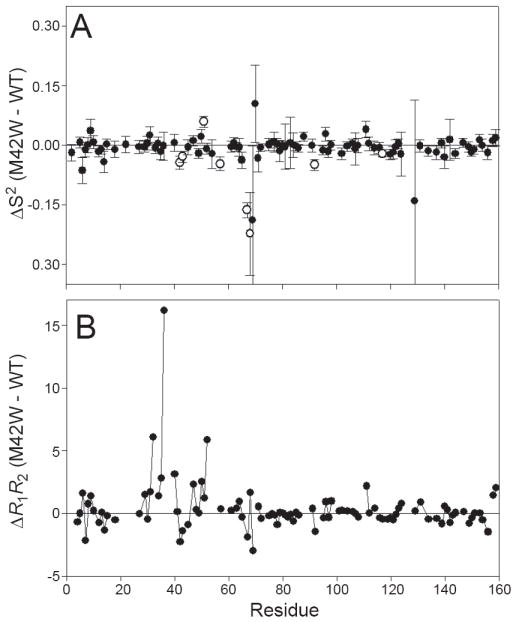
The changes in backbone dynamics indicate ps-ns and μs-ms dynamical perturbation. (A) The change in backbone order parameter as a result of the M42W mutation are plotted. Residues that exibit significant change in order parameter are indicated by the open circle. (B) R1R2 is sensitive to exchange on the micro to millisecond timescale. The difference in R1R2 between the M42W and wild-type DHFR:NADPH:MTX are plotted. Residues with increased conformational exchange are indicated by increase ΔR1R2 values.
As shown in Figure 2A, the average difference between mutant and wild-type backbone order parameters is near zero, indicating the mutation does not drastically alter the overall ps-ns backbone dynamics of DHFR. Residues W42, G43, G51, R57, G67, T68, V92 and A117 display differences that are greater than or equal to twice the experimental error (≥95% confidence interval) and therefore exhibit significant changes in backbone motion. It is intriguing to note that residues G67 and T68 located in the adenosine-binding loop, which exhibit the largest change in backbone dynamics, are ~15 Å (Cα to Cα) away from M42. Residues 67-69 show slight dynamic response to binding MTX to the wild-type holoenzyme (5) and mutation within the adenosine binding loop alters the rate of catalysis (31). Thus, the data suggests that M42 is part of a dynamic network of interactions that link the active site to the adenosine-binding loop (45-47).
Ps-ns side-chain methyl dynamics
The dynamics of methyl containing side chains were quantified using deuterium based relaxation methods. The Dz and Dy relaxation rates (16) were measured at 1H spectrometer frequencies of 600 and 700 MHz. Analogous to the backbone dynamics measurements, the side-chain order parameter, S2axis, reports on the rigidity of the methyl symmetry axis (32). Reliable order parameters were obtained for every resolved resonance except residues 54 and 110. For both of these residues, the resonances were extremely broad, indicative of conformational exchange. The results are summarized in Figure 3 and the supplemental information (Table S2).
Figure 3.
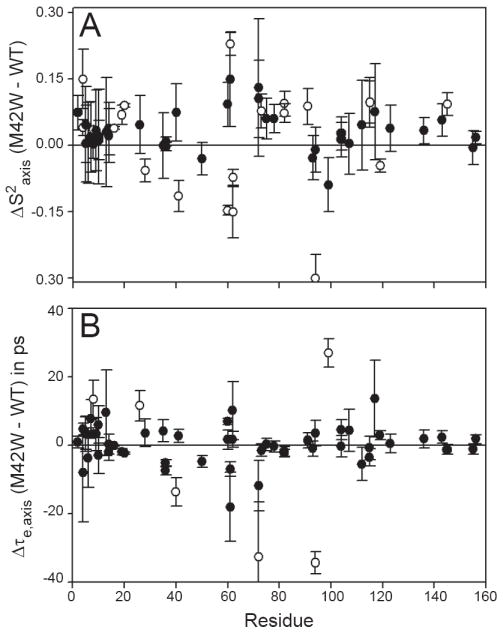
Changes in side-chain methyl dynamic indicate widespread perturbation. (A) The change in amplitude of ps-ns side-chain dynamics (ΔS2axis) are plotted. Residues that experience significant dynamical perturbation are indicated by the open circle. (B) The internal correlation time for side-chain methyl groups is robustly defined and can be interpreted as a change in dynamics. The open circles indicate residues that change 2x the propagated error and greater than 10 ps.
In order to evaluate the magnitude of perturbation that results from the M42W mutation, changes in methyl S2axis were calculated (ΔS2axis = S2axisM42W − S2axisWT). As with the backbone ΔS2 analysis, significant changes were identified as absolute ΔS2axis values equal to or greater than twice the propagated error. Methyl groups L4δ1 and δ2, L8δ2, M16ε, A19β, M20ε, I61δ1, T73γ2, I82δ1 and γ2, I91γ2, I115δ1, A145β become more rigid and L28δ1, I41δ1, I60δ1, L62δ1 and 2, and I94δ1 become more flexible upon mutation (Figure 3A). The largest change in S2axis occurs at I94δ1 (ΔS2axis = -0.3) which is located within the active site of DHFR. The average ΔS2axis is near zero, indicating the overall conformational entropy does not change as a result of the mutation. The internal correlation time (τe,axis) is robustly defined in the analysis of side-chain relaxation data and can be interpreted as a change in the dynamic character of the amino acid (1, 49). As shown in Figure 3B, methyl groups L8δ1, A26β, V72γ1, I94γ2, and V99γ2 exhibit statistically significant Δτe,axis.
M42W elicits a long-range dynamic response within DHFR. As shown in Figure 4A, significant ΔS2axis values cannot be rationalized by distance with respect the mutation alone, although a general trend of larger perturbation at shorter distance does exist. For example, while I94δ1 is less than 5 Å from M42 (ΔS2axis = -0.3 ± 0.06), A145β is 30 Å from the site of mutation and becomes more rigid by 0.092 ± 0.026. In the same light, I50δ1 (ΔS2axis = -0.03 ± 0.03) does not significantly change in spite of being proximal (< 5 Å) to the point of mutation. Furthermore, the dynamical change does not correlate with the change in methyl chemical shift (Figure 4B) (33). On an individual basis, as with distance from the point of mutation, chemical shift change is not a reliable predictor of ΔS2axis. These results are not altogether surprising because distance and chemical shift change are largely dependent on structural factors within the protein. S2axis values report only on the dynamics at a particular methyl group (32). Moreover, the data suggests that dynamic changes can be propagated in the absence of structural perturbation, supporting a dynamic mechanism for intramolecular communication or allostery without structural change (51-54)
Figure 4.
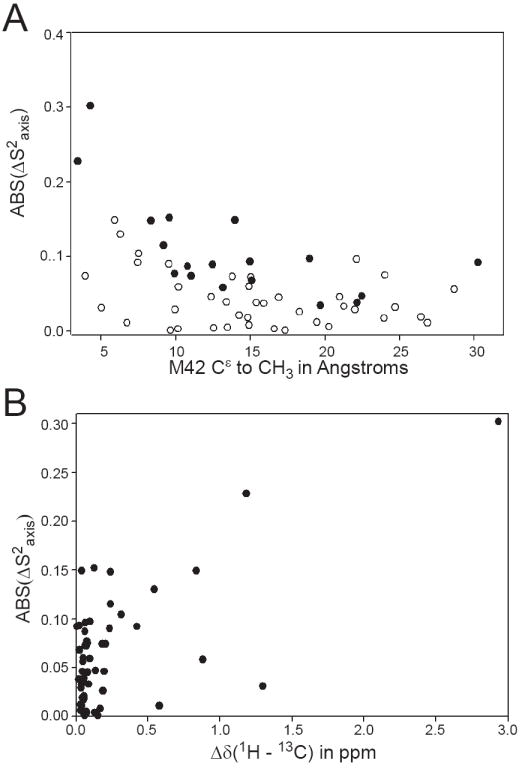
Dynamical perturbation as a result of M42W are largely independent of distance from the mutation and structural perturbation. (A) The absolute change in the S2axis as a function of distance from the mutation are plotted. Closed circles indicate significant change in ps-ns methyl dynamics (see Figure 3). (B) The change in S2axis does not correlated with the change in methyl chemical shift upon mutation. Structural perturbation is the necessarily a prerequisite for dynamical perturbation. The change in methyl chemical shift was calculated using a Euclidean distance (41).
μs-ms conformational switching in the M42W-DHFR ternary complex: introduction of new motion
The μs-ms conformational dynamics of M42W-DHFR were measured using relaxation compensated CPMG experiments (13). Whereas Lipari-Szabo model-free analysis typically probes the internal dynamics within a single conformational basin, relaxation dispersion quantifies the exchange between two or more distinct conformations (24). The change in R2 as a function of CPMG field strength (τcp-1) is sensitive to the exchange rate (kex = k1 + k-1), change in chemical shift between conformations (Δω), and population of each state (pa or pb) (24). Often, relaxation dispersion data are fitted to a single “global” exchange rate and population (14). This assumption is justified since it is unlikely that two residues in the same region of the protein move at a vastly different rate as they are likely reporting on the same exchange event.
In M42W-DHFR bound to NADPH and MTX, 20 residues exhibit a significant change in R2 as a function of τcp. As shown in Figure 5, μs-ms exchange clusters in two main regions: the catalytic core of the protein (L8, A9, V10, R12, I14, W22, A29, W30, F31, K32, R33, N34, L104, Y111, and L112) and residues in the adenosine binding domain located “above” the (p-aminobenzoyl)glutamate (pABG) binding cleft (V40, T46, I50, R52, and L54) (2). The number of residues that display measurable conformational exchange in M42W:NADPH:MTX is twice that of the wild-type ternary drug complex at 298K (5). Clearly, M42W alters the pattern of resonances that experience R2 relaxation dispersion, or motion on the timescale of catalysis and ligand binding.
Figure 5.

Conformational exchange occurs in two distinct regions within M42W-DHFR. (A) The residues that have measurable R2 dispersion due to conformational exchange are indicated by spheres for the wild-type and M42W DHFR:NADPH:MTX complexes. For M42W, dispersion curves that are best fitted by kex of 4500 s-1 and 1100 s-1 are shown in orange and maroon, respectively. Wild-type dispersion curves were best fitted by kex of 430 s-1 (B) Sample relaxation dispersion curves (M42W complex) representative of the exchange in the pABG binding cleft (52.HN) and catalytic core (29.HN) are shown. Colors correlate with the rates described in (A) measured at a 1H spectrometer frequency of 700 MHz. The corresponding data collected at 500 MHz are shown in black.
It should be noted that the equilibrium dissociation constants for both NADPH and folate ligands are unaltered in the closed conformation of M42W-DHFR (3). For, the wild-type protein, the dissociation constants for NADPH and dihydrofolate are 0.34 and 0.33 μM, respectively (3, 7). By comparison, the equilibrium dissociation constants for M42W for NADPH and dihydrofolate are 0.27 and 0.43 μM , respectively, and MTX binds several orders of magnitude tighter (3). Relaxation dispersion experiments require that the excited state be populated between 1 – 5 % in solution. Given the experimental conditions (20 fold excess NADPH and 3-5 fold excess MTX), ligand exchange is an unlikely source of line broadening in the relaxation dispersion experiments. Thus, the most likely source of R2 dispersion is protein motion, or ligand fluctuation within the active site.
The best fitted exchange rates for individual dispersion curves cluster into two groups: one group characterized by rates ranging from 1000 to 2000 s-1 and one with rates ranging from 3000 to 5000 s-1 (Figure 5B). These two groups also localize into distinct areas of the protein: the catalytic core and the pABG binding cleft, respectively. These data were fit assuming one or two “global” kex values. Bayesion information criterion (BIC), a statistical method used for model selection (23), indicates the two-kex model is appropriate for M42W:NADPH:MTX and fits the data better than a single kex value, or even using individual (local) kex values for each R2 dispersion curve. These results are summarized in the supplemental information (Table S3).
The conformational dynamics within the catalytic core of M42W-DHFR appears to be slightly faster than in the wild-type ternary complex. Global catalytic core kex values were fitted to be 430 ± 150 s-1 (5) and 1200 ± 130 s-1 for wild-type and mutant complexes, respectively. This faster rate in the mutant protein is consistent with the observation that residues 14 and 22 display measurable exchange curves, whereas in the wild-type protein those resonances were too broad to accurately measure. The population of the excited state for both M42W-DHFR and the wild-type protein complex is 2%. It should be noted that, similar to the WT ternary complex (5), the Met20 loop does not appear to be switching to the occluded state based on the flat dispersion profile of G121, in addition to Δω values in Met20 loop residues that are different from those expected for the closed-to-occluded transition.
As discussed above, the exchange rate in the region above the pABG binding cleft (orange spheres, Figure 5) appears to be independent of the conformational switching in the catalytic core of M42W-DHFR. The dispersion curves were best fitted by a global exchange rate kex = 4500 ± 950 and an excited state population of 3%. Kinetic studies indicate M42W changes the rate of ligand binding and release (8, 9). Below, we discuss the switching rates observed here in comparison to product release.
Discussion
Intramolecular communication in DHFR
Fast motions on the ps-ns timescale arise from thermal fluctuations within a single, so-called ground-state conformational ensemble. As shown using RDC analysis, the structure of M42W-DHFR in complex with MTX and NADPH adopts a closed conformation. In essence, the ground states of M42W and WT DHFR:NADPH:MTX complexes are structurally identical, and therefore any ps-ns dynamical changes are indicative of altered motion without change in the conformational ensemble. While the structure is conserved, the ps-ns dynamics change throughout M42W-DHFR (Figure 6, S1).
Figure 6.
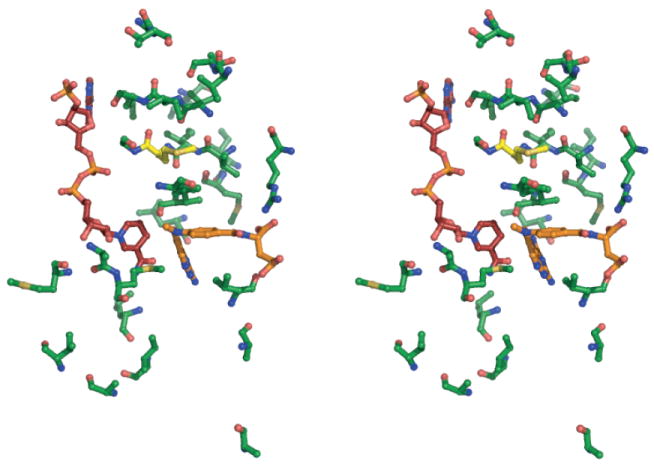
Stereo view of the network of dynamical perturbation as a result of the M42W mutation. MTX and NADPH are shown in orange and maroon, respectively. Residues that display significant change in backbone or side-chain dynamics are represented by green sticks. M42 is show in yellow.
As shown in Figure 2, the backbone ps-ns dynamics of G51 and R57 become more flexible. Both residues are located in the MTX (and dihydrofolate) binding pocket and R57 makes direct contact with the pABG “tail” of MTX (and dihydrofolate). Interestingly, residues 67 - 69 in the adenosine binding loop collectively become more flexible upon mutation (ΔS2 ~ -0.2). Binding MTX to the holoenzyme makes these residues become more rigid (5); thus, the adenosine binding loop is dynamically coupled to both the active site and M42. In the loops domain, small but significant changes in backbone dynamics at residue A117 indicate the M42W mutation is “felt” in the F-G loop, a region of the protein that is thermodynamically coupled to M42 (3). A larger number of dynamic perturbations are observed at methyl-containing side chains (Figure 3), even at sites far removed from position 42 (Figures 4, 6). These results are consistent with a “network of dynamically coupled” sites throughout DHFR (34).
Theoretical and experimental measurements suggest M42W modulates the rate of hydride transfer in part by changing the dynamics within the DHFR active site on timescales similar to those measured here (11, 16). Consistent with these observations, the data indicate motion within the active site of M42W is measurably different from the wild-type protein. Specifically, the side-chain methyl dynamics of residues M16, A19, M20, A26, L28, I94 and V99, in addition to the backbone dynamics of residue R57, are altered. These amino acids compose a majority of the folate binding pocket.
The structural distribution of ps-ns dynamic perturbation is shown in Figure 6. Clearly, the mutational effects span a large distance. As side-chain dynamics studies become more common, long-range dynamical perturbation due to ligand binding or mutation is becoming a common theme among vastly different proteins, suggesting an underlying dynamic connectivity within the protein scaffold and a potential mechanism for long-range communication (1, 50, 52, 53, 55, 56). However, the question remains as to whether these changes follow a recognizable pattern and thus serve as a conduit for transmitting information, or if they are random in nature. Fuentes and coworkers suggest the dynamical response is not random (35). The dynamical response due to ligand binding to a PDZ domain protein was strikingly similar to the network of “thermodynamically coupled” residues identified by Ranganathan and coworkers using sequence based statistical methods (36). In a later study, Fuentes et al. (33) discovered the entire “dynamic network” could be modified by mutating one of the coupled residues. These findings led the authors to suggest that ps-ns dynamics play a large role in intramolecular signal transduction (35). If this phenomenon is common to all proteins and not just to PDZ domains, one would expect to see similar behavior within DHFR.
Thirumalai and coworkers have identified several sites that encompass an “allostery wiring network” within E. coli DHFR using both chemical sequence entropy and statistical coupling analysis (40). M42 is contained within their “wiring network”. Therefore, we sought to determine whether the dynamic response observed here and sequence based networks exhibit significant overlap. As shown in Table 1, the categorical data (e.g. dynamic response or no response) is tabulated in a 2 × 2 matrix for statistical hypothesis testing. The null hypothesis is that no correlation exists between the dynamically perturbed residues (by M42W) and the sequence-derived network. Using Fisher’s exact test for hypothesis testing (25) we calculate p = 0.011, leading us to reject the null hypothesis. The p-value analysis indicates there is only a 1.1% chance the dynamical changes are not correlated with the allosteric wiring network within DHFR.
Table 1.
| Significant ΔS2axis | Insignificant ΔS2axis | Total | |
|---|---|---|---|
| In network | 12 | 4 | 16 |
| Not in network | 9 | 19 | 28 |
| Total | 21 | 23 | 44 |
Structurally inferred analysis of S2axis: Evidence for loss of correlated motion in M42W-DHFR
Protein dynamics on the ps-ns timescale are influenced by local (e.g. residue identity and packing) and non-local (e.g. correlated motions) factors (37). As discussed above, the distance from the point of mutation is a poor determinant for change in S2axis and the pattern of perturbation is not random. Here, we seek to illuminate the contribution that local (or non-local) interactions have on side-chain dynamics. Brüschweiler and coworkers have developed a model for predicting side-chain order parameters that accounts for local packing and amino acid type (26). We calculated the theoretical methyl order parameters (S2model) for wild-type DHFR:NADPH:MTX (PDB: 1rx3) and compared them to the wild-type and M42W S2axis values (Table 2). In principle, the strength of correlation can be degraded by differences in local structure or the influence of long-range correlated motions on S2axis, should they exist (38). If the order parameter values derive from local factors alone, the wild-type S2axis vs. S2model correlation should be significantly higher than the M42W S2axis vs. S2model correlation because S2model was calculated using a wild-type crystal structure (that does not account for changes in packing due to M42W).
Table 2.
Correlation between experimental and predicted S2axis
| Complex | rtotala (n)b | rloopsc (n)b | radc (n)b | p-valuee |
|---|---|---|---|---|
| M42W:NADPH:MTX | 0.80 (72) | 0.81 (43) | 0.77 (29) | N/A |
| WT:NADPH:MTX | 0.74 (69) | 0.82 (39) | 0.55 (30) | 7.2% |
| WT:NADPH | 0.73 (63) | 0.80 (36) | 0.55 (27) | 7.8% |
| WT:NADPH:TMP | 0.71 (63) | 0.81 (36) | 0.55 (27) | 7.8% |
| WT:NADP+:Folate | 0.70 (75) | 0.81 (40) | 0.48 (35) | 3.0% |
Pearson correlation coefficient between measured and predicted side-chain order parameters.
n is the number of S2axis values.
Correlation coefficient between experimental and calculated S2axis values in the loops domain
Correlation coefficient between experimental and calculated S2axis values for the adenosine binding domain.
The p-value is calculated by comparing rad(M42W:NADPH:MTX) to rad(WT Complex) for testing the hypothesis: H0: r1 = r2, Ha: r1 > r2
In total, five S2axis datasets corresponding to WT:NADPH (5), WT:NADPH:MTX (5), WT:NADPH:TMP (5), WT:NADP+:FOL (39), and M42W:NADPH:MTX (this work) were compared to S2model values. As shown in Table 2, the four wild-type complexes correlate reasonably well with the calculated values. Surprisingly, the M42W S2axis values correlate slightly better to the S2model values than do any of the wild-type datasets even though the wild-type structure was used to calculate S2model. To further examine the nature of the correlation, each dataset was separated into S2axis values representing the loops and adenosine binding subdomains. The correlation between S2axis and S2model values for the loops domain was nearly identical for each protein complex. However, a large difference in correlation was observed for the adenosine binding subdomain. As indicated by the larger rad value, S2axis values for the adenosine binding subdomain of M42W correlate much better to S2model values than any wild-type complex. It should be noted that these results are independent of the crystal structure used to calculate the order parameter, as S2model values for any “closed” DHFR structure are nearly identical (data not shown).
In order to determine whether the change in correlation within the adenosine binding domain is significant, we used Fisher’s r to z transform. This method enables measurement of the statistical significance in the difference between two given correlations. For each comparison (e.g. rad(M42W:NADPH:MTX) vs. rad(WT:NADPH:MTX)) we find between 3- to 8% probability that the difference in agreement between the mutant and wild-type protein could happen by chance (Table 2). Thus, the dynamics within the adenosine binding domain of M42W appear to be predicted better by local factors alone than the corresponding dynamics in the wild-type protein. This suggests that correlated motions (or more accurately, long-range determinants of side-chain motion) are reduced in the adenosine binding domain of M42W ternary complex, relative to wild-type, and that side-chain motions are dominated to a greater degree by local structural interactions (38).
Our analysis is consistent with high-level molecular dynamics simulations of wild-type and mutant DHFR performed by Brooks and coworkers (4), whoidentified several regions of correlated motion between the loops and adenosine binding subdomains. A mutation analogous to the one studied here (M42F) attenuated the long-range correlation (4). We propose M42 serves as a “hub” correlating long-range motion and the mutation severs the network of interactions linking the adenosine binding and loops subdomains.
M42W modulates dynamics on the timescale of catalysis and product release
In addition to decreasing the rate of hydride transfer, M42W changes the rates of ligand binding and dissociation (3). While the “artificial” ternary drug complex is not directly relevant to any of these steps, changes in μs-ms dynamics due to mutation may yield insight into mutant induced dynamical modulation. R2 relaxation dispersion experiments measure conformational dynamics on a timescale that is most directly relevant to catalysis and product release. Wright and coworkers have established a link between the rate of exchange measured by NMR and each step in the DHFR catalytic cycle (40). Our results show that M42W changes the rate of motion on the μs-ms timescale. We observe two distinct groups of residues that experience R2 dispersion in M42W-DHFR. Within the catalytic core of the protein, 15 residues show measureable exchange. As discussed above, the fitted exchange rate is slightly faster for the mutant protein. The forward rate (k1) is equal to ~20 s-1 as opposed to 10 s-1 in the wild type protein. In essence, the distal mutation allosterically regulates the conformational exchange within the active site of the protein by lowering the energy barrier between the ground and excited state species. As we have noted before, direct comparison of the chemical shifts in the MTX complex with other DHFR structural states is complicated by the presence of MTX around the exchanging residues (5). However, the linear correlation of fitted Δω values from comparable residues in the M42W and wild-type ternary drug complexes indicate the complexes sample similar conformations in the excited state (r = 0.93). While the rate is different, the structural identity of the high energy state within the wild-type and mutant DHFRs appears to be very similar.
A cluster of 5 residues lining the pABG binding cleft exhibit exchange on the μs-ms timescale in the mutant protein. The exchange rate is much faster and apparently unrelated to the conformational fluctuation within the catalytic core. The fitted exchange rate (4500 s-1) approaches the exchange regime where the Carver-Richards equation fails to separate pa and Δω. Nevertheless, a globally fitted value 3.3 ± 1.2% was obtained as a reasonable estimate of the population of the excited state, from which the forward rate of exchange is determined to be 80 – 250 s-1. Remarkably, this value correlates with the rate of tetrahydrofolate release from M42W-DHFR (175 s-1) (3). Thus, conformational switching in the pABG binding cleft may promote ejection of tetrahydrofolate from M42W-DHFR. Consistent with this possibility, the switching observed in this region, which lines the pABG binding cleft, corresponds to the same group of residues that show concerted switching in the wild-type product release complex (40). Further experiments will be required to examine the exact nature of the relationship between conformational exchange in M42W and the rate of catalytic cycling.
Conclusion
In this report, we present evidence from a variety of NMR relaxation data that the M42W mutation alters the dynamics of E. coli DHFR. The pandynamic strategy used allowed for NMR-detected dynamics to be linked with promotion of hydride transfer and correlated motions on the ps-ns timescale, as well as concerted switching to excited conformational states and product release on the μs-ms timescale. The M42W mutation redistributes conformational dynamics, altering motion in the active site and in regions of the protein that are known to be linked to catalysis. The data also indicate non-local structural factors play a larger role in the side-chain dynamics of the wild-type protein than in the mutant. This observation is consistent with recent findings that suggest side-chain dynamics are in part influenced by networks of correlated motions (38). The mutation may suppress these highly evolved correlated motions in DHFR. M42W increases the rate of μs-ms exchange in the core of DHFR and introduces a second faster exchange event on the adenosine binding subdomain. It is intriguing to note that the “fast” millisecond motion occurs on the same timescale as THF release providing additional support to the hypothesis that dynamics are important for modulating DHFR product release (40). We propose M42 acts as a dynamic hub in DHFR coordinating motion on multiple timescales. Disrupting these highly evolved dynamic interactions may be an effective method of allosterically modulating protein function.
Supplementary Material
Acknowledgments
The authors would like to thank Drs. Karl Koshlap (UNC Eshelman School of Pharmacy NMR Laboratory) and Greg Young (UNC Biomolecular NMR Facility) for their technical assistance; and members of the Lee Laboratory for invaluable discussion.
Abbreviations
- AIC
Akaike information criteria
- BIC
Bayesian information criteria
- CPMG
Carr–Purcell–Meiboom–Gill
- DHFR
dihydrofolate reductase
- M42W
methionine 42 to tryptophan mutation
- MTX
methotrexate
- μs-ms
microsecond-to-millisecond
- NADPH
nicotinamide adenine dinucleotide phosphate
- NMR
nuclear magnetic resonance
- NOE
nuclear Overhauser enhancement
- pABG
(p-aminobenzoyl)glutamate
- ps-ns
picosecond-to-nanosecond
- R1
spin-lattice (longitudinal) relaxation
- R2
spin-spin (transverse) relaxation
- RDCs
residual dipolar couplings
- S2
generalized order parameter
- S2axis
order parameter of methyl symmetry axis
- τe
effective correlation time
- τe, axis
effective correlation time of the methyl symmetry axis
- TMP
trimethoprim
- WT
wild-type
Footnotes
Supporting Information A figure showing every residue of DHFR in addition to those dynamically perturbed by M42W, backbone and side-chain order parameters and fitted relaxation dispersion rates are available free of charge at www.pubs.acs.org.
This work was funded by NIH grant GM083059 (to A.L.L.).
References
- 1.Schnell JR, Dyson HJ, Wright PE. Structure, dynamics, and catalytic function of dihydrofolate reductase. Annu Rev Biophys Biomol Struct. 2004;33:119–140. doi: 10.1146/annurev.biophys.33.110502.133613. [DOI] [PubMed] [Google Scholar]
- 2.Sawaya MR, Kraut J. Loop and subdomain movements in the mechanism of Escherichia coli dihydrofolate reductase: crystallographic evidence. Biochemistry. 1997;36:586–603. doi: 10.1021/bi962337c. [DOI] [PubMed] [Google Scholar]
- 3.Rajagopalan PT, Lutz S, Benkovic SJ. Coupling interactions of distal residues enhance dihydrofolate reductase catalysis: mutational effects on hydride transfer rates. Biochemistry. 2002;41:12618–12628. doi: 10.1021/bi026369d. [DOI] [PubMed] [Google Scholar]
- 4.Rod TH, Radkiewicz JL, Brooks CL., 3rd Correlated motion and the effect of distal mutations in dihydrofolate reductase. Proc Natl Acad Sci U S A. 2003;100:6980–6985. doi: 10.1073/pnas.1230801100. [DOI] [PMC free article] [PubMed] [Google Scholar]
- 5.Mauldin RV, Carroll MJ, Lee AL. Dynamic dysfunction in dihydrofolate reductase results from antifolate drug binding: modulation of dynamics within a structural state. Structure. 2009;17:386–394. doi: 10.1016/j.str.2009.01.005. [DOI] [PMC free article] [PubMed] [Google Scholar]
- 6.Ohmae E, Fukumizu Y, Iwakura M, Gekko K. Effects of mutation at methionine-42 of Escherichia coli dihydrofolate reductase on stability and function: implication of hydrophobic interactions. J Biochem. 2005;137:643–652. doi: 10.1093/jb/mvi079. [DOI] [PubMed] [Google Scholar]
- 7.Fierke CA, Johnson KA, Benkovic SJ. Construction and evaluation of the kinetic scheme associated with dihydrofolate reductase from Escherichia coli. Biochemistry. 1987;26:4085–4092. doi: 10.1021/bi00387a052. [DOI] [PubMed] [Google Scholar]
- 8.Muhandiram DR, Kay LE. Gradient-Enhanced Triple-Resonance Three-Dimensional NMR Experiments with Improved Sensitivity. Journal of Magnetic Resonance, Series B. 1994;103:203. [Google Scholar]
- 9.Uhrín D, Uhrínová S, Leadbeater C, Nairn J, Price NC, Barlow PN. 3D HCCH3-TOCSY for Resonance Assignment of Methyl-Containing Side Chains in 13C-Labeled Proteins. Journal of Magnetic Resonance. 2000;142:288. doi: 10.1006/jmre.1999.1951. [DOI] [PubMed] [Google Scholar]
- 10.Delaglio F, Grzesiek S, Vuister GW, Zhu G, Pfeifer J, Bax A. Nmrpipe - a Multidimensional Spectral Processing System Based on Unix Pipes. Journal of Biomolecular Nmr. 1995;6:277–293. doi: 10.1007/BF00197809. [DOI] [PubMed] [Google Scholar]
- 11.Johnson BA, Blevins RA. Nmr View - a Computer-Program for the Visualization and Analysis of Nmr Data. Journal of Biomolecular Nmr. 1994;4:603–614. doi: 10.1007/BF00404272. [DOI] [PubMed] [Google Scholar]
- 12.Eghbalnia HR, Bahrami A, Wang L, Assadi A, Markley JL. Probabilistic Identification of Spin Systems and their Assignments including Coil-Helix Inference as Output (PISTACHIO) J Biomol NMR. 2005;32:219–233. doi: 10.1007/s10858-005-7944-6. [DOI] [PubMed] [Google Scholar]
- 13.Loria JP, Rance M, Palmer AG. A Relaxation-Compensated Carr-Purcell-Meiboom-Gill Sequence for Characterizing Chemical Exchange by NMR Spectroscopy. J Am Chem Soc. 1999;121:2331–2332. [Google Scholar]
- 14.Mulder FA, Mittermaier A, Hon B, Dahlquist FW, Kay LE. Studying excited states of proteins by NMR spectroscopy. Nat Struct Biol. 2001;8:932–935. doi: 10.1038/nsb1101-932. [DOI] [PubMed] [Google Scholar]
- 15.Kay LE, Torchia DA, Bax A. Backbone dynamics of proteins as studied by 15N inverse detected heteronuclear NMR spectroscopy: application to staphylococcal nuclease. Biochemistry. 1989;28:8972–8979. doi: 10.1021/bi00449a003. [DOI] [PubMed] [Google Scholar]
- 16.Muhandiram DR, Yamazaki T, Sykes BD, Kay LE. Measurement of 2H T1 and T1.rho. Relaxation Times in Uniformly 13C-Labeled and Fractionally 2H-Labeled Proteins in Solution. Journal of the American Chemical Society. 1995;117:11536. [Google Scholar]
- 17.Ottiger M, Delaglio F, Bax A. Measurement ofJand Dipolar Couplings from Simplified Two-Dimensional NMR Spectra. Journal of Magnetic Resonance. 1998;131:373. doi: 10.1006/jmre.1998.1361. [DOI] [PubMed] [Google Scholar]
- 18.Chou JJ, Gaemers S, Howder B, Louis JM, Bax A. A simple apparatus for generating stretched polyacrylamide gels, yielding uniform alignment of proteins and detergent micelles. J Biomol NMR. 2001;21:377–382. doi: 10.1023/a:1013336502594. [DOI] [PubMed] [Google Scholar]
- 19.Valafar H, Prestegard JH. REDCAT: a residual dipolar coupling analysis tool. J Magn Reson. 2004;167:228–241. doi: 10.1016/j.jmr.2003.12.012. [DOI] [PubMed] [Google Scholar]
- 20.Lipari G, Szabo A. Model-free approach to the interpretation of nuclear magnetic resonance relaxation in macromolecules. 2. Analysis of experimental results. Journal of the American Chemical Society. 1982;104:4559. [Google Scholar]
- 21.Lee LK, Rance M, Chazin WJ, Palmer AG. Rotational diffusion anisotropy of proteins from simultaneous analysis of 15N and 13Cα nuclear spin relaxation. Journal of Biomolecular NMR. 1997;9:287. doi: 10.1023/a:1018631009583. [DOI] [PubMed] [Google Scholar]
- 22.Osborne MJ, Wright PE. Anisotropic rotational diffusion in model-free analysis for a ternary DHFR complex. J Biomol NMR. 2001;19:209–230. doi: 10.1023/a:1011283809984. [DOI] [PubMed] [Google Scholar]
- 23.d’Auvergne EJ, Gooley PR. The use of model selection in the model-free analysis of protein dynamics. J Biomol NMR. 2003;25:25–39. doi: 10.1023/a:1021902006114. [DOI] [PubMed] [Google Scholar]
- 24.Palmer AG, 3rd, Kroenke CD, Loria JP. Nuclear magnetic resonance methods for quantifying microsecond-to-millisecond motions in biological macromolecules. Methods Enzymol. 2001;339:204–238. doi: 10.1016/s0076-6879(01)39315-1. [DOI] [PubMed] [Google Scholar]
- 25.Fisher RA. On the Interpretation of χ<sup>2</sup> from Contingency Tables, and the Calculation of P. Journal of the Royal Statistical Society. 1922;85:87. [Google Scholar]
- 26.Ming D, Bruschweiler R. Prediction of methyl-side chain dynamics in proteins. J Biomol NMR. 2004;29:363–368. doi: 10.1023/B:JNMR.0000032612.70767.35. [DOI] [PubMed] [Google Scholar]
- 27.Clarkson MW, Gilmore SA, Edgell MH, Lee AL. Dynamic coupling and allosteric behavior in a nonallosteric protein. Biochemistry. 2006;45:7693–7699. doi: 10.1021/bi060652l. [DOI] [PMC free article] [PubMed] [Google Scholar]
- 28.Cornilescu G, Marquardt JL, Ottiger M, Bax A. Validation of Protein Structure from Anisotropic Carbonyl Chemical Shifts in a Dilute Liquid Crystalline Phase. J Am Chem Soc. 1998;120:6836–6837. [Google Scholar]
- 29.Mandel AM, Akke M, Palmer AG., 3rd Backbone dynamics of Escherichia coli ribonuclease HI: correlations with structure and function in an active enzyme. J Mol Biol. 1995;246:144–163. doi: 10.1006/jmbi.1994.0073. [DOI] [PubMed] [Google Scholar]
- 30.Kneller JM, Lu M, Bracken C. An effective method for the discrimination of motional anisotropy and chemical exchange. J Am Chem Soc. 2002;124:1852–1853. doi: 10.1021/ja017461k. [DOI] [PubMed] [Google Scholar]
- 31.Ohmae E, Iriyama K, Ichihara S, Gekko K. Effects of point mutations at the flexible loop glycine-67 of Escherichia coli dihydrofolate reductase on its stability and function. J Biochem. 1996;119:703–710. doi: 10.1093/oxfordjournals.jbchem.a021299. [DOI] [PubMed] [Google Scholar]
- 32.Igumenova TI, Frederick KK, Wand AJ. Characterization of the fast dynamics of protein amino acid side chains using NMR relaxation in solution. Chem Rev. 2006;106:1672–1699. doi: 10.1021/cr040422h. [DOI] [PMC free article] [PubMed] [Google Scholar]
- 33.Fuentes EJ, Gilmore SA, Mauldin RV, Lee AL. Evaluation of energetic and dynamic coupling networks in a PDZ domain protein. J Mol Biol. 2006;364:337–351. doi: 10.1016/j.jmb.2006.08.076. [DOI] [PubMed] [Google Scholar]
- 34.Agarwal PK, Billeter SR, Rajagopalan PT, Benkovic SJ, Hammes-Schiffer S. Network of coupled promoting motions in enzyme catalysis. Proc Natl Acad Sci U S A. 2002;99:2794–2799. doi: 10.1073/pnas.052005999. [DOI] [PMC free article] [PubMed] [Google Scholar]
- 35.Fuentes EJ, Der CJ, Lee AL. Ligand-dependent dynamics and intramolecular signaling in a PDZ domain. J Mol Biol. 2004;335:1105–1115. doi: 10.1016/j.jmb.2003.11.010. [DOI] [PubMed] [Google Scholar]
- 36.Lockless SW, Ranganathan R. Evolutionarily conserved pathways of energetic connectivity in protein families. Science. 1999;286:295–299. doi: 10.1126/science.286.5438.295. [DOI] [PubMed] [Google Scholar]
- 37.Ichiye T, Karplus M. Collective motions in proteins: a covariance analysis of atomic fluctuations in molecular dynamics and normal mode simulations. Proteins. 1991;11:205–217. doi: 10.1002/prot.340110305. [DOI] [PubMed] [Google Scholar]
- 38.Law AB, Fuentes EJ, Lee AL. Conservation of side-chain dynamics within a protein family. J Am Chem Soc. 2009;131:6322–6323. doi: 10.1021/ja809915a. [DOI] [PMC free article] [PubMed] [Google Scholar]
- 39.Schnell JR, Dyson HJ, Wright PE. Effect of cofactor binding and loop conformation on side chain methyl dynamics in dihydrofolate reductase. Biochemistry. 2004;43:374–383. doi: 10.1021/bi035464z. [DOI] [PubMed] [Google Scholar]
- 40.Boehr DD, McElheny D, Dyson HJ, Wright PE. The dynamic energy landscape of dihydrofolate reductase catalysis. Science. 2006;313:1638–1642. doi: 10.1126/science.1130258. [DOI] [PubMed] [Google Scholar]
- 41.Schumann FH, Riepl H, Maurer T, Gronwald W, Neidig KP, Kalbitzer HR. Combined chemical shift changes and amino acid specific chemical shift mapping of protein-protein interactions. J Biomol NMR. 2007;39:275–289. doi: 10.1007/s10858-007-9197-z. [DOI] [PubMed] [Google Scholar]
Associated Data
This section collects any data citations, data availability statements, or supplementary materials included in this article.