

Abstract
Contrast in optical coherence tomography (OCT) images can be enhanced by utilizing surface plasmon resonant gold nanoparticles. To improve the poor in vivo transport of gold nanoparticles through biological barriers, an efficient delivery strategy is needed. In this study, the improved penetration and distribution of gold nanoparticles were achieved by microneedle and ultrasound, respectively, and it was demonstrated that this multimodal delivery of antibodyconjugated PEGylated gold nanoparticles enhanced the contrast in in vivo OCT images of oral dysplasia in a hamster model.
Keywords: optical coherence tomography, optical contrast agent, gold nanoparticles, enhanced delivery, ultrasound, microneedles
1 Introduction
The sensitive and specific detection of premalignant and malignant lesions is a crucial and indispensable prerequisite for optimal treatment outcome and prognosis. Surgical biopsy, which is currently the primary diagnostic tool, often causes patient anxiety and discomfort, undesirable side effects, and sampling errors. For example, multiple prostate biopsies miss up to 30% of cancer present at the time of biopsy.1-3 An urgent need exists to develop cost-effective, minimally invasive imaging technologies to identify premalignancy and malignancy with high sensitivity and specificity.4 Optical imaging tools such as reflectance confocal microscopy, optical coherence tomography (OCT), and optical coherence microscopy (OCM) are promising diagnostic tools for detecting cancer at an early stage.5 Optical imaging is particularly useful for in vivo applications because it uses near-infrared wavelengths (770 to 1300 nm) that avoid predominant absorption in tissue.6
OCT, which detects a reflected light source from the sample using refractive index mismatching, is particularly promising for early diagnosis of neoplasia because it provides resolution that is an order of magnitude higher than that of other minimally invasive diagnostic techniques such as computed tomography (CT), magnetic resonance imaging (MRI), and ultrasound (US).6,7 Real-time OCT imaging with ultrafast image acquisition can minimize the errors generated by patient and operator motion artifacts.8-12 Because OCT uses broadband light, 2-D and 3-D cross-sectional images of subsurface tissue can be reconstructed at a high resolution for various biological and medical applications.13,14 However, OCT-based early cancer detection is limited by the low contrast levels in biological tissues, particularly between normal and neoplastic tissues. Various approaches, including Doppler OCT,15-19 polarization-sensitive OCT,20-23 chemico-physical enhancers (e.g., absorbing dyes),24,25 and contrast agents26-29 have been explored to overcome this fundamental limitation of OCT. Little progress has been reported using contrast agents to enhance OCT images in vivo.27,30 The use of inorganic nanoparticles such as nanospheres,31-34 nanocages,35,36 nanoshells,37,38 and nanorods39,40 to overcome OCT limitations, in particular using surface plasmon resonance (SPR), has been investigated, but limited in vivo successes have been achieved compared with phantom studies and in vitro tests. Some of the limitations for the use of nanoparticles as OCT contrast agents include toxicity [e.g., in vivo toxicity of nanorods due to the indispensible use of cetyltrimethylammonium bromide (CTAB) during synthesis]41 and poor in vivo delivery and distribution.42
Gold nanoparticles (Au NPs) are promising in vivo OCT contrast agents because they are biocompatible, easy to synthesize, and functional with additional modalities. For example, Au NPs have been used in human rheumatoid arthritis treatment and microscopy at both low- and high-resolution levels as specific markers for a variety of macromolecules (e.g., polysaccharides, glycoproteins, proteins, lectins, and antibodies).43,44 In addition, Au NPs are attractive as OCT contrast agents because the optical resonance properties of Au NPs can be controlled over a broad range by tailoring their sizes and shapes.4,45-48 A crossover from a low (absorption dominant) to a high (scattering dominant) albedo of spherical Au NPs at an 80-nm diameter, which can be quantified by OCT, has been theoretically and experimentally proven.49
The efficient delivery of Au NPs is crucial to obtain a sufficient signal and a sensitivity-determining step. A topical administration of Au NPs is preferable because OCT can only image to an approximate depth of 2 mm in human soft tissues.50 A topical delivery can avoid adverse systemic effects while delivering a large quantity of Au NPs to the epithelial layers where many types of oral, skin, and gastrointestinal cancers develop. However, a supporting vasculature is poorly developed or not available.51 The penetration of Au NPs to subsurface epithelial layers is greatly hampered by various biological barriers such as the stratum corneum (SC), the 10- to 15-μm-thick outermost nonliving layer [Fig. 1(a)].52 In this study, we hypothesized that this obstacle to Au NP delivery for OCT imaging could be overcome by generating micropassages through the SC using microneedles (MNs), followed by the enhanced distribution of Au NPs in underlying epithelial layers through increased movements by ultrasonic forces (i.e., multimodal delivery) [Figs. 1(b) and 1(c)].53,54
Fig. 1.

Stratum corneum and underlying epithelial layers as biological barrier to Au NP transport. (b) Penetration of Au NPs into subsurface epithelial layers through a passage generated by a microneedle. (c) Enhanced Au NP distribution in tissue by ultrasonic force.
The purpose of this study was to improve the penetration and distribution of Au NPs using MNs and US and thereby enhance contrast in in vivo OCT images of oral dysplasia in a hamster model. Spherical Au NPs were prepared as previously reported55 and further conjugated with antiepidermal growth factor receptor (EGFR) monoclonal antibodies and polyethylene glycol (PEG), also as previously reported.56 Au NPs were applied topically with and without 300-μm-long MNs and US, in vivo to the hamster cheek pouch model, and the changes in OCT signals with the same focal point were quantified by intensity profiles.
2 Materials and Methods
2.1 Au NP Synthesis
Au NPs (71 nm in diameter) were prepared by the Frens method with modifications.55 A 71-nm-diameter Au NP (highly scattering dominant) was used as the OCT contrast agent because OCT detects backscattering signals from a sample.49 All glassware was cleaned in aqua regia (three parts HCl, one part HNO3), rinsed with deionized water, and then dried prior to use. Solutions of HAuCl4 ·3H2O (0.01% w/w, solution A) and Na3-citrate (1% w/w, solution B) were prepared, then 100 mL of solution A was heated to its boiling point and 0.6 mL of solution B was added with vigorous stirring. After 25 sec, the boiling solution turned dark blue followed by violet after 2 min of stirring. The solution was refluxed for an additional 15 min and allowed to cool down to room temperature with continuous stirring. The final concentration of 71-nm-diameter Au NPs was 2.19 × 10¹⁰ particles/mL. Particle sizes were determined using a Carl Zeiss Ultra 55 scanning electron microscope (SEM), Phillips CM20 transmission electron microscope (TEM), and Melvern Zetasizer dynamic light scattering (DLS) particle analyzer. The Au NP solution was kept at 4 °C.
2.2 Antibody Conjugation on Au NPs
Solutions of Au NPs were washed three times with deionized (DI) water using centrifugation at 8000 rpm (9230 g) for 30 min. Monoclonal antibodies (Clone 29.1.1, Sigma, St. Louis, MO) binding to EGFR, which is over-expressed in oral cancer, were conjugated on the Au NP surfaces using protocols published elsewhere56 with modification. Briefly, 1 mL of washed Au NP solution was diluted with 125 μL of 20-mM HEPES buffer (Fisher Scientific, Fair Lawn, NJ) and mixed with 30 μL of an anti-EGFR antibody-containing solution (1 mg/mL) in 70 μL of 20-mM HEPES. The pH of the solution was kept at 7.0■0.2 and stirred for 20 min. The final concentration of the antibody-conjugated Au NP solution was 1.78 × 10¹⁰ particles/mL, and the final volume was 1.225 mL. Then 200 μL of this solution was tested for a color change in the presence of 10 μL of 10% NaCl, since it is well known that NaCl induces Au NP aggregation and results in a change to the solution’s original color.57 Au NPs that are completely coated with antibodies do not coagulate, so a color change to dark blue indicates the Au NP surfaces are not saturated with antibodies.56 Finally, 200 μL of a 1% (w/v) PEG (MW=4000) solution (Fluka, Switzerland) in DI water was added, and the mixed solution was incubated for 10 min at room temperature while stirred. The solution was centrifuged at 8000 rpm (9230 g) for 10 min at room temperature, and the pellet was resuspended in 0.5 mL of phosphate buffered saline (Fisher Scientific, Fair Lawn, NJ).
2.3 In vivo Oral Cancer Model and Au NPs Delivery
For in vivo imaging, the standard hamster cheek pouch model was used, whereby the cheek pouch on one side of each golden Syrian hamster (Mesocricetus auratus) was treated topically with 0.5% (v/v) 9, 10-dimethyl-1,2-benzanthracene (DMBA, Sigma, St. Louis, MO) three times per week for five months to induce cancer. The contra-lateral side was used as control, with only mineral oil applied topically to the cheek pouch surface. The anesthetized hamster’s cheek pouch was attached to a microscope stage using a custom-built ring-shaped clamp that was rigidly fastened to the stage surface. CR3 roller microneedles (MTS dermaroller with miniscule holes of 70-μm diameter and 300-μm depth; Clinical Resolution Laboratory, Inc., Beverly Hills, CA) were rolled on both the DMBA-untreated and DMBA-treated sides of the hamster cheek pouches three times at three different angles (i.e., 0 deg, 45 deg, and 90 deg). Two hundred μL of the anti-EGFR antibody-conjugated PEGylated Au NP solution (1.78 × 10¹⁰ particles/mL) was applied to the hamster’s cheek pouch for 10 min by dropping it directly into the 1-cm-diameter aperture of the ring-shaped clamp. After the Au NP topical administration, 0.3 W/cm2 of 1-MHz ultrasonic force was applied to the cheek pouch using the Dynatron 125 ultrasonicator (Dynatronics Corporation, Salt Lake City, UT) for 1 min. The typical ultrasonic intensity range for diagnostic applications is 0.0001 to 0.5 W/cm2, and the 1-MHz frequency has been reported to be sufficient to facilitate NP dispersion into tissue by changing the diffusion coefficient (by factors of 2.6 to 15) of the tissue rather than partitioning (factors of 0.7 to 1.6).54,58
2.4 Setup of Spectral-Domain Optical Coherence Tomography
Spectral-domain optical coherence tomography (SD-OCT) is a high-speed, high-resolution, minimally invasive, crosssectional imaging technique based on a Michelson interferometer with four arms (Fig. 2). The source arm has a broadband light source with a 1310-nm center wavelength and a 90-nm FWHM. The detector arm has a spectrometer with a 0.13-nm spectral accuracy and a 7.7-kHz frame rate. An immobilized mirror is placed at the reference arm. A two-axis scanner with two galvanometers is located at the sample arm. Reflected light from the immobilized mirror and each scattering particle in a sample make a signal in the spectral domain that is detected by the spectrometer. When the path difference between the reference and sample arms is defined by 2y and the refractive index of the sample by n, the scattering event by each particle at a different depth y is encoded in the frequency 2ny of the cosine function, and the signal is a sum of the cosine functions with different y’s, where the amplitude of each cosine is proportional to the scattering amplitude. An inverse Fourier transformation of the signal in the spectral domain gives a complex signal in the y domain. The powers of peaks in the y domain represent the scattering amplitudes and are converted to grayscale to make an array of images along the y direction. While the two-axis scanner scans the xz plane, the array is acquired continuously to make a volume image. The current setup resolution is 8 μm (in air) depthwise and 13 μm laterally. Each pixel is 5 μm × 5 μm in tissue with a refractive index of 1.33. All the SD-OCT images were taken with the same focal point.
Fig. 2.
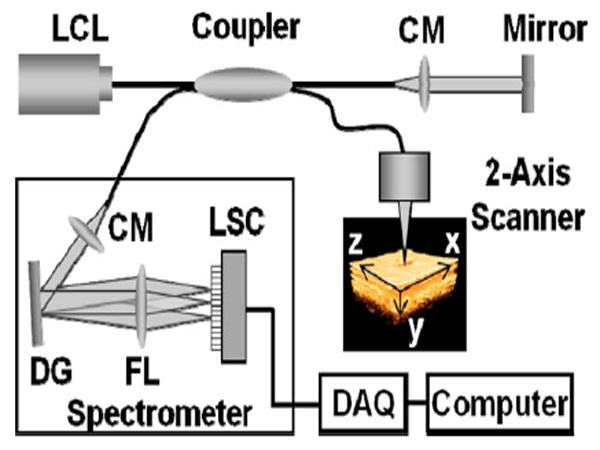
Schematic of a fiber-based SD-OCT in which the lowcoherence light has a 1310-nm center wavelength and 90-nm FWHM. A 130-nm-wide spectrum was sampled by a 1 × 1024 InGaAs detector array at 7.7 kHz. Imaging depth and depth resolution were 3.4 mm and 8 μm in air, respectively. A two-axis scanner with two galvanometers was used. CM: collimator; DAQ: data acquisition system; DG: diffraction grating; FL: focusing lens; LCL: low-coherence light; LSC: line scan camera.
2.5 Histology of Excised Tissues
The excised hamster cheek pouch tissues were fixed in Karnovsky 2% paraformaldehyde and 3% glutaraldehyde in 0.1-M cacodylate buffer overnight and then postfixed in 1% osmium tetroxide for 1 hr. The tissues were dehydrated in a graded series of ethanol solutions (30%, 50%, 70%, 90%, and 100%), then embedded in PolyBed® 812 (Polyscience, Inc., Warrington, PA) and polymerized at 60 °C for 2 days. Half-μm semi-thin sections were prepared using an ultra microtome and then stained with Richardson’s stain59 for visualization under an upright microscope (BH-2, Olympus, Tokyo, Japan) equipped with an Olympus Microfire digital camera. To confirm the lack of inflammatory response, MNs, topical delivery of Au NPs, and US were applied to the cheek pouches of DMBA-untreated hamsters. The cheek pouches were stained with hematoxylin and eosin (H&E) 40 days after the multimodal delivery of Au NPs.
3 Results and Discussion
The results shown in Fig. 3 clearly demonstrate that (1) Au NPs were able to penetrate deep into the tissue only when micropassages were provided by MNs (i.e., Au NP alone versus MN-Au NP and Au NP-US versus MN-Au NP-US for both DMBA-treated and DMBA-untreated tissues in Fig. 3); and (2) US-enhanced Au NP distribution throughout the tissues (i.e., Au NP alone versus Au NP-US and MN-Au NP versus MN-Au NP-US for both DMBA-treated and DMBAuntreated tissues in Fig. 3). In the SD-OCT images, the tissue layers were clearly visible, and the difference between epithelial micromorphologies of the carcinogen-treated and untreated tissues was clearly visible [Figs. 3(a) and 3(b)]. Scion Image software (Scion Corp., Frederick, MA) was used to obtain mean intensities for each SD-OCT image with 894 pixels (length) by 237 pixels (width). The mean intensity of normal tissue was increased by multimodal delivery of Au NPs from 46.64 to 69.25 (149% increased), and the mean intensity of DMBA-treated tissue was increased from 34.59 to 61.08 (177%), as shown in Figs. 3(a) and 3(b), respectively. The images shown in Figs. 3(a) and 3(b) were from the left and right cheek pouches of the same animal. The right cheek pouch was treated with DMBA for five months. In this standard model for oral carcinogenesis, neoplastic lesions will typically begin to develop after four to six weeks in the treated cheek pouch while the untreated cheek pouch is used as the control. However, this animal received the carcinogen for five months. While we had assumed that the untreated cheek pouch could still be used as a healthy control, our OCT images showed the unexpected development of dysplasia in the untreated cheek pouch (dotted box in Fig. 3), which was confirmed by subsequent histopathology.
Fig. 3.
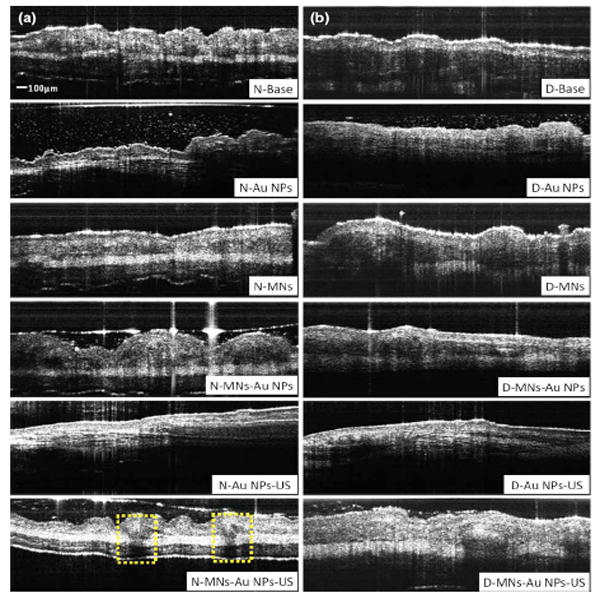
In vivo SD-OCT images of (a) normal (DMBA-untreated), and (b) DMBA-treated sides of hamster cheek pouches. MN = microneedle treated; Au NPs = gold nanoparticles administered; US = ultrasound applied.
OCT intensity profiles along with imaging depth were assessed to identify distinctive optical properties of the abnormal tissue (Fig. 4). Five SD-OCT intensity profiles, averaged over 5 pixels laterally, were taken from the SD-OCT image of dysplasia tissue shown in Fig. 4(a). Scion Image software was used for data processing. The actual SD-OCT image depth was calculated by converting the axial pixel number to actual scale by multiplying 5 μm for each pixel in the tissue by a refractive index of 1.33. Several quantitative OCT markers of dysplasia were also identified: (1) considerably greater light scattering in the SC and upper epithelial layers [red square in Fig. 4(b)]; (2) reduced optical signals in subsurface epithelial layers [green square in Fig. 4(b)]; and (3) relatively low OCT signals in underlying connective tissue layers [blue square in Fig. 4(b)].
Fig. 4.
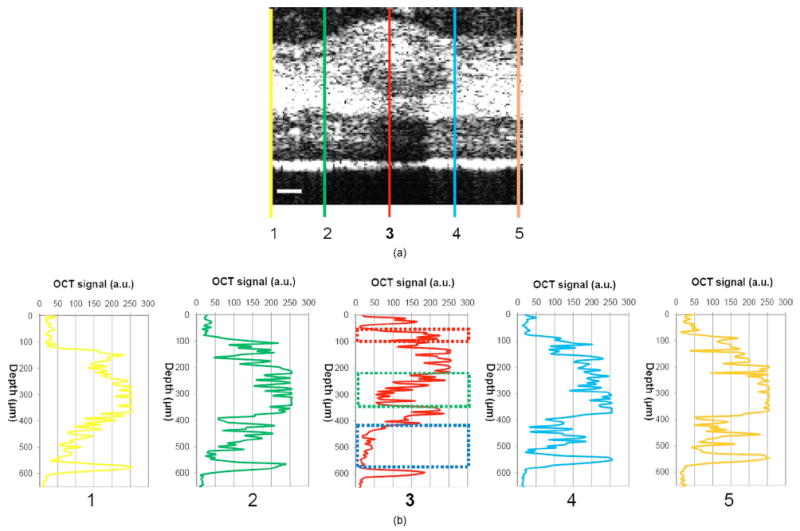
(a) Enlarged OCT image of dysplastic area. (b) Depth-resolved OCT signal profile in dysplastic and normal regions. Scale bar: 100 μm.
SD-OCT-based diagnoses (shown in Figs. 3 and 4) were verified by histological staining (Richardson’s stain)59 of the excised tissues. Figure 5 shows that Au NPs were dispersed along passages generated by the 300-μm-long MNs. Au NPs were dispersed homogeneously into the connective tissue [Fig. 5(a)] but not into the hamster cheek pouch muscle bundles [Fig. 5(b)]. This may be due to the presence of a muscle outer layer that prevented penetration of the Au NPs. The greater presence of Au NPs in connective tissue rather than muscle bundles, as indicated by strong backscattering signals (Figs. 3 and 4), was confirmed by histology. Interestingly, Au NPs were able to penetrate deeper through the epithelial layers in the premalignant region [dotted area in Fig. 6(a)] than in the normal region [Fig. 6(b)]. This finding explains the increased signals in the SC and upper epithelial layers in the early dysplasia region [red square in Fig. 4(b)]. Arrows in Fig. 6(a) indicate the disrupted epithelial layers of an early-stage dysplasia, thus demonstrating that mild dysplasia was differentiated from normal tissue by SD-OCT with enhanced Au NP distribution.
Fig. 5.
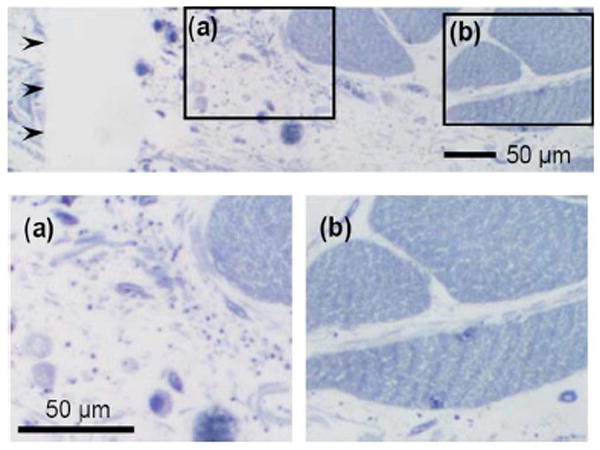
Au NPs in a hamster cheek pouch tissue after MN and US administration. Arrows indicate a MN passage in the tissue.
Fig. 6.
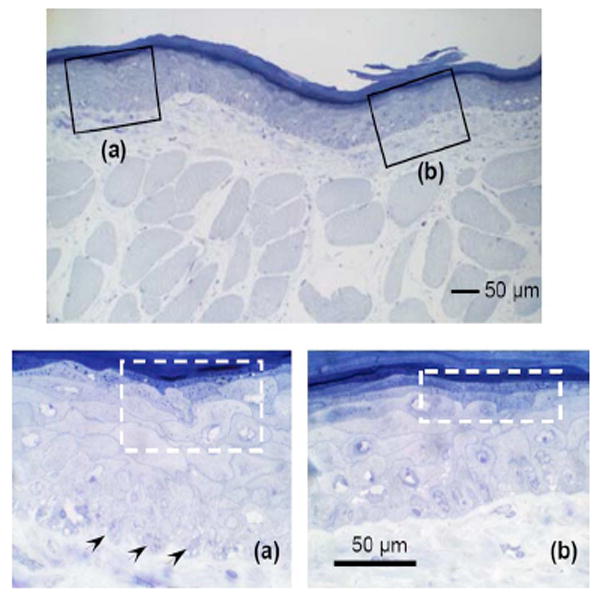
Distribution of Au NPs in SC and upper epithelial layers of (a) an early dysplasia, and (b) a normal region.
The duration of Au NP-induced OCT signal enhancement was also investigated (Fig. 7) by imaging the cheek pouches of DMBA-untreated hamsters over a period of 40 days after the initial administration using MNs and US. No noticeable changes were observed for two days. OCT signals in epithelial and connective tissue areas were found to be significantly diluted after a week, indicating that the Au NPs were cleared from the lower tissue. However, enhanced signals from the SC persisted over the entire 40 days. This may be due to poor (or no) active transport in the SC area. Thus, it was speculated that Au NPs were efficiently delivered by multimodal methods to both the epithelial and connective layers, where relatively active clearance of Au NPs is available. This could be confirmed by quantifying the concentration of Au NPs in the tissue. Importantly, no inflammation or other adverse effects were observed in the hamster cheek pouch over a period of 40 days, indicating the potential for an acceptable level of biocompatibility of the Au NPs (Fig. 8). PEGylated Au NPs with an antibody coating were used to prevent agglomeration of Au NPs while achieving EGFR-mediated specific binding to cancerous cells. Au NP agglomeration in vivo was effectively prevented, but no selective antibody-mediated binding of the Au NPs was observed in these studies (i.e., the low optical signals in the dysplasia shown in Figs. 3 and 4, and no selective accumulation of Au NPs in the dysplasial membrane shown in Fig. 6). This may be explained by the predominant enhanced permeation and retention (EPR) effects on relatively large particles in tissue.60 Due to their size (i.e., 71 nm), Au NPs may have been immobilized in the tissue with a low EGFR-encountering frequency. This unanswered question should be investigated in a subsequent study with a quantitative model and experimental data using nonspecific antibodyconjugated Au NPs. The antibody seemed to at least serve as a PEGylation anchor via its strong affinity to Au surfaces and efficient absorption of PEG on antibody layers.61
Fig. 7.

Kinetics of in vivo OCT signal profiles in a normal hamster cheek pouch for 40 days. Scale bar: 100 μm.
Fig. 8.
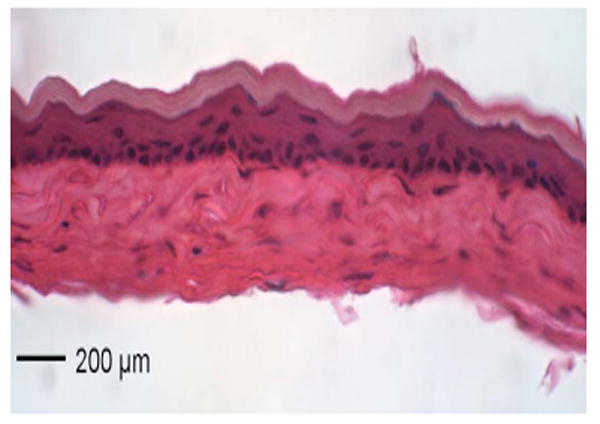
H&E stained cheek pouch of a DMBA-untreated hamster 40 days after MNs, Au NPs, and US were applied.
4 Conclusion
In conclusion, our multimodal delivery that employed MNs and US enabled the efficient transport of Au NPs by overcoming the SC and epithelial barriers and resulted in an approximately 150% increased OCT contrast level in the standard model for oral carcinogenesis. Early neoplasia was clearly identified by effectively delivered and distributed Au NPs, which also permitted meaningful quantitative signal analysis. The distribution of Au NPs in subepithelial layers through MN-assisted penetration and US-facilitated distribution was confirmed by histology. Diminishing OCT signals in sub-SC layers over time (up to 40 days) imply that Au NPs were able to reach the area within the tissues where active and efficient clearance is available. This study demonstrates an effective approach to overcoming poor transport of OCT contrastenhancing nanoparticles and may provide a new paradigm for enhancing in vivo OCT images for the early diagnosis of cancer. Further study on the molecular properties of Au NPs (e.g., Au NP size, shape, and surface functionalities) and on systemic tuning of multimodal delivery methods (e.g., MN geometry, level and duration of ultrasonic forces, and various combinations of the two modalities) are underway to further elucidate and optimize this new approach.
Acknowledgments
This work was financially supported by the National Institutes of Health (EB-00293, NCI-91717, RR-01192), the Air Force Office of Scientific Research (FA9550-04-1-0101), the Beckman Laser Institute Endowment, seed grant funding from the University of California Cancer Center Support Grant (5P30CA062203-13), the University of California-Irvine (UCI) CORCL Faculty Research and Travel Award, and a new faculty setup fund from UCI. The authors thank Dr. Matthew Brenner (UCI) for scientific discussion and Kenneth Lee (UCI) for technical assistance. The ultrasound system was generously loaned at no cost from Dynatronics (Salt Lake City, UT).
Contributor Information
Chang Soo Kim, University of California, Irvine, Department of Chemical Engineering and Materials Science, Irvine, California 92697, and Beckman Laser Institute, Irvine, California 92612.
Petra Wilder-Smith, University of California, Irvine, Beckman Laser Institute, Irvine, California 92612.
Yeh-Chan Ahn, University of California, Irvine, Beckman Laser Institute, Irvine, California 92612.
Lih-Huei L. Liaw, University of California, Irvine, Beckman Laser Institute, Irvine, California 92612
Zhongping Chen, University of California, Irvine, Department of Biomedical Engineering, Department of Chemical Engineering and Materials Science, Irvine, California 92697, and Beckman Laser Institute, Irvine, California 92612.
Young Jik Kwon, University of California, Irvine, Department of Pharmaceutical Sciences, Department of Chemical Engineering and Materials Science, Department of Biomedical Engineering, Irvine, California 92697.
References
- 1.Keetch DW, Catalona WJ, Smith DS. Serial prostatic biopsies in men with persistently elevated serum prostate specific antigen values. J Urol. 1994;151(6):1571–1574. doi: 10.1016/s0022-5347(17)35304-1. [DOI] [PubMed] [Google Scholar]
- 2.Ellis WJ, Brawer MK. Repeat prostate needle biopsy: who needs it. J Urol. 1995;153(5):1496–1498. [PubMed] [Google Scholar]
- 3.Roehrborn CG, Pickens GJ, Sanders JS. Diagnostic yield of repeated transrectal ultrasound-guided biopsies stratified by specific histopathologic diagnoses and prostate specific antigen levels. Urology. 1996;47(3):347–352. doi: 10.1016/s0090-4295(99)80451-8. [DOI] [PubMed] [Google Scholar]
- 4.Loo C, Lin A, Hirsch L, Lee MH, Barton J, Halas N, West J, Drezek R. Nanoshell-enabled photonics-based imaging and therapy of cancer. Technol Cancer Res Treat. 2004;3(1):33–40. doi: 10.1177/153303460400300104. [DOI] [PubMed] [Google Scholar]
- 5.Gillenwater A, Papadimitrakopoulou V, Richards-Kortum R. Oral premalignancy: new methods of detection and treatment. Curr Oncol Rep. 2006;8(2):146–154. doi: 10.1007/s11912-006-0050-4. [DOI] [PMC free article] [PubMed] [Google Scholar]
- 6.Gladkova ND, Petrova GA, Nikulin NK, Radenska-Lopovok SG, Snopova LB, Chumakov YP, Nasonova VA, Gelikonov VM, Gelikonov GV, Kuranov RV, Sergeev AM, Feldchtein FI. In vivo optical coherence tomography imaging of human skin: norm and pathology. Skin Res Technol. 2000;6(1):6–16. doi: 10.1034/j.1600-0846.2000.006001006.x. [DOI] [PubMed] [Google Scholar]
- 7.Troutman TS, Barton JK, Romanowski M. Optical coherence tomography with plasmon resonant nanorods of gold. Opt Lett. 2007;32(11):1438–1440. doi: 10.1364/ol.32.001438. [DOI] [PubMed] [Google Scholar]
- 8.Fujimoto JG. Optical coherence tomography for ultrahigh resolution in vivo imaging. Nat Biotechnol. 2003;21(11):1361–1367. doi: 10.1038/nbt892. [DOI] [PubMed] [Google Scholar]
- 9.Puliafito CA, Hee MR, Schuman JS, Fujimoto JG. Optical Coherence Tomography of Ocular Disease. Slack, Inc.; New Jersey: 1995. [Google Scholar]
- 10.Bouma BE, Tearney GJ. The Handbook of Optical Coherence Tomography. Marcel Dekker, Inc.; New York: 2002. [Google Scholar]
- 11.Tearney GJ, Brezinski ME, Bouma BE, Boppart SA, Pitris C, Southern JF, Fujimoto JG. In vivo endoscopic optical biopsy with optical coherence tomography. Science. 1997;276(5321):2037–2039. doi: 10.1126/science.276.5321.2037. [DOI] [PubMed] [Google Scholar]
- 12.Boppart SA, Bouma BE, Pitris C, Southern JF, Brezinski ME, Fujimoto JG. In vivo cellular optical coherence tomography imaging. Nat Med. 1998;4(7):861–865. doi: 10.1038/nm0798-861. [DOI] [PubMed] [Google Scholar]
- 13.Huang D, Swanson EA, Lin CP, Schuman JS, Stinson WG, Chang W, Hee MR, Flotte T, Gregory K, Puliafito CA, Fujimoto JG. Optical coherence tomography. Science. 1991;254(5035):1178–1181. doi: 10.1126/science.1957169. [DOI] [PMC free article] [PubMed] [Google Scholar]
- 14.Ding Z, Ren H, Zhao Y, Nelson JS, Chen Z. Highresolution optical coherence tomography over a large depth range with an axicon lens. Opt Lett. 2002;27(4):243–245. doi: 10.1364/ol.27.000243. [DOI] [PubMed] [Google Scholar]
- 15.Wang XJ, Milner TE, Nelson JS. Characterization of fluid flow velocity by optical Doppler tomography. Opt Lett. 1995;20(11):1337–1339. doi: 10.1364/ol.20.001337. [DOI] [PubMed] [Google Scholar]
- 16.Chen Z, Milner TE, Srinivas S, Wang X, Malekafzali A, van Gemert MJ, Nelson JS. Noninvasive imaging of in vivo blood flow velocity using optical Doppler tomography. Opt Lett. 1997;22(14):1119–1121. doi: 10.1364/ol.22.001119. [DOI] [PubMed] [Google Scholar]
- 17.Yazdanfar S, Kulkarni M, Izatt J. High resolution imaging of in vivo cardiac dynamics using color Doppler optical coherence tomography. Opt Express. 1997;1(13):424–431. doi: 10.1364/oe.1.000424. [DOI] [PubMed] [Google Scholar]
- 18.Kehlet Barton J, Izatt JA, Kulkarni MD, Yazdanfar S, Welch AJ. Three-dimensional reconstruction of blood vessels from in vivo color Doppler optical coherence tomography images. Dermatology. 1999;198(4):355–361. doi: 10.1159/000018148. [DOI] [PubMed] [Google Scholar]
- 19.Rollins AM, Yazdanfar S, Barton JK, Izatt JA. Real-time in vivo color Doppler optical coherence tomography. J Biomed Opt. 2002;7(1):123–129. doi: 10.1117/1.1428291. [DOI] [PubMed] [Google Scholar]
- 20.de Boer JF, Milner TE, van Gemert MJ, Nelson JS. Two-dimensional birefringence imaging in biological tissue by polarization-sensitive optical coherence tomography. Opt Lett. 1997;22(12):934–936. doi: 10.1364/ol.22.000934. [DOI] [PubMed] [Google Scholar]
- 21.Everett MJ, Schoenenberger K, Colston BW, Jr, Da Silva LB. Birefringence characterization of biological tissue by use of optical coherence tomography. Opt Lett. 1998;23(3):228–230. doi: 10.1364/ol.23.000228. [DOI] [PubMed] [Google Scholar]
- 22.Yao G, Wang LV. Two-dimensional depth-resolved Mueller matrix characterization of biological tissue by optical coherence tomography. Opt Lett. 1999;24(8):537–539. doi: 10.1364/ol.24.000537. [DOI] [PubMed] [Google Scholar]
- 23.de Boer JF, Milner TE. Review of polarization sensitive optical coherence tomography and Stokes vector determination. J Biomed Opt. 2002;7(3):359–371. doi: 10.1117/1.1483879. [DOI] [PubMed] [Google Scholar]
- 24.Yang C, McGuckin LE, Simon JD, Choma MA, Applegate BE, Izatt JA. Spectral triangulation molecular contrast optical coherence tomography with indocyanine green as the contrast agent. Opt Lett. 2004;29(17):2016–2018. doi: 10.1364/ol.29.002016. [DOI] [PMC free article] [PubMed] [Google Scholar]
- 25.Xu C, Ye J, Marks DL, Boppart SA. Near-infrared dyes as contrast-enhancing agents for spectroscopic optical coherence tomography. Opt Lett. 2004;29(14):1647–1649. doi: 10.1364/ol.29.001647. [DOI] [PubMed] [Google Scholar]
- 26.Yang C. Molecular contrast optical coherence tomography: a review. Photochem Photobiol. 2005;81(2):215–237. doi: 10.1562/2004-08-06-IR-266. [DOI] [PMC free article] [PubMed] [Google Scholar]
- 27.Boppart SA, Oldenburg AL, Xu C, Marks DL. Optical probes and techniques for molecular contrast enhancement in coherence imaging. J Biomed Opt. 2005;10(4):041208. doi: 10.1117/1.2008974. [DOI] [PubMed] [Google Scholar]
- 28.Barton JK, Hoying JB, Sullivan CJ. Use of microbubbles as an optical coherence tomography contrast agent. Acad Radiol. 2002;9(1):S52–55. doi: 10.1016/s1076-6332(03)80395-1. [DOI] [PubMed] [Google Scholar]
- 29.Lee TM, Oldenburg AL, Sitafalwalla S, Marks DL, Luo W, Toublan FJ, Suslick KS, Boppart SA. Engineered microsphere contrast agents for optical coherence tomography. Opt Lett. 2003;28(17):1546–1548. doi: 10.1364/ol.28.001546. [DOI] [PubMed] [Google Scholar]
- 30.Zagaynova EV, Shirmanova MV, Kirillin MY, Khlebtsov BN, Orlova AG, Balalaeva IV, Sirotkina MA, Bugrova ML, Agrba PD, Kamensky VA. Contrasting properties of gold nanoparticles for optical coherence tomography: phantom, in vivo studies and Monte Carlo simulation. Phys Med Biol. 2008;53(18):4995–5009. doi: 10.1088/0031-9155/53/18/010. [DOI] [PubMed] [Google Scholar]
- 31.Rayavarapu RG, Petersen W, Ungureanu C, Post JN, van Leeuwen TG, Manohar S. Synthesis and bioconjugation of gold nanoparticles as potential molecular probes for light-based imaging techniques. Int J Biomed Imaging. 2007;2007:29817. doi: 10.1155/2007/29817. [DOI] [PMC free article] [PubMed] [Google Scholar]
- 32.Sokolov K, Follen M, Aaron J, Pavlova I, Malpica A, Lotan R, Richartz-Kortum R. Real-time vital optical imaging of precancer using anti-epidermal growth factor receptor antibodies conjugated to gold nanoparticles. Cancer Res. 2003;63(9):1999–2004. [PubMed] [Google Scholar]
- 33.Sokolov K, Aaron J, Hsu B, Nida D, Gillenwater A, Follen M, MacAulay C, Adler-Storthz K, Korgel B, Descour M, Pasqualini R, Arap W, Lam W, Richards-Kortum R. Optical systems for in vivo molecular imaging of cancer. Technol Cancer Res Treat. 2003;2(6):491–504. doi: 10.1177/153303460300200602. [DOI] [PubMed] [Google Scholar]
- 34.El-Sayed IH, Huang X, El-Sayed MA. Surface plasmon resonance scattering and absorption of anti-EGFR antibody conjugated gold nanoparticles in cancer diagnostics: applications in oral cancer. Nano Lett. 2005;5(5):829–834. doi: 10.1021/nl050074e. [DOI] [PubMed] [Google Scholar]
- 35.Cang H, Sun T, Li ZY, Chen J, Wiley BJ, Xia Y, Li X. Gold nanocages as contrast agents for spectroscopic optical coherence tomography. Opt Lett. 2005;30(22):3048–3050. doi: 10.1364/ol.30.003048. [DOI] [PubMed] [Google Scholar]
- 36.Chen J, Saeki F, Wiley BJ, Cang H, Cobb MJ, Li ZY, Au L, Zhang H, Kimmey MB, Li X, Xia Y. Gold nanocages: bioconjugation and their potential use as optical imaging contrast agents. Nano Lett. 2005;5(3):473–477. doi: 10.1021/nl047950t. [DOI] [PubMed] [Google Scholar]
- 37.Gobin AM, Lee MH, Halas NJ, James WD, Drezek RA, West JL. Near-infrared resonant nanoshells for combined optical imaging and photothermal cancer therapy. Nano Lett. 2007;7(7):1929–1934. doi: 10.1021/nl070610y. [DOI] [PubMed] [Google Scholar]
- 38.Agrawal A, Huang S, Wei Haw Lin A, Lee MH, Barton JK, Drezek RA, Pfefer TJ. Quantitative evaluation of optical coherence tomography signal enhancement with gold nanoshells. J Biomed Opt. 2006;11(4):041121. doi: 10.1117/1.2339071. [DOI] [PubMed] [Google Scholar]
- 39.Oldenburg AL, Hansen MN, Zweifel DA, Wie A, Boppart SA. Plasmon-resonant gold nanorods as low backscattering albedo contrast agents for optical coherence tomography. Opt Express. 2006;14(15):6724–6738. doi: 10.1364/oe.14.006724. [DOI] [PubMed] [Google Scholar]
- 40.Wang C, Ma Z, Wang T, Su Z. Synthesis, assembly, and biofunctionalization of silica-coated gold nanorods for colorimetric biosensing. Adv Funct Mater. 2006;16(13):1673–1678. [Google Scholar]
- 41.Liao H, Hafner JH. Gold nanorod bioconjugates. Chem Mater. 2005;17(18):4636–4641. [Google Scholar]
- 42.Zharov VP, Kim JW, Curiel DT, Everts M. Selfassembling nanoclusters in living systems: application for integrated photothermal nanodiagnostics and nanotherapy. Nanomedicine. 2005;1(4):326–345. doi: 10.1016/j.nano.2005.10.006. [DOI] [PubMed] [Google Scholar]
- 43.Horisberger M. Colloidal gold: a cytochemical marker for light and fluorescent microscopy and for transmission and scanning electron microscopy. Scan Electron Microsc. 1981;Pt 2:9–31. [PubMed] [Google Scholar]
- 44.Gumpel JM. The role of radiocolloids in the treatment of arthritis. Rheumatol Rehabil. 1974;13(1):1–9. doi: 10.1093/rheumatology/13.1.1. [DOI] [PubMed] [Google Scholar]
- 45.Wang Y, Xie X, Wang X, Ku G, Gill K, O’Neal DP, Stoica G, Wang LV. Photoacoustic tomography of a nanoshell contrast agent in the in vivo rat brain. Nano Lett. 2004;4(9):1689–1692. [Google Scholar]
- 46.Copland JA, Eghtedari M, Popov VL, Kotov N, Mamedova N, Motamedi M, Oraevsky AA. Bioconjugated gold nanoparticles as a molecular based contrast agent: implications for imaging of deep tumors using optoacoustic tomography. Mol Imaging Biol. 2004;6(5):341–349. doi: 10.1016/j.mibio.2004.06.002. [DOI] [PubMed] [Google Scholar]
- 47.Wilson R. The use of gold nanoparticles in diagnostics and detection. Chem Soc Rev. 2008;37(9):2028–2045. doi: 10.1039/b712179m. [DOI] [PubMed] [Google Scholar]
- 48.Chen K, Liu Y, Ameer G, Backman V. Optimal design of structured nanospheres for ultrasharp light-scattering resonances as molecular imaging multilabels. J Biomed Opt. 2005;10(2):024005. doi: 10.1117/1.1899684. [DOI] [PubMed] [Google Scholar]
- 49.Oldenburg AL, Zweifel DA, Xu C, Wie A, Boppart SA. Characterization of plasmon-resonant gold nanorods as near-infrared optical contrast agents investigated using a double-integrating sphere system. Proc SPIE. 2005;5703:50–60. [Google Scholar]
- 50.Santra S, Xu J, Wang K, Tan W. Luminescent nanoparticle probes for bioimaging. J Nanosci Nanotechnol. 2004;4(6):590–599. doi: 10.1166/jnn.2004.017. [DOI] [PubMed] [Google Scholar]
- 51.Wilder-Smith P, Jung WG, Brenner M, Osann K, Beydoun H, Messadi D, Chen Z. In vivo optical coherence tomography for the diagnosis of oral malignancy. Lasers Surg Med. 2004;35(4):269–275. doi: 10.1002/lsm.20098. [DOI] [PubMed] [Google Scholar]
- 52.Coulman SA, Barrow D, Anstey A, Gateley C, Morrissey A, Wilke N, Allender C, Brain K, Birchall JC. Minimally invasive cutaneous delivery of macromolecules and plasmid DNA via microneedlesnancy. Curr Drug Deliv. 2006;3(1):65–75. doi: 10.2174/156720106775197510. [DOI] [PubMed] [Google Scholar]
- 53.Larina IV, Evers BM, Ashitkov TV, Bartels C, Larin KV, Esenaliev RO. Enhancement of drug delivery in tumors by using interaction of nanoparticles with ultrasound radiation. Technol Cancer Res Treat. 2005;4(2):217–226. doi: 10.1177/153303460500400211. [DOI] [PubMed] [Google Scholar]
- 54.Cross SE, Robers MS. Physical enhancement of transdermal drug application: Is delivery technology keeping up with pharmaceutical development? Curr Drug Deliv. 2004;1(1):81–92. doi: 10.2174/1567201043480045. [DOI] [PubMed] [Google Scholar]
- 55.Frens G. Controlled nucleation for the regulation of the particle size in monodisperse gold suspensions. Nature (London), Phys Sci. 1973;241:20–22. [Google Scholar]
- 56.Curry AC, Crow M, Wax A. Molecular imaging of epidermal growth factor receptor in live cells with refractive index sensitivity using dark-field microspectroscopy and immunotargeted nanoparticles. J Biomed Opt. 2008;13(1):014022. doi: 10.1117/1.2837450. [DOI] [PubMed] [Google Scholar]
- 57.Sato K, Hosokawa K, Maeda M. Rapid aggregation of gold nanoparticles induced by non-cross-linking DNA hybridization. J Am Chem Soc. 2003;125(27):8102–8103. doi: 10.1021/ja034876s. [DOI] [PubMed] [Google Scholar]
- 58.Ng K, Liu Y. Therapeutic ultrasound: its application in drug delivery. Med Res Rev. 2002;22(2):204–223. doi: 10.1002/med.10004. [DOI] [PubMed] [Google Scholar]
- 59.Richardson KC, Jarett L, Finke EH. Embedding in epoxy resins for ultrathin sectioning in electron microscopy. Stain Technol. 1960;35:313–325. doi: 10.3109/10520296009114754. [DOI] [PubMed] [Google Scholar]
- 60.Torchilin VP. Multifunctional nanocarriers. Adv Drug Delivery Rev. 2006;58(14):1532–1555. doi: 10.1016/j.addr.2006.09.009. [DOI] [PubMed] [Google Scholar]
- 61.Hirsch LR, Gobin AM, Lowery AR, Tam F, Drezek RA, Halas NJ, West JL. Metal nanoshells. Ann Biomed Eng. 2006;34(1):15–22. doi: 10.1007/s10439-005-9001-8. [DOI] [PubMed] [Google Scholar]