Abstract
Objectives
To identify the regulatory sequences driving Gata1 expression in conventional dendritic cells (cDC).
Methods
The number and expression levels of Gata1, Gata1-target genes and HS2 (the eosinophil-specific enhancer)-driven GFP reporter of cDCs from mice lacking HS1 (the erythroid/megakaryocytic-specific enhancer, Gata1low mutation) and wild-type littermates as well as the response to lipopolysaccharide of ex-vivo generated wild-type and Gata1low DCs was investigated.
Results
cDC maturation was associated with bell-shaped changes in Gata1 expression that peaked in cDCs precursors from blood. The Gata1low mutation did not affect Gata1 expression in cDC precursors and these cells expressed the HS2-driven reporter, indicating that Gata1 expression is HS2-driven in these cells. By contrast, the Gata1low mutation reduced Gata1 expression in mature cDCs and these cells did not express GFP, indicating that mature cDCs express Gata1 driven by HS1. In blood, the number of cDC precursors expressing CD40/CD80 was reduced in Gata1low mice while CD40pos/CD80pos cDC precursors from wild-type mice expressed the HS2-GFP reporter, suggesting that Gata1 expression in these cells is both HS1- and HS2-driven. In addition, the antigen and accessory molecules presentation process induced by lipopolysaccharide in ex-vivo generated wild-type DC was associated with increased acetylated histone 4 occupancy of HS1 while ex-vivo generated Gata1low cDCs failed to respond to lipopolysaccharide, suggesting that HS1 activation is required for cDC maturation.
Conclusion
These results identify a dynamic pattern of Gata1 regulation that switches from a HS1 to a HS2-dependent phase during the maturation of cDCs associated with the antigen-presentation process in the blood.
Keywords: Dendritic Cells, Transcription Factors, Gata1, Antigen Presentation
Introduction
Dendritic cells (DCs) are hematopoietic cells specialized in the activation of naive T cells during the immune response [1]. The expression of the lymphoid marker B220 (CD45RA) distinguishes two DC populations: B220neg or conventional DCs (cDCs) and B220pos or plasmacytoid DCs (pDCs) [2,3]. These two populations have different functions: cDCs are directly involved in the process of antigen presentation to T cells while activated pDCs are mainly responsible to produce inflammatory cytokines [Interleukin-12 (IL-12), Tumor Necrosis Factor-α (TNFα) and interferons (IFN)] that stimulate T cell functions [4,5].
cDCs are generated both by common myeloid progenitors present in marrow and spleen and by common lymphoid progenitors present in lympho nodes [2,6,7]. cDC precursors acquire the ability to present antigens during their maturation in the blood, a process associated with upregulation of the expression of the CD11c integrin [8]. CD11clow cDC precursors egress from marrow and spleen into the blood to take up and process antigens [7-9]. Still in the blood, antigen-loaded CD11clow cDC precursors mature in response to inflammatory stimuli, such as lipopolysaccharide (LPS), into CD11chigh cDCs [8,11,12] and home to lymphoid organs [13], including the spleen, to present the processed antigens to T cells [1]. During their maturation, cDCs also acquire the ability to express accessory molecules on their surface that either modulate the T cell response (CD80 and CD86) [14-16], or self-signal to cDCs to complete their maturation (CD40) [17,18].
Gata1 is a transcription factor necessary for proper development of hematopoietic cells of many lineages including erythroid, megakaryocytic, eosinophilic and mast cells [19]. Recently, it was found that Gata1 is also expressed in all DC sub-types [20] and in their precursors [21]. The observations that DC maturation is strictly regulated by the transcription factor PU.1 [22] and that Gata1 directly inhibits the trascriptional activity of this protein [19,23] suggested that Gata1 indirectly inhibits DCs generation through regulation of PU.1 activity. However, tamoxifen-induced ablation of Gata1 expression reduces in vivo the numbers of DC precursors detectable in all the tissues investigated and in vitro the ability of cDC precursors to generate DCs in response to GM-CSF [20]. These results suggest that in addition to negative regulation of PU.1 activity, Gata1 promotes DC maturation directly by activating the expression of DC specific genes. In agreement with this hypothesis, functional Gata1 consensus sequences have been identified in the regulatory regions of Ifnγ [24], the HIV co-receptor CCR5 [25], DC-SCRIPT [26], decoy receptor D6 [27] and vitamin D receptor [28] genes. In addition, cDCs from tamoxifen-treated conditional knockouts produce low levels of IFN-γ upon LPS stimulation [20], identifying IFN-γ as one of the genes directly regulated by Gata1 in DCs. The full spectrum of Gata1 functions in DCs is, however, far from been completely understood.
Gata1 promotes maturation of hematopoietic cells in a concentration-dependent manner [19]. Dynamic changes in the chromatin organization of the Gata1 locus ensure that cells in each hematopoietic lineage express Gata1 at the appropriate level [29-35]. In mice, the Gata1 locus includes at least two promoters [36] and several DNase hypersensitive sites. The rate of Gata1 transcription in different lineages is exquisitely determined by the interaction of specific enhancers with their transcriptional activators/repressors. This interaction has been identified thanks to the generation of a series of mice carring delitions of putative enhancer sequences identified by DNase hypersensitive site (HS) determinations (hypomorphic mutations) and/or reporter genes driven by these sequences. Although the regulation of the Gata1low locus is probably more complex than currently thought, at least three enhancers have been fully characterized so far: HS1 [37] (also known as HS-3.5 and G1HE), an enhancer that drives Gata1 expression in megakaryocytes, erythroid cells [29,38,39] and mast cells [40]; HS2 and a palyndromic GATA motive adjacent to the proximal promoter, that drives Gata1 expression in eosinophils [33,41] and HS4/5 (also known as HS+3.5). Deletion of HS2 induce a severe lethal phenotype in mice and the few animals that survive develop a transplantable leukemia [34,42,43]. Deletion of HS1 (Gata1low mutation) [29], instead, reduces Gata1 expression in megakaryocytes, erythroid cells and mast cells and induces a complex phenotype that includes thrombocytopenia and development of myelofibrosis, a trait similar to that expressed by patients affected by the Philadelphia chromosome-negative myeloproliferative neoplasm primary myelofibrosis [29,38,40,44,45]. The regulatory regions of the gene that control its expression in DCs have not been identified as yet.
In this study, we have used Gata1low mice as a tool to identify the regulatory regions that drive Gata1 expression in cDCs and to identify additional functions for this gene in these cells. First, the frequency and gene expression profiling of cDC precursors and the frequency of mature cDCs in marrow, blood and spleen from Gata1low and wild-type littermates were compared. These determinations were complemented by analyses of the expression of a reporter gene under the control of regulatory sequences of Gata1 (spared by the Gata1low mutation) that contain the HS2 enhancer (-2.7KbGata1GFP) in cDCs from wild-type and Gata1low littermates. The levels of the accessory molecules CD86 and CD40 expressed by blood cDCs precursors from wild-type and Gata1low mice was then compared. Lastly, the ability of Gata1low and wild-type bone marrow cells to generate cDCs ex vivo in response to GM-CSF, alone or in combination with IL-4, and of these ex vivo derived DCs to express Gata1 (and other Gata1 target genes) and to present antigens and accessory molecules in response to lipopolysaccharide (LPS) was compared. These experiments were associated with determinations by chromatin immunoprecipitation assay (ChIP) of acetylated histone H4 occupancy of the HS1 and HS2 sites of Gata1 in ex vivo generated wild-type cDC upon LPS stimulation.
Materials and Methods
Mice
A Gata1low colony backcrossed for 6 generations was maintained in the CD1 background under good animal care practice conditions in the animal facilities of Istituto Superiore Sanità [44]. The Gata1low mutation does not contain the neo cassette [40]. Age (4-6 month) and sex matched CD1 mice wild-type at the Gata1 locus were used as controls (Charles River, Calco, Italy). Transgenic -2.7kbGata1GFP mice were a gift of Prof. David Scadden (Harvard Medical School, Boston, MA) [46] and are wild-type at the endogenous Gata1 locus. Hemizygous -2.7kbGata1GFP∷Gata1+/y and -2.7kbGata1GFP∷Gata1low/y males were obtained by crossing -2.7kbGata1GFP∷Gata1+/y males with Gata1low/low females. All experiments were approved by the institutional animal care ethical committee.
Flow cytometry and cell purification
Mononuclear cells from blood, bone marrow and spleen were suspended in Hank's Buffered Salt Solution (HBSS) (Sigma-Aldrich, St Louis, MO) and incubated with anti-B220, conjugated with either Fluorescein isothiocyanate (FITC) or Pacific Blue, anti-CD11b-phycoerythrin cyanine dye 7 (Pe-Cy7), anti-CD11c-Allophycocyanin (APC), anti-CD40-phycoerythrin (PE), anti-CD80-PE and anti-CD86-PE (1 μg, each) and endotoxin-free OVA (Sigma-Aldrich) conjugated with amine-reactive Alexa Fluor 405 (AF405) (Molecular Probes, Eugene, OR) according to the manufacturer's instructions in the presence of anti-CD16/CD32 (FcγRIII/II) to block non-specific binding. All the antibodies were from PharMingen (San Diego, CA). Non-specific signals and dead cells were excluded, respectively, by fluorochrome-conjugated isotype controls and propidium iodide staining (5μg/mL; Sigma-Aldrich). Cell fluorescence was analyzed with the FACS Aria (Becton Dickinson, San Jose, CA, USA) and FlowJo (Ashland, OR, USA) software. Details on the gating used to identify cDC populations are shown in Supplementary Figure 1.
Generation of bone marrow-derived dendritic cells and induction of CD40 expression after OVA-AF405 uptake and LPS stimulation
Bone marrow cells from wild-type and Gata1low mice (5×10⁵ cells/mL) were cultured in a humidified incubator at 37 °C for 7 days in Iscove's modified Dulbecco medium (IMDM) (Gibco Life Technologies Italia, Milan, Italy) containing 10% heat-inactivated fetal calf serum (FCS; Sigma-Aldrich), 100 U/mL penicillin, 100 μg/mL streptomycin (Sigma-Aldrich) and recombinant murine granulocyte-macrophage colony-stimulating factor (GM-CSF, 20 ng/mL), as described [20]. The cultures were replenished with fresh medium and GM-CSF at day 3 and cells collected after 7 days for antigen cell surface and ChIP analysis after LPS stimulation (see below). Alternatively, DCs were generated after 6 days of culture in the presence of GM-CSF and interleukin-4 (IL-4) (10 ng/mL each) (PromoCell, Heidelberg, Germany), as described [35,47]. On day 6, loosely adherent cells (>75% DCs as determined by CD11b/CD11c staining) were harvested, suspended at a concentration of 105 cells/mL and cultured (0.5 mL/well of 24-well plates) for 18 hrs at 37 °C in IMDM supplemented with 10% FCS (Becton–Dickinson, Falcon, Oxford, UK) and either LPS (0.5 μg/mL) (Sigma-Aldrich) or medium. After 18 hr, the wells were supplemented with either OVA-AF405 (100μg/mL) or an equivalent volume of IMDM. One hour later, the cells were harvested, washed in cold HBSS containing 0.01% Bovine Serum Albumin (BSA), and incubated with anti-CD11b-PE-Cy7, anti-CD11c-APC and anti-CD40-PE for flow cytometrical analysis.
RNA isolation and RT-PCR analysis
Total RNA was extracted from prospectively isolated cells (the purified cells were ≅90-95% pure upon re-analyses, data not shown) and ex-vivo expanded DCs with TRIzol (Gibco BRL, Paisley, United Kingdom) and reverse transcribed with 2.5 μM random hexamers using the superscript kit (InVitrogen, Milan, Italy). Gene expression was quantified by TaqMan Kits (cat no. Gata-1: Mm00484678_m1, CD40: Mm00441891_m1, CD86: Mm00444543_m1, Applied Biosystems, Foster City, CA) or custom prepared oligonucleotides (Pu.1, Ciclin D6, p27Kip1, Bcl2, CD40, CD86 and Ifnγ). Glyceraldehyde phosphate dehydrogenase (GAPDH) cDNA was concurrently amplified as a control (cat no. 99999915_g1, Applied Biosystems). The amplification reactions were performed in an ABI PRISM 7300 Sequence Detection System (Applied Biosystems) and the cycle threshold (Ct) calculated with the Sequence Detection System (SDS) software. Expression levels were expressed as 2-ΔCt, using GAPDH as calibrator (ΔCt = target gene Ct − GAPDH Ct).
Chromatin Immunoprecipitation analysis (ChIP)
Chromatin was prepared from ex-vivo expanded DCs stimulated or mock-stimulated with LPS (500 ng/mL) for 18 hr as described [47]. ChIP was performed with anti- Glutathione-S-Transferase (anti-GST) Tag (05-311), Anti-acetyl-Histone H4 (AcH4, 06-866) and Anti-trimethyl-Histone H3 (Lys27) (K27Me3H3, 07-449) antibodies (Millipore, Billerica, MA, USA). Quantitative PCR was performed on immunoprecipitated samples and respective input controls using primers for the Gata1 binding region in the Ifnγ promoter [20], and the HS1 and HS2 regions of Gata1 [48]. The relative fold enrichment was calculated as log-2[(CT sample − CD sample input) − (CT GST − CT GST input)]. The primers used to amplify the Ifnγ promoter region are described in [20]. The primers used to amplify HS1 were: forward CCAAGGAAGAGAGGACATTAGC and reverse GCATAGATAAGGGAAT CAGCGG; and the primers used to amplify HS2 were: forward AGACTTATCTGCTGCCCCAG and reverse GCAGTCTGGGGTACTAGGC.
Statistical analysis
Statistical analysis was performed by unpaired T test using Origin 3.5 software for Windows (Microcal Software, Northampton, MA).
Results
The hypomorphic Gata1low mutation increases the frequency of cDCs in marrow and spleen
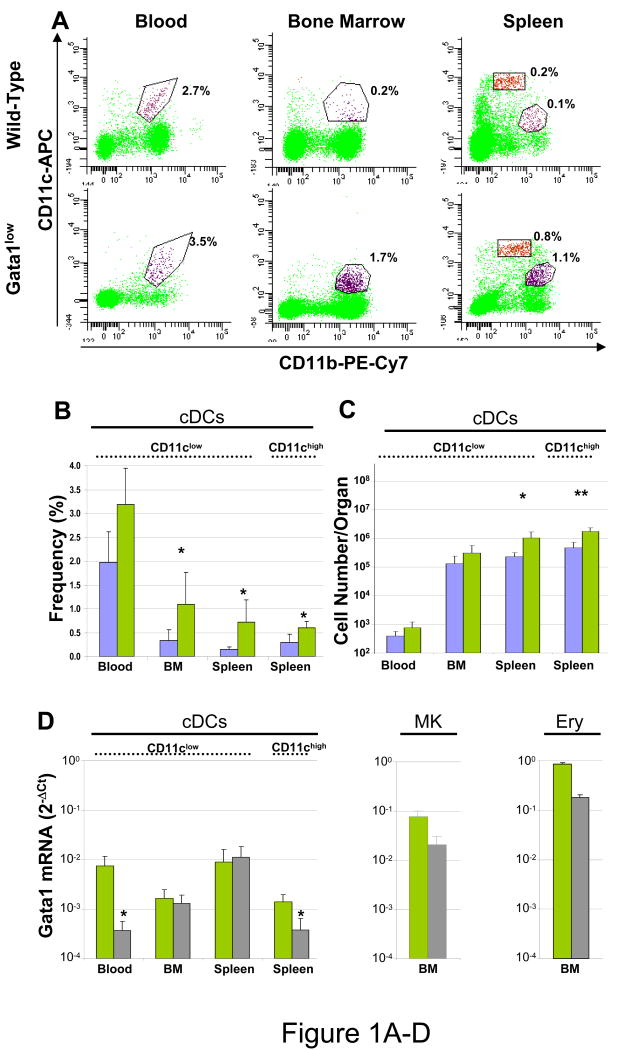
In Gata1low mice, the frequency of cDC precursors (B220-, CD11b+, CD11clow) was significantly greater (2-5-fold) than in normal marrow and spleen while the increase in frequency observed in blood was not statistically significant. In addition, the frequency of mature cDCs (B220-, CD11b+, CD11chigh) in the spleen from Gata1low mice also was 2-5-fold greater than normal (Figure 1A).
Figure 1. The hypomorphic Gata1low mutation increases the number of precursors and mature cDCs present in the spleen and decreases Gata1 expression in cDC precursors from the blood and in mature cDCs in the spleen.
A) Representative flow cytometrical analysis for CD11b/CD11c expression and frequency (B) and absolute number (C) of precursor and mature cDCs (B220-/CD11b+/CD11clow or CD11chigh, respectively) in blood, bone marrow and spleen from wild-type (blue bars) and Gata1low (green bars) littermates. The B220 gating is presented in Supplementary Figure 1. Frequencies observed in 4-9 mice per group are presented as mean (±SD) of results. C) Absolute numbers were calculated by multiplying the frequency presented in B with the total cell number (Supplementary Table 1). D) Levels of Gata1 mRNA expressed by cDC populations (B220-/CD11b+/CD11clow or CD11chigh) prospectively isolated from blood, marrow and spleen, compared with the levels of Gata1 expressed by megakaryocytes (MK, CD41+/CD61+) and erythroid cells (Ery, CD119+/CD71+) purified from the marrow of the same animals. Expression levels are expressed as 2-ΔCt and are presented as mean (±SD) of results obtained in 3 independent determinations per experimental point. Values statistically different by unpaired T-test analyses are indicated by * (p<0.05) and ** (p<0.01).
Since the phenotype of Gata1low mice includes hyperplasia of the spleen, increased number of white cells in the blood and reduced cellularity of the marrow [44], changes in cell frequency do not indicate changes in absolute cDC numbers. Therefore, the total number of cDCs in each tissue was calculated by multiplying the number of nucleated cells observed in the different tissues (Supplementary Table I) by the frequency of the different cDC populations obtained by FACS (Figure 1B). This calculation indicates that the spleens from Gata1low mice contain significantly greater absolute numbers of precursor and mature cDCs than those from wild-type mice (Figure 1C). Therefore, the presence of the hypomorphic Gata1low mutation increases the absolute numbers of cDCs in mice.
To identify whether the presence of the hypomorphic Gata1low mutation affects the expression of Gata1 in cDCs, the levels of Gata1 expressed by cDCs prospectively isolated from different tissues of wild-type and Gata1low littermates were compared by quantitative RT-PCR (Figure 1D). Gata1 was expressed by all the DC populations analyzed. In wild-type mice, cDCs expressed Gata1 at levels 1-2 log lower than those expressed by megakaryocytes and erythroid cells. The highest levels of expression were detected in cDC precursors purified from blood and spleen. The presence of the Gata1low mutation did not affect the levels of Gata1 expressed by the cDC precursors from marrow and spleen but significantly reduced the levels of Gata1 expressed by blood cDCs (by more than 1-log) and by mature splenic cDCs (by 50%). Therefore, the expression of Gata1 increases during the early phase of cDC maturation reaching its peak in cDC precursors in the blood. The observation that the Gata1low mutation reduces Gata1 expression in cDC precursors from the blood and in mature cDCs from the spleen indicates that Gata1 expression in both cells is driven by HS1.
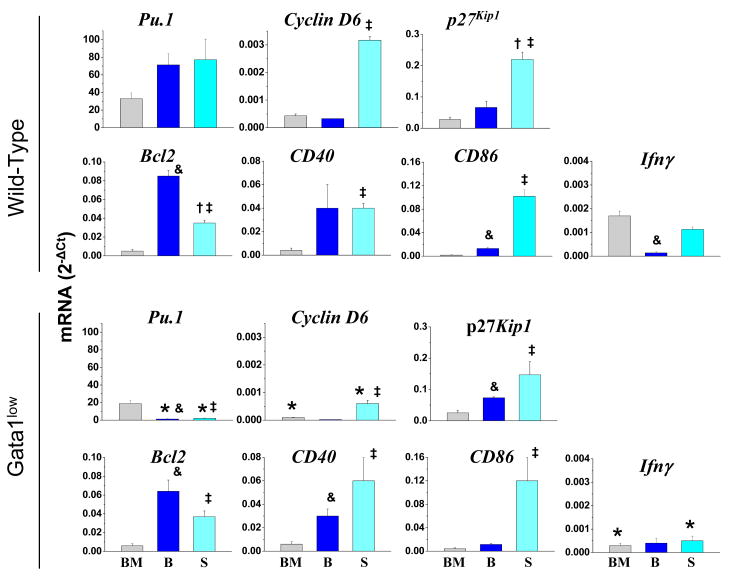
To further characterize the effects induced by the Gata1low mutation of cDC maturation, the levels of genes involved in the control of maturation (Pu.1), proliferation (cyclin D6 and p27Kip1), apoptosis (Bcl2) or encoding maturation (CD40 and CD86) and known Gata1-target (IFNγ) proteins expressed by cDC precursors purified from the bone marrow, blood and spleen of wild-type and Gata1low littermates were compared (Figure 2). In wild-type mice, the levels of expression of Pu.1 and of genes encoding proteins that controls the cell cycle (Cyclin D6 and p27Kip1) and cDC specific antigens (CD40 and CD86) increased in cDC populations purified from marrow, blood and spleen, suggesting that these cells are progressively more mature. By contrast, not only expression of Gata1 (Figure 1D) but also that of the anti-apoptotic Bcl2 gene (and of Ifnγ) was bell-shaped and reached its maximal (or in the case of Ifnγ its minimal) levels in cDC precursors purified from the blood (Figure 2). The presence of the Gata1low mutation significantly reduced the levels of Pu.1 (in blood and spleen) and of Ciclin D6 and Ifnγ (in marrow and spleen) expressed by cDCs. The reduced levels of Ifnγ expressed by Gata1low cDCs are consistent with the hypothesis that Gata1 is required for appropriate expression of this gene in cDCs [20] while the reduced levels of Pu.1 and Ciclin D6 suggest Gata1low cDCs may experience longer cell cycles and remain more immature than the corresponding cells from wild-type mice.
Figure 2. Levels of expression of genes involved in the control of maturation (Pu.1), proliferation (Cyclin D6 and p27Kip1), apoptosis (Bcl2) or encoding maturation (CD40 and CD86) and known Gata1-target (Ifnγ) proteins in CD11clow cDCc purified from the bone marrow (BM), blood (B) and spleen (S) of wild-type (top panels) and Gata1low (bottom panels) mice.
Cells were purified according to gates described in Figure 1. mRNA levels are expressed as 2-ΔCt and presented as mean (±SD) of values observed with cells independently purified from 3 wild-type and 3 Gata1low mice. Statistically significant differences (p<0.05) between values observed with corresponding wild-type and Gata1low cells and between values observed in BM vs B and, S or in B vs BM and S within the same animal group are indicated with *, & and ‡, respectively.
A reporter GFP gene driven by the HS2 enhancer is expressed in immature cDCs from blood, marrow and spleen
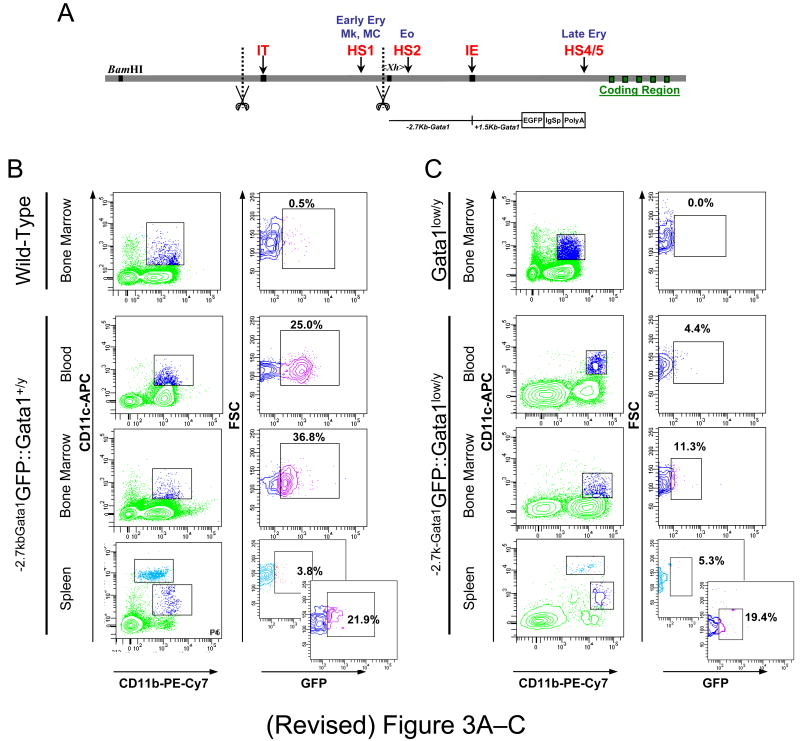
The regulatory regions that control Gata1 expression in DCs were further defined by analyzing the expression of a reporter gene driven by HS2, the enhancer not deleted by the Gata1low mutation in different cDC populations from the tissues of -2.7kb-Gata1GFP∷:Gata1+/y and -2.7kb-Gata1GFP∷:Gata1low/y male mice (Figure 3).
Figure 3. Conventional dendrititc cell (cDC) precursors from the blood express reduced levels of a reporter gene driven by the regulatory sequences of Gata1 spared by the Gata1low mutation.
A) Organization of the Gata1 locus showing the position of the two promoters, the proximal (IE) and the distal (IT) promoter [36] and of two DNase hypersensitive sites, HS1 and HS2 [29-34]. The scissors mark the region deleted by the Gata1low mutation while the sequences -2.7 Kb upstream and 1.5 Kb downstream of the IE promoter that drive expression of the reporter (-2.7KbGata1GPF) are indicated with a line. B) Flow cytometrical determinations of the expression of the reporter gene by cDCs (B220-/CD11b+/CD11clow or CD11chigh, see Figure 1) from blood, bone marrow and spleen of -2.7kbGata1GFP∷Gata1+/y and C) -2.7kbGata1GFP∷Gata1low/y male littermates presented as contour-plots. The top panels present the levels of GFP expressed by cCDs from the marrow of wild-type and Gata1low mice not carrying the reporter gene.
In -2.7kb-Gata1GFP∷Gata1+/y mice, several (22-37%) cDC precursors from blood, bone marrow and spleen expressed high reporter levels (Figure 3B). The highest levels of GFP-fluorescence were expressed by cDC precursors from the blood (the mean fluorescence intensity was 298 vs 130 and 128 in blood cDCs vs marrow and spleen cDCs). By contrast, the reporter was not expressed by mature CD11chigh cDCs from the spleen of these animals. In -2.7kb-Gata1GFP∷Gata1low/y mice, the frequency of mature splenic cDCs and of cDC precursors from the marrow and spleen expressing the reporter was similar to that observed in -2.7kb-Gata1GFP∷Gata1+/y mice (≅20%). However, in these Gata1GFP∷Gata1low/y mice, very few (≅4%) cDC precursors in the blood expressed the reporter (Figure 3C).
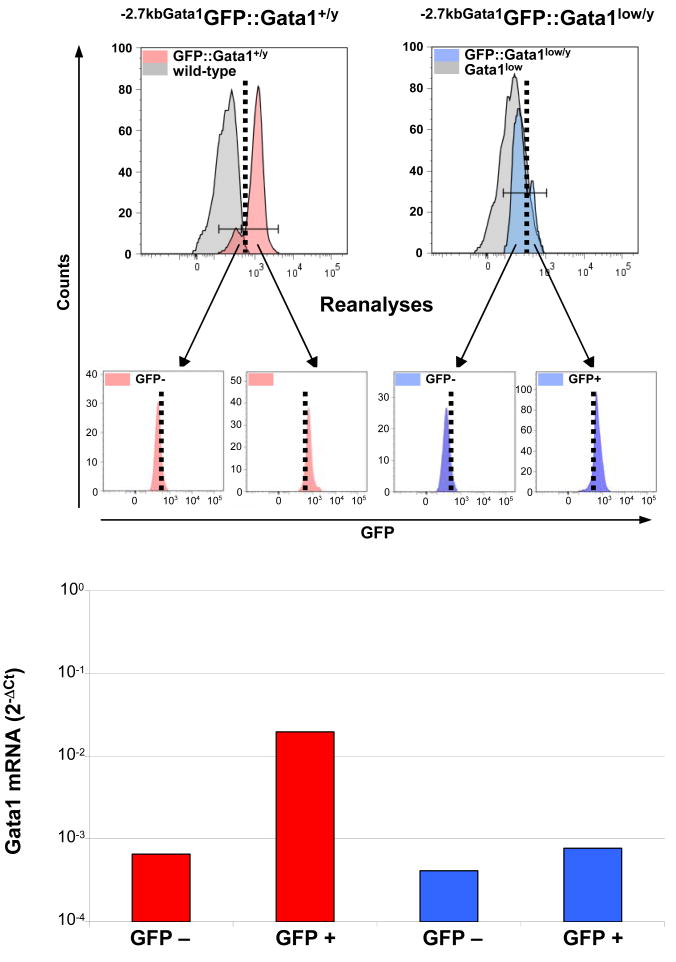
To confirm that the levels of reporter expression reflected those of the endogenous Gata1 gene, the levels of Gata1 expressed by GFP-positive and GFP-negative cCD precursors prospectively isolated from the blood of -2.7kb-Gata1GFP∷Gata1+/y and -2.7kb-Gata1GFP∷Gata1low/y mice were compared (Figure 4). Robust differences (almost 2 logs) in Gata1 expression were detected among the GFP-positive and GFP-negative cDC precursors purified from the blood of -2.7kb-Gata1GFP∷Gata1+/y mice. This result indicates that the high levels of Gata1 expressed by blood cDC precursors (Figure 1D) are restricted to a subpopulation of cells that are capable of activating the HS2 enhancer. By contrast, although CD11cpos expressing slightly different low levels of GFP were detectable in the blood of -2.7kb-Gata1GFP∷Gata1low/y mice, the two populations expressed comparable levels of Gata1. This last result indicates that the HS2 enhancer is active in these cells but is insufficient to activate high levels of expression on its own.
Figure 4. Conventional dendrititc cell (cDC) precursors present in the blood that express the GFP reporter express high levels of Gata1.
Levels of Gata1 mRNA expressed by cDCs (B220-/CD11b+/CD11clow, see Figure 1) prospectively isolated from the blood of -2.7kbGata1GFP∷Gata1+/y (left panels, red) and -2.7kbGata1GFP∷Gata1low/y (right panels, blue) mice, according to their levels of GFP expression. Negative controls are presented as gray histograms. The gating used for the purification and the reanalysis of the sorted cells for purity are presented in the top and middle panels, respectively. mRNA levels are expressed as 2-ΔCt. A representative experiment is presented.
These results complement those on the expression of the endogenous gene presented in Figure 1D. The reporter gene driven by HS2 was maximally expressed in those DC populations in which the presence of the Gata1low mutation did not affect Gata1 expression (i.e. cDC precursors from marrow and spleen), confirming that expression of Gata1 in these cells is likely predominantly driven by HS2. On the other hand, the reporter was barely expressed by mature splenic cDCs, in agreement with the observation that the presence of the Gata1low mutation greatly reduced Gata1 expression in this cell population (Figure 1D). This leads to the conclusion that expression of Gata1 in mature cDCs is driven by HS1. In contrast, although a significant number of CD11cpos cells from the blood expressed the reporter, the presence of the Gata1low mutation greatly reduced the levels of Gata1 (Figure 1D) and those of the reporter (Figures 3C and 4) expressed by this population. This indicates that the control of Gata1 expression is switching from a HS2-dependent to a HS1-dependent status in these cells.
Gata1low dendritic cells express reduced levels of accessory molecules
To identify whether impaired Gata1 expression might alter the maturation of the cDC precursors in the blood, the levels of surface expression of the accessory molecules CD40 and CD86 in DC precursors from the blood of wild-type and Gata1low littermates was compared by FACS (Figure 5).
Figure 5. The hypomorphic Gata1low mutation hampers the ability of conventional dendrititc cells (cDC) from the blood to express CD40 and CD86 on their surface.
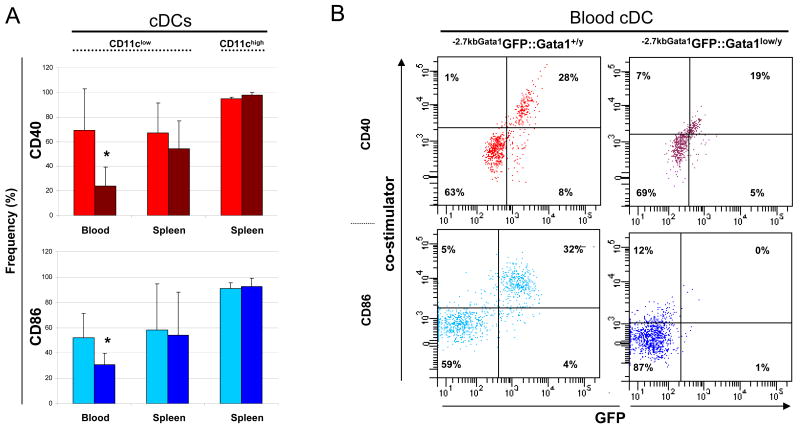
A) Frequency of cDCs (B220-/CD11b+/CD11clow or CD11chigh) expressing the accessory molecules CD40 (red) and CD86 (blue) in blood and spleen of wild-type (light red and blue) and Gata1low (dark red and blue) littermates. CD40 and CD86 positive cDCs in the marrow were below detectable levels. Results are presented as mean (±SD) of 3 independent determinations per experimental point. Values statistically different by unpaired T-test analyses are indicated by * (p<0.05). B) Four color flow cytometrical analyses for the expression of the HS2-driven reporter and of CD40 (top panels) or CD86 (bottom panels) by the cDCs (B220-/CD11b+/CD11clow, see Figure 1) in the blood from -2.7kbGata1GFP∷Gata1+/y and -2.7kbGata1GFP∷Gata1low/y littermates.
The frequency of blood cDC precursors of Gata1low mice expressing CD40 and CD86 was significantly lower than normal (∼50%, p<0.05; Figure 5A) while no difference in the frequency of cDCs expressing CD40 and CD86 was observed in spleen, analyzed as controls. These results suggest that the absence of the HS1 enhancer affects the ability of blood cDC precursors to express accessory molecules on their surface.
To confirm that HS2 cooperates with HS1 in driving Gata1 expression in cDC precursors from blood expressing accessory molecules, the expression of CD40 and CD86 was correlate with the ability of those cells to express the reporter (Figure 5B). In -2.7kb-Gata1GFP∷Gata1+/y mice, all the cDC precursors expressing GFP (28-32%) also expressed CD40 and CD86. By contrast, cDC precursors from -2.7kb-Gata1GFP∷Gata1low/y mice expressed neither GFP nor the accessory molecules.
The presence of the hypomorphic mutation hampers the ability of bone marrow cells to generate DC ex vivo in response to GM-CSF
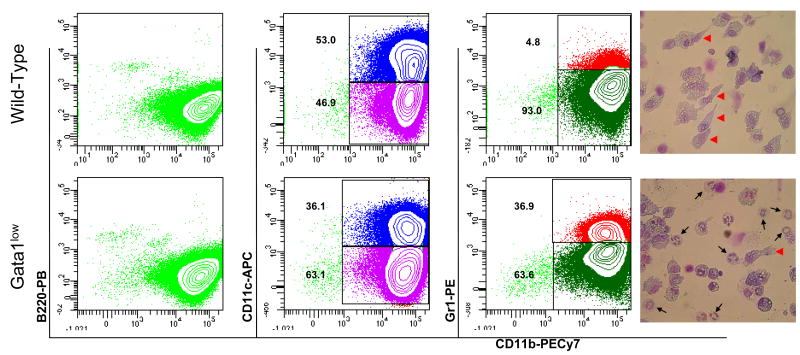
In order to further characterize the abnormalities of DC maturation induced by the Gata1low mutation, the ability of Gata1low and wild-type bone marrow cells to generate DCs in response to GM-CSF was evaluated (Figure 6). As expected, wild-type bone marrow cells stimulated with GM-CSF generated ex-vivo a homogeneous population of B220negCD11bpos cells, 50% of which expressed the CD11c antigen by day 6. This cell population had DC morphology and contained few (<5%) neutrophils, as indicated by lack of Gr1 expression and absence of morphologically recognizable neutrophils (Figure 6). By contrast, a great number (36-50%) of the progeny of bone marrow cells from Gata1low mice expanded ex-vivo under the same condition were neutrophils (CD11bposGr1pos cells) while the number of DCs generated in these cultures were greatly reduced (Figure 6). These results confirm that appropriate levels of Gata1 expression are required to generate DC ex-vivo in response to GM-SCF [20].
Figure 6. The presence of the Gata1low mutation hampers the ability of bone marrow cells to generate DCs ex vivo in response to GM-CSF.
Flow cytometrical analyses for the expression of CD11b in combination with B220 (left panels), CD11c (second panels) or Gr1 (third panels) of cells obtained after 6 days in GM-CSF-stimulated cultures of bone marrow cells from wild-type (top panels) and Gata1low (bottom panels) mice. May-Grunwald staining of representative cells is presented on the right. Representative cells with neutrophil- and DC-like morphology are indicated by arrows and arrowheads, respectively. Magnification 40×. Similar results were obtained in three additional experiments.
IL-4 partially rescues the ability of Gata1low bone marrow cells to generate DCs ex-vivo
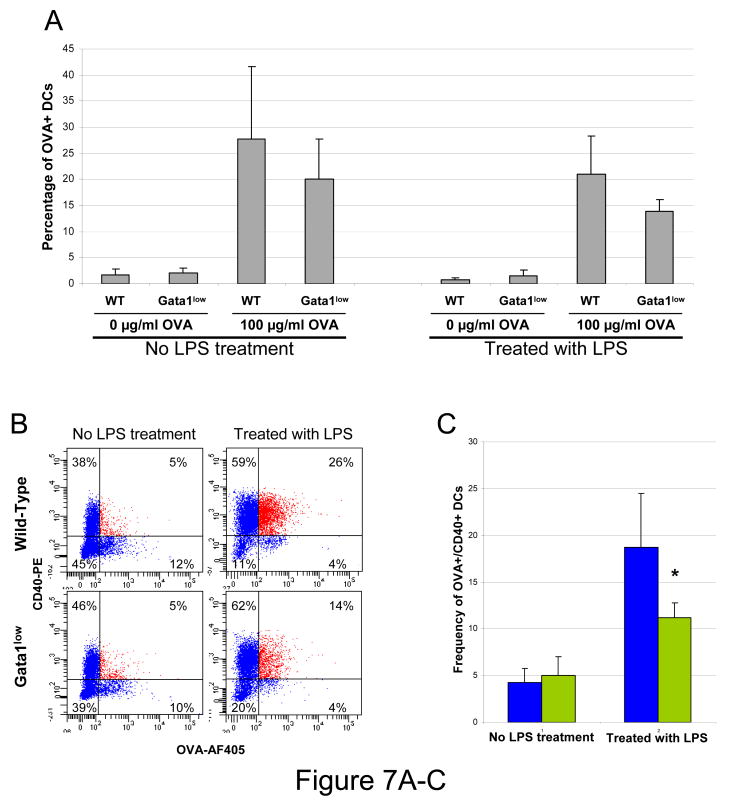
Since in addition with GM-CSF alone, DC expansion ex-vivo is also sustained by GM-CSF in combination with IL-4 [35,47,50], the ability of Gata1low bone marrow cells to generate DC ex vivo in response to GM-CSF and IL-4 was evaluated. After six days of culture, bone marrow cells from both wild-type and Gata1low mice stimulated with GM-SCF and IL-4 generated similar numbers of B220neg/CD11cpos/ CD11bpos DCs (11×106 vs 16×106 cDCs in wild-type and Gata1low cultures, respectively). Therefore, the presence of IL-4 partially rescued the ability of Gata1low progenitor cells to generate DCs ex vivo. However, the reduced expression of accessory molecules by Gata1low cDC precursors from blood suggests that these ex-vivo expanded Gata1low DC may fail to present accessory molecules (and possibly antigens) upon stimulation. To test this hypothesis, the ability of DCs generated in vitro from the marrow of wild-type and Gata1low mice to express CD40 upon antigen-priming and LPS stimulation was compared using ovalbumin (OVA) as antigen (Figure 7). An equivalent number of wild-type and Gata1low GM-CSF-derived DCs took up OVA (20-30% OVApos cells in both cases). Although the OVA uptake was not affected by addition of LPS, significantly fewer OVA-primed Gata1low DCs expressed OVA and CD40 on their surface upon LPS stimulation, compared to the corresponding wild-type cells (Figure 7). These results confirm the hypothesis that ex-vivo generated Gata1low DCs have impaired ability to present antigens and accessory molecules on their surface upon LPS stimulation.
Figure 7. Ex-vivo generated Gata1low cDCs have impaired ability to express the antigen and accessory molecules on the cell surface in response to LPS.
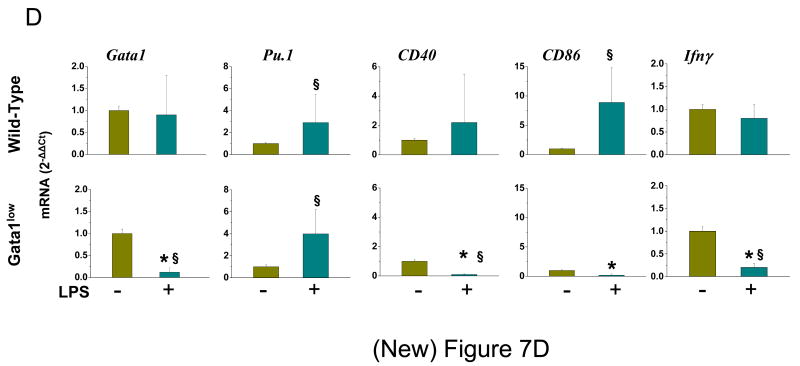
A) Levels of OVA uptaken by DCs generated ex vivo from wild-type and Gata1low bone marrow cells and exposed or not to LPS. B) Representative FACS analysis of surface expression of OVA and CD40 by ex-vivo generated DCs. The mean (±SD) frequency of double OVA and CD40 positive cDCs observed in 3 independent experiments is presented in C. Values statistically different by unpaired T-test analyses are indicated as *(p<0.05). D) Levels of Gata1, Pu.1, CD40, CD86 and Ifnγ expressed by DCs expanded ex-vivo from bone marrow cells of wild-type (upper panels) or Gata1low (bottom panels) mice in the presence of GM-CSF and IL-4 and stimulated (green) or not (yellow) for 24 hr with LPS. Results are presented as 2-ΔΔCt with respect to values observed in −LPS samples and are presented as mean (±SD) of values observed in 3 independent experiments. Non-stimulated wild-type and Gata1low DCs expressed comparable levels of all the genes investigated (not shown). Statistically significant differences (p<0.05) between values observed − and + LPS-stimulation within the same mouse group are indicated by § while statistically significant differences between values observed between LPS-stimulated wild-type and Gata1low cells are indicated with *.
To further characterize the role of Gata1 in the response of DCs to LPS, the levels of Gata1, Pu.1, CD40, CD86 and Ifnγ expressed by ex-vivo expanded wild-type and Gata1low DCs in the presence or not of LPS were compared (Figure 7D). In wild-type DCs, LPS stimulation did not affect Gata1 expression but induced Pu.1, CD40 and CD86 expression. By contrast, in Gata1low DCs, LPS stimulation increased Pu.1 expression but reduced Gata1, CD40, CD86 and Ifnγ expression. These results suggest that the failure of Gata1low DCs to present CD40 and CD86 on their surface in response to LPS stimulation (Figure 7B, C) is linked to the inability of these cells to activate expression of these two genes in response to LPS. In addition, the observation that the impaired response to LPS of ex vivo expanded Gata1low DCs is associated with normal levels of Pu.1 mRNA but greatly reduced levels of Gata1 mRNA confirms the hypothesis that Gata1 exerts a direct positive regulatory function in DC maturation [20].
Dynamic chromatin rearrangements take place upon DCs stimulation with LPS
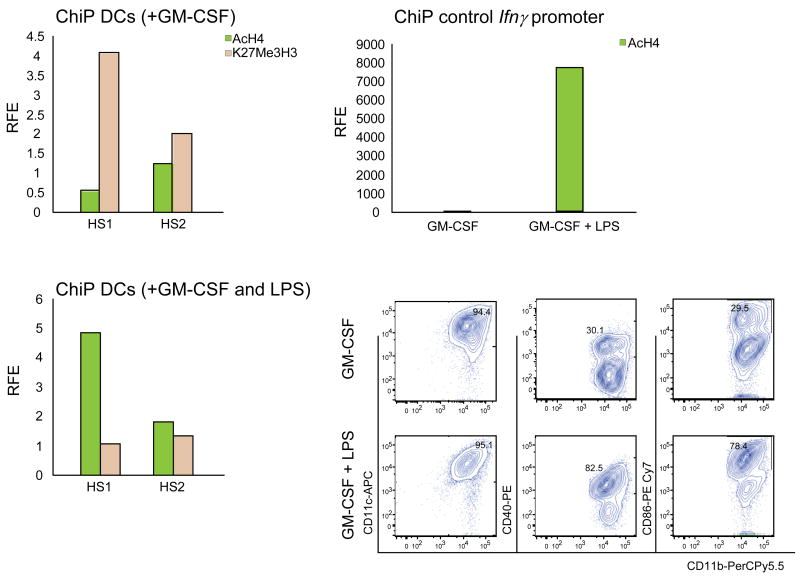
The observation that LPS-stimulated Gata1low DCs express levels of Gata1 significantly lower than those expressed by the corresponding wild-type DCs (Figure 7D) suggests that the HS1 enhancer is activated as part of the DC response to LPS. To test this hypothesis, we analyzed occupancy at the HS1 and HS2 sites of histones that mark active, Anti-acetyl Histone 4 (AcH4) [51], and inactive, Anti-trimethyl K27 Histone 3 (K27Me3H3) [52], chromatin configurations by ChIP in GM-CSF-derived wild-type DCs stimulated with LPS or media for 24 hr (Figure 8). The GATA binding site on the Ifnγ promoter was analyzed in parallel, as positive control. HS1 appeared to be inactive in unstimulated DCs as shown by the enrichment after ChIP for K27Me3H3 binding. Upon LPS stimulation, K27Me3H3 binding to HS1 was reduced 4-fold while AcH4 binding increased by 10-fold, as compared to unstimulated DCs. No significant changes in the histone occupancy was detectable in the HS2 region upon LPS stimulation. These results suggest that LPS stimulation leads to an active HS1 configuration of the Gata1 gene.
Figure 8. LPS induces AcH4 and reduces K27Me3H3 occupancy at the HS1 region of Gata1 in DCs expanded ex-vivo from wild-type mice.
ChIP was performed with anti-AcH4 and anti-K27Me3H3 antibodies using chromatin prepared from wild-type DCs expanded in the presence of GM-CSF and pulsed (bottom left panel) or not (top left panel) with LPS for 18hr. Controls for LPS stimulations were represented by ChIP analysis of the LPS-inducible GATA binding site of the Ifnγ promoter (top right panel) and flow cytometrical analysis for CD40 and CD86 surface expression (bottom right panels). AcH4 and K27Me3H3 binding is expressed as relative fold enrichment (RFE) after subtracting anti-GST antibody binding (negative control).
Discussion
The experiments presented in this paper indicate that the expression of Gata1 increases during the process of DC maturation, peaking in blood cDC precursors (Figure 1 and 4). The increase in Gata1 expression is associated with a dynamic pattern of gene regulation which sequentially falls under the control of HS2 and HS1 summarized in Figure 8. cDC precursors from the marrow and splenic express the reporter driven by HS2 (Figure 3), and the levels of endogenous Gata1 gene expressed by these cells are not affected by the presence of the Gata1low mutation (Figure 1). In contrast with results obtained by tamoxifen-induced ablation of Gata1 expression, the Gata1low mutation does not reduce but increases the number of cDC precursors observed in marrow and spleen (Figure 1). This result is akin to the accumulation of erythroid progenitors observed in mice carrying the hypomorphic Gata1low [29] or Gata10.5 [30,32] mutations. We believe that this accumulation reflect an alteration in the speed with which the DC precursors mature. In fact, the maturation process may be described as a sequential cellular transition through a series of progressively more mature compartments. The numbers of the cells within each compartment (i.e., the size of the compartment) is affected by at least three parameters: numbers of 1) mitotic and 2) apoptotic events allowed within that compartment and 3) speed with which the cells mature to next stage. To clarify the mechanism responsible for the expansion of the cDC compartments observed in Gata1low mice, the levels of expression of genes that control cell cycle (Cyclin D6 and p27Kip1), apoptosis (Bcl2) or maturation (Gata1 and Pu1) as well as markers of differentiation (Ifnγ, CD40 and CD86) in cDC precursors isolated from the marrow, blood and spleen of Gata1low and wild-type littermates was compared (Figure 2). Gata1low cDC precursors expressed normal levels of Bcl2, suggesting that these cells undergo apoptosis at rates similar to those of wild-type cells. These cells, however, expressed levels of Ciclin D6 and p27kip1 lower than those expressed by normal cells, suggesting that they may cycle at rates lower than normal allowing them to translate sufficient amounts of Gata1 and Pu1 protein (in spite of reduced Gata1 and Pu1 mRNA levels) to mature to the next stage. Unfortunately, due to the low numbers of cDCs that can be purified from the tissues of these animals, it was not possible to directly confirm this hypothesis by protein analyses.
The Gata1 mutation reduces the levels of Gata1 expressed by blood cDC precursors and hampers the expression of stimulatory molecules on the surface of these cells (Figure 1, 4 and 5). In addition, cDC precursors from the blood of -2.7kb-Gata1GFP∷Gata1+/y animals that express the accessory molecules CD86 and CD40 also express the reporter (Figure 5). It is conceivable, therefore, that Gata1 expression in these cells is driven both by HS2 and HS1 suggesting that during the process of cDC maturation in the blood the regulation of Gata1 expression shifts from a HS1-dependent to a HS2 (and/or HS1)-dependent phase.
By contrast, the expression of Gata1 in mature cDCs from the spleen was greatly reduced by the presence of the Gata1low mutation (Figure 1D), and these cells did not express the reporter (Figure 3A). These results indicate that expression of Gata1 in these cells is dominantly controlled by HS1.
Unlike other Gata1-deficient mutants [30,32], Gata1low mice are viable and have a normal life-span [44] allowing us to observe the association between up-regulation of Gata1 expression and surface expression of accessory proteins in blood cDC precursors. It is possible that the two events are linked and that surface expression of accessory molecules is controlled by Gata1. In support to this hypothesis, DCs generated in vitro from Gata1low mice, although capable to uptake OVA, had a markedly reduced capacity to present both the antigen and CD40 on the cell surface in response to LPS. How Gata1 regulates antigen and accessory presentation in response to LPS is currently not known. Since the regulatory regions of the CD40 and CD86 gene contain Gata1 binding sites, it is possible that Gata1 directly controls their expression. This hypothesis is supported by the observation that ex-vivo expanded Gata1low DCs express upon LPS-stimulation levels of CD40 and CD86 mRNA lower than those expressed by the corresponding LPS-stimulated wild-type cells (Figure 7D). The fact that, with the exception of significantly reduced levels of CD86 expression in mature cDCs from the spleen (data not shown), cDC precursors from Gata1low mice expressed levels of CD86 and CD40 mRNA similar to those expressed by the corresponding wild-type cells (Figure 2) may be explained with the normal levels of Gata1 protein accumulated by the cells in vivo as a consequence of longer cell cycle lengths hypothesized before. It is also possible that Gata1 regulates the expression of a protein(s) that chaperones CD40, CD86 and the antigens to the cell surface.
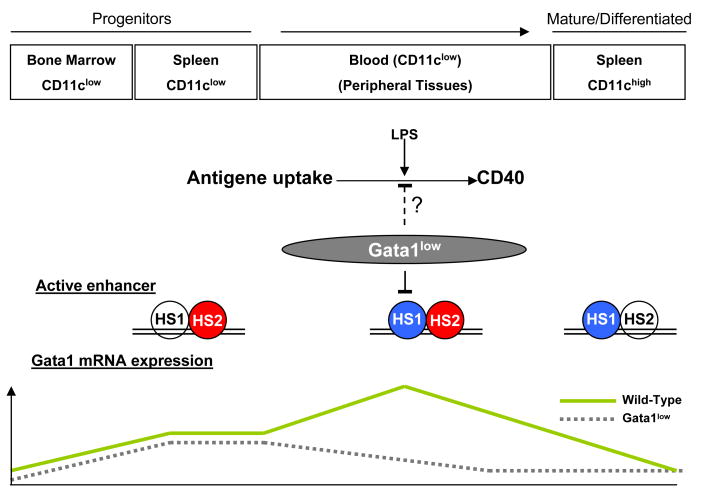
It is tempting to speculate that the same trigger (i.e. LPS) that stimulates antigen presentation regulates the switch from the HS2- to the HS1-dependent Gata1 expression in blood cDC precursors (Figure 9), as supported by the observation that LPS treatment increases the levels of Gata1 expressed by in vitro generated DCs [20 and Figure 7D]. To test this hypothesis, we documented by ChIP that the histone occupancy of the HS1 region of Gata1 in ex vivo generated wild-type DCs shift from an inactive K27Me3H3 occupancy to an active AcH4 occupancy status upon LPS stimulation (Figure 8), an indication that HS1 may contain LPS-responsive elements. The sequence of these responsive elements will be identified in a separate study.
Figure 9. A model describing the regulatory regions driving Gata1 expression during the maturation of DCs.
A model is proposed to characterize a dynamic pattern of chromatin configuration in DCs that sequentially recruits the HS1 and HS2 enhancer to control Gata1 expression. In CD11clow cells, Gata1 expression is driven by HS2. In blood cDC precursors, Gata1 expression is controlled by HS2 and HS1 in combination. In mature cDCs from spleen, Gata1 expression is under the control of HS1.
The hypothesis that Gata1 expression in cDC precursors from marrow and spleen is driven by HS1 is based on results of -2.7kb-Gata1GFP reporter gene expression. The regulatory regions of Gata1 identified so far span over 10 kb upstream of the Gata1 coding region [48]. Experiments with large BAC transgenic mice are revealing the existence of additional Gata1 regulatory elements up to 30 Kb upstream of the Gata1 coding region [53 and Yamamoto et al., personal communication to SP]. It is therefore possible that regulatory regions different from HS1 also spared by the hypomorphic Gata1low mutation may drive Gata1 expression in cDC precursors. Interpretation of results of reporter gene expression experiments such as the -2.7kb-Gata1GFP reporter used in our study is, in fact, complicated by the possibility of position variegation and/or trap enhancer/gene sequence effects. Although, knock-in reporter gene approaches have the potential to resolve this problem, these approaches are impractical with X-linked genes such as Gata1 because they would be lethal in males and non-informative in heterozygous females due to the random nature of the lyonization X-inactivation process. However, in view of the fact that, in spite to these biases, reporter gene expression approaches have in general provided useful information for the regulation of gene expression in the past (see for example the advancement that this approach has allowed to our understanding of the regulation of the globin-gene locus) [54,55], we believe that the HS2-driven GFP expression described in Figure 3, 4 and 5 identifies cDC populations in which HS2 is active.
In conclusion, this study has identified a dynamic regulation of Gata1 expression during DC development and new functions of Gata1 during maturation of these cells.
Supplementary Material
Acknowledgments
The authors gratefully acknowledge Prof. David Scadden (Boston, USA) for providing the -2.7kb-Gata1GFP mice and Prof. Miriam Merad (Mount Sinai School of Medicine, NY, USA) for critical review of the data and for discussion. This study was supported by a grant from the National Cancer Institute (P01-CA108671) and the Ministero per la Ricerca Scientifica (RBNE0189JJ_003 and RBNE015P72_003) (to ARM), the Dutch organization for scientific research NWO (to SP) and the EU Marie Curie research training network EUrythron (to GTK).
Footnotes
Conflict of interest disclosure: The authors declare no conflict of interest.
Publisher's Disclaimer: This is a PDF file of an unedited manuscript that has been accepted for publication. As a service to our customers we are providing this early version of the manuscript. The manuscript will undergo copyediting, typesetting, and review of the resulting proof before it is published in its final citable form. Please note that during the production process errors may be discovered which could affect the content, and all legal disclaimers that apply to the journal pertain.
References
- 1.Watts C. Capture and processing of exogenous antigens for presentation on MHC molecules. Annu Rev Immunol. 1997;15:821–850. doi: 10.1146/annurev.immunol.15.1.821. [DOI] [PubMed] [Google Scholar]
- 2.Shortman K, Liu YJ. Mouse and human dendritic cell subtypes. Nat Rev Immunol. 2002;2:151–161. doi: 10.1038/nri746. [DOI] [PubMed] [Google Scholar]
- 3.Grouard G, Rissoan MC, Filgueira L, Durand I, Banchereau J, Liu YJ. The enigmatic plasmacytoid T cells develop into dendritic cells with interleukin (IL)-3 and CD40-ligand. J Exp Med. 1997;185:1101–1111. doi: 10.1084/jem.185.6.1101. [DOI] [PMC free article] [PubMed] [Google Scholar]
- 4.Theofilopoulos AN, Baccala R, Beutler B, Kono DH. Type I interferons (alpha/beta) in immunity and autoimmunity. Annu Rev Immunol. 2005;23:307–336. doi: 10.1146/annurev.immunol.23.021704.115843. [DOI] [PubMed] [Google Scholar]
- 5.Asselin-Paturel C, Boonstra A, Dalod M, et al. Mouse type I IFN-producing cells are immature APCs with plasmacytoid morphology. Nat Immunol. 2001;2:1144–1150. doi: 10.1038/ni736. [DOI] [PubMed] [Google Scholar]
- 6.Inaba K, Inaba M, Deguchi M, et al. Granulocytes, macrophages, and dendritic cells arise from a common major histocompatibility complex class II-negative progenitor in mouse bone marrow. Proc Natl Acad Sci USA. 1993;90:3038–3042. doi: 10.1073/pnas.90.7.3038. [DOI] [PMC free article] [PubMed] [Google Scholar]
- 7.Wu L, Liu YJ. Development of dendritic-cell lineages. Immunity. 2007;26:741–750. doi: 10.1016/j.immuni.2007.06.006. [DOI] [PubMed] [Google Scholar]
- 8.Cella M, Engering A, Pinet V, Pieters J, Lanzavecchia A. Inflammatory stimuli induce accumulation of MHC class II complexes on dendritic cells. Nature. 1997;388:782–787. doi: 10.1038/42030. [DOI] [PubMed] [Google Scholar]
- 9.Maldonado-Lopez R, De Smedt T, Michel P, et al. CD8alpha+ and CD8alpha-subclasses of dendritic cells direct the development of distinct T helper cells in vivo. J Exp Med. 1999;189:587–592. doi: 10.1084/jem.189.3.587. [DOI] [PMC free article] [PubMed] [Google Scholar]
- 10.Mason DW, Pugh CW, Webb M. The rat mixed lymphocyte reaction: roles of a dendritic cell in intestinal lymph and T-cell subsets defined by monoclonal antibodies. Immunology. 1981;44:75–87. [PMC free article] [PubMed] [Google Scholar]
- 11.Sallusto F, Lanzavecchia A. Efficient presentation of soluble antigen by cultured human dendritic cells is maintained by granulocyte/macrophage colony-stimulating factor plus interleukin 4 and downregulated by tumor necrosis factor alpha. J Exp Med. 1994;179:1109–1118. doi: 10.1084/jem.179.4.1109. [DOI] [PMC free article] [PubMed] [Google Scholar]
- 12.Sallusto F, Cella M, Danieli C, Lanzavecchia A. Dendritic cells use macropinocytosis and the mannose receptor to concentrate macromolecules in the major histocompatibility complex class II compartment: downregulation by cytokines and bacterial products. J Exp Med. 1995;182:389–400. doi: 10.1084/jem.182.2.389. [DOI] [PMC free article] [PubMed] [Google Scholar]
- 13.Randolph GJ, Angeli V, Swartz MA. Dendritic-cell trafficking to lymph nodes through lymphatic vessels. Nat Rev Immunol. 2005;5:617–628. doi: 10.1038/nri1670. [DOI] [PubMed] [Google Scholar]
- 14.Kroczek RA, Mages HW, Hutloff A. Emerging paradigms of T-cell co-stimulation. Curr Opin Immunol. 2004;16:321–327. doi: 10.1016/j.coi.2004.03.002. [DOI] [PubMed] [Google Scholar]
- 15.Riley JL, Mao M, Kobayashi S, et al. Modulation of TCR-induced transcriptional profiles by ligation of CD28, ICOS, and CTLA-4 receptors. Proc Natl Acad Sci USA. 2002;99:11790–11795. doi: 10.1073/pnas.162359999. [DOI] [PMC free article] [PubMed] [Google Scholar]
- 16.Witsch EJ, Peiser M, Hutloff A, et al. ICOS and CD28 reversely regulate IL-10 on re-activation of human effector T cells with mature dendritic cells. Eur J Immunol. 2002;32:2680–2686. doi: 10.1002/1521-4141(200209)32:9<2680::AID-IMMU2680>3.0.CO;2-6. [DOI] [PubMed] [Google Scholar]
- 17.Tureci O, Bian H, Nestle FO, et al. Cascades of transcriptional induction during dendritic cell maturation revealed by genome-wide expression analysis. Faseb J. 2003;17:836–847. doi: 10.1096/fj.02-0724com. [DOI] [PubMed] [Google Scholar]
- 18.Fujii S, Liu K, Smith C, Bonito AJ, Steinman RM. The linkage of innate to adaptive immunity via maturing dendritic cells in vivo requires CD40 ligation in addition to antigen presentation and CD80/86 costimulation. J Exp Med. 2004;199:1607–1618. doi: 10.1084/jem.20040317. [DOI] [PMC free article] [PubMed] [Google Scholar]
- 19.Cantor AB, Orkin SH. Transcriptional regulation of erythropoiesis: an affair involving multiple partners. Oncogene. 2002;21:3368–3376. doi: 10.1038/sj.onc.1205326. [DOI] [PubMed] [Google Scholar]
- 20.Gutierrez L, Nikolic T, van Dijk TB, et al. Gata1 regulates dendritic-cell development and survival. Blood. 2007;110:1933–1941. doi: 10.1182/blood-2007-05-091397. [DOI] [PMC free article] [PubMed] [Google Scholar]
- 21.Tanaka H, Matsumura I, Nakajima K, et al. GATA-1 blocks IL-6-induced macrophage differentiation and apoptosis through the sustained expression of cyclin D1 and bcl-2 in a murine myeloid cell line M1. Blood. 2000;95:1264–1273. [PubMed] [Google Scholar]
- 22.Bakri Y, Sarrazin S, Mayer UP, et al. Balance of MafB and PU.1 specifies alternative macrophage or dendritic cell fate. Blood. 2005;105:2707–2716. doi: 10.1182/blood-2004-04-1448. [DOI] [PubMed] [Google Scholar]
- 23.Arinobu Y, Mizuno S, Chong Y, et al. Reciprocal activation of GATA-1 and PU.1 marks initial specification of hematopoietic stem cells into myeloerythroid and myelolymphoid lineages. Cell Stem Cell. 2007;1:416–427. doi: 10.1016/j.stem.2007.07.004. [DOI] [PubMed] [Google Scholar]
- 24.Chen JY, You YK, Chen JC, Huang TC, Kuo CM. Organization and promoter analysis of the zebrafish (Danio rerio) interferon gene. DNA Cell Biol. 2005;24:641–650. doi: 10.1089/dna.2005.24.641. [DOI] [PubMed] [Google Scholar]
- 25.Sundrud MS, Vancompernolle SE, Eger KA, et al. Transcription factor GATA-1 potently represses the expression of the HIV-1 coreceptor CCR5 in human T cells and dendritic cells. Blood. 2005;106:3440–3448. doi: 10.1182/blood-2005-03-0857. [DOI] [PMC free article] [PubMed] [Google Scholar]
- 26.Triantis V, Moulin V, Looman MW, Hartgers FC, Janssen RA, Adema GJ. Molecular characterization of the murine homologue of the DC-derived protein DC-SCRIPT. J Leukoc Biol. 2006;79:1083–1091. doi: 10.1189/jlb.1005588. [DOI] [PubMed] [Google Scholar]
- 27.McKimmie CS, Fraser AR, Hansell C, et al. Hemopoietic cell expression of the chemokine decoy receptor D6 is dynamic and regulated by GATA1. J Immunol. 2008;181:8171–8181. doi: 10.4049/jimmunol.181.11.8170-a. [DOI] [PubMed] [Google Scholar]
- 28.Göbel F, Taschner S, Jurkin J, et al. Reciprocal role of GATA-1 and vitamin D receptor in human myeloid dendritic cell differentiation. Blood. 2009;114:3813–3821. doi: 10.1182/blood-2009-03-210484. [DOI] [PubMed] [Google Scholar]
- 29.McDevitt MA, Shivdasani RA, Fujiwara Y, Yang H, Orkin SH. A “knockdown” mutation created by cis-element gene targeting reveals the dependence of erythroid cell maturation on the level of transcription factor GATA-1. Proc Natl Acad Sci USA. 1997;94:6781–6785. doi: 10.1073/pnas.94.13.6781. [DOI] [PMC free article] [PubMed] [Google Scholar]
- 30.Takahashi S, Onodera K, Motohashi H, Suwabe N, Hayashi N, Yanai N, Nabesima Y, Yamamoto M. Arrest in primitive erythroid cell development caused by promoter-specific disruption of the GATA-1 gene. J Biol Chem. 1997;272:12611. doi: 10.1074/jbc.272.19.12611. [DOI] [PubMed] [Google Scholar]
- 31.Onodera K, Takahashi S, Nishimura S, et al. GATA-1 transcription is controlled by distinct regulatory mechanisms during primitive and definitive erythropoiesis. Proc Natl Acad Sci USA. 1997;94:4487–4492. doi: 10.1073/pnas.94.9.4487. [DOI] [PMC free article] [PubMed] [Google Scholar]
- 32.Takahashi S, Shimizu R, Suwabe N, et al. GATA factor transgenes under GATA-1 locus control rescue germline GATA-1 mutant deficiencies. Blood. 2000;96:910–916. [PubMed] [Google Scholar]
- 33.Yu C, Cantor AB, Yang H, et al. Targeted deletion of a high-affinity GATA-binding site in the GATA-1 promoter leads to selective loss of the eosinophil lineage in vivo. J Exp Med. 2002;195:1387–1395. doi: 10.1084/jem.20020656. [DOI] [PMC free article] [PubMed] [Google Scholar]
- 34.Shimizu R, Kuroha T, Ohneda O, et al. Leukemogenesis caused by incapacitated GATA-1 function. Mol Cell Biol. 2004;24:10814–10825. doi: 10.1128/MCB.24.24.10814-10825.2004. [DOI] [PMC free article] [PubMed] [Google Scholar]
- 35.Pan X, Ohneda O, Ohneda K, et al. Graded levels of GATA-1 expression modulate survival, proliferation, and differentiation of erythroid progenitors. J Biol Chem. 2005;280:22385–22394. doi: 10.1074/jbc.M500081200. [DOI] [PubMed] [Google Scholar]
- 36.Ito E, Toki T, Ishihara H, et al. Erythroid transcription factor GATA-1 is abundantly transcribed in mouse testis. Nature. 1993;362:466–468. doi: 10.1038/362466a0. [DOI] [PubMed] [Google Scholar]
- 37.Nishimura S, Takahashi S, Kuroha T, et al. A GATA box in the GATA-1 gene hematopoietic enhancer is a critical element in the network of GATA factors and sites that regulate this gene. Cell Biol. 2000;20:713–23. doi: 10.1128/mcb.20.2.713-723.2000. [DOI] [PMC free article] [PubMed] [Google Scholar]
- 38.Vyas P, Ault K, Jackson CW, Orkin SH, Shivdasani RA. Consequences of GATA-1 deficiency in megakaryocytes and platelets. Blood. 1999;93:2867–2875. [PubMed] [Google Scholar]
- 39.Vyas P, McDevitt MA, Cantor AB, Katz SG, Fujiwara Y, Orkin SH. Different sequence requirements for expression in erythroid and megakaryocytic cells within a regulatory element upstream of the GATA-1 gene. Development. 1999;126:2799–2811. doi: 10.1242/dev.126.12.2799. [DOI] [PubMed] [Google Scholar]
- 40.Migliaccio AR, Rana RA, Sanchez M, et al. GATA-1 as a regulator of mast cell differentiation revealed by the phenotype of the GATA-1low mouse mutant. J Exp Med. 2003;197:281–296. doi: 10.1084/jem.20021149. [DOI] [PMC free article] [PubMed] [Google Scholar]
- 41.Hirasawa R, Shimizu R, Takahashi S, et al. Essential and instructive roles of GATA factors in eosinophil development. J Exp Med. 2002;195:1379–1386. doi: 10.1084/jem.20020170. [DOI] [PMC free article] [PubMed] [Google Scholar]
- 42.Abe K, Shimizu R, Pan X, Hamada H, Yoshikawa H, Yamamoto M. Stem cells of GATA1-related leukemia undergo pernicious changes after 5-fluorouracil treatment. Exp Hematol. 2009;37:435–445. doi: 10.1016/j.exphem.2008.12.004. [DOI] [PubMed] [Google Scholar]
- 43.Kobayashi E, Shimizu R, Kikuchi Y, Takahashi S, Yamamoto M. Loss of the Gata1 gene IE exon leads to variant transcript expression and the production of a GATA1 protein lacking the N-terminal domain. J Biol Chem. 2010;285:773–783. doi: 10.1074/jbc.M109.030726. [DOI] [PMC free article] [PubMed] [Google Scholar]
- 44.Martelli F, Ghinassi B, Panetta B, et al. Variegation of the phenotype induced by the Gata1low mutation in mice of different genetic backgrounds. Blood. 2005;106:4102–4113. doi: 10.1182/blood-2005-03-1060. [DOI] [PubMed] [Google Scholar]
- 45.Varricchio L, Mancini A, Migliaccio AR. Pathological interactions between hemopoietic stem cells and their niche revealed by mouse models of primary myelofibrosis. Expert Review Hematology. 2009;2:315–334. doi: 10.1586/ehm.09.17. [DOI] [PMC free article] [PubMed] [Google Scholar]
- 46.Skoda RC, Tsai SF, Orkin SH, Leder P. Expression of c-MYC under the control of GATA-1 regulatory sequences causes erythroleukemia in transgenic mice. J Exp Med. 1995;181:1603–1613. doi: 10.1084/jem.181.5.1603. [DOI] [PMC free article] [PubMed] [Google Scholar]
- 47.Montoya M, Schiavoni G, Mattei F, et al. Type I interferons produced by dendritic cells promote their phenotypic and functional activation. Blood. 2002;99:3263–3271. doi: 10.1182/blood.v99.9.3263. [DOI] [PubMed] [Google Scholar]
- 48.Follows GA, Tagoh H, Lefevre P, Hodge D, Morgan GJ, Bonifer C. Epigenetic consequences of AML1-ETO action at the human c-FMS locus. EMBO J. 2003;22:2798–809. doi: 10.1093/emboj/cdg250. [DOI] [PMC free article] [PubMed] [Google Scholar]
- 49.Guyot B, Murai K, Fujiwara Y, et al. Characterization of a megakaryocyte-specific enhancer of the key hemopoietic transcription factor GATA1. J Biol Chem. 2006;281:13733–13742. doi: 10.1074/jbc.M602052200. [DOI] [PubMed] [Google Scholar]
- 50.Menges M, Baumeister T, Rössner S, et al. IL-4 supports the generation of a dendritic cell subset from murine bone marrow with altered endocytosis capacity. J Leukoc Biol. 2005;77:535–543. doi: 10.1189/jlb.0804473. [DOI] [PubMed] [Google Scholar]
- 51.Shia WJ, Pattenden SG, Workman JL. Histone H4 lysine 16 acetylation breaks the genome's silence. Genome Biol. 2006;7:217–217.3. doi: 10.1186/gb-2006-7-5-217. [DOI] [PMC free article] [PubMed] [Google Scholar]
- 52.Plath K, Fang J, Mlynarczyk-Evans SK, et al. Role of histone H3 lysine 27 methylation in × inactivation. Science. 2003;300:131–135. doi: 10.1126/science.1084274. [DOI] [PubMed] [Google Scholar]
- 53.Suzuki M, Moriguchi T, Ohneda K, Yamamoto M. Differential contribution of the Gata1 gene hematopoietic enhancer to erythroid differentiation. Mol Cell Biol. 2009;29:1163–75. doi: 10.1128/MCB.01572-08. [DOI] [PMC free article] [PubMed] [Google Scholar]
- 54.Stamatoyannopoulos G, Grosveld F. Hemoglobin switching. In: Stamatoyannopoulos G, Majerus pw, editors. The molecular basis of blood disease. Philadelphia: Saunders; 2001. pp. 135–182. [Google Scholar]
- 55.Stamatoyannopoulos G. Control of globin gene expression during development and erythroid differentiation. Exp Hematol. 2005;33:259–271. doi: 10.1016/j.exphem.2004.11.007. [DOI] [PMC free article] [PubMed] [Google Scholar]
Associated Data
This section collects any data citations, data availability statements, or supplementary materials included in this article.


