Abstract
Circulating tumor cells (CTCs) refer to cells that detach from a primary tumor, circulate in the blood stream, and may settle down at a secondary site and form metastases. The detection and characterization of CTCs are clinically useful for diagnosis and prognosis purposes. However, there has been very little work on purging CTCs from the blood. In this study, we systematically studied electroporation of tumor and blood cells in the context of selective purging and analysis of CTCs, using M109 and mouse blood cells as models. Electroporation is a simple and effective method for disruption of the cell membrane by applying an external electric field. We applied a microfluidic flow-through electroporation to process cells with various electroporation durations and field intensities. With duration of 100–300 ms, we found that the thresholds for electroporation-induced lysis started at 300–400 V cm−1 for M109, 400–500 V cm−1 for white blood cells and 1100–1200 V cm−1 for red blood cells. Due to the substantial difference, we demonstrated the selective electroporation of tumor cells among blood cells and the scale-up of the flow-through electroporation devices for processing samples of millilitre volumes. Using Coherent Anti-stokes Raman Scattering (CARS) and fluorescence microscopy tools, we observed the dramatic increase in the size of the nucleus of a tumor cell in response to the applied field. We suggest that the nucleus expansion is a newly discovered mechanism responsible for rapid tumor cell death resulted from electroporation.
Introduction
Metastasis is the leading cause of death in patients with solid epithelial tumors. Many patients die from metastatic cancers despite having no clinically detectable disease after treatment. Disseminated tumor cells are believed to play an important role in these processes. They can be detected in regional lymph nodes, peripheral blood, and bone marrow of cancer patients even at early stages of tumor progression.1 Estimated based on model systems, as much as ~ 1 × 10⁶ tumor cells per gram of tumor tissue can be shed into the blood stream daily.2 These circulating tumor cells (CTCs) in peripheral blood can travel to sites that are anatomically distant from the primary tumor to form metastases. CTCs have been suggested as indicators for prognosis and clinical management (e.g. determination of success/failure of therapeutic intervention).3–7 The focus related to CTC biology has mostly been on detection and quantification of CTCs from blood.5–10 However, because CTCs are potential sources of lethal metastases that lead to treatment failure, the removal or destruction of CTCs in the blood may have important clinical applications.
Electroporation is a powerful physical method for disrupting the cell membrane. During electroporation, an external electric field is applied to cells to create nanoscale pores in the plasma membrane and these electropores allow exogenous materials (e.g. DNA or large drug molecules) to enter the cells.11–14 When the intensity and duration of the electric field exposure are low and short, the pores can reseal themselves after the field is removed. With electroporation of a strong intensity and a long exposure time, the cell membrane is irreversibly compromised and this leads to cell lysis and death.15–19 Electroporation is sensitive to the cell size. The transmembrane potential (ΔψE) is determined by the below relationship
| (1) |
where the cell shape is assumed to be a sphere, g is a complex function to the conductivities, λ, of the membrane and of the buffer, r is the radius of the sphere, E is the field strength and 8 is the angle between the normal to the membrane and the direction of the field.20,21 As a result, large cells are more susceptible to the electric field than the small ones. Based on this principle, a pulsed electric field has been used to purge contaminating tumor cells from hematopoietic stem cells in the context of stem cell transplantation.22,23 However, the selective electric lysis of tumor cells for CTC analysis and purging has not been systematically investigated before and the factors other than the cell size that affect tumor cell electroporation remain elusive.
Electroporation is amenable to miniaturization.24–34 Similar to conventional electroporation methods, all these small electroporation devices rely on the application of electric pulses for exposing cells to electric field of controlled intensity and duration. We have recently introduced a microfluidic flow-through electroporation technique that was based on constant voltage. By having one or more sections with reduced cross-sectional area, a microfluidic channel allowed electroporation of flowing cells to occur exclusively in these sections while a constant voltage was applied across the channel.17,35–37 Compared to other electroporation devices, our technique does not require the use of a pulse generator or the fabrication of microelectrodes and structures of subcellular dimensions. More importantly, the flow-through electroporation device allows real-time observation of electroporation while it occurs and has the potential to be scaled up to handle large-volume cell samples.
In this report, we investigate the effects of electroporation on red blood cells (RBC), white blood cells (WBC), and tumor cells. We examine the integrity of mouse RBC, the viability of mouse WBC and M109 tumor cells after flow-through electroporation treatment of various durations and intensities in microfluidic channels. Our results indicate that the tumor cells are substantially more susceptible to damage by electroporation than RBCs. Coherent Anti-Stokes Raman Scattering (CARS) and fluorescence microscopy data suggest that there is significant increase in the size of the nucleus in the tumor cells during the course of electroporation. Such expansion in the nucleus size during electroporation may contribute to high death rate of tumor cells. These microfluidic devices are also scaled up for processing samples up to 0.28 mL min−1 in order to demonstrate the potential of the technique for handling large volumes of clinical relevance.
Materials and methods
Cell preparation and handling
The M109 cells were cultured with DMEM medium supplemented with 10% FBS and antibiotics (Penicillin/streptomycin).38 Before use, the cultured cells were treated with trypsin and then washed with a phosphate buffer (10 mM Na2HPO4, 10 mM KH2PO4, and 250 mM sucrose) before electroporation. 3 month old male Balb/c mice were subjected to terminal blood collection from the tail. Up to 1 ml of blood could be collected from each mouse. The whole blood was centrifuged at 3000 g for 1 min then the precipitation was collected as the RBCs. The WBCs were generated by treating the whole blood with red blood cell lysis buffer that contained ammonium chloride (EBioscience, Inc., San Diego, CA). Real CTCs were generated via injecting GFP-expressing M109 cells into the mice subcutaneously. After four weeks the whole blood of the mouse was harvested and then the red blood cell lysis buffer was applied to remove the RBC. In most experiments of this study (except the ones involving whole blood), cells were suspended in the above mentioned phosphate buffer for electroporation. It needs to be noted that the reagents and treatment applied may potentially affect the membrane structure39 and thus influence the electroporation process.
Chip fabrication
The microfluidic channels were fabricated in polydimethylsiloxane (PDMS) using the standard soft lithography.17,19 Briefly, the patterns of the microfluidic channel were designed using FreeHand MX (Macromedia, San Francisco, CA) and then the photomasks were obtained by printing the designed patterns on transparencies with a resolution of 5080 dpi. The masters were fabricated on a silicon wafer by spinning photoresist SU-8 2025 or 2150 (MicroChem, Newton, MA) and then exposing and developing the photoresist using the photomasks. The molding of the PDMS chips was done by pouring and curing PDMS prepolymer mixture (containing monomer A and curing agent B) (General Electric Silicones RTV 615, MG Chemicals, Toronto, ON, Canada) with the mass ratio of A : B = 10 : 1 on the surface of the master. The PDMS chip was then peeled off from the master. A glass slide was cleaned with the basic solution (H2O: NH4OH (27%): H2O2 (30%) = 5:1:1, volumetric ratio) at 75 °C. The PDMS chip and the cleaned glass slide were oxidized with a plasma cleaner (Harrick, Inc., Ossining, NY) and then pressed against each other.
Electroporation and data collection/analysis
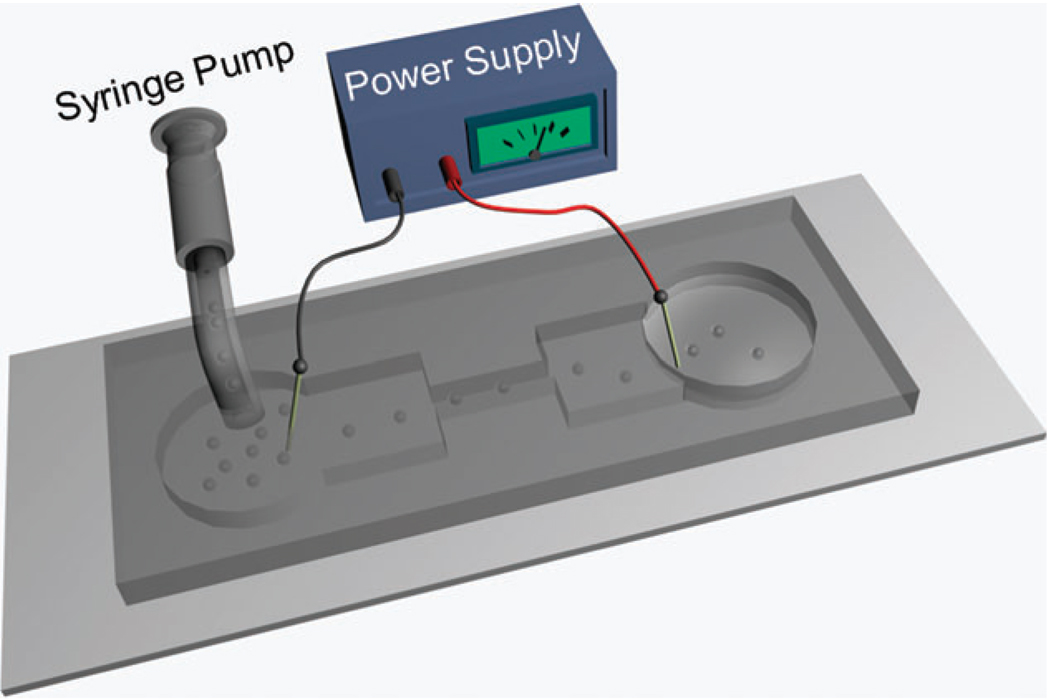
During electroporation, cells suspended in the electroporation buffer (or whole blood) flowed through the microfluidic channel driven by a PHD infusion pump (Harvard Apparatus, Holliston, MA) with a constant flow rate while a constant voltage generated by a PS350 power supply (Stanford Research Systems, Sunnyvale, CA) was applied across the microfluidic device (as shown in Fig. 1). Two platinum wires were inserted in the two reservoirs at the ends of the microfluidic channel, serving as the electrodes. The flow rate together with the dimensions of the narrow section of the device determined the duration of electroporation. The cells were transferred to the wells of a 96-well plate with a pipette after electroporation. The viability of M109 cells was examined by having 1 µg ml−1 propidium iodide (PI) to stain the cells at 1 h after electroporation. The viability of mouse WBCs was examined by staining the cells using both Hoechst 33 342 (a cell permeable nucleic acid stain, Invitrogen) and PI (Hoechst 33 342 was added to generate the total number of WBCs). The damage to RBCs was recorded by enumerating the percentage of RBC ghosts. For the viability test, each data points were generated by 3 trials. Phase contrast and fluorescent images of over 300 cells were taken in each trial in order to determine the percentage of dead/damaged cells. The images were taken with an IX-71 fluorescence microscope (Olympus, Melville, NY) equipped with 20, 40 or 60× dry objectives and an ORCA-285 CCD camera (Hamamatsu, Bridgewater, NJ).
Fig. 1.
The schematic of a microfluidic flow-through electroporation device. We used two sets of devices in this study: one standard device has 30 µm for its depth, 392 µm and 5 mm for the width and length of the wide sections and 58 µm and 2 mm for those of the narrow section; a scaled-up device has 188 µm for its depth, 5 mm and 10 mm for the width and length of the wide sections and 500 µm and 5 mm for those of the narrow section.
A multimodal coherent anti-Stokes Raman scattering (CARS) microscope capable of simultaneous CARS and two-photon excitation fluorescence (TPEF) imaging was used to observe nucleus expansion during electroporation of M109 cells.40 Briefly, pump and Stokes lasers are tuned to 14 140 cm−1 (707 nm) and 11 300 cm−1 (885 nm), respectively, to be in resonance with the CH2 symmetric stretch vibration at 2840 cm−1. The combined beams were focused into the sample through a 60× water immersion microscope objective with a 1.2 numerical aperture. Forward-detected CARS signal was collected by an air condenser with a 0.55 numerical aperture, transmitted through a 600/65 nm bandpass filter, and detected by a photomultiplier tube (PMT, H7422-40, Hamamatsu, Japan). Simultaneously, back-reflected TPEF signal was collected by the same illuminating objective, spectrally separated from the excitation source, transmitted through a 520/40 nm bandpass filter, and detected by a photomultiplier tube (PMT, H7422-40, Hamamatsu, Japan) mounted at the back port of the microscope. The nucleus was labeled with Hoechst 33 342 (Cat. No. H1399, Invitrogen, Carlsbad, CA) and the cell membrane was labeled with DiOC18 (Cat. No. D275, Invitrogen, Carlsbad, CA) using protocols provided by the manufacturer. The sizes of subcellular areas of M109 cells in the images were obtained using ImageJ.
Results
We have developed a flow-through electroporation technique for high-throughput processing of cells in a microfluidic channel with geometric variation under constant voltage.17 Briefly, as shown in Fig. 1, electroporation occurs when cells flow through a microfluidic channel with alternating wide and narrow sections. Electroporation of defined duration (determined by the flow rate and the device dimensions) and field intensity (determined by the voltage across the channel and the device geometry) is confined in the narrow section (the section with a small cross-sectional area) due to the high field intensity there. The field in the wide sections is a fraction of that in the narrow section (the field intensity in different sections is inversely proportional to the width) and well-below the electroporation threshold, not contributing to electroporation. Such device can be scaled up for high flow rate processing by expanding the cross-sectional areas of various sections. The flow-through electroporation device allows electroporation to be observed in real time while cells flow through the narrow section.
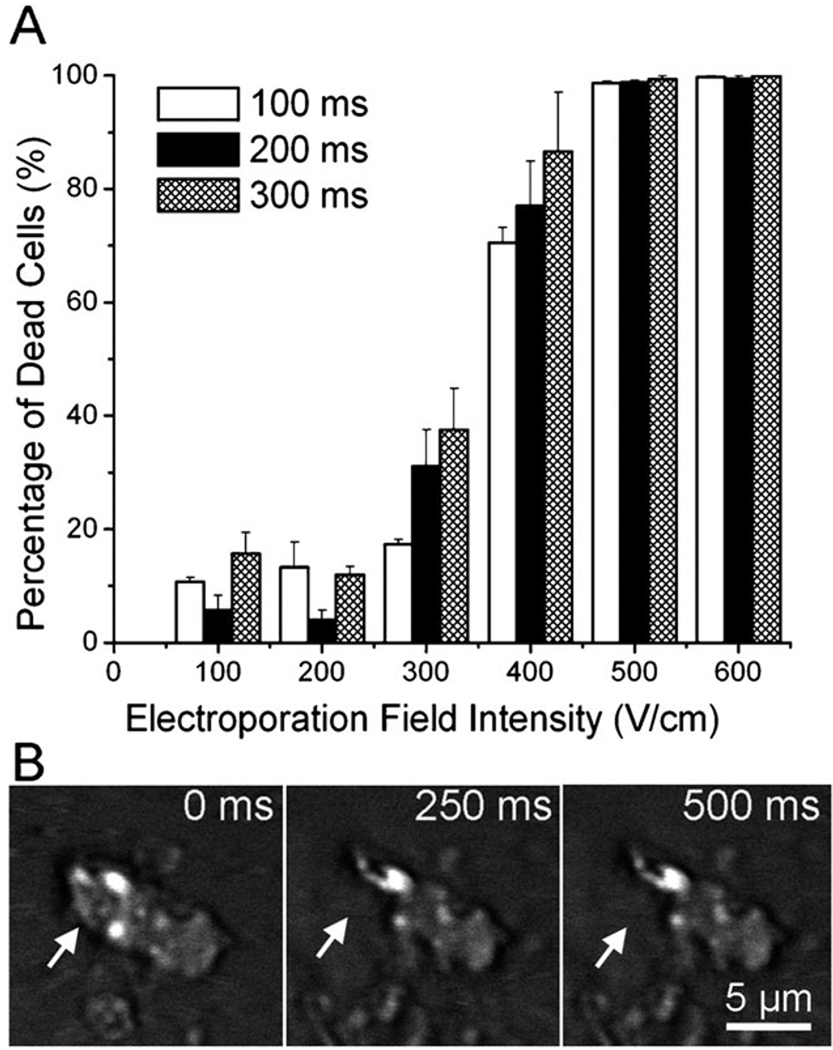
M109 (Madison lung carcinoma 109) is a metastatic mouse lung tumor cell line established in 1964.41 M109 cells are routinely used for tumor implantation in mice.42,43 When M109 cells are injected into mice subcutaneously, circulating tumor cells can be found in the blood and lungs after several weeks. Fig. 2A shows the viability of M109 cells after they were treated by a microscale flow-through electroporation device (with the cross-sectional area of 30 mm × 58 mm and the length of 2 mm for the narrow electroporation section) with flow rates of 0.7, 1.05, and 2.0 l min−1. These flow rates yield electroporation durations of 300, 200, and 100 ms. The cell viability was assessed by propidium iodide (PI) staining after electroporation. In Fig. 2A, we show that M109 cells started to lose their viability at the electric field intensity around 300 V cm−1 with these durations. When the field intensity was at 500 V cm−1, the vast majority of M109 cells were dead following electroporation. We also generated real CTCs in the blood by injecting M109 cells subcutaneously into mice. We were able to observe averagely 3 CTCs per mL in the mouse blood. The images in Fig. 2B show that a real CTC underwent lysis at similar field intensity as M109 cells (~ 500 V cm−1). It could be observed that the upper left corner of the CTC was broken at the electroporation duration of 250 ms. This confirms that the use of M109 cells as a model in this study has direct relevance to real CTC studies.
Fig. 2.
(A) Effects of flow-through electroporation with various electroporation durations (the residence time of the cells in the narrow section) and field intensities (the field intensity in the narrow section of the device) on the viability of M109 cells. M109 cells were suspended in the electroporation buffer and processed in the standard device. (B) Time-lapse CARS images of a circulating tumor cell (generated by M109 implantation in a mouse) during electroporation in the electroporation buffer.
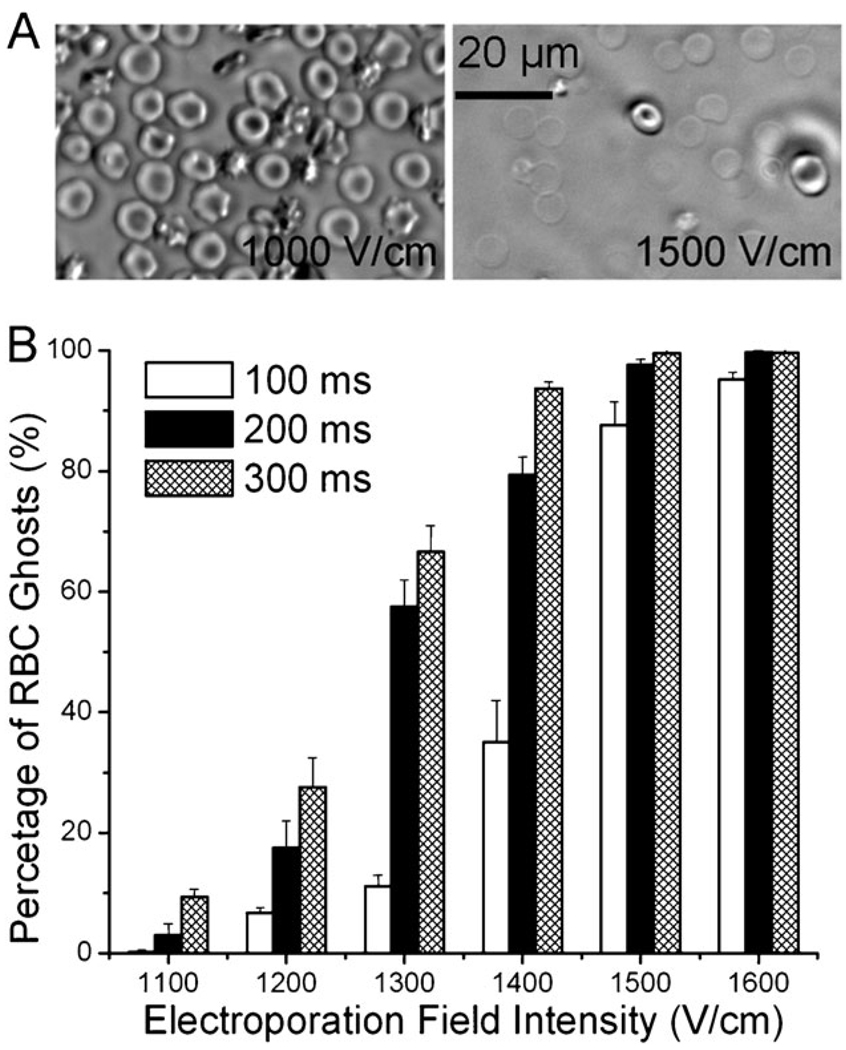
We tested mouse RBCs suspended in the buffer and observed how electroporation affected their properties. Fig. 3A shows RBCs after flow-through electroporation with field intensities of 1000 and 1500 V cm−1, respectively, with the duration of 100 ms. Most RBCs maintained their normal biconcave shape at 1000 V cm−1 while a very high percentage of RBCs became ghosts at 1500 V cm−1. As shown in Fig. 3B, RBCs started to release their intracellular contents when the electroporation field intensity was around 1100–1200 V cm−1 (with electroporation duration of 100–300 ms). We enumerated the percentages of RBCs that experienced hemolysis due to electroporation with different parameters. Fig. 3B shows that the percentage of RBC ghosts after electroporation increased with higher field intensities. When the electroporation field intensity reached 1600 V cm−1, nearly all RBCs experienced hemolysis.
Fig. 3.
(A) Phase contrast images of mouse RBCs after being treated by flow-through electroporation with a duration of 200 ms at 1000 V cm−1 (left) and 1500 V cm−1 (right). (B) Effects of flow-through electroporation with various electroporation durations and field intensities on mouse RBCs. The RBCs were suspended in the electroporation buffer and processed in the standard device.
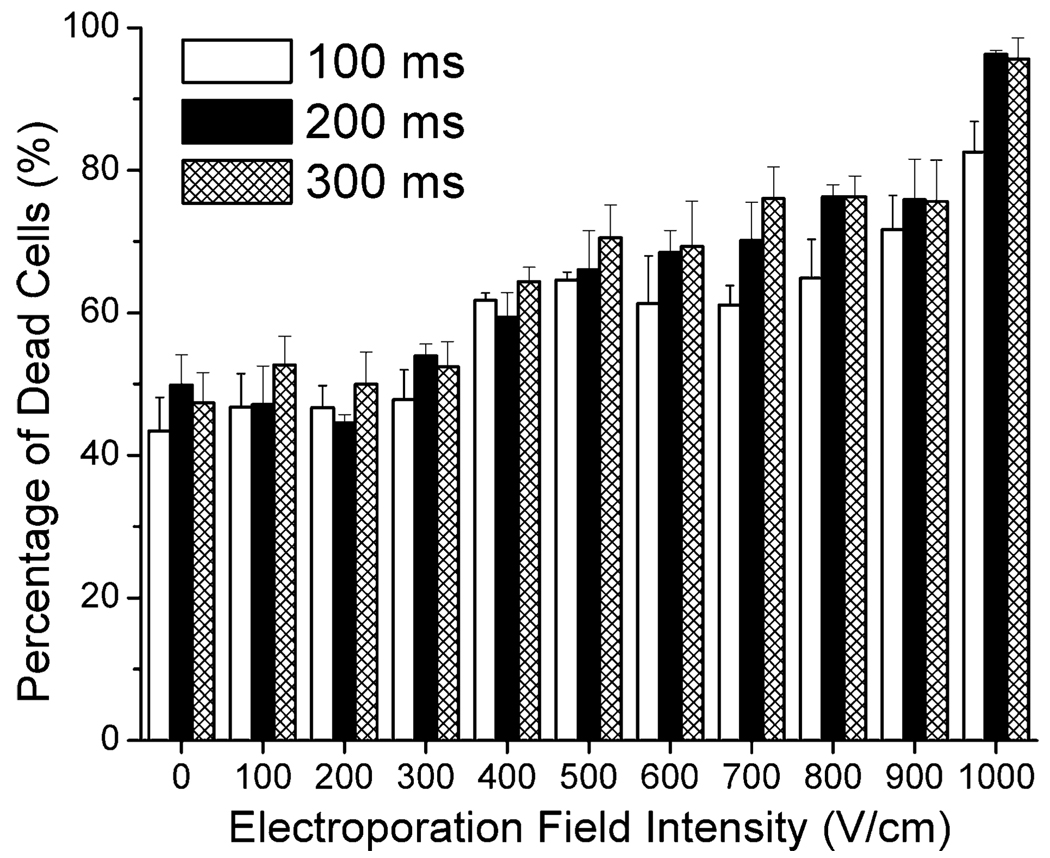
Mouse WBCs were isolated by lysing RBCs using red blood cell lysis buffer. WBCs are composed of a mixture of cell types including granulocytes, monocytes, and lymphocytes. WBCs suspended in the buffer were also treated by flow-through electroporation before they were tested for viability via PI staining. Fig. 4 shows the percentage of dead WBCs after electroporation of different field intensities and durations. Our results reveal that more than 40% of WBCs were stained by PI even without the application of the electric field. This is possibly due to the damage by the procedures involved in the isolation and the electroporation buffer. With the increase of the electroporation field intensity to 400 V cm−1, over 60% of WBCs were inactivated. The cell death gradually increased with the field intensity. When the field intensity reached 700 V cm−1, more than 70% of WBCs could not survive the electroporation.
Fig. 4.
Effects of flow-through electroporation with various electroporation durations and field intensities on the viability of mouse WBCs. WBCs were suspended in the electroporation buffer and processed in the standard device.
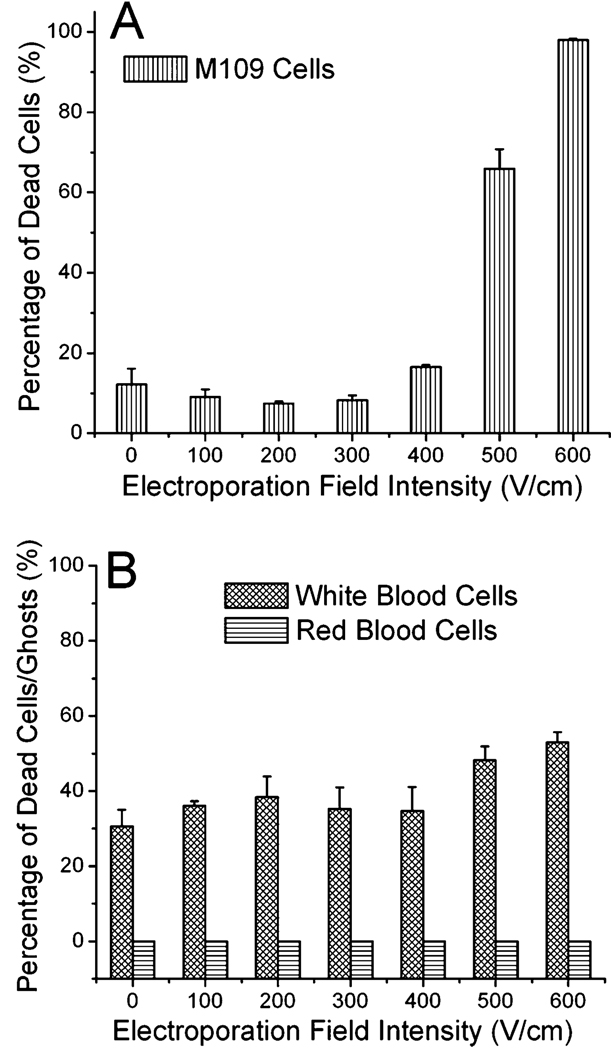
Our flow-through electroporation is amenable to scaling up. We increased the flow rate of the cell sample to ~ 0.28 mL min−1 by using a scaled-up device. The scaled-up device had an increased cross-sectional area for the narrow section (188 µm × 500 µm) and a longer narrow section (5 mm) that required higher velocity to generate the same electroporation duration. In the scaled-up channel, the electroporation generated similar effects to the viability of M109 tumor cells. As shown in Fig. 5A, the scaled-up device required slightly higher field intensity for M109 cell death than the small device. With an electroporation duration of 100 ms, substantial cell death was observed starting at 400–500 V cm−1 and 98% of the tumor cells were dead at 600 V cm−1. Furthermore, we studied the effects of electroporation on whole blood from mice in the scaled-up device. We flew the whole blood through the device at the flow rate of 0.28 mL min−1. We examined the integrity of RBCs after electroporation and then lysed the RBCs using the RBC lysis buffer and checked the viability of WBCs based on PI staining. Flow-through electroporation of whole blood actually generated fairly low current due to its low conductivity (26 µA with an electroporation field intensity of 600 V cm−1, compared to 90 µA with the electroporation buffer at the same field intensity in the same device). This suggests that there was no significant electrochemical reaction or Joule heating involved. Fig. 5B shows that there was no visible change for RBCs in this field intensity range with the duration of 100 ms. Similar to the case of WBC electroporation in the buffer (Fig. 4), WBCs had a fairly high death rate without the electric field (31%) which was followed by a modest increase at higher field intensities. The successful scale-up of the electroporation device indicates that our technology can be applied to process samples at a scale (~1 mL min−1) that is relevant to clinical operations (considering an adult transfusion unit of ~450–500 mL). It needs to be noted that the electroporation buffer and the whole blood may affect electroporation of cells differently due to their difference in the conductivity and ionic strength. We believe that further improvement in the throughput can also be achieved by running multiple parallel units. In principle, there is no practical limitation for increasing the throughput even further.
Fig. 5.
Flow-through electroporation of M109 and blood cells in the scaled-up device. The electroporation duration was 100 ms. (A) Effects on the viability of M109 cells. M109 cells were suspended in the electroporation buffer. (B) Effects on RBCs and WBCs in the whole blood. The whole blood was electroporated in the scaled-up device.
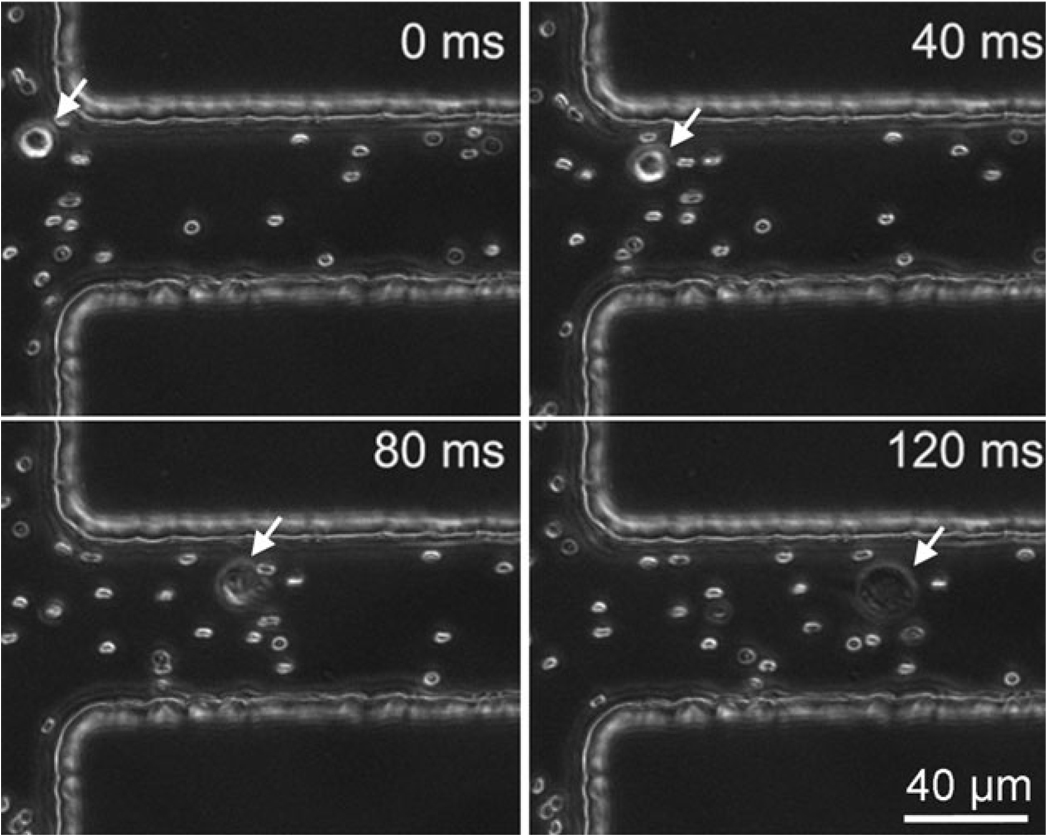
Our data show that hemolysis of RBCs occurs at a substantially higher field intensity than the lysis of tumor cells. This suggests the possibility of selective analysis or purging of tumor cells in the blood. To this end, we observed the electroporation of M109 cells suspended together with RBCs in the buffer. As shown in Fig. 6, at a field intensity of 600 V cm−1 M109 cells were electroporated (with a dramatic size expansion) after entering the electroporation narrow section while the RBCs did not present visible changes (as shown in ESI Fig. S1,† RBCs become invisible when hemolysis occurs).
Fig. 6.
Electroporation of a M109 cell mixed with RBCs in the electroporation buffer. The electroporation field intensity was 600 V cm−1.The dramatic expansion of the M109 cell indicates electroporation.
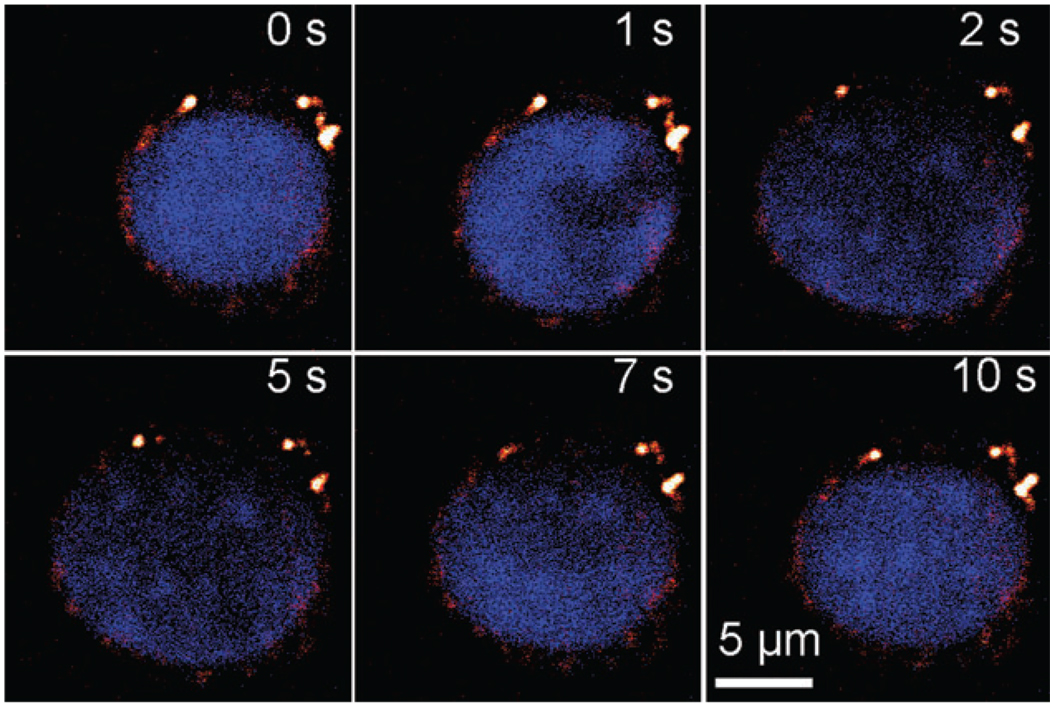
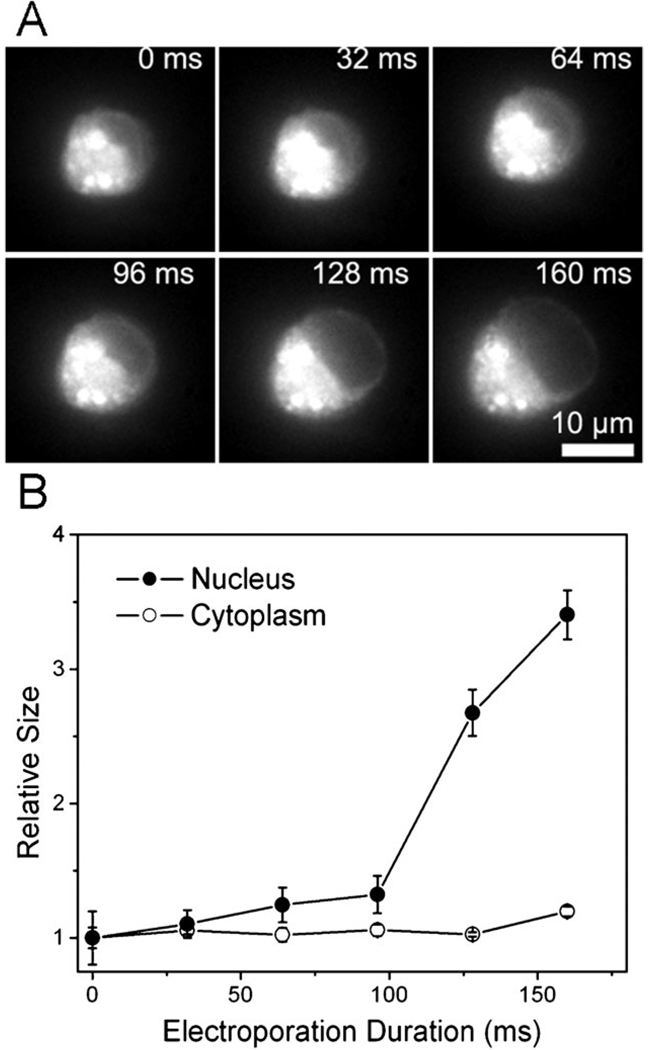
Finally, combining CARS and fluorescence microscopy tools, we found evidence that the presence of the nucleus in a tumor cell contributed to its rapid lysis and cell death under a high electric field. CARS microscopy is a unique tool for cellular imaging with a particularly strong signal from CH2-abundant structures.44,45 CARS imaging is very sensitive to lipid-rich membranes and membrane extensions (endosomes and others) in the cytoplasm (see ESI Fig. S2†). As shown in Fig. 7, when a tumor cell experienced electroporation (400 V cm−1), the nucleus of the cell (labeled by Hoechst 33 342) expanded dramatically upon the application of the field and shrank upon its removal. The membrane and cytoplasmic portion (detected by CARS microscopy) did not have substantial expansion. As a further confirmation, we also labeled the lipid-rich membrane and cytoplasm with DiOC18 and then analyzed the increase in the size of the cytoplasmic (highly fluorescent) and nucleic portions (weakly fluorescent) over time during electroporation. As shown in Fig. 8, the nucleus size became 3.4 times of its original size while the cytoplasm size increased only by 20% after applying the electric field of 400 V cm−1 for 160 ms.
Fig. 7.
Nucleus expansion in a M109 cell during electroporation in the electroporation buffer. Lipid-rich structures were detected by CARS signal (red) and Hoechst 33 342-stained nucleus (blue) was observed by TPEF. The electric field of 400 V cm−1 was applied during 0–5 s and removed afterwards (5–10 s).
Fig. 8.
(A) Time-lapse fluorescence images of a M109 cell stained with DiOC18 during electroporation. The electroporation field intensity was 400 V cm−1. DiOC18 labeling renders the cytoplasmic and membrane fluorescent. The compartment without fluorescence is the nucleus. (B) The size (measured by the two-dimensional area) increase associated with the cytoplasmic and nucleic areas. The original size at time 0 is designated as 1.
Discussion
The different electroporation thresholds of blood cells and tumor cells and the effects of nucleus expansion
As shown in our results, electroporation of tumor cells and RBCs (erythrocytes) occurs at very different field intensities. With the electroporation duration of 100–300 ms, the threshold for irreversible electroporation (or electric lysis) is ~300–100 V cm−1 for M109 tumor cells and ~ 1100–1200 V cm−1 for RBCs. WBCs presented a low threshold of 400–500 V cm−1.
The significant difference between RBCs and tumor cells in their response to electroporation may have multiple reasons. It has been previously acknowledged that the relative large size of a tumor cell makes it more susceptible to the electric field than RBCs, based on eqn (1).22,23 In this work, our results suggest that, in addition to the size difference, the expansion of the nucleus in a tumor cell may make important contribution to its higher susceptibility to the electric field compared to anucleate erythrocyte cells. The expansion of cells during or after electroporation has long been recognized.46–51 However, our data indicate that the nucleus experiences a dramatic increase in its size due to electroporation and most of the cell size change occurs in the nucleus rather than in the cytoplasm. This finding suggests one of two possible mechanisms (that are potentially mutually exclusive) to be responsible for the cell expansion due to electroporation: First, the expansion is due to solution influx into cells, as suggested in previous studies.46,47 However, the influx solution preferably locates in the nucleus (instead of the cytoplasm) after entering through the plasma membrane. Second, the solution influx only accounts for a minor contribution to the expansion. Cells expand mostly due to the nucleus expansion when electroporated. Although our data are not conclusive for determining which mechanism is dominant, the second mechanism (which contradicts the common belief) is entirely possible. It has been widely shown that tumor cells have enlarged nuclei with altered chromosomal DNA organization as compared to normal cells and the damage to the nuclei often constitutes an important reason for tumor cell death.52,53 We speculate that the applied electric field may possibly affect the packing of the negatively charged chromosome and thus cause the rapid nucleus expansion. The sensitive and dramatic response of the nucleus in a tumor cell to the electric field may in turn lead to the rapid cell death. Our results provide some direct evidence that the expansion in the nucleus is a very relevant event associated with electroporation with potentially important consequences.
Potential of electroporation for selective purging and analysis of CTCs
Previous studies on CTCs have been largely focused on the detection and enumeration of CTCs in the blood because analysis of CTCs provides information about the tumor tissue. Our results in this study suggest the possibility of selective removal of CTC from blood although the clinical value of such procedure remains unknown. We show that our flow-through electroporation devices can be scaled up to a clinically relevant throughput at the order of 1 mL min−1. The large difference between RBCs and tumor cells in the electroporation threshold would allow tumor cells to be eliminated while keeping RBCs intact after electroporation. Furthermore, our previous study showed that tumor cells were more subject to electroporation-induced death as the metastatic potential progressed.19 We found that the compromise of WBCs occurred at a fairly low field intensity which is similar to that of tumor cells. However, the WBC death rate increases much more slowly with the field intensity than that of tumor cells. The finding of lower electroporation threshold of WBCs (compared to that of RBCs) is consistent with previous literature.54 Additional separation procedures may be required if preserving the activation of WBCs is desired during electroporation-based CTC purging.
The analysis of CTCs using molecular biology methods reveals the characteristics of the tumor tissue that the CTCs are shed from. For example, CTCs have been shown to reveal the genetic signature of lung cancers.55 Electroporation with controlled parameters allows the selective lysis of tumor cells without disrupting RBCs, as shown in Fig. 6. Coupled with other analytical techniques and procedures, this potentially permits the selective sampling of CTCs without immunoseparation of the tumor cells from blood cells for diagnostics and staging purposes.6,8
Conclusions
We show that electroporation of tumor cells and blood cells occurs with different thresholds in the field intensity. Flow-through electroporation provides a high-throughput platform for selective lysis of tumor cells among blood cells. Such approach may be useful for purging and analysis of circulating tumor cells. Our results using CARS and fluorescence microscopy reveal dramatic increase of the nucleus in a tumor cell during electroporation. Such nucleus expansion may be important for the lower electroporation threshold of tumor cells compared to anucleate RBCs.
Insight, innovation, integration.
Circulating tumor cells in peripheral blood present an interesting yet complex system with blood cells coexisting with tumor cells. In this work, we studied the effects of electroporation on red blood cells, white blood cells and tumor cells and established the feasibility for selective purging and analysis of tumor cells among blood cells using microfluidic flow-through electroporation technique. We discovered that high cell death of tumor cells after electroporation was associated with dramatic expansion of their nuclei during electroporation. This new insight points out that the nucleus is much more critically affected than other subcellular compartments such as the cytoplasm. This phenomenon is important for understanding the different responses to electroporation between tumor cells and anucleate red blood cells. Our flow-through electroporation technique utilizes constant voltage instead of electric pulses to generate the electroporation field. This unique design allows observation of electroporation in real time during its occurring. We further demonstrated that the flow-through feature of the technique offered potential for processing substantial amount of cell samples with high throughput.
Acknowledgements
This research was supported by Wallace H. Coulter Foundation Early Career Award, NSF grant CBET-0747105, USDA CSREES NRI grant 2008-01370 and a cooperative agreement with the ARS-USDA, project number 1935 42000-035, through the Center for Food Safety Engineering at Purdue University to CL and NIH R01Eb007243 to JXC. TTL is supported by a NIH post-doctoral fellowship. The authors want to thank Dr Kathy Miller at Indiana University School of Medicine for helpful discussions.
Footnotes
Electronic supplementary information (ESI) available: Additional figures. See DOI: 10.1039/b919820b
References
- 1.Pantel K, Brakenhoff RH. Nat. Rev. Cancer. 2004;4:448–456. doi: 10.1038/nrc1370. [DOI] [PubMed] [Google Scholar]
- 2.Chang S, di Tomaso E, McDonald DM, Jones R, Jain RK, Munn LL. Proc. Natl. Acad. Sci. U. S. A. 2000;97:14608–14613. doi: 10.1073/pnas.97.26.14608. [DOI] [PMC free article] [PubMed] [Google Scholar]
- 3.Cristofanilli M, Budd GT, Ellis MJ, Stopeck A, Matera J, Miller MC, Reuben JM, Doyle GV, Allard WJ, Terstappen LW, Hayesz DF. N. Engl. J. Med. 2004;351:781–791. doi: 10.1056/NEJMoa040766. [DOI] [PubMed] [Google Scholar]
- 4.Moreno JG, Miller MC, Gross S, Allard WJ, Gomella LG, Terstappen L. Urology. 2005;65:713–718. doi: 10.1016/j.urology.2004.11.006. [DOI] [PubMed] [Google Scholar]
- 5.Mocellin S, Keilholz U, Rossi CR, Nitti D. Trends Mol. Med. 2006;12:130–139. doi: 10.1016/j.molmed.2006.01.006. [DOI] [PubMed] [Google Scholar]
- 6.Nagrath S, Sequist LV, Maheswaran S, Bell DW, Irimia D, Ulkus L, Smith MR, Kwak EL, Digumarthy S, Muzikansky A, Ryan P, Balis UJ, Tompkins RG, Haber DA, Toner M. Nature. 2007;450:1235–1239. doi: 10.1038/nature06385. [DOI] [PMC free article] [PubMed] [Google Scholar]
- 7.Alix-Panabieres C, Riethdorf S, Pantel K. Clin. Cancer Res. 2008;14:5013–5021. doi: 10.1158/1078-0432.CCR-07-5125. [DOI] [PubMed] [Google Scholar]
- 8.Adams AA, Okagbare PI, Feng J, Hupert ML, Patterson D, Gottert J, McCarley RL, Nikitopoulos D, Murphy MC, Soper SA. J. Am. Chem. Soc. 2008;130:8633–8641. doi: 10.1021/ja8015022. [DOI] [PMC free article] [PubMed] [Google Scholar]
- 9.Sha MY, Xu H, Natan MJ, Cromer R. J. Am. Chem. Soc. 2008;130:17214–17215. doi: 10.1021/ja804494m. [DOI] [PMC free article] [PubMed] [Google Scholar]
- 10.Le TT, Huff TB, Cheng JX. BMC Cancer. 2009;9:42. doi: 10.1186/1471-2407-9-42. [DOI] [PMC free article] [PubMed] [Google Scholar]
- 11.Neumann E, Schaefer-Ridder M, Wand Y, Hofschneider P. EMBO J. 1982;1:841–845. doi: 10.1002/j.1460-2075.1982.tb01257.x. [DOI] [PMC free article] [PubMed] [Google Scholar]
- 12.Rols MP, Delteil C, Golzio M, Dumond P, Cros S, Teissie J. Nat. Biotechnol. 1998;16:168–171. doi: 10.1038/nbt0298-168. [DOI] [PubMed] [Google Scholar]
- 13.Aihara H, Miyazaki J. Nat. Biotechnol. 1998;16:867–870. doi: 10.1038/nbt0998-867. [DOI] [PubMed] [Google Scholar]
- 14.Canatella PJ, Black MM, Bonnichsen DM, McKenna C, Prausnitz MR. Biophys. J. 2004;86:3260–3268. doi: 10.1016/S0006-3495(04)74374-X. [DOI] [PMC free article] [PubMed] [Google Scholar]
- 15.McClain MA, Culbertson CT, Jacobson SC, Allbritton NL, Sims CE, Ramsey JM. Anal. Chem. 2003;75:5646–5655. doi: 10.1021/ac0346510. [DOI] [PubMed] [Google Scholar]
- 16.Han FT, Wang Y, Sims CE, Bachman M, Chang RS, Li GP, Allbritton NL. Anal. Chem. 2003;75:3688–3696. doi: 10.1021/ac0341970. [DOI] [PubMed] [Google Scholar]
- 17.Wang HY, Lu C. Anal. Chem. 2006;78:5158–5164. doi: 10.1021/ac060733n. [DOI] [PubMed] [Google Scholar]
- 18.Wang HY, Lu C. Chem. Commun. 2006:3528–3530. doi: 10.1039/b605722e. [DOI] [PubMed] [Google Scholar]
- 19.Bao N, Zhan YH, Lu C. Anal. Chem. 2008;80:7714–7719. doi: 10.1021/ac801060t. [DOI] [PubMed] [Google Scholar]
- 20.Weaver JC, Chizmadzhev YA. Bioelectrochem. Bioenerg. 1996;41:135–160. [Google Scholar]
- 21.Teissie J, Golzio M, Rols MP. Biochim. Biophys. Acta, Gen. Subj. 2005;1724:270–280. doi: 10.1016/j.bbagen.2005.05.006. [DOI] [PubMed] [Google Scholar]
- 22.Eppich HM, Foxall R, Gaynor K, Dombkowski D, Miura N, Cheng T, Silva-Arrieta S, Evans RH, Mangano JA, Preffer FI, Scadden DT. Nat. Biotechnol. 2000;18:882–887. doi: 10.1038/78504. [DOI] [PubMed] [Google Scholar]
- 23.Craiu A, Saito Y, Limon A, Eppich HM, Olson DP, Rodrigues N, Adams GB, Dombkowski D, Richardson P, Schlossman R, Choi PS, Grogins J, O’Connor PG, Cohen K, Attar EC, Freshman J, Rich R, Mangano JA, Gribben JG, Anderson KC, Scadden DT. Blood. 2005;105:2235–2238. doi: 10.1182/blood-2003-12-4399. [DOI] [PubMed] [Google Scholar]
- 24.Ryttsen F, Farre C, Brennan C, Weber SG, Nolkrantz K, Jardemark K, Chiu DT, Orwar O. Biophys. J. 2000;79:1993–2001. doi: 10.1016/S0006-3495(00)76447-2. [DOI] [PMC free article] [PubMed] [Google Scholar]
- 25.Nolkrantz K, Farre C, Brederlau A, Karlsson RI, Brennan C, Eriksson PS, Weber SG, Sandberg M, Orwar O. Anal. Chem. 2001;73:4469–4477. doi: 10.1021/ac010403x. [DOI] [PubMed] [Google Scholar]
- 26.Huang Y, Rubinsky B. Sens. Actuators, A. 2003;104:205–212. [Google Scholar]
- 27.Lin YC, Li M, Wu CC. Lab Chip. 2004;4:104–108. doi: 10.1039/b312804k. [DOI] [PubMed] [Google Scholar]
- 28.Munce NR, Li J, Herman PR, Lilge L. Anal. Chem. 2004;76:4983–4989. doi: 10.1021/ac0496906. [DOI] [PubMed] [Google Scholar]
- 29.Lu H, Schmidt MA, Jensen KF. Lab Chip. 2005;5:23–29. doi: 10.1039/b406205a. [DOI] [PubMed] [Google Scholar]
- 30.Khine M, Lau A, Ionescu-Zanetti C, Seo J, Lee LP. Lab Chip. 2005;5:38–43. doi: 10.1039/b408352k. [DOI] [PubMed] [Google Scholar]
- 31.Fei Z, Wang S, Xie Y, Henslee BE, Koh CG, Lee LJ. Anal. Chem. 2007;79:5719–5722. doi: 10.1021/ac070482y. [DOI] [PubMed] [Google Scholar]
- 32.Kim SK, Kim JH, Kim KP, Chung TD. Anal. Chem. 2007;79:7761–7766. doi: 10.1021/ac071197h. [DOI] [PubMed] [Google Scholar]
- 33.Valero A, Post JN, van Nieuwkasteele JW, Ter Braak PM, Kruijer W, van den Berg A. Lab Chip. 2008;8:62–67. doi: 10.1039/b713420g. [DOI] [PubMed] [Google Scholar]
- 34.Lee WG, Demirci U, Khademhosseini A. Integr. Biol. 2009;1:242–251. doi: 10.1039/b819201d. [DOI] [PMC free article] [PubMed] [Google Scholar]
- 35.Wang HY, Bhunia AK, Lu C. Biosens. Bioelectron. 2006;22:582–588. doi: 10.1016/j.bios.2006.01.032. [DOI] [PubMed] [Google Scholar]
- 36.Wang HY, Lu C. Biotechnol. Bioeng. 2006;95:1116–1125. doi: 10.1002/bit.21066. [DOI] [PubMed] [Google Scholar]
- 37.Wang HY, Lu C. Biotechnol. Bioeng. 2008;100:579–586. doi: 10.1002/bit.21784. [DOI] [PubMed] [Google Scholar]
- 38.Schultz R, Ruiz P, Chirigos M, Heine U, Nelsonrees W. In vitro-J. Tissue Cult. Assn. 1977;13:223–231. doi: 10.1007/BF02615079. [DOI] [PubMed] [Google Scholar]
- 39.Devaux PF, Herrmann A, Ohlwein N, Kozlov MM. Biochim. Biophys. Acta, Biomembr. 2008;1778:1591–1600. doi: 10.1016/j.bbamem.2008.03.007. [DOI] [PubMed] [Google Scholar]
- 40.Wang HW, Bao N, Le TT, Lu C, Cheng JX. Opt. Express. 2008;16:5782–5789. doi: 10.1364/oe.16.005782. [DOI] [PMC free article] [PubMed] [Google Scholar]
- 41.Schultz RM, Altom MG. J. Immunopharmacol. 1983;5:277–290. doi: 10.3109/08923978309026449. [DOI] [PubMed] [Google Scholar]
- 42.Lu YJ, Xu LC, Parker N, Westrick E, Reddy JA, Vetzel M, Low PS, Leamon CP. Mol. Cancer Ther. 2006;5:3258–3267. doi: 10.1158/1535-7163.MCT-06-0439. [DOI] [PubMed] [Google Scholar]
- 43.He W, Wang H, Hartmann LC, Cheng JX, Low PS. Proc. Natl. Acad. Sci. U. S. A. 2007;104:11760–11765. doi: 10.1073/pnas.0703875104. [DOI] [PMC free article] [PubMed] [Google Scholar]
- 44.Cheng JX. Appl. Spectrosc. 2007;61:197–208. doi: 10.1366/000370207781746044. [DOI] [PMC free article] [PubMed] [Google Scholar]
- 45.Cheng JX, Xie XS. J. Phys. Chem. B. 2004;108:827–840. [Google Scholar]
- 46.Kinosita K, Jr, Tsong TY. Nature. 1977;268:438–441. doi: 10.1038/268438a0. [DOI] [PubMed] [Google Scholar]
- 47.Tsong TY. Biophys. J. 1991;60:297–306. doi: 10.1016/S0006-3495(91)82054-9. [DOI] [PMC free article] [PubMed] [Google Scholar]
- 48.Golzio M, Mora MP, Raynaud C, Delteil C, Teissie J, Rols MP. Biophys. J. 1998;74:3015–3022. doi: 10.1016/S0006-3495(98)78009-9. [DOI] [PMC free article] [PubMed] [Google Scholar]
- 49.Deng J, Schoenbach KH, Buescher ES, Hair PS, Fox PM, Beebe SJ. Biophys. J. 2003;84:2709–2714. doi: 10.1016/s0006-3495(03)75076-0. [DOI] [PMC free article] [PubMed] [Google Scholar]
- 50.Sukhorukov VL, Reuss R, Zimmermann D, Held C, Muller KJ, Kiesel M, Gessner P, Steinbach A, Schenk WA, Bamberg E, Zimmermann U. J. Membr. Biol. 2005;206:187–201. doi: 10.1007/s00232-005-0791-2. [DOI] [PubMed] [Google Scholar]
- 51.Pavlin M, Kanduser M, Rebersek M, Pucihar G, Hart FX, Magjarevic R, Miklavcic D. Biophys. J. 2005;88:4378–4390. doi: 10.1529/biophysj.104.048975. [DOI] [PMC free article] [PubMed] [Google Scholar]
- 52.Lehnert S. Radiat. Res. 1998;149:317–318. [PubMed] [Google Scholar]
- 53.Zink D, Fischer AH, Nickerson JA. Nat. Rev. Cancer. 2004;4:677–687. doi: 10.1038/nrc1430. [DOI] [PubMed] [Google Scholar]
- 54.Sixou S, Teissie J. Biochim. Biophys. Acta, Biomembr. 1990;1028:154–160. doi: 10.1016/0005-2736(90)90149-i. [DOI] [PubMed] [Google Scholar]
- 55.Maheswaran S, Sequist LV, Nagrath S, Ulkus L, Brannigan B, Collura CV, Inserra E, Diederichs S, Iafrate AJ, Bell DW, Digumarthy S, Muzikansky A, Irimia D, Settleman J, Tompkins RG, Lynch TJ, Toner M, Haber DA. N. Engl. J. Med. 2008;359:366–377. doi: 10.1056/NEJMoa0800668. [DOI] [PMC free article] [PubMed] [Google Scholar]


