

Abstract
Background
Repeated studies have shown that high impulsivity, when defined as the tendency to choose small immediate rewards over larger delayed rewards, is more prevalent in drug addicts and alcoholics when compared with nonaddicts. Assessing whether impulsivity precedes and potentially causes addiction disorders is difficult in humans because they all share a history of drug use. In this study, we address this question by testing alcohol-naïve mice from lines showing heritable differences in alcohol intake.
Methods
Replicated selected lines of outbred high-alcohol preferring (HAP) mice were compared to a low-alcohol preferring (LAP) line as well as the low-drinking progenitor line (HS/Ibg) on an adjusting amount delay discounting (DD) task. The DD task employs 2 levers to present subjects with a choice between a small, immediate and a large, delayed saccharin reward. By adjusting the quantity of the immediate reward up and down based on choice behavior, the task allows an estimate of how the subjective value of the delayed reinforcer decreases as delays increase. Latency to respond was also measured for each trial.
Results
Both HAP2 and HAP1 lines of mice were more impulsive than the LAP2 and HS/Ibg lines, respectively. Hyperbolic curve-fitting confirmed steeper discounting in the high-alcohol drinking lines. In addition, the high-alcohol drinking lines demonstrated greater within-session increases in reaction times relative to the low-alcohol drinking lines. No other differences (consumption of saccharin, total trials completed) consistently mapped onto genetic differences in alcohol drinking.
Conclusions
Alcohol-naïve outbred mice selected for high-alcohol drinking were more impulsive with saccharin reinforcers than low-alcohol drinkers. These data are consistent with results seen using inbred strain descendents of high-alcohol drinking and low-alcohol drinking rat lines, and suggest that impulsivity is a heritable difference that precedes alcoholism.
Keywords: Alcohol Drinking, Alcoholism, Behavioral Economics, Endophenotype, Behavioral Genetics
Excessive alcohol drinking is the third leading preventable cause of death, and caused 75,766 deaths in 2001, and shortened those lives by an average of 30 years (CDC, 2001). Impulsivity is correlated with alcoholism (Petry, 2001), abuse of cocaine (Bornovalova et al., 2005; Coffey et al., 2003), heroin (Kirby et al., 1999; Madden et al., 1997), methamphetamine (Hoffman et al., 2006), and nicotine (Mitchell, 1999). Additionally, severity of addiction to drugs is positively correlated to the degree of impulsivity (Dom et al., 2006; Heyman and Gibb, 2006). While impulsivity appears to be linked to addiction, the relative contributions of innate and induced impulsivity to addiction is controversial and of great interest to researchers (Petry, 2006).
Impulsivity may be viewed as the behavioral output of neurological processes that likely contributes to addictive disorders, and as such might be thought of as a candidate endophenotype. Endophenotypes are measurable, heritable biological states that are hypothesized to underlie and precede the development of a disorder, and are presumably closely related to the particular alleles that cause a disorder (Gottesman and Gould, 2003). Endophenotypes are valuable analytical tools, as they potentially allow greater power to detect genes and/or systems of interest than the clinical phenotype itself (Dick et al., 2006), as well as increasing understanding of the etiology of complex disorders such as alcoholism and other addictions.
To avoid the confounding variable of drug history found in most human studies, we may turn to studies of drug-naïve subjects to assess whether impulsivity could be considered a valid endophenotype rather than a result of a history of drug use. Sons of alcoholic fathers were observed to be more impulsive than controls in the premorbid stage in one longitudinal study (Knop, 1985). In another 4-year longitudinal study, impulsivity was predictive of later alcohol use by teens (Ernst et al., 2006). In nondrug using female subjects, paternal drug use history predicted higher impulsivity (Petry et al., 2002). In rats, impulsivity in drug-naïve animals was predictive of later cocaine self-administration (Perry et al., 2005) and, in another rat study, later alcohol drinking (Poulos et al., 1995).
Impulsivity, along with heightened reward, forms a crucial component of addiction. Although much attention has been devoted to drug reward and reward-related brain circuits, drug reward alone may not be sufficient to establish drug addiction. An emerging hypothesis is that addiction results from the interaction of reward mechanisms and impaired inhibition (Finn, 2002; Goldstein and Volkow, 2002; Olmstead, 2006; Perry and Carroll, 2008; de Wit and Richards, 2004). The inhibition addressed in this study is of maladaptive choice behavior that results in a net loss to the organism.
One way to define impulsivity is the tendency to value smaller immediate rewards over larger delayed rewards (Ainslie, 1975; Rachlin and Green, 1972). According to this theoretical framework, impulsivity is an inability to defer reward, even when waiting consistently results in greater success, or reward density. This tendency can be measured empirically using the delay discounting (DD) task. The DD task is widely used in both human and animal studies, and the task is remarkably similar between species, lending good face validity to assessments of impulsivity in experimental animal models. Impulsivity in the DD task is defined as the extent to which time degrades the subjective rewarding value of the delayed reinforcer. The steepness of this relationship between time and subjective value is usually referred to in the literature as k. Larger values of k equal greater impulsivity, that is, greater discounting of delayed rewards. The parameter k is derived from the formula:
where V is the subjective value of the reward, A is the size of the delayed reward, D is the length of the delay, and k is the fitted parameter (Mazur, 1987). The DD task is uniquely well suited to measuring impulsive choice, or cognitive impulsivity, which can be differentiated from prepotent response inhibition, or motor impulsivity (Mitchell et al., 2005; Winstanley et al., 2004). The DD task is a robust measurement tool, as discounting curves remain stable for months, and have high test-retest reliability (Ohmura et al., 2006).
An ideal animal model of alcoholism would be one that demonstrated high volitional ethanol consumption in the presence of an alternative fluid. Bidirectional selection of 2 replicated lines of HAP and LAP mice both began with heterogeneous HS/Ibg mice; these are low ethanol drinkers which consume about 3.5 g/kg/day (Behm et al., 2003; Grahame et al., 1999a). The HAP mice do not have to be food or water deprived to drink ethanol, they will drink unsweetened ethanol, and they achieve pharmacologically relevant blood alcohol concentrations following free-choice access to ethanol and water (Grahame and Grose, 2003; Grahame et al., 1999a). Both HAP1 and HAP2 mice prefer ethanol to water. Parents of the HAP mice used in the current study (generations 34 and 23 for lines 1 and 2, respectively) have an 84% preference ratio when drinking a 10%(v/v) ethanol solution, as compared to a 6% preference ratio observed in generation 23 LAP2 and a 15% preference ratio in the HS/Ibg mice.
The selection criterion for the HAPs was high consumption of 10% ethanol solution during 4 weeks of free-choice access, while the criterion for LAPs was low consumption of the same solution during the same period (Grahame et al., 1999b). Over generations, alleles that increase ethanol preference become concentrated in the population of HAPs and become excluded from the population of LAPs. Generally speaking, bidirectional selection results in divergence on the trait of interest as well as divergence on correlated traits (Crabbe et al., 1990; Falconer and Mackay, 1996). Traits correlated with ethanol preference include motor impulsivity (Wilhelm et al., 2007), anxiety-like behaviors (Izidio and Ramos, 2007), sweet preference (Dess et al., 1998; Piasecki et al., 1998), and conditioned taste aversion (Chester et al., 2003), among others (Green and Grahame, 2008). These correlated traits may reveal endophenotypes. If impulsivity is an endophenotype for addiction/alcoholism, then selection for high and low ethanol preference should result in parallel differences in impulsivity.
Greater impulsive choice was not detected using the DD task in mice selected for alcohol drinking in one study, although those authors did find higher motor impulsivity in the high drinkers (Wilhelm et al., 2007). As the selection was performed over only 4 generations, this study may have lacked a large enough response to selection to detect a correlated trait such as impulsivity. Another study showed that 2 strains of inbred high-alcohol drinking (iHAD) rats had steeper discounting curves than 2 strains of inbred low-alcohol drinking (iLAD) rats (Wilhelm and Mitchell, 2008), suggesting a genetic relationship between drinking and impulsivity. However, because an inbred strain represents a single genetic individual that is homozygous at all loci, extrapolating findings from even 2 pairs of strains to a wider population may not be as straightforward as more outbred lines.
Given that HAP mice freely drink relatively large amounts of alcohol, and alcoholism in humans correlates with impulsivity, our first hypothesis is that ethanol-naïve HAP2 mice will be more impulsive than LAP2 mice on the DD task using saccharin rewards. Our second hypothesis is that HAP1 mice will be more impulsive than the relatively abstinent HS/Ibg mice, which would allow replication of the line 2 result, showing that line differences in impulsivity are not likely to be a chance result of differences arising from inbreeding and genetic drift. If these hypotheses were supported, it would provide additional evidence for impulsivity as an endopheno-type in alcoholism.
MATERIALS AND METHODS
All work was performed in accordance with, and approved by, the Indiana University School of Medicine IACUC. Mice were offspring of HAP1, HAP2, LAP2, and HS/Ibg breeders, and were all born in the Indianapolis Veterans Administration Animal Care Facility. HS/Ibg breeders were supplied from the founding colony in Boulder, CO, and HS/Ibg mice used in this study were no more than 3 generations removed from those original breeders. Mice were all individually housed in polycarbonate cages (27.9 × 9.5 × 12.7 cm) with Cellsorb bedding, at an ambient temperature of 21 ± 1°C and lights on from 22:00 to 10:00 hours. Mice had ad lib access to food, and water access restricted to 2 hours per day, immediately after testing. Mice were transported in a light shielded transporter to the testing room; the mice were tested between 11:00 and 16:00 hours, and were always tested in the dark.
Experiment 1 and experiment 2 were conducted in the same way using the same shaping protocol, equipment, software, and handling procedures. The only difference between them was the type of mice tested. Experiment 1 was conducted with HAP2 and LAP2 mice, while experiment 2 was conducted with HAP1 and HS/Ibg mice.
Apparatus
The operant apparatus consisted of 12 identical boxes that measured 21.6 × 19.7 × 12.7 cm inside, with 2 sides constructed of clear acrylic and 2 sides of aluminum (MedAssociates, St Albans, VT). The operant box was contained in a sound and light attenuated chamber that was equipped with a fan for ventilation and background noise. An LED/nosepoke infrared detector was centered on the 19.7 cm side at 6.3 cm above the floor, and illumination of that LED signaled the beginning of a trial. Below the LED/nose-poke detector was the sipper access hole, through which the sipper descended when mice were being rewarded. The sipper tube was a 10-ml graduated plastic serological pipette fitted with a stainless steel tip (Ancare, Belmont, NY.) The sipper tube could be extended into the box for varying amounts of time, which allowed precise control of sipper access. Consumption volumes (±0.1 ml) were visually read from the tube. The sipper tube was filled with a solution of 0.0316% (w/v) saccharin solution. Levers were mounted 2.5 cm above the floor on either side of the sipper tube opening. Each lever had an LED 2.3 cm above it signaling that the lever was active (that is, reinforcement was available on that lever). Control of the operant boxes and collection of data was performed via the MedPC IV software (MedAssociates, St Albans, VT) and MedPC interface cards on a PC compatible computer. Data were sorted in Microsoft Excel (Redmond, WA) and statistical analyses were performed using SPSS 15.0 (Chicago, IL).
Animals
Two experiments were conducted. Experiment 1 used 2 cohorts each of HAP2 and LAP2 mice, and Experiment 2 used 1 cohort each of HAP1 and HS/Ibg mice. In both experiments, both lines of mice were tested concurrently. In Experiment 1, the first cohort of mice were 12 HAP2 and 12 LAP2, (generation 23) 6 male and 6 female of each line, and were an average of 110 ± 25 days old at the beginning of shaping. The second cohort were 12 HAP2 and 12 LAP2 (generation 24) 6 male and 6 female of each line, and were an average of 137 ± 3 days old at the beginning of shaping. Experiment 2 used 1 cohort of 24 HAP1 (generation 34) and 24 HS/Ibg (generation 76), 12 males and 12 females of each line, which were 70 ± 4 days old at the beginning of the experiment.
Behavioral Assessment
The time course of each trial is illustrated in Fig. 1. This procedure was a slightly modified version of a previously reported DD task called an adjusting amount procedure and has been previously described (Richards et al., 1997). Briefly, the center nosepoke cue light is illuminated until the mouse initiates the trial by nosepoking. After the nosepoke, the center light goes dark, and the lights illuminate above both the left and right lever, signaling availability of a choice. Both lights remain illuminated until a lever press is recorded. Once a lever press is made, the nonchosen lever light extinguishes, and the sipper containing saccharin solution descends into the drinking position. Saccharin solution was used to promote higher responding. One lever was always assigned to “delay” and the other was assigned to “immediate.” A lever press on the delay side resulted in delivery of the standard, 2-second reward after the programmed delay interval, during which time the light above the delay lever remained illuminated. An immediate-side lever press resulted in delivery of the adjusting reward without any programmed delay. The immediate (adjusting reward) side was set to 1 second access time (half the standard reward) at the beginning of the session. The access time on the immediate side adjusted depending on the subject’s choice in the last trial according to the following rules: an immediate choice resulted in adjustment down of sipper access time by 0.2 seconds, and a delay choice resulted in adjustment up of sipper access time by 0.2 seconds. The adjustment increment, 0.2 seconds, was 20% of the initial adjusting side amount. As the value of the immediate reinforcer adjusts up and down throughout the session, it should have titrated to a value subjectively equivalent to the 2-second standard reward by the end of the session. Therefore, the adjusted amount of the immediate side gives an estimate of the subjective valuation of the delayed reward by the end of the session. The adjusted amount of the immediate side was limited to 2 seconds so that it never became larger than the amount on the delayed side, as experience with very large immediate rewards might interfere with mice being able to reliably assess reward magnitude. This was a departure from the Richards and colleagues (1997) paper, which also included a side bias term in the numerator. As we capped the adjusted amount at 2 seconds (the size of the delayed reward), we were not sensitive to biases toward the delayed lever, so we excluded the bias term. Therefore, the range of adjustment was always between 0 and 2 seconds sipper access time. To expose the mice regularly to both immediate and delayed reinforcers, a forced trial on the opposite lever was instituted after 2 consecutive selections of the same lever. In a forced trial, only 1 lever was active, and only that light came on after a nosepoke. In addition, there was no adjustment of the immediate reinforcer resulting from forced trials.
Fig. 1.
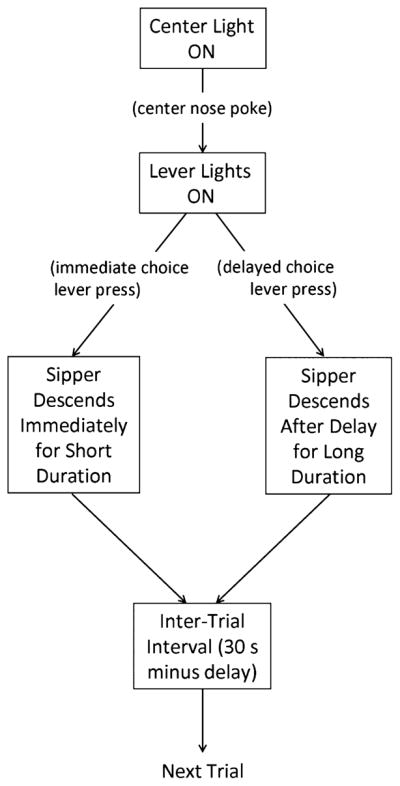
Response requirements in a trial. The text in parentheses show the operant responses required to proceed to the next step. The sipper tube contains 0.0316% (w/v) saccharin solution.
Mice were shaped according to the protocol outlined in Table 1. After the mice met criterion lever pressing in stage 4 (20 trials completed), side bias was assessed by averaging the last 3 days’ choices on each side. The large reinforcer was then assigned to their non preferred side, to counter any initial side bias. After shaping was completed, mice were assessed at the zero delay, which is not actually a delay but rather an assessment of magnitude discrimination. The criterion for continued inclusion of individual mice in this study was a mean adjusted amount of 1.5 seconds or greater (75% or more of the 2 seconds access on the delayed side) in 3 of 4 consecutive days. We used this inclusion criterion because any assessment of DD relies on magnitude discrimination. If individuals could not display a preference for the larger reward, then discounting of that assessment based upon time would be unreliable. Importantly, the adjusted amount derived at the zero delay was not the result of innate side bias, as the 75% adjusted amount requirement meant that the mice preferred the large reinforcer lever over the other lever, which they had initially preferred in the beginning of shaping. Within 5 days of reaching the zero delay criterion, delays of 1, 2, 4, and 8 seconds were introduced in ascending order. Mice were tested for 3 consecutive sessions at each delay, and each session had a single fixed delay for the duration of that session. Dependent variables such as total trials, percent forced trials, consumption, and choice sipper access were means taken from the means of those 3 sessions (or 2, if they did not complete at least 20 trials during a session.) Indifference points for each mouse were determined by taking the median adjusted amount for the last 20 choice trials completed, and then averaging those values across 3 sessions within a programmed delay. Sessions were limited to 1 hour or 60 choice trials, whichever came first. All daily data from mice that completed fewer than 20 trials on a day were excluded. If a mouse did not complete ≥20 trials on 2 of 3 sessions at a delay, that mouse was excluded from the experiment for nonperformance.
Table 1.
Shaping Protocol
| Stage | Description | Criterion to advancement |
|---|---|---|
| 1 | All center nose pokes reinforced on a FR1 schedule with 20 seconds; sipper access. No levers | Stage 1 is run for only 1 session |
| 2 | All center nose pokes reinforced on a FR1 schedule with 10-second sipper access. No levers | Completion of 20 trials |
| 3 | All trials are cued. The center light is illuminated for 20 seconds, with 10-second ITI. No levers | Completion of 20 trials |
| 4 | Nosepoke and then lever press required for 10-second sipper access. Levers are reinforced equally, and the ITI is 10 seconds. Levers added | Completion of 20 trials in 60 minutes |
| 5 | Levers present. Delay is zero, and ITI is 30 seconds. Adjustment and forced trials are introduced. The first 3 days that the mouse meets criterion becomes the “zero delay” score | Completion of 20 choice trials in 60 minutes, AND mean adjusted amount of 75% of the standard side in 3 of 4 sessions. |
FR1, fixed ratio 1; ITI, intertrial interval.
Statistics
Parametric statistics were performed, and an α-value of 0.05 was set as the significance threshold, unless corrected by the Bonferroni method. Our main hypothesis was that selection for differences in alcohol preference changed temporal discounting. Because each experiment was performed with a high-alcohol drinking line and a low-alcohol drinking line, we assessed the effect of Alcohol Preference in each study in an overall Experiment × Sex × Alcohol Preference ANOVA, but collapsed across Experiment and Sex in the absence of significant interactions between alcohol preference and these other 2 independent variables. The ns for experiment 1 were HAP2 10(m), 6(f); LAP2 10(m), 7(f), and for experiment 2 they were HAP1 8(m), 10(f); HS/Ibg 10(m), 7(f). In the presence of significant interactions, data were stratified by factor and analyzed separately for simple main effects and/or group differences. Huyn-Feldt corrections were used where appropriate.
Analyses of response latencies used medians, because medians are less sensitive than means to the positive skew inherent in reaction time (RT) data sets. Analyses of median response latencies used trials pooled from all sessions, and latencies greater than 30 seconds were excluded as omissions. In the presence of simple main effects of trial block within Line, t-tests back to the first bin were performed to assess differences in response times.
RESULTS
Two mice were excluded from experiment 1 for nonperformance and 11 mice were eliminated due to equipment failure. Additionally, 2 mice died from unknown causes. In experiment 2, 13 mice were excluded for nonperformance. Not including the equipment problem, 16% of the total mice were excluded from the experiments for nonperformance. Six sessions were discarded from experiment 1, and 2 sessions were discarded from experiment 2 for noncompletion of 20 trials, amounting to 1.2 and 0.4% of the total sessions, respectively. There were no line differences in side preference during shaping in any experiment (ps > 0.39). For the critical last 20 trials data, the 95% confidence interval for mean delay preference (number of delayed choices divided by delayed plus immediate choices) was 45.7 to 51.6%, indicating a lack of preference for either lever. Therefore, adjusted amounts recorded on the immediate lever should accurately reflect indifference points.
The dependent variables that were most relevant to choice impulsivity were indifference points and k values. A mixed Experiment (1 or 2) × Sex × Alcohol Preference (High or Low) × Delay (0, 1, 2, 4, or 8) ANOVA was performed on indifference points. Main effects of Delay F(4.0,240.0) = 178.68, p < 0.001 and Alcohol Preference were detected F(1,60) = 14.04, p < 0.001, but no main effects of Experiment (p = 0.20), Sex (p = 0.58), or interactions with Alcohol Preference, Experiment, or Sex were observed (ps > 0.17). Mean indifference points and discounting curves are presented in Fig. 2; for clarity, we have included data from each of the 4 lines plotted separately, as well as the data collapsed across Alcohol Preference (bottom panel). These data indicated a consistent effect of a genetic difference in alcohol preference on indifference points in the DD task, consistent with impulsivity’s role in high alcohol consumption.
Fig. 2.
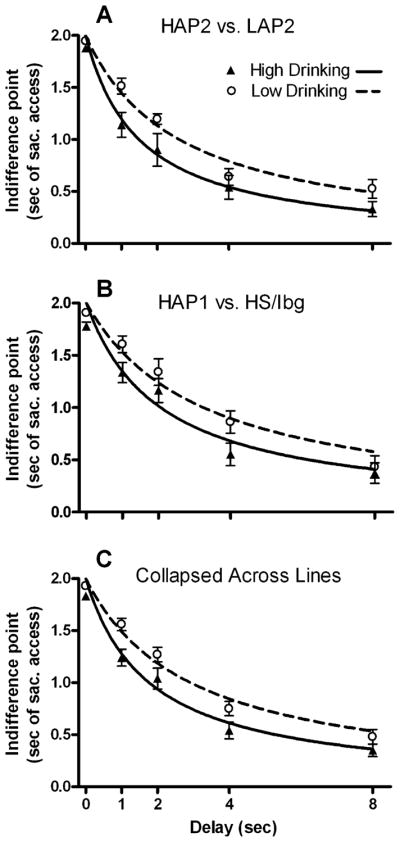
Group mean indifference points ± SEM as a function of delay (0, 1, 2, 4, and 8 seconds). The y-axis is in units of “seconds of access to saccharin solution.” Hyperbolic discounting curves were fitted using calculated k values derived from nonlinear regression. (A) Data derived from experiment 1: HAP2 (n = 16), LAP2 (n = 17). (B) Data derived from experiment 2: HAP1 (n = 18), HS/Ibg (n = 17). (C) Data collapsed across experiment and shown by Alcohol Preference.
The free parameter k is the value that generates the best fit with the hyperbolic discounting function for each individual. In the present study, k described much of the variance in discounting (mean ± SEM R2 values = 0.73 ± 0.024). The k values were skewed right (skew = 5.28), so they were normalized with a natural-log transform to allow parametric testing (skew = 0.28). An Experiment × Sex × Alcohol Preference univariate ANOVA on natural-log transformed k values revealed a main effect of Alcohol Preference F(1,60) = 12.14, p = 0.001, but no main effects of Sex (p = 0.55), Experiment (p = 0.09), or interactions with these factors (ps > 0.39). A follow-up t-test between the high and low drinking phenotypes revealed a difference by Alcohol Preference t(66) = 3.41, p = 0.001. Mean ln k values were −0.520 and −1.091, which correspond to k values of 0.594 and 0.336 for high and low-alcohol preferring, respectively. Larger values of k represent steeper discounting, i.e., greater impulsivity.
Trials completed is a measure of operant behavior that may reflect any motivational differences among groups, but is unlikely to be related to our central measures of impulsivity. To assess whether there were group differences in this dependent variable, we conducted a mixed Experiment (1 or 2) × Sex × Alcohol Preference (High or Low) × Delay (0, 1, 2, 4, or 8) ANOVA on total trials. Main effects of Alcohol Preference F(1,60) = 9.00, p = 0.004 and Experiment F(1,60) = 5.47, p = 0.023 were detected, but Sex was not (p = 0.09). There were no interactions with Sex (ps > 0.21) so data were collapsed across Sex. Experiment interacted with Delay F(4.0,240.0) = 5.71, p < 0.001, so the 2 experiments were analyzed separately. In experiment 1, there was no main effect of Delay (p = 0.06) or Line (p = 0.12), nor was there an interaction of Delay and Line (p = 0.62). In experiment 2, main effects of Delay F(3.4,113.7) = 5.40, p = 0.001, Line F(1,33) = 6.96, p = 0.013 and an interaction of Delay × Line F(3.4,113.7) = 3.09, p = 0.024 were detected. Data were stratified by Line, and a main effect of Delay was detected in HAP1 F(4,68) = 4.49, p = 0.003 and HS/Ibg F(4,64) = 4.02, p = 0.006 such that HAP1s generally completed fewer trials at intermediate delays, and HS/Ibgs completed more trials at longer delays. Additionally, follow-up t-tests confirmed that HAP1s and HS/Ibgs differed at 0 and 1-second delays ts(33) > 3.05, ps < 0.005 using a Bonferroni corrected α of 0.01. These data are summarized in Table 2. The general pattern showed more trials completed by high-alcohol drinkers, but this effect was marginal, and did not reveal a consistent relationship between genetic differences in alcohol preference. An additional analysis was performed to assess whether there was any correlation between trials completed and k values, our central measure of impulsivity. We ascertained this correlation by determining the mean number of trials completed by each mouse from both experiments, and correlating it with that mouse’s lnk value. Across all 68 mice included in the study, this correlation (Pearson’s) was r = 0.219, p = 0.073.
Table 2.
Summary of Trials, Consumption, and Sipper Access
| Line | Delay |
|||||
|---|---|---|---|---|---|---|
| 0 seconds | 1 second | 2 seconds | 4 seconds | 8 seconds | ||
| Total trials | HAP2 | 56.1 ± 2.51 | 56.6 ± 2.30 | 56.4 ± 2.59 | 52.6 ± 2.46 | 52.8 ± 1.94 |
| LAP2 | 49.4 ± 2.57 | 50.4 ± 2.52 | 50.4 ± 2.89 | 49.3 ± 3.22 | 48.5 ± 2.69 | |
| HAP1* | 52.9 ± 2.50a | 52.3 ± 2.65a | 46.3 ± 2.51 | 48.8 ± 2.51 | 50.1 ± 2.99 | |
| HS/Ibg* | 41.5 ± 1.96a | 41.9 ± 2.10a | 39.7 ± 2.15 | 42.2 ± 1.93 | 46.4 ± 1.79 | |
| Percent forced trials | HAP2b | 27.4 ± 0.65b | 26.3 ± 0.40 | 25.2 ± 0.34 | 25.3 ± 0.55 | 25.3 ± 0.50 |
| LAP2b | 28.8 ± 0.41b | 26.2 ± 0.39 | 24.4 ± 0.66 | 25.6 ± 0.52 | 25.0 ± 0.60 | |
| HAP1b | 26.8 ± 0.52b | 25.5 ± 0.38 | 25.7 ± 0.34 | 26.2 ± 0.43 | 25.8 ± 0.30 | |
| HS/Ibgb | 28.6 ± 0.48b | 26.4 ± 0.54 | 25.8 ± 0.54 | 24.4 ± 0.68 | 25.3 ± 0.36 | |
| Consumption (ml) | HAP2* | 1.57 ± 0.10a | 1.39 ± 0.10 | 1.29 ± 0.12 | 0.91 ± 0.08 | 0.90 ± 0.06 |
| LAP2* | 1.13 ± 0.08a | 1.13 ± 0.08 | 1.07 ± 0.07 | 1.00 ± 0.08 | 0.77 ± 0.06 | |
| HAP1 | 0.97 ± 0.07 | 0.91 ± 0.07 | 0.79 ± 0.07 | 0.78 ± 0.06 | 0.77 ± 0.07 | |
| HS/Ibg | 0.88 ± 0.08 | 0.92 ± 0.09 | 0.81 ± 0.09 | 0.81 ± 0.08 | 0.71 ± 0.07 | |
| Choice sipper time/trial (s/trial) | HAP2c | 1.36 ± 0.02 | 1.16 ± 0.03 | 1.05 ± 0.05 | 0.87 ± 0.05 | 0.74 ± 0.04 |
| LAP2c | 1.36 ± 0.02 | 1.27 ± 0.02 | 1.18 ± 0.03 | 0.97 ± 0.03 | 0.81 ± 0.04 | |
| HAP1c | 1.34 ± 0.02 | 1.24 ± 0.03 | 1.16 ± 0.04 | 0.87 ± 0.06 | 0.73 ± 0.05 | |
| HS/Ibgc | 1.36 ± 0.01 | 1.30 ± 0.03 | 1.22 ± 0.05 | 1.02 ± 0.05 | 0.82 ± 0.04 | |
Ns: HAP2 10(m), 6(f); LAP2 10(m), 7(f); HAP1 8(m), 10(f); HS/Ibg 10(m), 7(f). Data are shown as mean ± SEM by Line and Delay. In the presence of a Delay × Line interaction within Experiment, a simple main effect of Delay was detected within Line (*p < 0.05). Line differed within Delay (a,bp < 0.01, Bonferroni corrected).
Percent forced trials showed no interactions with Experiment, so data were analyzed by Alcohol Preference rather than Line.
Main effects of Delay and Alcohol Preference were detected.
Forced trials can influence the relationship between actual consumption and indifference points, especially in the case of low indifference points and high trial number. Percentage of forced trials may be a measure of behavioral rigidity or perseveration. Although we did observe some line differences in the proportion of trials that were forced, this was seen only at the 0-second delay, in which low preference mice had more forced trials (see Table 2). To assess whether there were group differences in this dependent variable, we conducted a mixed Experiment (1 or 2) × Sex × Alcohol Preference (High or Low) × Delay (0, 1, 2, 4, or 8) ANOVA on average percentage of forced trials. A main effect of Delay was detected F(4,240) = 20.52, p < 0.001, but Sex (p = 0.07), Experiment (p = 0.27), and Alcohol Preference (p = 0.56) were not. An interaction of Delay × Alcohol Preference was also detected F(4,240) = 3.61, p = 0.007, but interactions with Sex (ps > 0.17), and Experiment (ps > 0.27) were not. Therefore, data were collapsed across Sex and Experiment and analyzed by Delay and Alcohol Preference. A main effect of Delay was present F(4,264) = 21.61, p < 0.001, as well as a Delay × Alcohol Preference interaction F(4,264) = 4.30, p = 0.002, but the main effect of Alcohol Preference (p = 0.72) was not. Therefore, we assessed the effect of Alcohol Preference at each by Delay using t-tests, again Bonferroni-correcting for multiple comparisons to p = 0.01. The 0 delay differed by Alcohol Preference t(66) = 3.16, p = 0.002, but the other delays did not (ps > 0.14). These data indicate that the percentage of forced trials was higher in the low-alcohol drinkers at the 0 delay, but that they were generally similar at other delays.
If the DD task is set up correctly, there should be a decrease in reward received with lower adjusted amounts, because a more impulsive strategy is self-defeating (Ainslie, 1975). Actual consumption of reward declined as a function of Delay F(3.4,202.9) = 31.17, p < 0.001, and showed interactions of Delay × Alcohol Preference F(3.4,202.9) = 5.09, p = 0.001, Delay × Experiment F(3.4,202.9) = 7.38, p < 0.001, but not interactions with Sex (ps > 0.12). There was a main effect of Experiment F(1,60) = 15.49, p < 0.001, but not of Sex (p = 0.25), Alcohol Preference (p = 0.12), or interactions with Alcohol Preference (ps > 0.13). Therefore, data were collapsed across Sex, and to follow up on the interactions with Alcohol Preference and Experiment, experiments were analyzed separately by Line. Experiment 1 showed main effects of Delay F(2.6,82.2) = 24.55, p < 0.001 and Line F(1,31) = 4.23, p = 0.048 as well as a Delay × Line interaction F(2.6,82.2) = 5.19, p = 0.004. To follow up on this interaction, we assessed whether there were line differences at each delay, again using Bonferroni-corrected t-tests. The 0 delay was found to differ t(33) = 3.38, p = 0.002, but the lines did not differ at the other delays (ps > 0.046). In experiment 2 there was a main effect of Delay, F(3.5,114.1) = 9.95, p < 0.001, but no main effect or interaction with Line (ps > 0.343). In experiment 2, Delay was less potent in decreasing consumption than in experiment 1. These data are shown in Table 2. The pattern of results suggests that at longer delays, impatience impairs the ability of the mice to correctly choose the delayed reward and that at least between HAP2 and LAP2 mice, the steeper discounting curve observed did result in a loss of ability to obtain the reinforcer.
Given that the high-alcohol preferring lines generally completed more trials and also received more forced trials on the delayed side, actual consumption did not track perfectly with the main effect of Alcohol Preference on indifference points. Perhaps a better index of optimal behavior is the amount of sipper access time that mice earned on choice (nonforced) trials. To cancel the effect of differential total trials between Alcohol Preference groups, the choice sipper access time was divided by total trials completed to yield a measure of behavioral efficiency: that is, ability to gain access to the sipper tube.
A mixed Experiment (1 or 2) × Sex × Alcohol Preference (High or Low) × Delay (0, 1, 2, 4, or 8) ANOVA was performed on choice sipper access time per trial. Main effects of Delay F(3.9,231.9) = 185.81, p < 0.001 and Alcohol Preference F(1,60) = 14.63, p < 0.001 were detected, but there were no interactions (ps > 0.16). This measure of behavioral efficiency corresponded well with indifference points, and is illustrated in Table 2. Again, this dependent variable suggests the costs, in terms of a loss of reinforcer access time, of the high preferring lines’ more impulsive strategy. As differences in drinking efficiency could cloud interpretations by allowing faster mice to get more reward in less sipper access time, an ANOVA was conducted to assess this. Mean drinking efficiencies were 0.0149 ± 0.0006, 0.0134 ± 0.0006, 0.0112 ± 0.0006, and 0.0121 ± 0.0009 ml/s sipper access ± SEM in HAP2, LAP2, HAP1, and HS/Ibg lines, respectively. No effect of Line was detected (p = 0.25).
To examine possible differences in RT during the 1-hour operant sessions, average median response latencies were calculated in 5-trial blocks up to 40 trials. We selected 40 trials as the upper limit, as there were some subjects that did not complete more than 40 trials and would therefore have been excluded from the analysis. A mixed Experiment (1 or 2) × Sex × Alcohol Preference (High or Low) × Block (1 to 8) ANOVA was performed on these data. Main effects of Experiment F(1,60) = 33.73, p < 0.001, Alcohol Preference F(1,60) = 8.59, p = 0.005, and Block F(4.8,288) = 40.30, p < 0.001 were detected, but Sex was not (p = 0.62). No interactions with Sex were found (ps > 0.16), but interactions of Block × Experiment F(4.8,288) = 2.36, p = 0.043 and Block × Alcohol Preference F(4.8,288) = 7.33, p < 0.001 were detected. In experiment 1, a main effect of Block and an interaction of Block × Line F(4.0,124.8) > 3.97, ps < 0.005 were detected, therefore HAP2 and LAP2 were stratified. Simple main effects were detected in both HAP2 F(3.1,46.4) = 19.71, p < 0.001 and LAP2 F(4.5,72.3) = 8.63, p < 0.001 lines, so paired t-tests were performed by Block back to the first block within Line. To control for multiple comparisons, we used a Bonferroni-corrected α of 0.00714. In HAP2s, the RTs were slower in the seventh and eighth blocks than the first block ts(15) > 4.93, ps < 0.001. In LAP2s, RTs improved in the second block, but were then unchanged through the last block. Large increases in RTs were only seen in the HAP2s. In experiment 2, a main effect of Block and an interaction of Block × Line F(4.5,148.7) > 4.39, ps < 0.002 were detected, therefore HAP1 and HS/Ibg lines were stratified. Simple main effects were detected in both HAP1 F(3.0,51.3) = 20.70, p < 0.001 and HS/Ibg F(5.4,87.0) = 3.43, p = 0.006 lines, so paired t-tests were performed by Block back to the first block, again Bonferroni correcting for multiple comparisons. In HAP1s, the fourth through the seventh blocks differed from the first ts(17) > 3.43, ps < 0.004. In HS/Ibgs, the fifth, sixth, and seventh blocks differed from the first ts(16) > 3.07, ps < 0.007. Generally, there was an increase in RT later in the session in both lines, but this happened earlier and to a larger degree in the HAP1 versus the HS/Ibg. These data are illustrated in Fig. 3.
Fig. 3.

Average median reaction times (RTs) in 5-trial blocks were analyzed with paired t-tests to the first block. HAP2 RTs increased more throughout the session than the LAP2s’ (Experiment 1, left panel). HAP1 RTs increased sooner in the session, and by a larger percentage than HS/Ibgs’ (Experiment 2, right panel). *p < 0.0071, which is the Bonferroni-corrected α value.
DISCUSSION
These studies demonstrated that genetic differences in alcohol drinking among 4 independent, outbred mouse lines was positively correlated with differences in impulsivity. In contrast, while we occasionally observed differences among the lines in measures of general motivation, such as amount of reinforcer consumed, this difference was not consistently related to genetic differences in alcohol preference and was uncorrelated with our central measure of impulsivity.
Although the use of sipper tube access for reinforcement rather than discrete delivery introduces drinking efficiency as a possible confound, we did not observe differing efficiencies between the lines, meaning that this was an unlikely source of line differences in discounting behavior. However, the HAP mice did generally consume more reinforcer than the LAP mice in spite of lower adjusted amounts. The most reasonable explanation for this result is the larger number of total trials, as well as forced trials completed by the high-alcohol drinkers as compared to the low drinkers. When we assessed reinforcer access time only on nonforced trials, we again observed no line differences.
The exclusion of 16% of the mice raises the possibility that the current findings do not generalize to the whole population. This issue was carefully weighed against the problem of magnitude discrimination, i.e., mice that cannot discriminate between large and small cannot produce useful data in a discounting task. We decided to use only the 84% of the population that could reliably learn to discriminate the large reinforcer from the small one.
Results found here were somewhat complicated by the fact that we did not have access to 2 complete sets of selected lines maintained in Indianapolis for equivalent numbers of generations; on the other hand, we were able to observe the behavior of a nonselected control line, the HS/Ibg. With respect to DD, the line difference was slightly larger when the bidirectionally selected lines were compared to each other as opposed to the high drinking line versus the progenitor line. This may suggest that the largest response to selection was in the direction of high drinking leading to high impulsivity, rather than low drinking leading to low impulsivity. Overall, however, HAP2 differed from LAP2 with a similar magnitude as HAP1 differed from HS/Ibg. Typically, using a nonselected progenitor stock instead of another LAP line would tend to diminish our ability to detect correlated responses; the fact that we were nonetheless able to observe the DD and RT differences suggests that they are fairly robust.
Another study indicated that selection for ethanol drinking had no effect on impulsive choice in mice. Although procedurally that study was very similar to the present experiment, that study used a murine population quite different from the present sets of selected lines (Wilhelm et al., 2007). Specifically, they used the fourth generation of their selected mice (STDRHi2 and STDRLo2) for DD testing. They observed an effect of selection for alcohol drinking (high drinkers: 10.5 ± 0.67 g/kg/d), but compared with the current generations of HAP mice (Line 1: 20.8 ± 0.55 g/kg/d and Line 2: 17.2 ± 0.62 g/kg/d) intake of the high drinking parental line was relatively low. Another possibility is that both their response to selection and their ability to detect genetic correlations may be limited by low genetic diversity compared to the HS/Ibg, as the progenitor population in the Wilhelm et al. study was an F2 derived from 2 inbred strains (C57Bl/6J and DBA2/J), compared to the 8 inbred strain cross that was used to derive the HS/Ibg. Overall, any genetic correlation (or lack thereof) is specific to the population in which it is observed, although greater genetic diversity may allow a greater ability to generalize from a particular population to the species in general (Falconer and Mackay, 1996).
A different study performed by the same group found that ethanol-naïve iHAD rats were more impulsive in a DD task than iLAD rats (Wilhelm and Mitchell, 2008). Together with the current study, these data suggest that impulsive choice is heritable and could be an endophenotype for high alcohol consumption. The genetic risk factor for alcoholism in humans may be accounted for, at least in part, by an enhanced tendency to choose impulsively. Whether or not higher impulsivity causes higher alcohol drinking is unknown, but these data indicate that higher impulsivity precedes alcohol drinking and may be associated with it.
Other studies have suggested a link between the genetic influence on various forms of impulsivity and drug abuse. Trait impulsivity, i.e., high premature responding, was associated with low D2/3 receptor availability and later cocaine self-administration (Dalley et al., 2007). In another study, rats selectively bred for high saccharin intake, a correlated trait to alcoholism, were more impulsive in a DD task than low saccharin drinking rats (Perry et al., 2007). Alcohol-preferring Lewis rats, which show conditioned place preference to cocaine (Kosten et al., 1994) and reduced conditioned taste aversion to alcohol (Roma et al., 2006) also showed differences in autoshaping that suggest higher impulsivity (Kearns et al., 2006).
Our measure of behavioral efficiency, choice sipper access time per trial, showed effects of both delay and alcohol preference. Greater impulsive choice, both with longer delays and in high-drinking lines, resulted in losses in sipper access time. This relationship demonstrates that the inability to wait for delayed rewards has detrimental consequences in this task. In the case of human impulsive choice, this behavior may manifest itself as the choice to drink when this will result in later loss of other sources of reinforcement, such as drinking on the job, choosing immediate intoxication over recreational activities, or choosing drug use over human relationships.
We found that the high drinking lines showed a greater increase in RT during the session than the low drinking lines. The results of experiment 2 are more difficult to interpret due to long baseline RTs in the progenitor HS/Ibg line. While it is typical to see increases in RT later in a session, larger relative increases in RT are interpreted by some researchers as impaired sustained attention (Pattyn et al., 2008; Shimizu et al., 2008; Whyte et al., 1995). If these data were regarded as deficits in sustained attention, it would be consistent with studies performed in humans that have shown a correlation between drug abuse and impaired attention (Aharonovich et al., 2003; Cairney et al., 2007; Lane et al., 2007; Mackin et al., 2005). Error rates rather than RT are the most common method of evaluating sustained attention, which is impossible to assess in this version of the DD paradigm, as there is no “incorrect” response. Other reasonable explanations for line differences in RT increases would be fatigue, boredom, working memory, or differences in motivation and/or satiation. Without additional measures of attentional capacity, it is impossible to conclude that these observed differences are due specifically to differences in attention.
The present data show that replicate lines of outbred selected high-alcohol drinking mouse lines are also more impulsive than low drinking lines. Evaluating the neural substrates that modulate choice behavior between small/immediate versus large/delayed may be important to understanding many different neuropsychiatric disorders (Boyle et al., 1992; Dervaux et al., 2001; Noordsy and Green, 2003), and especially the addiction disorders. Impulsive choice may be a more useful construct with which to study the inhibitory aspect of addiction than self-administration, as inhibitory processes are assessed independently of drug reward and in a drug-free state. The current data are consistent with viewing impulsivity as a trait predictive of alcoholism.
Acknowledgments
This work was supported by IUPUI School of Science and AA13483 to NJG and AA016430 to BGO.
References
- Aharonovich E, Nunes E, Hasin D. Cognitive impairment, retention and abstinence among cocaine abusers in cognitive-behavioral treatment. Drug Alcohol Depend. 2003;71:207–211. doi: 10.1016/s0376-8716(03)00092-9. [DOI] [PMC free article] [PubMed] [Google Scholar]
- Ainslie G. Specious reward: a behavioral theory of impulsiveness and impulse control. Psychol Bull. 1975;82:463–496. doi: 10.1037/h0076860. [DOI] [PubMed] [Google Scholar]
- Behm A, Lumeng L, Li T-K, Grahame NJ. Selective breeding for replicate line 2 high- and low-alcohol preferring mice. Alcohol Clin Exp Res. 2003;27:A49. doi: 10.1097/01.ALC.0000046340.06154.9F. [DOI] [PubMed] [Google Scholar]
- Bornovalova MA, Daughters SB, Hernandez GD, Richards JB, Lejuez CW. Differences in impulsivity and risk-taking propensity between primary users of crack cocaine and primary users of heroin in a residential substance- use program. Exp Clin Psychopharmacol. 2005;13:311–318. doi: 10.1037/1064-1297.13.4.311. [DOI] [PubMed] [Google Scholar]
- Boyle MH, Offord DR, Racine YA, Szatmari P, Fleming JE, Links PS. Predicting substance use in late adolescence: results from the Ontario Child Health Study follow-up. Am J Psychiatry. 1992;149:761–767. doi: 10.1176/ajp.149.6.761. [DOI] [PubMed] [Google Scholar]
- Cairney S, Clough A, Jaragba M, Maruff P. Cognitive impairment in Aboriginal people with heavy episodic patterns of alcohol use. Addiction. 2007;102:909–915. doi: 10.1111/j.1360-0443.2007.01840.x. [DOI] [PubMed] [Google Scholar]
- CDC. Alcohol-attributable deaths and years of potential life lost – United States, 2001. Morb Mortal Wkly Rep (Centers for Disease Control and Prevention) 2001;53:866–870. [PubMed] [Google Scholar]
- Chester JA, Lumeng L, Li TK, Grahame NJ. High- and low-alcohol-preferring mice show differences in conditioned taste aversion to alcohol. Alcohol Clin Exp Res. 2003;27:12–18. doi: 10.1097/01.ALC.0000046340.06154.9F. [DOI] [PubMed] [Google Scholar]
- Coffey SF, Gudleski GD, Saladin ME, Brady KT. Impulsivity and rapid discounting of delayed hypothetical rewards in cocaine-dependent individuals. Exp Clin Psychopharmacol. 2003;11:18–25. doi: 10.1037//1064-1297.11.1.18. [DOI] [PubMed] [Google Scholar]
- Crabbe JC, Phillips TJ, Kosobud A, Belknap JK. Estimation of genetic correlation: interpretation of experiments using selectively bred and inbred animals. Alcohol Clin Exp Res. 1990;14:141–151. doi: 10.1111/j.1530-0277.1990.tb00461.x. [DOI] [PubMed] [Google Scholar]
- Dalley JW, Fryer TD, Brichard L, Robinson ES, Theobald DE, Laane K, Pena Y, Murphy ER, Shah Y, Probst K, Abakumova I, Aigbirhio FI, Richards HK, Hong Y, Baron JC, Everitt BJ, Robbins TW. Nucleus accumbens D2/3 receptors predict trait impulsivity and cocaine reinforcement. Science. 2007;315:1267–1270. doi: 10.1126/science.1137073. [DOI] [PMC free article] [PubMed] [Google Scholar]
- Dervaux A, Bayle FJ, Laqueille X, Bourdel MC, Le Borgne MH, Olie JP, Krebs MO. Is substance abuse in schizophrenia related to impulsivity, sensation seeking, or anhedonia? Am J Psychiatry. 2001;158:492–494. doi: 10.1176/appi.ajp.158.3.492. [DOI] [PubMed] [Google Scholar]
- Dess NK, Badia-Elder NE, Thiele TE, Kiefer SW, Blizard DA. Ethanol consumption in rats selectively bred for differential saccharin intake. Alcohol. 1998;16:275–278. doi: 10.1016/s0741-8329(98)00010-x. [DOI] [PubMed] [Google Scholar]
- Dick DM, Jones K, Saccone N, Hinrichs A, Wang JC, Goate A, Bierut L, Almasy L, Schuckit M, Hesselbrock V, Tischfield J, Foroud T, Edenberg H, Porjesz B, Begleiter H. Endophenotypes successfully lead to gene identification: results from the collaborative study on the genetics of alcoholism. Behav Genet. 2006;36:112–126. doi: 10.1007/s10519-005-9001-3. [DOI] [PubMed] [Google Scholar]
- Dom G, D’Haene P, Hulstijn W, Sabbe B. Impulsivity in abstinent early- and late-onset alcoholics: differences in self-report measures and a discounting task. Addiction. 2006;101:50–59. doi: 10.1111/j.1360-0443.2005.01270.x. [DOI] [PubMed] [Google Scholar]
- Ernst M, Luckenbaugh DA, Moolchan ET, Leff MK, Allen R, Eshel N, London ED, Kimes A. Behavioral predictors of substance-use initiation in adolescents with and without attention-deficit/hyperactivity disorder. Pediatrics. 2006;117:2030–2039. doi: 10.1542/peds.2005-0704. [DOI] [PubMed] [Google Scholar]
- Falconer DS, Mackay TFC. Introduction to quantitative genetics. Addison Wesley Longman; Essex: 1996. [Google Scholar]
- Finn PR. Motivation, working memory, and decision making: a cognitive- motivational theory of personality vulnerability to alcoholism. Behav Cogn Neurosci Rev. 2002;1:183–205. doi: 10.1177/1534582302001003001. [DOI] [PubMed] [Google Scholar]
- Goldstein RZ, Volkow ND. Drug addiction and its underlying neurobiological basis: neuroimaging evidence for the involvement of the frontal cortex. Am J Psychiatry. 2002;159:1642–1652. doi: 10.1176/appi.ajp.159.10.1642. [DOI] [PMC free article] [PubMed] [Google Scholar]
- Gottesman II, Gould TD. The endophenotype concept in psychiatry: etymology and strategic intentions. Am J Psychiatry. 2003;160:636–645. doi: 10.1176/appi.ajp.160.4.636. [DOI] [PubMed] [Google Scholar]
- Grahame NJ, Grose AM. Blood alcohol concentrations after scheduled access in high-alcohol-preferring mice. Alcohol. 2003;31:99–104. doi: 10.1016/j.alcohol.2003.08.002. [DOI] [PubMed] [Google Scholar]
- Grahame NJ, Li TK, Lumeng L. Limited access alcohol drinking in high- and low-alcohol preferring selected lines of mice. Alcohol Clin Exp Res. 1999a;23:1015–1022. [PubMed] [Google Scholar]
- Grahame NJ, Li TK, Lumeng L. Selective breeding for high and low alcohol preference in mice. Behav Genet. 1999b;29:47–57. doi: 10.1023/a:1021489922751. [DOI] [PubMed] [Google Scholar]
- Green AS, Grahame NJ. Ethanol drinking in rodents: is free-choice drinking related to the reinforcing effects of ethanol? Alcohol. 2008;42:1–11. doi: 10.1016/j.alcohol.2007.10.005. [DOI] [PMC free article] [PubMed] [Google Scholar]
- Heyman GM, Gibb SP. Delay discounting in college cigarette chippers. Behav Pharmacol. 2006;17:669–679. doi: 10.1097/FBP.0b013e3280116cfe. [DOI] [PubMed] [Google Scholar]
- Hoffman WF, Moore M, Templin R, McFarland B, Hitzemann RJ, Mitchell SH. Neuropsychological function and delay discounting in methamphetamine- dependent individuals. Psychopharmacology (Berl) 2006;188:162–170. doi: 10.1007/s00213-006-0494-0. [DOI] [PubMed] [Google Scholar]
- Izidio GS, Ramos A. Positive association between ethanol consumption and anxiety-related behaviors in two selected rat lines. Alcohol. 2007;41:517–524. doi: 10.1016/j.alcohol.2007.07.008. [DOI] [PubMed] [Google Scholar]
- Kearns DN, Gomez-Serrano MA, Weiss SJ, Riley AL. A comparison of Lewis and Fischer rat strains on autoshaping (sign-tracking), discrimination reversal learning and negative auto-maintenance. Behav Brain Res. 2006;169:193–200. doi: 10.1016/j.bbr.2006.01.005. [DOI] [PubMed] [Google Scholar]
- Kirby KN, Petry NM, Bickel WK. Heroin addicts have higher discount rates for delayed rewards than non-drug-using controls. J Exp Psychol Gen. 1999;128:78–87. doi: 10.1037//0096-3445.128.1.78. [DOI] [PubMed] [Google Scholar]
- Knop J. Premorbid assessment of young men at high risk for alcoholism. Recent Dev Alcohol. 1985;3:53–64. doi: 10.1007/978-1-4615-7715-7_5. [DOI] [PubMed] [Google Scholar]
- Kosten TA, Miserendino MJ, Chi S, Nestler EJ. Fischer and Lewis rat strains show differential cocaine effects in conditioned place preference and behavioral sensitization but not in locomotor activity or conditioned taste aversion. J Pharmacol Exp Ther. 1994;269:137–144. [PubMed] [Google Scholar]
- Lane SD, Cherek DR, Tcheremissine OV, Steinberg JL, Sharon JL. Response perseveration and adaptation in heavy marijuana-smoking adolescents. Addict Behav. 2007;32:977–990. doi: 10.1016/j.addbeh.2006.07.007. [DOI] [PubMed] [Google Scholar]
- Mackin RS, Horner MD, Harvey RT, Stevens LA. The relationship between neuropsychological measures and employment problems in outpatients with substance abuse. Rehabil Psychol. 2005;50:158–163. [Google Scholar]
- Madden GJ, Petry NM, Badger GJ, Bickel WK. Impulsive and self-control choices in opioid-dependent patients and non-drug-using control participants: drug and monetary rewards. Exp Clin Psychopharmacol. 1997;5:256–262. doi: 10.1037//1064-1297.5.3.256. [DOI] [PubMed] [Google Scholar]
- Mazur J. An adjusting procedure for studying delayed reinforcement. In: Commons ML, Mazur JE, Nevin JA, Rachlin H, editors. The Effect of Delay and of Intervening Events on Reinforcement Value. Vol. 5. Lawrence Erlbaum; Hillsdale, N.J: 1987. pp. 55–73. Quantitative analysis of behavior series. [Google Scholar]
- Mitchell SH. Measures of impulsivity in cigarette smokers and non-smokers. Psychopharmacology (Berl) 1999;146:455–464. doi: 10.1007/pl00005491. [DOI] [PubMed] [Google Scholar]
- Mitchell JM, Fields HL, D’Esposito M, Boettiger CA. Impulsive responding in alcoholics. Alcohol Clin Exp Res. 2005;29:2158–2169. doi: 10.1097/01.alc.0000191755.63639.4a. [DOI] [PubMed] [Google Scholar]
- Noordsy DL, Green AI. Pharmacotherapy for schizophrenia and co-occurring substance use disorders. Curr Psychiatry Rep. 2003;5:340–346. doi: 10.1007/s11920-003-0066-5. [DOI] [PubMed] [Google Scholar]
- Ohmura Y, Takahashi T, Kitamura N, Wehr P. Three-month stability of delay and probability discounting measures. Exp Clin Psychopharmacol. 2006;14:318–328. doi: 10.1037/1064-1297.14.3.318. [DOI] [PubMed] [Google Scholar]
- Olmstead MC. Animal models of drug addiction: where do we go from here? Q J Exp Psychol (Colchester) 2006;59:625–653. doi: 10.1080/17470210500356308. [DOI] [PubMed] [Google Scholar]
- Pattyn N, Neyt X, Henderickx D, Soetens E. Psychophysiological investigation of vigilance decrement: boredom or cognitive fatigue? Physiol Behav. 2008;93:369–378. doi: 10.1016/j.physbeh.2007.09.016. [DOI] [PubMed] [Google Scholar]
- Perry JL, Carroll ME. The role of impulsive behavior in drug abuse. Psychopharmacology (Berl) 2008;200:1–26. doi: 10.1007/s00213-008-1173-0. [DOI] [PubMed] [Google Scholar]
- Perry JL, Larson EB, German JP, Madden GJ, Carroll ME. Impulsivity (delay discounting) as a predictor of acquisition of IV cocaine self-administration in female rats. Psychopharmacology (Berl) 2005;178:193–201. doi: 10.1007/s00213-004-1994-4. [DOI] [PubMed] [Google Scholar]
- Perry JL, Nelson SE, Anderson MM, Morgan AD, Carroll ME. Impulsivity (delay discounting) for food and cocaine in male and female rats selectively bred for high and low saccharin intake. Pharmacol Biochem Behav. 2007;86:822–837. doi: 10.1016/j.pbb.2007.03.012. [DOI] [PMC free article] [PubMed] [Google Scholar]
- Petry NM. Delay discounting of money and alcohol in actively using alcoholics, currently abstinent alcoholics, and controls. Psychopharmacology (Berl) 2001;154:243–250. doi: 10.1007/s002130000638. [DOI] [PubMed] [Google Scholar]
- Petry N. Early-onset alcoholism: a separate or unique predictor of delay discounting? Comment on Dom et al. (2006) Addiction. 2006;101:292. doi: 10.1111/j.1360-0443.2005.01307.x. author reply 293–4. [DOI] [PubMed] [Google Scholar]
- Petry NM, Kirby KN, Kranzler HR. Effects of gender and family history of alcohol dependence on a behavioral task of impulsivity in healthy subjects. J Stud Alcohol. 2002;63:83–90. [PubMed] [Google Scholar]
- Piasecki J, Koros E, Dyr W, Kostowski W, Danysz W, Bienkowski P. Ethanol-reinforced behaviour in the rat: effects of uncompetitive NMDA receptor antagonist, memantine. Eur J Pharmacol. 1998;354:135–143. doi: 10.1016/s0014-2999(98)00442-7. [DOI] [PubMed] [Google Scholar]
- Poulos CX, Le AD, Parker JL. Impulsivity predicts individual susceptibility to high levels of alcohol self-administration. Behav Pharmacol. 1995;6:810–814. [PubMed] [Google Scholar]
- Rachlin H, Green L. Commitment, choice and self-control. J Exp Anal Behav. 1972;17:15–22. doi: 10.1901/jeab.1972.17-15. [DOI] [PMC free article] [PubMed] [Google Scholar]
- Richards JB, Mitchell SH, de Wit H, Seiden LS. Determination of discount functions in rats with an adjusting-amount procedure. J Exp Anal Behav. 1997;67:353–366. doi: 10.1901/jeab.1997.67-353. [DOI] [PMC free article] [PubMed] [Google Scholar]
- Roma PG, Flint WW, Higley JD, Riley AL. Assessment of the aversive and rewarding effects of alcohol in Fischer and Lewis rats. Psychopharmacology (Berl) 2006;189:187–199. doi: 10.1007/s00213-006-0553-6. [DOI] [PubMed] [Google Scholar]
- Shimizu K, Gyokusen M, Kitamura S, Kawabe T, Kozaki T, Ishibashi K, Izumi R, Mizunoya W, Ohnuki K, Kondo R. Essential oil of lavender inhibited the decreased attention during a long-term task in humans. Biosci Biotechnol Biochem. 2008;72:1944–1947. doi: 10.1271/bbb.70835. [DOI] [PubMed] [Google Scholar]
- Whyte J, Polansky M, Fleming M, Coslett HB, Cavallucci C. Sustained arousal and attention after traumatic brain injury. Neuropsychologia. 1995;33:797–813. doi: 10.1016/0028-3932(95)00029-3. [DOI] [PubMed] [Google Scholar]
- Wilhelm CJ, Mitchell SH. Rats bred for high alcohol drinking are more sensitive to delayed and probabilistic outcomes. Genes Brain Behav. 2008;7:705–713. doi: 10.1111/j.1601-183X.2008.00406.x. [DOI] [PMC free article] [PubMed] [Google Scholar]
- Wilhelm CJ, Reeves JM, Phillips TJ, Mitchell SH. Mouse lines selected for alcohol consumption differ on certain measures of impulsivity. Alcohol Clin Exp Res. 2007;31:1839–1845. doi: 10.1111/j.1530-0277.2007.00508.x. [DOI] [PubMed] [Google Scholar]
- Winstanley CA, Dalley JW, Theobald DE, Robbins TW. Fractionating impulsivity: contrasting effects of central 5-HT depletion on different measures of impulsive behavior. Neuropsychopharmacology. 2004;29:1331–1343. doi: 10.1038/sj.npp.1300434. [DOI] [PubMed] [Google Scholar]
- de Wit H, Richards JB. Dual Determinants of Drug Use in Humans: Reward and Impulsivity in Motivational Factors in the Etiology of Drug Abuse. University of Nebraska Press; Lincoln, NE: 2004. [PubMed] [Google Scholar]