Summary
The ring-opening reaction of a trifluorinated indolylfulgide has been studied as a function of temperature and optical pre-excitation where it was found that reaction times decreased as temperature increased from 10.3 ps at 12 °C to 7.6 ps at 60 °C. Simultaneously, the quantum yields for the ring-opening reaction grew from 3.1% (12 °C) to 5.0% (60 °C). When the reaction was started from a nonequilibrium state generated by a directly preceding ring-closure process, the ring-opening reaction became faster and the quantum efficiency increased by more than a factor of three. Analysis of the experimental results points to mode-specific photochemistry in that the promoting, photochemically active modes of the photoreaction are efficiently excited by the directly preceding ring-closure reaction.
Introduction
One major objective of photochemistry is the control of reaction products by the variation of the actinic light. With the advent of femtochemistry1 in the 1980s and with the idea of coherent control2 important progress has been made. The different fundamental control schemes such as the Brumer-Shapiro3, 4 coherent control or the Tanner-Rice5, 6 pump-dump scheme have been combined with adaptive learning algorithms7, 8 to manipulate the yields of a number of photochemical reactions. Besides the control schemes, where electronic or vibrational coherences are involved, incoherent methods for the manipulation of photochemical reaction yields are employed. Variations in sample temperature may influence photochemical reaction yields and reaction dynamics, where barriers exist in the excited electronic state. However, the adjustment of thermal excess energy does not provide significant freedom to direct the reaction path. In contrast, the selective population of specific modes9 may help to control the reaction provided that vibrational relaxation in the excited electronic state is slower than the reaction times and that the specific modes couple to an individual reaction channel.
In this paper, we address the ring-opening reaction dynamics of a particular trifluorinated indolylfulgide for different preparations of its closed form. At first we study the reaction yield and the reaction dynamics for different temperatures of the sample and explain the observations by the existence of barriers in the excited electronic state. In a further set of experiments, we analyze the ring-opening reaction of fulgides, where the closed form has been prepared by a pre-excitation pulse preceding the ring-opening reaction by only a few picoseconds. In this way, the ring-opening reaction not only starts in a nonequilibrium vibrational distribution, but may also encounter the selective excitation of active modes involved in both, the ring-opening and ring-closure reaction. We will present a simplified theoretical description of the reaction and will show that only a vibrational distribution with a preferential population of active modes can provide an explanation for our experimental observations.
The trifluorinated indolylfulgide
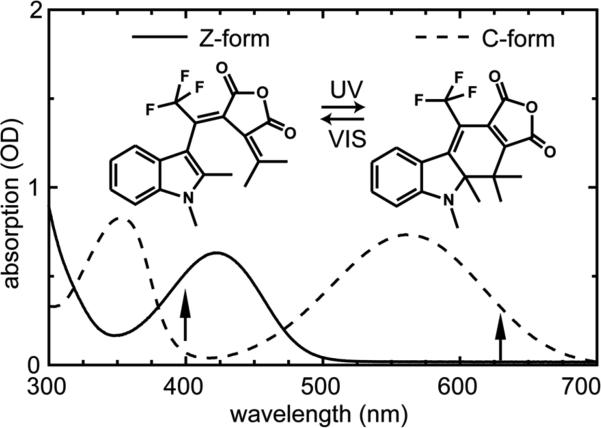
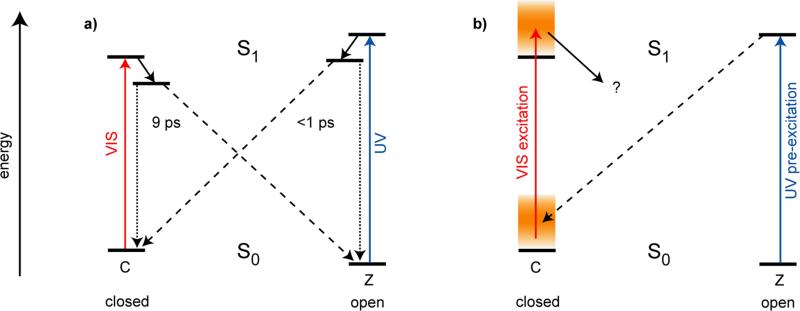
Fulgides10 are photochromic molecules, where structural substitutions can significantly alter a variety of important reaction parameters. The specific trifluorinated indolylfulgide11-13 discussed in this paper has the structure shown in Figure 1. In the open Z-form the long-wavelength absorption band peaks around 420 nm, while the closed C-form has an absorption maximum around 560 nm. Light with a wavelength above 500 nm selectively excites the C-form and can be used to produce the open Z-form. Excitation in the 420 nm band of the Z-form may lead to the ring-closure reaction or to a very small extent (< 1%) to Z/E-isomerization around the central double bond.14 The E-form has an absorption spectrum similar to the Z-form without absorption in the visible (λ > 500 nm) spectral range. Since we will study in this paper an experiment where the ring-opening reaction is started via pumping in the visible spectral range, the existence of the E-form can safely be neglected. Both the Z- and C-forms are thermally stable and are only converted into each other after optical excitation. Further details of the optical parameters relating to the experiments described here are given in supplementary information. A model of the reaction dynamics for a bromoindolylfulgimide15, 16 has been derived and is adapted here for the trifluorinated fulgide (Figure 2a): (i) Ring-opening reaction: Excitation of the closed form by visible light populates the Franck-Condon state. From hereon a first excited state reaction occurs on the time scale of 200 fs. This process is related to wave packet motion, vibrational rearrangements and solvation processes. The excited electronic state is left on the time scale of 9 ps. This process is related to the reformation of the electronic ground state of the closed form and to the ring-opening reaction with 3.7% quantum efficiency. On the same time scale, one observes transient absorption changes related to the cooling of the vibrationally hot molecules in the electronic ground state. (ii) Ring-closure reaction: When the open Z-form is excited by near ultraviolet light at 400 nm one observes S1 reaction dynamics and a formation of the ground state of fulgides in the open and the closed form with a time constant of about 0.3 ps and a quantum yield of about 15%.17 Subsequently there are strong absorption dynamics on the 10 ps time scale. The spectral signatures related to these transients indicate that they are connected to the redistribution of vibrational excess energy of both the newly generated C-form and the reconstituted Z-form. Time-resolved fluorescence measurements point to a very rapid decay of the fluorescing state. Time-resolved absorption experiments in the infrared spectral range also show the appearance of the closed fulgide (C-form) within less than 1 ps. An additional transient IR signal may point to the presence of another transient species on the 10-15 ps time scale. This signal may be generated by conformational changes and relaxation to different enantiomers of the Z-form.18 But nevertheless these species do not absorb in the visible spectral range, where the following excitation pulse is applied. Therefore the ring-opening reaction from the nonequilibrium state is totally unaffected by this behavior.
Figure 1.
Structures of the two photoisomers (Z- and C-form) of the investigated trifluorinated indolylfulgide and corresponding steady-state absorption spectra. The excitation wavelengths of the time-resolved measurements are indicated by arrows.
Figure 2.
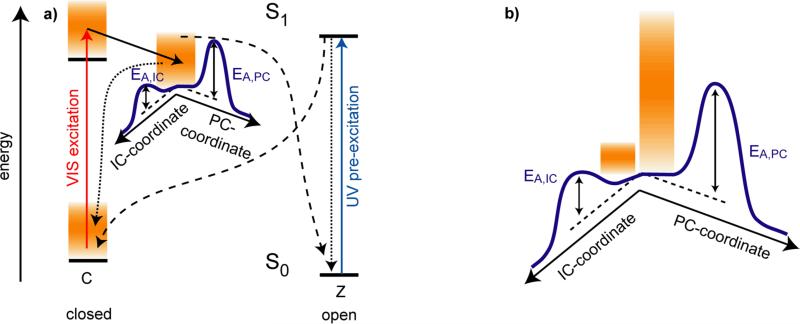
Model of the reaction dynamics for the trifluorinated indolylfulgide. a) Ring-opening and ring-closure reaction. Excitation of the closed form by visible light populates the Franck-Condon state. From hereon a first excited state reaction occurs on the time scale of 200 fs. The excited electronic state is left on a timescale of 9 ps. This process is related to the reformation of the electronic ground state of the closed form and to the ring-opening reaction to the open Z-form. When the open Z-form is excited by near ultraviolet light at 400 nm one observes S1 reaction dynamics and a fast formation of the ground state of indolylfulgides in the open and the closed form on a < 1 ps timescale. b) Ring-opening reaction starting from a vibrational excess population produced by a preceding ring-closure reaction. Here the excess population produced in a UV pre-excitation process may be transferred by a second visible excitation pulse to the excited electronic state where it may influence further reaction dynamics.
The fast dynamical processes observed during the photochemical reactions of fulgide molecules allow one to perform a new type of experiment13 where one can study the ring-opening reaction starting from different vibrational excess populations. The principles of the corresponding three-pulse experiment are explained in Figure 2b where one starts with a sample containing predominantly (98%) open Z-form of the fulgide. Illumination with an intense ultraviolet pulse around 400 nm (the pre-excitation pulse) populates the C-form with a quantum efficiency of about 15% within 1 ps. At this time a considerable fraction of the photon energy is still confined in the vibrational modes of the closed fulgide molecules. Initially this excess energy will not be in a thermal distribution; moreover it will preferentially be stored in vibrational modes connected to the ring-closure reaction. After a period of a few picoseconds, vibrational relaxation will redistribute the vibrational excess energy over the other degrees of freedom leading to a thermalized (hot) vibrational distribution. Subsequently, this hot distribution will cool down by heat transfer to the surroundings on the time scale of 10 ps. When a second pulse with a longer wavelength (λ > 500 nm, the excitation pulse) hits the sample shortly after the pre-excitation pulse at a delay time Δt1, it will excite the C-form in the specific vibrational population present at that time. This specific, nonequilibrium vibrational distribution will be transferred to the excited electronic state of the C-form from where the ring-opening reaction occurs. The subsequent reaction dynamics and the related absorption changes can be probed by a third pulse at a time Δt2 after the second excitation pulse. By varying the two delay times Δt1 and Δt2 one obtains information on the ring-opening dynamics influenced by the different vibrational excitations. The delay time Δt1 should be long enough to allow the termination of the ring-closure reaction (Δt1 > 1 ps) and should extend until the end of the vibrational redistribution times. For polyatomic molecules with a size similar to fulgides, intramolecular vibrational redistribution occurs in the range of a few picoseconds19, 20 and heat transfer to the surrounding solvent occurs on the time scale of 10 ps.21, 22 Therefore, a time range for Δt1 between 2 and 50 ps is used which allows access to different vibrational populations of the C-isomer ground state.
Experimental Section
The trifluorinated indolylfulgide (Figure 1) was synthesized as previously described.12 For the different experiments the two photostationary states PSS-435 and PSS-570 of the trifluorinated indolylfulgide dissolved in 1,4-dioxane (Uvasol from Merck, without further purification) were used. To investigate the ring-opening reaction, the sample in the PSS-435 (concentrations of the different isomers, C:Z:E = 95:3:2)23 was prepared by illumination with an Hg(Xe) lamp (Hamamatsu, 8251) and color glass filters GG 400 (thickness 3 mm) and BG 3 (1 mm) (ITOS). For the three-pulse experiment, the sample was continuously illuminated by a cold light source filtered by a color glass OG 570 (3 mm, ITOS) (PSS-570, C:Z:E = 0:98:2). For the determination of reaction quantum efficiency, previously described techniques were used.24 Here ring-opening from a PSS-435 sample with an optical density of OD 1 for 1 cm at 532 nm was induced by a frequency-doubled Nd:YAG cw-laser (1 mW, 532 nm). Illumination power was measured by a power meter (fieldmaster, detector LM-2 VIS, Coherent). Sample temperature was stabilized with a precision of ±1 K. Steady-state absorption spectra were measured with a spectrophotometer (Perkin Elmer, Lambda19).
For the time-resolved measurements, a custom built Ti:Sa laser system25, 26 working at a 1-kHz repetition rate was used. The laser fundamental (800 nm, 90 fs, 550 μJ) was split into three parts for the generation of pre-excitation, excitation and probe pulses. The pre-excitation pulse at 400 nm was obtained by second harmonic generation in a 0.5 mm β-BaB2O4 crystal. The second harmonic pulse was chirped in a 25 cm long rod of fused silica to increase the pulse duration to 300 fs to prevent multi-photon processes. The pre-excitation pulse energy was adjusted by neutral density filters (Edmund Optics GmbH) to 1.5 μJ. The excitation pulse was generated in a NOPA27, 28 tuned to 630 nm (200 nJ, fwhm: 25 nm) and stretched to about 100 fs in a quartz prism compressor setup. The probe pulse was obtained via continuum generation by focusing a small fraction (about 2 μJ) of the fundamental light into a 2 mm sapphire plate. The sample (concentration adjusted to yield an absorption of the sample at 400 nm of OD 3, temperature 29°C) was pumped through a fused silica flow cell (optical path length 200 μm) and was completely exchanged between consecutive laser pulses by a peristaltic pump. Pre-excitation (s polarization), excitation (p polarization) and probe pulses (p polarization) were spatially overlapped in the sample. The relative delay between the pulses was controlled via mechanical delay stages. Changes in optical transmission of the sample due to the excitation pulses were detected via the probe pulse, spectrally resolved in a grating spectrometer and detected by a photo-diode array.29 Each data point represents the average over about 15,000 probe processes. To be able to compare traces recorded for different delay times Δt1 the transient data were normalized to the concentration of excited C-form molecules.
For the measurement of the temperature dependence of the ring-opening reaction dynamics, the pre-excitation pulse at 400 nm was blocked and the absorption changes induced by the 630 nm excitation pulse for a sample in PSS-435 (high concentration of the C-form) was recorded.
Results
In Table 1 we present results on the temperature dependence of the ring-opening reaction of the trifluorinated indolylfulgide dissolved in 1,4-dioxane. The quantum efficiency QYS1(T) increases with temperature T from 3.1% (12 °C) to 5.0% (60 °C). This observation points to an activated process during the photochemical ring-opening reaction. Additional information on the product formation process is obtained when the decay of the excited electronic state, which is related to photoproduct formation and internal conversion, is investigated as a function of temperature by time-resolved spectroscopy. With excitation pulses at 630 nm and a solution at PSS-435, the closed C-isomer is excited exclusively. In the experiment we find an acceleration of the decay of the excited state (time constant τS1(T)) with temperature from 10.3 ps at 12 °C to 7.6 ps at 60 °C. These temperature dependencies will be used below to determine the activation parameters for the photoreaction.
Table 1.
Characteristic data of the ring-opening reaction derived from temperature-dependent experiments.
| Temperature T (°C) | Reaction time τS1 (ps) | Quantum efficiency QYS1(T) | Reactive rate constant kPC(T) (ps−1) | Nonreactive rate constant kIC(T) (ps−1) |
|---|---|---|---|---|
| 12 | 10.3 | 0.031 | 0.0030 | 0.0945 |
| 36 | 8.7 | 0.040 | 0.0046 | 0.1110 |
| 60 | 7.6 | 0.050 | 0.0065 | 0.1244 |
The experiments described above investigated a thermalized electronic ground state of the closed C-isomer. Data on the ring-opening dynamics starting from a vibrational nonequilibrium state formed by a pre-excitation process will be shown next. The experiment will use the three-pulse scheme outlined above and in Figure 2b. An ultrafast ring-closure reaction initiated by the (UV) pre-excitation pulse illuminating the photo-stationary state PSS-570 produces C-isomer molecules with vibrational excess energy in the electronic ground state. The delay time Δt1 between the pre-excitation pulse starting the ring-closure reaction and the visible excitation pulse used to initiate the ring-opening process determines the vibrational nonequilibrium population.
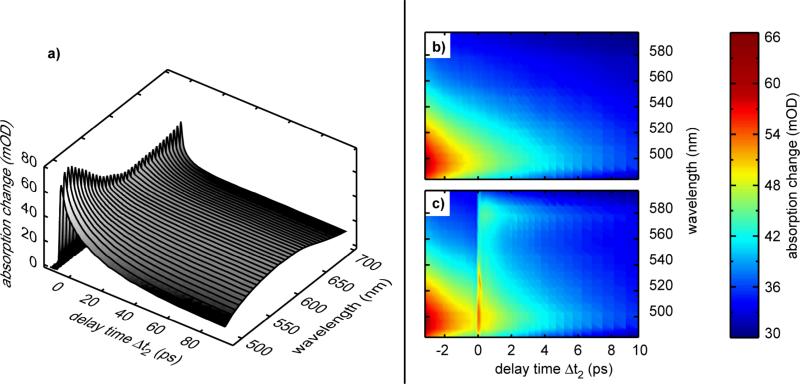
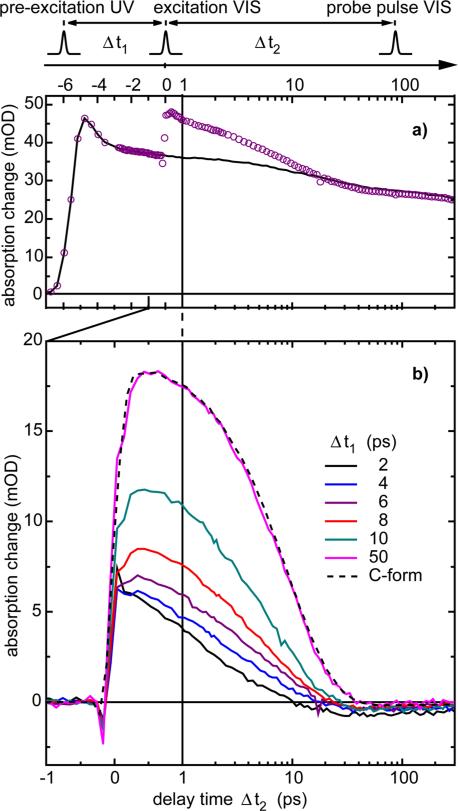
An overview of the experimental results of the three-pulse experiment is given in Figure 3. The left part (Figure 3a), shows the absorption changes related to the ring-closure reaction induced by the pre-excitation pulse (applied at a delay time of -6 ps) and recorded as a function of time (note that we do not apply the second excitation pulse in this specific experiment). One observes very fast initial reaction dynamics on the < 1 ps time scale which are related to the ring-closure reaction (see also Figures A and B in supplementary information) and slower transient changes connected to the vibrational redistribution and cooling of the newly formed C-isomer, and to orientational motions. At longer delay times (50 ps), the difference spectrum reaches a shape matching the steady-state absorption difference spectrum of the Z to C ring-closure reaction. In Figure 3b we present for comparison an enlarged part of the data from Figure 3a. The absorption data for the same time and wavelength range obtained in the three-pulse experiment with the additional visible excitation pulse at 630 nm are shown in Figure 3c. At the time of the second excitation process, pronounced additional absorption changes are seen. Besides very rapid transients around Δt2 = 0, which may be assigned to excited state motions or to a coherent artifact, we see a pronounced additional signal that persists for several picoseconds. The time dependence of this additional signal induced by the second excitation pulse is well seen in Figure 4a (open circles) where we have plotted the absorption change at the probing wavelength 580 nm. We know from standard pump-probe experiments on the ring-opening reaction that at this specific probing wavelength the excited state absorption signal is large and vibrational cooling of the hot C-isomer leads only to small signal amplitudes. Moreover, the ground-states of the Z-isomer do not absorb here.30 The time dependence displays the following features: (i) pre-excitation pulse-only (solid line): when the pre-excitation pulse excites the sample (Δt2 = -6 ps) a rapid absorption increase due to the formation of the excited electronic state is induced. Subsequently, within about 1 ps this absorption decreases. In this time the photoreaction is completed. The absorption transients at later times are due to vibrational and orientational relaxation. (ii) Three-pulse data: After the pre-excitation pulse (Δt2 = -6 ps) the second excitation pulse is applied at Δt2 = 0 and one finds the following absorption changes (open circles): for Δt2 < 0 the signal behaves in the same way as in the pre-excitation pulse-only experiment. At Δt2 = 0 (the arrival time of the excitation pulse), an additional increase in absorption is found, which subsequently on the time scale of 10 ps decays and approaches the signal of the pre-excitation pulse-only experiment. At Δt2 > 20 ps the signal of the three-pulse data is below the black curve indicating that a certain amount of the closed isomer is converted to the ring-opened state.
Figure 3.
Overview of the experimental results of the three-pulse experiment. a) Absorption changes related to the ring-closure reaction induced by the pre-excitation pulse alone recorded as a function of time. b) Enlarged part of Figure 3a. c) Absorption changes of the same region recorded for a situation with pre-excitation (Δt2 = -6 ps) followed by an excitation pulse.
Figure 4.
Dynamics of the ring-opening reaction after pre-excitation probed at 580 nm. On top the pulse sequence and the corresponding delay times are illustrated. The time scale is linear up to Δt2 = 1 ps and logarithmic afterwards. a) Absorption change induced by the pre-excitation pulse only (black solid line) and pre-excitation pulse with subsequent (Δt1 = 6 ps) excitation pulse (violet open circles). b) Difference signals, (three-pulse data minus pre-excitation only data) for different delay times Δt1 (see legend). The black dashed curve displays the standard pump-probe absorption change of the ring-opening reaction of a trifluorinated indolylfulgide sample in PSS-435 (amplitude scaled).
The transients induced by the second excitation pulse may be seen in more detail when the difference between the pre-excitation pulse-only and the three-pulse traces is calculated. In Figure 4b we have plotted these differences for different values of Δt1. When we use a long delay time between the pre-excitation pulse and the excitation pulse (Δt1 = 50 ps), we find a transient signal, which has a very similar shape to that seen in the standard pump-probe experiment (dashed line) performed on the C-isomer at PSS-435. This implies that after 50 ps at the latest no effect due to the pre-excitation pulse is left. The decay of the signal on the time scale of a few picoseconds is mainly determined by the decay of the excited electronic state due to the formation of the product and due to internal conversion. The signal can be modeled by an exponential function with a time constant of 9 ps. When the time delay (Δt1) is reduced, the peak of the absorption increase drops and the decay of the signal is accelerated. The fastest transients are observed at very short delay times (Δt1 = 2 - 6 ps), where a strongly nonexponential shape with an ultrafast initial decay of the signal in the range of a few picoseconds is found.
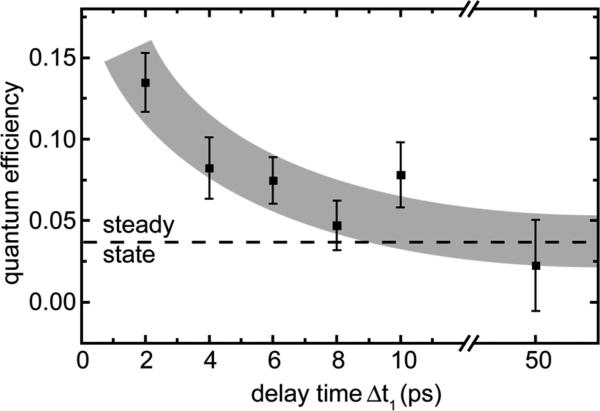
Besides the changes in the reaction speed, the data in Figure 4b display another important feature: The negative offset in absorption at late delay times is associated with the loss in absorption due to the disappearance of the closed form of the fulgide by forming the reaction product, i.e. the Z-form. This amplitude is directly related to the efficiency (QYS1(T)) of the ring-opening reaction. While this amplitude and the related quantum efficiency is small for large values of Δt1 (and for experiments on the thermally relaxed C-form) the offset strongly increases when the second excitation pulse directly follows the pre-excitation pulse. In order to quantify the offset, we average the absorption changes measured between Δt2 = 60 ps and Δt2 = 150 ps. The absolute values for the quantum efficiency as a function of Δt1 were calculated by using the ring-opening reaction of cold C-form molecules as a reference where QYS1 is given by the steady state value of 3.7%. QYS1 is plotted in Figure 5 as a function of Δt1. We find that QYS1 increases by nearly a factor of 4 when approaching short values of Δt1. For the shortest delay time (Δt1 = 2 ps) we find an increase in the quantum efficiency to 13.5% while in the steady-state experiment a value of 3.7% was found.
Figure 5.
Quantum efficiency of the ring-opening reaction from the three-pulse experiment plotted as a function of delay time Δt1 between pre-excitation pulse and excitation pulse.
Discussion
The experimental results for the ring-opening reaction can be summarized as follows: (i) The reaction dynamics and the reaction yield depend on the sample temperature. After excitation of the closed form of the trifluorinated indolylfulgide in its long wavelength absorption band, the quantum yield for the ring-opening reaction and the decay rate of the S1 state is increased with rising temperature. (ii) Upon pre-excitation of the trifluorinated indolylfulgide when vibrationally excited closed form molecules are formed, one observes an accelerated nonexponential decay of the excited electronic state combined with a nearly fourfold increase in quantum efficiency.
Temperature dependent reaction dynamics
At first the temperature dependence of the ring-opening reaction is used to obtain information about the reaction of the excited electronic state of the closed form. In the framework of a rate equation model with energy barriers, the different temperature dependencies of the quantum yield (QYS1(T)) and of the excited state decay time (τS1(T)) imply that at least two reaction paths exist. The corresponding microscopic rate constants kIC(T) and kPC(T) (Table 1) account for internal conversion and photochemistry (ring-opening) and the two decay channels should have different activation energies EA,IC and EA,PC respectively (see Figure 7). The total S1 decay rate constant kS1(T) is determined by the sum of both microscopic rate constants:
| (1) |
The quantum yield QYS1(T) for product formation is small (< 5%) and has a stronger temperature dependence than the decay time τS1(T) of the excited electronic state. Therefore product formation cannot dominate the decay of the excited electronic state. The weaker temperature dependence of the time constant τS1(T) suggests that internal conversion occurs essentially via the reaction path with the lower energy barrier EA,IC. The second reaction path, which has a higher energy barrier EA,PC determines the rate of the photochemical reaction into the ring-opened form and the quantum efficiency QYS1(T).
Figure 7.
Reaction scheme for the ring-opening reaction starting from a vibrational excess population produced by a preceding ring-closure reaction. Here the excess population produced in a UV pre-excitation process may be transferred by a second visible excitation pulse to the excited electronic state, where it may influence further reaction dynamics. a) Situation for model 1 where the same effective temperature is assumed for all vibrational modes. b) Enlarged detail of the two energy barriers in the excited electronic state for model 3. Here the modes coupling to internal conversion and photochemistry, respectively, have different effective temperatures and allow accelerated reaction in the ring-opening path.
However, one may not exclude that channel PC also leads to internal conversion to the ground state of the closed form. This branching will be considered by introducing an efficiency η for product formation in channel PC. Under these conditions one can calculate the quantum efficiency QYS1(T) as follows:
| (2) |
| (3) |
For specific values of the branching η, one obtains the individual rate constants kIC(T) and kPC(T) from the experimental quantities τS1(T) and QYS1(T). An Arrhenius-type analysis of the rates allows one to then calculate the individual activation energies and pre-exponential factors using Equations (1)-(4).
| (4) |
A self-consistent treatment of the pre-excitation induced reaction dynamics yields limits for the possible range of η: 0.3 < η < 1. The essential results of the discussion presented below do not depend critically on the specific value of η. In the following discussion we will only consider η = 1. The analysis yields an energy barrier EA,IC for the internal conversion path of 375 cm-1 and the energy barrier EA,PC of the photochemical channel is 1055 cm-1. The pre-exponential factors AIC and APC are similar, AIC ≈ APC ≈ 0.63 ps-1.
This analysis indicates that two different reaction channels exist in the excited electronic state of the closed isomer. One channel with a relatively small barrier and small pre-exponential factor appears to lead exclusively back to the ground state of the C-form. The barrier of the other path is rather high and allows access to the open form of the indolylfulgide. It should be mentioned that recent quantum chemical calculations of the S1 state of the indolylfulgide have found two accessible conical intersections: a first one leading exclusively back to the C-isomer and another one giving access also to the open form. This calculation is in good agreement with the experimental observations and interpretations given above.
Reactions from a nonequilibrium vibrational distribution
The experimental results obtained in the pre-excitation experiment will be analyzed by using different models for the vibrational relaxation dynamics. In all models we assume that the nonequilibrium population generated by the pre-excitation pulse and the subsequent ring-closure reaction is transferred by the excitation pulse at 630 nm to the excited electronic S1 state of the C-isomer. From there on, the further reaction follows the two activated channels IC and PC as discussed above. In the modeling we also assume that excess energy supplied by the pre-excitation pulse is stored in the vibrational system. For simplicity we describe the vibrational excess excitation by an effective temperature. We are aware of the fact that such a thermalization may take picoseconds. Nevertheless, we will use it here as a first and very simplifying approximation which allows us to obtain qualitative results. In order to pay attention to incomplete redistribution of excess energy, different situations will be discussed below, and we will consider that different effective temperatures Ti(t) for different groups of vibrational modes may exist in the molecule. In all discussed cases we assume that the effective temperatures (Ti(t)) of the vibrational system decay exponentially from the starting temperatures (Tstart,i) generated by the pre-excitation pulse with time constants τcool,i before finally reaching room temperature (Tend).
| (5) |
This cooling is related to heat transfer to other degrees of freedom, which in the end, transfers the excess energy to the surrounding solvent.
Three models, which differ only in the way thermalization is treated, are shown schematically in Figure 7 and will be discussed below. We expect that different groups of vibrational modes may exist. Each one is assumed to have fast internal thermalization while exchange of energy with other groups occurs only on a much longer time scale. In the simulations, the absorption change is derived from the populations Nr(t) of the involved states, r = Z, C, S1, applying the normalized change in extinction coefficients ΔεZ = 0, ΔεC = 1 and ΔεS1 = 5.3 obtained from time-resolved data of the ring-opening reaction at the detection wavelength 580 nm. We assume that after the pre-excitation pulse the effective temperatures Ti(t) of the vibrational modes in the molecules evolve according to Equation (5). After the delay time Δt1, the excitation pulse transfers a number (ΔNr) of nonequilibrium C-form molecules with vibrational modes at effective temperatures Ti(t) to the S1 state. Subsequently, the time-dependent absorption change resulting from different populations (Nr(t)) of the states Z, C and S1 is simulated iteratively in steps of 10 fs. Here, ΔNr(t) is calculated from a rate equation system using Nr(t) and the microscopic rate constants ki(T(t)) determined by Equation 4 in each step. The calculated absorption changes are fitted by a global procedure to the absorption signal of the experimental data for all measured Δt1 and 0.4 ps < Δt2 < 100 ps to evaluate the free fitting parameters in the models described below.
Model 1
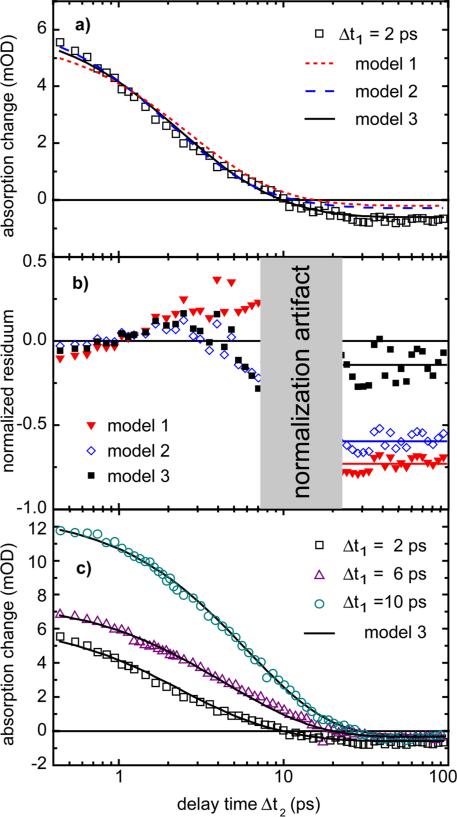
In this, the most simplistic model (Figure 7a), we assume that there is a quasi-instantaneous and complete redistribution and thermalization of the excess energy released upon light absorption and ring-closure reaction over all modes of the molecule. Furthermore, we expect that initially the photon energy is contained exclusively in the vibrational manifold of the molecule. Under these conditions we calculate31 the temperature rise induced by the pre-excitation pulse energy (hν = 3.1 eV) according to the Einstein model32 with the Boltzmann distribution using the vibrational frequencies of the molecule determined by a normal mode analysis using Gaussian98. In this case, the initial effective temperature reached after the ring-closure reaction is evaluated to be Tstart = 810 K. In model 1, where a fixed starting temperature is used, we fit the time course of the pump-probe data with one free parameter, namely the cooling time τcool, which results in τcool = 7.4 ps. The fitted time dependence is plotted in Figure 6a (dotted red line) and the normalized residuum (difference between the experimental data divided by the data) in Figure 6b for the shortest delay time Δt1 = 2 ps. From the plotted data, we find a qualitative similarity of fit with the experimental data but also two striking differences: the decay of the absorption change in the experimental data is steeper than in the simulated data, while the final offset related to the efficiency of the ring-opening process is too small by a factor of 3.5. Apparently a completely equilibrated vibrational system does not allow the indolylfulgide to efficiently overcome the high energy barrier in the active reaction branch. This finding is independent of the specific choice for the branching η introduced above.
Figure 6.
Comparison between the three models and the experimental data at a probing wavelength of 580 nm. a) Measured absorption change for Δt1 = 2 ps (squares) and simulated absorption change (lines). b) Normalized residuum between model curves and the experimental data. The lines at long delay times are a guide for the eye. c) Measured absorption changes for Δt1 = 2 ps, 6 ps and 10 ps (symbols) and simulated absorption changes (black lines) obtained for model 3.
Model 2
The most direct extension of reaction model 1 removes the restriction on the starting temperature by the use of two kinds of vibrational modes. We assume that the modes responsible for the activation of channels IC and PC have the same arbitrary starting temperature (Tstart), while another group of vibrational modes takes over the rest of the excess energy to maintain energy conservation. Model 2 therefore uses two fitting parameters; the starting temperature Tstart at the time of the pre-excitation pulse and the cooling time τcool of the modes. This model exhibits a better fit with the experimental time dependence of the absorption changes during the first picoseconds, (see Figure 6a and b). The resulting values are τcool = 5.4 ps and Tstart = 1160 K. However, the offset found at late delay times cannot be fitted satisfactorily. Thus, model 2 is also not able to reproduce the product formation efficiency observed in the experiment.
Model 3
In order to allow an increase in the efficiency of product formation as compared to internal conversion, we allow two different effective temperatures for the modes coupling to the two reaction channels, Tstart,PC and Tstart,IC (Figure 7b). In other words, we assume that three groups of vibrational modes exist in the trifluorinated indolylfulgide which are initially decoupled from each other: (i) The photochemical active modes with effective temperature TPC(t) which promote the motion in the direction of the ring-opening reaction, (ii) modes coupling essentially to the internal conversion to the ground state of the C-isomer (TIC(t)), and (iii) another group to take over the remaining excess energy released in the ring-closure reaction (see Figure 7). Fitting parameters in this model are the two starting temperatures Tstart,PC and Tstart,IC and the related cooling times τ cool,PC and τcool,IC. The fitting of the experimental data with this model yields a good agreement (for all delay times) between both the time dependence and the final offset (as illustrated exemplarily for Δt1 = 2 ps in Figure 6a and b, black line). For this model, the experimental data and simulation are plotted in Figure 6c for three delay times Δt1.
The global analysis using model 3 yields a high starting temperature of Tstart,PC = 2080 K for the photochemically active modes. For the modes related to internal conversion, Tstart,IC is close to room temperature, Tstart,IC = 410 K. The excess energy remains in the photochemically active modes for a few picoseconds. The high starting temperature of the photochemically active modes decays with the short time constant τcool,PC = 4.6 ps. In other words, only for a short time the pre-excited indolylfulgide molecules keep sufficient excitation of the active modes to undergo efficient photochemistry. After this period, the excess energy is transferred to other modes and mode-specific reactions are not observed. These results obtained from the fitting procedure are in full agreement with the direct observations shown in Figure 4b, where the absorption changes approach the shape of the trace recorded without pre-excitation after a few picoseconds.
The evaluation of the observations within the different simplifying models support the idea that the acceleration of the initial absorption transients together with the increase in efficiency of the ring-opening reaction (QYS1(T)) can only be explained if (i) different populations of vibrational modes occur during the preceding ring-closure process, (ii) the modes coupling to the ring-opening reaction are highly excited, and (iii) the relaxation out of these modes occurs within a 5 ps timeframe. A straightforward explanation for the preferential occupation of the photochemically active modes is that one may assume that the forward and backward reactions of a photochemical process (e.g. ring-opening versus ring-closure) essentially involve similar modes with motions going in opposite directions.
These promoting modes are low frequency modes because (i) the pre-exponential factor APC determined in the Arrhenius-type analysis of the temperature dependent experiments is small and points to frequencies in the range of several tens of wavenumbers, (ii) a normal mode analysis of the trifluorinated indolylfulgide using Gaussian98 suggests that indeed low frequency modes exist which may be involved in a ring-closure-like motion, and (iii) experiments on the ring-opening reaction show wave packet-like absorption changes with frequencies in the 50 cm-1 regime.
Conclusion
The ring-opening reaction of a trifluorinated indolylfulgide has been studied as a function of temperature and pre-excitation. With increasing temperature, reaction rates and quantum yields for the ring-opening reaction are increased. When the reaction starts from light generated nonequilibrium states, one finds that the pre-excitation process has a strong impact on the ring-opening reaction. When the delay time Δt1 between pre-excitation and excitation pulse is decreased, the ring-opening reaction is strongly accelerated and the quantum efficiency is increased by more than a factor of three. The simulation of the experiment points to mode-specific photochemistry whereby the promoting, photochemically active modes of the photoreaction are efficiently excited by a directly preceding ring-closure reaction. Their excitation starts at a high effective temperature of about 2000 K, but decays rapidly along a 5 ps timescale.
Supplementary Material
Acknowledgements
This work was supported by Deutsche Forschungsgemeinschaft through the DFG-Cluster of Excellence Munich–Centre for Advanced Photonics and the SFB 749. Financial support to W.J.L. from the NIH/NIGMS programs (S06GM008205 and SC3GM084752) is gratefully acknowledged. The authors thank B. Heinz, F. O. Koller, T. Cordes, A. Nenov and R. de Vivie-Riedle for helpful discussion.
References
- 1.Zewail AH. Angew. Chem. Int. Ed. 2000;39:2587–2631. [Google Scholar]
- 2.Brixner T, Gerber G. ChemPhysChem. 2003;4:418–438. doi: 10.1002/cphc.200200581. [DOI] [PubMed] [Google Scholar]
- 3.Brumer P, Shapiro M. Chem. Phys. Lett. 1986;126:541–546. [Google Scholar]
- 4.Shapiro M, Brumer P. J. Chem. Phys. 1986;84:4103–4104. [Google Scholar]
- 5.Tannor DJ, Kosloff R, Rice SA. J. Chem. Phys. 1986;85:5805–5820. [Google Scholar]
- 6.Tannor DJ, Rice SA. J. Chem. Phys. 1985;83:5013–5018. [Google Scholar]
- 7.Weinacht TC, Ahn J, Bucksbaum PH. Nature. 1999;397:233–235. [Google Scholar]
- 8.Herek JL, Wohlleben W, Cogdell RJ, Zeidler D, Motzkus M. Nature. 2002;417:533–535. doi: 10.1038/417533a. [DOI] [PubMed] [Google Scholar]
- 9.Becker RS, Dolan E, Balke DE. J. Chem. Phys. 1969;50:239–245. [Google Scholar]
- 10.Yokoyama Y. Chem. Rev. 2000;100:1717–1739. doi: 10.1021/cr980070c. [DOI] [PubMed] [Google Scholar]
- 11.Yokoyama Y, Takahashi K. Chem. Lett. 1996:1037–1038. [Google Scholar]
- 12.Thomas CJ, Wolak MA, Birge RR, Lees WJ. J. Org. Chem. 2001;66:1914–1918. doi: 10.1021/jo005722n. [DOI] [PubMed] [Google Scholar]
- 13.Malkmus S, Koller FO, Draxler S, Schrader TE, Schreier WJ, Brust T, DiGirolamo JA, Lees WJ, Zinth W, Braun M. Adv. Funct. Mater. 2007:3657–3662. [Google Scholar]
- 14.Wolak MA, Thomas CJ, Gillespie NB, Birge RR, Lees WJ. J. Org. Chem. 2003;68:319–326. doi: 10.1021/jo026374n. [DOI] [PubMed] [Google Scholar]
- 15.Draxler S, Brust T, Malkmus S, Koller FO, Heinz B, Laimgruber S, Schulz C, Dietrich S, Rück-Braun K, Zinth W, Braun M. J. Mol. Liq. 2008;141:130–136. [Google Scholar]
- 16.Heinz B, Malkmus S, Laimgruber S, Dietrich S, Schulz C, Rück-Braun K, Braun M, Zinth W, Gilch P. J. Am. Chem. Soc. 2007;129:8577–8584. doi: 10.1021/ja071396i. [DOI] [PubMed] [Google Scholar]
- 17.Cordes T, Herzog TT, Malkmus S, Draxler S, Brust T, DiGirolamo JA, Lees WJ, Braun M. Photochem. Photobiol. Sci. 2009 doi: 10.1039/b817627b. DOI: 10.1039/b817627b. [DOI] [PMC free article] [PubMed] [Google Scholar]
- 18.Yokoyama Y, Shimizu Y, Uchida S. J. Chem. Soc., Chem. Commun. 1995:785–786. [Google Scholar]
- 19.Kiba T, Sato S.-i., Akimoto S, Kasajima T, Yamazaki I. J. Photochem. Photobiol. A: Chem. 2006;178:201–207. [Google Scholar]
- 20.Baskin JS, Yu H-Z, Zewail AH. J. Phys. Chem. A. 2002;106:9837–9844. [Google Scholar]
- 21.Koller FO, Schreier WJ, Schrader TE, Sieg A, Malkmus S, Schulz C, Dietrich S, Rück-Braun K, Zinth W, Braun M. J. Phys. Chem. A. 2006;110:12769–12776. doi: 10.1021/jp0657787. [DOI] [PubMed] [Google Scholar]
- 22.Koller FO, Schreier WJ, Schrader TE, Malkmus S, Schulz C, Dietrich S, Rück-Braun K, Braun M. J. Phys. Chem. A. 2008;112:210–214. doi: 10.1021/jp073545p. [DOI] [PubMed] [Google Scholar]
- 23.Islamova NI, Chen X, Garcia SP, Guez G, Silva Y, Lees WJ. J. Photochem. Photobiol. A: Chem. 2008;195:228–234. doi: 10.1016/j.jphotochem.2008.05.007. [DOI] [PMC free article] [PubMed] [Google Scholar]
- 24.Cordes T, Weinrich D, Kempa S, Riesselmann K, Herre S, Hoppmann C, Rück-Braun K, Zinth W. Chem. Phys. Lett. 2006;428:167–173. [Google Scholar]
- 25.Brust T, Draxler S, Malkmus S, Schulz C, Zastrow M, Rück-Braun K, Zinth W, Braun M. J. Mol. Liq. 2008;141:137–139. [Google Scholar]
- 26.Malkmus S, Dürr R, Sobotta C, Pulvermacher H, Zinth W, Braun M. J. Phys. Chem. A. 2005;109:10488–10492. doi: 10.1021/jp054462g. [DOI] [PubMed] [Google Scholar]
- 27.Riedle E, Beutter M, Lochbrunner S, Piel J, Schenkl S, Spörlein S, Zinth W. Appl. Phys. B. 2000;71:457–465. [Google Scholar]
- 28.Wilhelm T, Piel J, Riedle E. Opt. Lett. 1997;22:1494–1496. doi: 10.1364/ol.22.001494. [DOI] [PubMed] [Google Scholar]
- 29.Seel M, Wildermuth E, Zinth W. Meas. Sci. Technol. 1997;8:449–452. [Google Scholar]
- 30.Malkmus S, Koller FO, Heinz B, Schreier WJ, Schrader TE, Zinth W, Schulz C, Dietrich S, Rück-Braun K, Braun M. Chem. Phys. Lett. 2006;417:266–271. doi: 10.1021/jp0657787. [DOI] [PubMed] [Google Scholar]
- 31.Hamm P, Ohline SM, Zinth W. J. Chem. Phys. 1997;106:519–529. [Google Scholar]
- 32.Adam G, Hittmair O. Wärmetheorie. Vieweg; Braunschweig: 1992. [Google Scholar]
Associated Data
This section collects any data citations, data availability statements, or supplementary materials included in this article.


