

Abstract
The mature nucleocapsid protein of HIV-1, NCp7, and the NC-domains in gag-precursors are attractive targets for anti-AIDS drug discovery. The stability of the 1:1 complex of NCp7 with a 20mer mimic of stem-loop 3 RNA (SL3, also called psi-RNA, in the packaging domain of genomic RNA) is strongly affected by changes in ionic strength. NC-domains recognize and specifically package genomic HIV-1 RNA, while electrostatic attractions and high concentrations of protein and RNA drive NCp7 to completely coat the RNA in the mature virion. The specific interactions from NCp7-binding to loop bases of SL3 produce 1:1 complexes in solutions that have [NaCl] at or above 0.2 M, while the electrostatic interactions can dominate at and below 0.15 M NaCl, leading to complexes that have mainly 1:2 RNA:protein. Persistent, non-equilibrium mixtures of 1:1 and protein-excess complexes can exist at these lower salt concentrations, where the distribution of complexes depends on the order of addition of RNA and protein. Adding salt causes rapid rearrangement of metastable multi-protein complexes to 1:1. The stability of complexes is also affected by the nature of the added salt, with 0.018 M MgCl2 and 0.200 M added NaCl producing the same Kd (21 ± 2 nM); acetate ion stabilizes the 1:1 complex by more than a factor of two compared to the same concentration of chloride ion. Maintaining a salt concentration of 0.2 M NaCl or 18 mM MgCl2 is sufficient for experiments to distinguish drug candidates that disrupt the specific SL3-NCp7 interactions in the 1:1 complex.
Keywords: RNA, HIV-1, nucleocapsid protein, fluorescence
The nucleocapsid protein of HIV-1 is an attractive anti-AIDS drug target. In addition to its role in packaging the RNA (1–4), it has chaperoning functions (5–6), helps refold the RNA dimer (7–9), and anneals the primer tRNA onto genomic RNA for reverse transcription (10–11). It also interacts with viral proteins including reverse transcriptase (12–13), and the accessory protein, Vpr, to play a role in stable integration of the proviral DNA in the chromosomes of infected cells (14). Drugs targeted at NC have the potential to interfere with critical functions at many stages of the viral infection cycle (6, 9, 11, 15–18).
In retroviruses similar to HIV-1 about 2,000 polyprotein precursors (gag and gag-pol) assemble at the inner membrane of the forming virion (19–21). Each of these proteins contains a nucleocapsid domain that is required for packaging genomic RNA into new virus particles. The 55 kD gag precursor polyprotein is later processed by the viral protease to structural proteins, including the mature NCp7 (20). NC-domains within gag precursors bind to the RNA with several RNA-NC interactions responsible for full discrimination of genomic from non-genomic RNA (22–27). Both sequence-specific and non-sequence-specific contacts contribute to the free energy of binding (22–30).
The NC domain of gag-precursor proteins and the mature NCp7 protein bind with high affinity to stem-loop 3 (SL3, also called the packaging or Ψ-loop) located at nt 312–325 in the 5′-untranslated region of genomic RNA (see Figure 1). Sequence-specific interactions are important in defining the structure of the SL3-NCp7 packaging complex (31). G318 stacks on W37, leading to nearly full quenching of the tryptophan fluorescence and straightforward analysis of binding isotherms (27, 31–35). The dissociation constant was reported as 28 ±6 nM in 0.2 M NaCl for the complex (32), revised here to Kd = 21 ±2 nM. Non-sequence-specific interactions, which are largely electrostatic, also contribute to affinity because of the high charges of the fully ionized species: −19 for the SL3 20mer and +9 for NCp7 (pNL4-3 strain; see legend to Figure 1).
Figure 1.

The mature NCp7 protein from the pNL4-3 strain (wild-type I1 has been replaced with M1 for efficient expression in E. coli). Residues carrying a charge are shown in filled letters (positive = capitals, negative = lower-case); at neutral pH, NCp7 from pNL4-3 carries a +9 net charge = +1 (N-terminus), +15 (R, K side chains), −4 (D, E side chains), +4 (Zn2+), −6 (cysteine thiolates), −1 (C-terminus). The inset shows the SL3 sequence; residues in lower case are not present in wild-type SL3.
The non-sequence-specific interaction dominates in the mature virion where there is roughly one NCp7 per seven to ten nucleotides. This interaction allows the RNA and protein to collapse to a chromatin-like density. The protein concentration is >10 mM in the mature nucleocapsid, so more than 95% of RNA 10mer segments would be bound by NCp7 even for sequences with a thousand-fold lower affinity than SL3.
It has been appreciated for more than 10 years that complexes of ~20mer oligonucleotides with NCp7 can have stoichiometries other than 1:1 RNA:protein (27, 32, 36–42). Our lab noted unusual effects in the reproducibility of SL3:NCp7 binding assays when [NaCl] ≤ 0.15M; we suggested that this was due to the presence of competing complexes with protein in excess (27). The current work was motivated by the need to distinguish conditions that cause the occurrence of R1P1 or R1P≥2 complexes, particularly as influenced by the nature and concentration of counterions, and to resolve disagreements in the literature regarding values for Kd of the 1:1 complex. In addition, we provide a firm basis for characterizing the properties of R1P1 complexes that provide the specificity of packaging genomic RNA.
We show that metastable, non-equilibrium mixtures of protein-excess complexes can be rearranged to specific R1P1 complexes by increasing ionic strength, and that the persistence of metastable complexes can be influenced by the order of addition of RNA and protein at low ionic strength. Also, the metastable complexes can be eliminated by replacing Na+ as the RNA counterion by Mg2+; 0.018 M Mg2+ added to the buffer used here produces the same Kd as 0.200 M added Na+. Other counterions are also explored. Lack of attention to these and other experimental details are shown to be a major source for disagreement among published Kd values.
EXPERIMENTAL PROCEDURES
NCp7 preparation
The 55 amino acid NCp7 was prepared and the concentrations estimated as described in previous work (27, 32). Protein stocks at 300 to 1,000 μM were stored for several months without degradation in a 25 mM acetate buffer, pH 5, with 10% glycerol, 10mM dithiothreitol, 0.05 mM EDTA, 25 mM NaCl, and 0.1 mM ZnCl2 at −80°C. “AddNA” assays with SL3 added to 0.3 μM NCp7 were repeated as a positive control each day before performing any other experiment (27, 32). NCp7 preparations were rejected if they failed to exhibit at least 95% quenching with a three-fold excess of the 20mer, SL3-GGUG, GGACUAGCGGUGGCUAGUCC, which has Kd = 10 nM (32).
SL3 RNA
SL3 was purchased from IDT DNA Technologies (Coralville, IA) and used without further purification. The RNA was heated to 95°C for 3 minutes, cooled on ice, and stored on ice prior to use.
Fluorescence buffer
The buffer for the fluorescence assays contained 5.0 mM sodium phosphate (Na1.38H1.62PO4; 5.0 mM NaH2PO4 was adjusted to pH 7.0 with NaOH), 0.10 mM ZnCl2, 0.01% poly(ethylene glycol), and one of the added salts: NaCl, KCl, NaC2H3O2, MgCl2, Na2SO4, or MgSO4, at concentrations specified in Figures 2–6. The ionic strength of each buffer is the contribution from the added salt plus 0.0091 M for sodium phosphate and ZnCl2; ionic strength contributions are beyond the fourth decimal place for SL3-RNA and NCp7 at sub-micromolar concentrations. In this paper the buffer with 0.200 M added NaCl is referred to as the μ = 0.209 M buffer, or by specifying only the nature and concentration of the added salt.
Figure 2.

Experimental AddNA assays where SL3 was added to NCp7. The binding isotherms are at progressively higher salt, bottom to top, with the long-dashed limit line representing infinitely high affinity for an R1P1 complex (Kd → 0). Diamonds, 0.200 M NaCl (fitted with Kd = 21 nM); filled circles, 0.300 M (Kd = 120 nM); squares, 0.400 M (Kd = 380 nM); triangles, 0.500 M (Kd = 840 nM); open circles 0.800 M (Kd = 2,600 nM). The total protein concentration, Pt = 0.30 μM.
Figure 6.

Dependence of NCp7-SL3 binding on ionic strength for six salts. Open symbols and light lines are for salts with monovalent ions: sodium chloride (AddPro), triangles; (AddNA, this work), diamonds, (AddNA, previously reported (27)) circles; potassium chloride (AddNA, this work, ×); sodium acetate (AddNA), squares. Salts containing divalent ions are shown with filled symbols and dark lines: magnesium chloride (AddNA), triangles, (the shorter dashed line was fitted to points with μ ≤ 0.129 M); magnesium sulfate (AddNA), diamonds; sodium sulfate (Add NA), circles. Best-fit lines for the monovalent ions had the following slopes and standard errors: NaCl −3.84 ± 0.15, KCl −4.16 ± 0.42 (line not shown), NaOAc −3.77 ± 0.22. The thin horizontal line links the MgCl2 and NaCl lines where both have Kd = 23 nM (at [NaCl] = 0.20 M, [MgCl2] = 0.018 M). The nomogram (upper right) helps to interpret the x-axis. It includes several μ values used in the experiments and their corresponding logarithms (μ includes the 0.009 M contribution from the invariant buffer components (sodium phosphate, zinc chloride)).
AddNA assay
Ideal AddNA assays for 1:1 complexes are shown in supplementary Figure S1 to illustrate the expected response for a variety of Kd values. Assays were performed by adding SL3 RNA (50 μM stock) in aliquots of 1.5–3 μL to 0.30 μM NCp7 in 2.00 mL of the fluorescence buffer in a 10×10 mm path length quartz fluorescence cuvette (NSG Precision Cells) along with an 8×1.5 mm stir bar. The fluorescence of the free NCp7 (i.e. the fraction of the protein not bound to SL3) was measured using a PTI QM-4/2003SE fluorometer at 349.9 nm emission using a 290 nm excitation, a 4 nm excitation band-pass and a 1.5–3 nm emission band-pass. The fluorescence titration curves obtained were fitted to a model assuming 1:1 stoichiometry for the ratio of NCp7 bound to SL3.
The titration curves were fitted to equation (1) as previously reported (32).
| (1) |
Pt and Rt are total protein and total SL3 concentrations respectively, I is the measured fluorescence intensity, I0 is the intensity when Rt = 0, I∞ is the intensity at saturation, and Kd is the dissociation constant. The equation was derived by using standard assumptions that I-I∞ is directly proportional to the free protein concentration, Pf, that Pt = Pf + Pbound, Rt = Rf + Rbound, and Kd = [Rf][Pf]/[R·P]. The data were fitted using the OriginPro 7.5 software package; Pt was fixed at 0.30 μM, I∞ was fixed at zero, and Kd was the only adjustable parameter. It was determined that there was no improvement in the fit by allowing I∞ to be an adjustable parameter. This is consistent with the >95% quenching standard for SL3-GGUG, described under NCp7 preparation, above.
AddPro assay
Ideal AddPro assays for 1:1 complexes at constant Rt = 0.3 μM are illustrated in Figure S2. Assays were performed by adding NCp7 (50 μM stock) in aliquots of 1.5–3 μL to 0.30 μM SL3 in 2.00 mL of the fluorescence buffer (0.010 to 0.800 M added NaCl), and fluorescence measured as for the AddNA assays, above. At NaCl concentrations lower than 0.15 M the starting concentrations of SL3 and NCp7 were diluted 4-fold to move the titration curves away from the 1:1 line.
Fitting details are similar to the AddNA titrations, except the data were fitted to equation (2).
| (2) |
The parameters are the same as in equation (1), except that m is the slope of plots when no interaction occurs or when no RNA is present, and I0 is the blank intensity. The data were fitted using OriginPro 7.5 with Rt fixed at the starting value (0.30 or 0.075 μM), and Kd and m as the adjustable parameters. Fitting was less reproducible if m was not an adjustable parameter.
Alternative counterions
AddNA assays were performed to assess the effect of K+, Mg2+, OAc− (acetate), and SO42− ions on the binding equilibria. Reagent grade crystals of NaCl, KCl, MgCl2, Na2SO4, and MgSO4 were used. Standardized solutions of NaOH were mixed with standardized acetic acid to achieve accurate concentrations of NaOAc as the salt is strongly deliquescent (1.000 M solutions of NaOH and HOAc were purchased from Sigma-Aldrich, and 2.000 M solutions from Ricca Chemical Co.).
RESULTS
Validation of AddPro assays
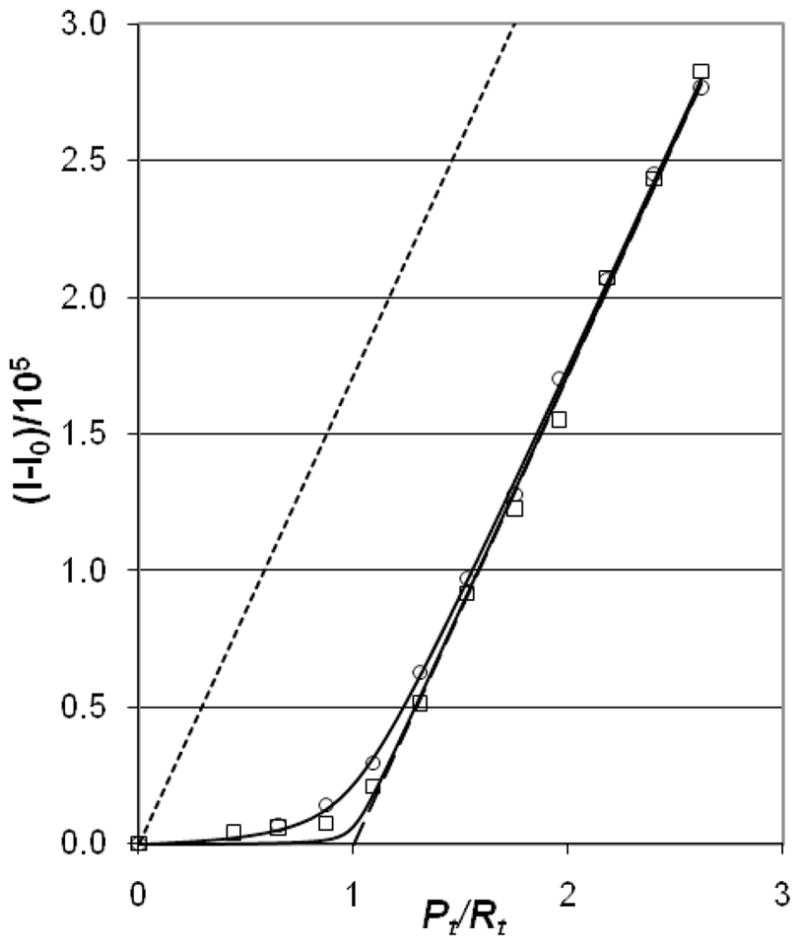
Prior to the use of AddPro assays, their usefulness should be validated with respect to traditional AddNA titrations. Figures 2 and 3 compare AddNA and AddPro under conditions where the AddNA data signify the formation of a 1:1 complex between SL3-RNA and NCp7 (27, 32). In both Figures the points that lie nearest the long-dashed 1:1 line are for complexes that have the highest affinity (lowest salt), with isotherms rising progressively higher as salt concentration increases (the long-dashed line denotes a complex where the binding constant (1/Kd) approaches infinity). In the AddNA assays the total RNA concentration, Rt, increases from left to right along the horizontal axis; Rt/Pt is the mole ratio of total RNA over total protein, and Pt = 0.30 μM is held constant. AddPro assays have Pt, increasing from left to right, holding Rt constant at 0.30 μM and again varying [NaCl]. As salt concentration increases above 0.2 M, the affinity decreases as expected for the association of the highly charged protein and RNA. The legends to Figs. 2 and 3 give the best-fit Kd values for these particular datasets; the agreement between the two assays is excellent at [NaCl] = 0.2 and 0.3 M, but the Kd values agree less well at higher salt. As can be seen from Fig. 3, AddPro assays exhibit very little difference between the data points at [NaCl] ≥ 0.5 M and the “no binding” limit line (short dashes). Near this limit the fitting is very sensitive to small deviations in the experimental data. Thus, AddPro Kd values at high salt are less reproducible than for [NaCl] values near 0.2 M. It is also true that the fits for AddNA titrations at high salt are less reliable than those near 0.2 M salt as the fluorescence intensities at right end of the binding isotherms measured at high salt do not approach the limit, I∞, characteristic of an RNA-saturated 1:1 complex. The general result is that the AddPro assays give the same Kd values as AddNA assays within experimental error. Importantly, the order of addition of RNA and protein is irrelevant in the physiological range of salt concentration, consistent with 1:1 complex in rapid equilibrium with free RNA and protein.
Figure 3.

Experimental AddPro assays where NCp7 was added to SL3 (total RNA concentration, Rt = 0.30 μM). As in Fig. 2, isotherms at low salt appear near the bottom of the plot. I−I0 is the difference between the measured fluorescence and the fluorescence at Pt = 0. The symbols are defined as in Fig. 2 with the addition of open triangles, 0.150 M NaCl. Solid lines show isotherms fitted using Kd = 9 nM for 0.150 M NaCl, Kd = 25 nM for 0.200 M, Kd = 140 nM for 0.300 M, Kd = 1,120 nM for 0.500 M, 5,300 nM for 0.800 M. The limit lines represent Kd → 0 (long dashes) and Kd−1 → 0 (short dashes) for an R1P1 complex.
Order of addition of RNA and protein at low salt
The issues that occur at lower ionic strength in AddNA assays are illustrated in Figure 4. The data measured at 0.100 and 0.150 M [NaCl] (Fig. 4a) fall between the lines for complexes with stoichiometry of 1:1 (long dashes) and 1:2 (short dashes). This indicates that a persistent complex with an excess of protein over RNA (R1Pn>1) occurs in addition to R1P1 when RNA is added to protein at low salt. (As a reference, the upper data set (diamonds) shows the average of three replicate trials in 0.200 M added NaCl in the fluorescence buffer. These points all lie above the heavy-dashed line, as expected for 1:1 complexes, and the error bars are small.) Data at 0.050 M NaCl (Fig. S3) also fall between the 1:1 and 1:2 lines, but are not even reproducible from one day to the next. Adding 2.00 M NaCl solution to make the final [NaCl] = 0.200 M moves any of the data points below the 1:1 line to the 0.200 M titration curve at the corresponding Rt/Pt ratio (see Figure 4b); this change occurs within the few seconds required for addition and mixing.
Figure 4.
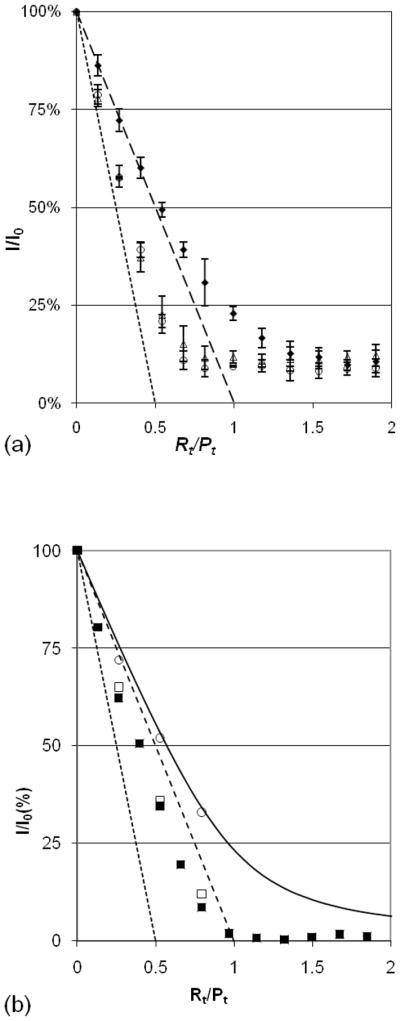
AddNA assays at low [NaCl] measured as in Fig. 2. The limit lines are for R1P1 (long dashes) and R1P2 (short dashes; this line intersects the x-axis at the mole ratio, Rt/Pt = 1/2). Solid diamonds show 0.200 M NaCl data in both panels. (a) The error bars indicate one standard deviation about the average of three replicates; open triangles, 0.150 M NaCl, open circles, 0.100 M. (b) Filled squares show data for a full titration at 0.050 M NaCl. Open squares show the endpoints of three titrations with identical spacing of the earlier points. At each endpoint, salt was increased to [NaCl] = 0.200 M and fluorescence increased to the values indicated by open circles, which fall near the solid line calculated for Kd = 21 nM.
By contrast, the AddPro assays for 0.150 M NaCl (open triangles in Fig. 3), and for 0.100 and 0.050 M NaCl (Fig. 5) all fall near the 1:1 line, but above it, consistent with 1:1 complexes having high affinity. Thus, when protein is added to RNA, R1Pn>1 complexes do not form in this range of salt concentrations, and equilibration is rapid. At very low salt concentrations (0.010 and 0.025 M NaCl) AddPro titrations also produce mixed R1P1 and R1Pn>1 complexes (Figure S4). Thus, the region of salt where persistent R1Pn>1 complexes can occur is [NaCl] < 0.200 M, at least in the sub-micromolar range of Rt and Pt employed in this work. That persistent R1Pn>1 complexes occur only in the AddNA titrations when [NaCl] is between 0.050–0.15 M is diagnostic of a non-equilibrium situation when RNA is added to protein. This, and the persistence of non-equilibrium mixtures of R1Pn>1, and R1P1 complexes at even lower salt concentrations, calls into doubt many previous determinations of affinity assumed to be for R1P1 complexes (see Discussion).
Figure 5.
AddPro assays for 0.100 M and 0.050 M [Na] at total RNA concentration, Rt = 0.075 μM); solid lines show isotherms fitted to the data. Open circles, 0.100 M NaCl (Kd = 1.4 nM), open squares, 0.050 M NaCl (Kd = 0.3 nM). Limit lines are as in Fig. 3. The starting NCp7 and SL3 concentrations were diluted 4-fold from those shown in Fig. 3. Without this dilution, titrations for 0.100 and 0.050 M NaCl proceed along the x-axis to the breakpoint at Pt/Rt = 1, and then follow the 1:1 line (data not shown).
Averages of replicate determinations of Kd for the 1:1 complex are reported in the first three columns of Table 1 at several concentrations of NaCl. Kd values at [NaCl] < 0.200 M are from AddPro assays, whereas values at [NaCl] > 0.300 M are from AddNA data. Kd values averaged in Table 1 for 0.100 and 0.050M NaCl are from AddPro measurements at Rt = 0.075 μM.
Table 1.
Kd values* upon varying [NaCl].
| NaCl] (M) | N | Kd(av) (nM) | Kd(slope) (nM) |
|---|---|---|---|
| 0.800 | 2 | 3800 | 4400 |
| 0.500 | 2 | 980 | 730 |
| 0.400 | 2 | 380 | 310 |
| 0.300 | 3 | 110 ±40 | 110 |
| 0.200 | 38 | 21 ±2 | 23 |
| 0.100 | 5 | 1.5 ±0.6 | 1.9 |
| 0.050 | 2 | 0.2 | 0.18 |
| 0.010 | -- | -- | 0.022 |
Dissociation constants, Kd(av), are averages of values of individual determinations at the indicated [NaCl] for the NCp7-SL3 complex, (standard deviations are shown for determinations with ≥3 replicates). The number of replicates is N; Kd(slope) was predicted from the plot in Figure 6. Trailing zeroes in Kd values are not significant digits. Kd values at [NaCl] < 0.200 M are from AddPro assays, whereas values at [NaCl] > 0.300 M are from AddNA data. Kd values averaged in Table 1 for 0.100 and 0.050M NaCl are from AddPro measurements at Rt = 0.075 μM. In addition to the indicated [NaCl] the buffer components add 0.0091 M to the ionic strength (see Experimental).
Global variation in ionic strength
The entire set of data used for determinations of Kd in NaCl, KCl, NaOAc, MgCl2, Na2SO4, and MgSO4 are encompassed in Figure 6. Individual titrations for the latter five salts are not shown, but Kd values were calculated exclusively from AddNA assays. Highest affinities of NCp7 for SL3 are at the top of the y-axis, and the highest salt concentrations are at the right of the x-axis. Contributions to the ionic strength for the salts used in this work are,
| (3) |
where C is the cation and A is the anion of the salt in question, and ZC and ZA are the charges on the respective ions. For the singly charged ions in NaCl, KCl, and NaOAc, μsalt equals the molar concentration. The total ionic strength, μ, is the sum of μsalt plus 0.009 M, which is the contribution to the ionic strength from the buffer components. Slopes of the best fit lines for each salt are given in the legend to Fig. 6.
The AddPro assays in NaCl give access to binding constants, (Kd)−1, that are nearly two orders of magnitude higher than can be surveyed using AddNA assays (data points at the top of Fig. 6). The whole collection of data points in NaCl include those measured in this work by AddPro (open triangles) and AddNA (open diamonds), and previously (27) by AddNA (open circles). The slopes of the best-fit lines provide a different sort of average from replicate measurements, now over all of the data for a given salt. There is good agreement between these two averages, reflecting the high quality of the measurements. The slopes can be used to predict Kd at any salt concentration. The predictions for NaCl are compared with the replicate averaged Kd values in the last column of Table 1. These averages compare reasonably well, especially at intermediate salt concentrations. A prediction of Kd = 22 pM for [NaCl] = 0.010 M is also included in the table. However, attempts to measure this value failed as the titrations were irreproducible from day to day in a manner reminiscent of the AddNA assays at low salt (see Figs. S3 and S4).
Nature of the salt
Plots of Kd as a function of ionic strength for the other salts are also shown in Fig. 6. The data for KCl (×) are found among the data points for NaCl, showing that no large change in the affinity of the complex occurred upon substituting K+ for Na+. However, substituting acetate ion (open squares) for chloride resulted in a substantial displacement from the NaCl line. As the two best-fit lines have nearly the same slope, it can be seen that the complex in OAc− has about half the Kd as it has in Cl−, i.e., acetate makes the complex about twice as stable at the same ionic strength (2.3 times more stable at μ = 0.209 M).
Substituting doubly charged ions for either Na+ or Cl− produces a substantial displacement of the best-fit lines in Fig. 6. Sulfate stabilizes the complex (filled circles) even more than OAc−, whereas replacing sodium with magnesium at the same ionic strength strongly destabilizes the complex (filled triangles). MgSO4 shows intermediate behavior (filled diamonds), with the destabilizing effect of Mg2+ dominating the stabilizing effect of SO42−. All of these data sets exhibit curvature about the best-fit straight lines. This is expected as deviations from ideal solutions are more severe for multiply charged ions, especially at higher ionic strengths. The dashed line in Fig. 6 was fitted to the MgCl2 data for ionic strengths at and below 0.129 M (40 mM added MgCl2). A thin horizontal line connects the dashed line to the best-fit line for NaCl at 0.200 M added NaCl. This equivalence in Kd occurs at 18 ±3 mM added MgCl2 (μ = 0.063 M including the buffer salts).
DISCUSSION
The stoichiometry and affinity of NCp7-SL3 complexes depend on the relative contributions of specific binding to the loop bases in SL3 RNA and ionic interactions that are not sequence-specific. The ionic contribution is most profoundly affected by the concentration and nature of added salts. Below 0.200 M NaCl, the order of addition of RNA and protein can lead to the formation of persistent, non-equilibrium (metastable) mixtures of R1Pn>1 and R1P1 complexes. Variation in the RNA or protein sequence, especially mutations that decrease the stability of the 1:1 complex, play a role in the distribution of complexes, as well (43). A better understanding of these effects, discussed in the next several paragraphs, explains much of the disagreement in reported Kd values for SL3-NCp7 interaction, (22, 27, 31–32, 36–38, 41–42, 44–45).
Effect of NaCl concentration
It is well-known that high salt concentrations suppress ionic interactions. Due to the high charges on fully ionized SL3 (−19) and NCp7 (+9; see legend to Fig. 1), ionic effects will contribute substantially to the stability of both specific R1P1 and non-specific R1Pn>1 complexes. The latter should be most dependent on salt concentration as more ionic interactions are neutralized in the complex. The charge on SL3 RNA is reduced by counterion condensation and the charges on both RNA and protein are screened by their respective counterion atmospheres. Condensation of sodium ions on SL3 in NaCl should reduce the net charge to −5 to −6 ((46); the range arises from assumptions regarding the loop phosphates). Of course, many counterions are released when a complex forms. For instance, six salt-bridge interactions were seen between SL3-phosphates and basic side-chains of NCp7 in the NMR structure (31). Other phosphates are buried in the electropositive binding surface of the protein, as well. Thus, the R1P1 complex is likely to retain a substantial net negative charge. A fully ionized R1P2 complex would have a charge of −1, which is very near electrical neutrality. Such a complex is likely to have low solubility and is a likely contributor to metastable mixtures. These concepts are borne out by the experiments summarized in Results.
Data presented in Figs. 2, 3 show that when [NaCl] ≥ 0.2M the specific R1P1 complex is formed. However, nonspecific binding (R1Pn>1 complexes) becomes significant in AddNA assays monitored by fluorescence at [NaCl] ≤ 0.15 M (see Figs. 4 and S3) and AddPro assays at [NaCl] < 0.05 M (see Fig. S4). Early points in AddNA titrations have very little RNA and a large excess of protein. This would favor the production of sparingly soluble R1Pn>1 complexes that may rearrange slowly upon further addition of RNA. Of course, low salt also favors unfolding of the RNA hairpin, and primarily electrostatic interaction with two or more proteins at non-sequence-specific binding sites. The appearance of R1Pn>1 complexes at [NaCl] < 0.05 M in AddPro titrations could be due to the high concentration of protein in the microliter droplets that are added to the RNA solution – R1Pn>1 complexes could form near the surface of droplets, and rearrange only slowly, thereafter.
As expected, the electrostatic attraction between RNA and protein produces a large increase in the affinity of the specific 1:1 complex upon decreasing the salt concentration. The binding constant, 1/Kd, changes by ~104 per factor of ten difference in salt concentration for NaCl, KCl, and NaOAc (see Table 1, Fig. 6).
A consequence of using SL3 in AddNA assays as a daily positive control is that a large number of replicates was available to reduce the standard deviation on the average Kd = 21 ±2 nM (N = 38). The new average value is somewhat lower than was reported earlier, 28 ± 6 nM (32), which was obtained from fewer determinations and using the solver function in Microsoft Excel. The nonlinear optimization routine in the Origin software is superior to that in Excel. Thus, we report Kd = 21 ±2 nM, as definitive in 0.200 M NaCl plus the μ = 0.009 M buffer for the sequences shown in Fig. 1.
Alternative counterions
Mg2+ ions are known to stabilize double helices more than Na+, which should disfavor two or more proteins binding to open the helical stem to form non-specific complexes. Also, divalent ions in the counterion atmosphere screen electrostatic interactions more effectively than monovalent ions. Our results showed that divalent Mg2+ ions shift the distribution of species away from R1Pn>1 complexes to form exclusively R1P1 complexes over the full range of ionic strengths examined for MgCl2 (0.05 to 0.3 M). We also noted with regard to Fig. 6 that adding 18 mM MgCl2 to the μ = 0.009 M buffer produced the same 1:1 binding affinity as adding 200 mM NaCl. There are situations, e.g., in NMR spectroscopy, where there is an advantage to use 18 mM MgCl2 in the buffer, and maintain equivalence to the affinity observed for nearly physiological salt concentrations, while disfavoring the formation of R1Pn>1 complexes (43).
Both acetate and sulfate ions increase the stability of R1P1 complexes over chloride, although the destabilization by Mg2+ is much larger in solutions at the same ionic strength. Perhaps OAc− and SO42− are better able to stabilize the protein in its binding conformation compared to Cl−. Although NC-bound SO42− should efficiently screen the ionic attraction between SL3 and NCp7, this destabilizing effect is apparently outweighed by the stabilizing influence that sulfate confers on the protein in the complex.
Stoichiometry
The stoichiometry of the complexes is an important issue. Figures 4. S1–S4 show that R1Pn>1 complexes or their mixtures with R1P1 can be easily distinguished from 1:1 complexes in the W37 fluorescence-based assays. R1P1, R1P2, and R1P3 complexes have been observed by mass spectrometry (MS) for SL3 in the presence of excess NCp7 (41). For the DNA octamer, [d(TG)]4, observations by surface plasmon resonance (SPR) and MS have shown that both D1P1, and D1P2 complexes form in interactions with NCp7 complexes; the affinity for the second protein is ~5 times less than in the formation of D1P1 as determined by SPR (42).
Diagnosing the presence of complexes with Rn>1P1 stoichiometries is problematic using the W37-fluorescence assays, where binding only the first high affinity RNA can completely quench the fluorescence. D2P1 complexes have been observed by SPR, where the affinity of NCp7 for the second [d(TG)]4 is ~300 times less than for the first; this much lower affinity D2P1 complex was not observed by mass spectrometry (MS) in the same report (42). Likewise, Rn>1P1 complexes were not observed by MS for SL3-NCp7 (41). Therefore, it is likely that excess-RNA complexes can be ignored in studies of the sequence-specific interactions of SL3 with NCp7 in 0.2 M NaCl or 18 mM MgCl2, and in the specific packaging of HIV-1 RNA by NC-domains of gag and gag-pol precursors.
Effects of non-ideality
Several cautions are worth noting with regard to effects on the complexes due to the nature and concentrations of salt, protein, and nucleic acid. (i) Deviations from ideal solution characteristics are large for charged molecules. For instance, at ionic strengths of 0.3 M the mean ionic activity coefficient, γ±, is near 0.7 for NaCl (47), KCl (48), and NaOAc (49); near 0.5 for MgCl2 (50) and Na2SO4 (51); and near 0.2 for MgSO4 (49). The practical significance is that each increment of added salt produces a smaller effect on Kd at higher salt concentrations than at lower concentrations. In plots such as in Fig. 6, this leads to curvature, with a higher slope at low salt concentrations. That is why we used data only at μ ≤ 0.129 M for MgCl2 (dashed line in Fig. 6), to find the [MgCl2] that produces Kd equivalent to that in 0.200 M added NaCl. (ii) Effects due to non-ideal solutions are most severe for highly charged species, so it should be expected that concentration-based equilibrium constants (as opposed to activity-based equilibria, which regulate the bound and free protein and nucleic acid species), will vary with concentration of the macromolecules. Non-ideality should exert a greater effect at higher concentrations of protein and nucleic acid. (iii) Experimental techniques for measuring Kd values are often limited to windows in concentration that do not overlap with each other. NMR concentrations are typically 300–3,000× that used in this work, isothermal titration calorimetry (ITC, 500×, (45)), and mass spectrometry (MS, 30–60×, (41)). Effects due to non-ideality could make it difficult to compare the results of experiments measured in these widely differing concentration ranges.
Sample integrity
Perhaps the greatest single caution regarding future work is the importance of positive controls on the integrity of preparations of SL3, and especially, NCp7 (see Experimental). The experience in our laboratory is that a stock solution of NCp7 may be frozen and thawed many times, but eventually undergoes a rapid collapse in its affinity for SL3. Thus, fluorescence-AddNA assays with SL3 in the μ = 0.209 M buffer + NaCl should be repeated each day before performing any other experiment. NCp7 degradation may be the most common source of Kd values reported in the literature that are substantially higher than the predictions in Fig. 6 for μ ≥ 0.2 M.
Comparison with published analyses of the SL3-NCp7 interaction
Including their own report, Hagan & Fabris (41) collected data from ten publications on the Kd and stoichiometry of SL3-NC complexes. More recently, R1Pn>1 complexes were observed at low [NaCl] using electron paramagnetic resonance (EPR), which changed to R1P1 at higher salt (44) in concordance with our results reported here. In these eleven studies the SL3-NC equilibrium was probed by seven methods in four different salt concentrations (see Table 1 in ref. (41)). The results differ widely. The leading cause of the variation is that eight studies were conducted at μ ≤ 0.05 M, where the present work has demonstrated the common occurrence of R1Pn>1 complexes and metastable mixtures of R1Pn>1 and R1P1 complexes. Other causes may include effects due to non-ideality or that some measurements may have been compromised by insufficient positive controls on the integrity of NCp7 and SL3. Also, several of the studies were conducted in unbuffered solutions or at pH values outside the buffering range of the salts added to the solutions, e.g., NaOAc at pH 6 to 8 (the effect of pH on SL3-NC stoichiometry and affinity has not been determined). We have discussed most of this work previously (27, 32), and now consider two studies further (41, 45).
In the first study, intensities of ions derived from SL3, NCp7, and their R1P1, R1P2, and R1P3 complexes were measured using electrospray ionization mass spectrometry (41). They reported Kd = 180 ±60 nM for the 1:1 complex in 0.15 M NaOAc (pH 7.5; no buffer or details of adjusting pH were specified). The dependence of Kd on [NaOAc] in Fig. 6 of the current work can be used to predict that Kd = 3 nM in a buffer that is equivalent to the salt conditions in reference (41). The authors suggested that quantification by MS is superior to methods that require curve fitting to determine Kd, such as W37-fluorescence assays. On the other hand, there is great confidence in the W37-assays because, (i) assays with SL3 and SL3-GGUG in the μ = 0.209 M buffer exhibit nearly 100% quenching of W37, consistent with an almost perfectly linear correlation between the fluorescence intensity and the free protein concentration, and (ii) the known 3D structure provides a clear mechanism for full quenching by stacking W37 on G318 of SL3. The 60-fold difference in Kd cannot be due to curve fitting errors. In fact, the Kd value measured by ESI MS came from curve fitting to a competition experiment with a variant of SL4, which was separately determined to have Kd = 1,300 ±500 nM (41). Examination of Fig. 3 in (41) shows that the data show only approximate agreement between the measured intensities and the fitted binding isotherm for the SL4 complex. Resorting to a competition assay is necessitated by the relative insensitivity of the method to directly assay high affinity complexes and their unbound components. Furthermore, it is an open question whether ionization efficiencies are sufficiently constant to accurately sample the equilibrium populations. Nevertheless, the MS work is clearly valuable due to its unequivocal demonstration of the presence of R1Pn≥1 complexes when Pt > Rt and the insignificance of Rn≥1P1 complexes in the SL3-NCp7 system.
In the second study, there is a 2,500-fold difference in the value of Kd = 170 nM measured by ITC (45) at μ = 0.05 M, and Kd = 0.07 nM extrapolated from Fig. 6. Although the Kd values of the MS (180 nM) and ITC experiments (170 nM) appear numerically close to each other, the agreement is fortuitous as the solutions differed in ionic strength by a factor of three. Using the slope of the NaOAc line in Fig. 6 shows that these Kd values actually differ from each other by 60-fold when corrected for ionic strength due to the small ions. Work in progress in our laboratory is aimed at reconciling differences between Kd measurements made by ITC, SPR, electrophoretic mobility shifts, and W37-fluorescence.
Implications for drug discovery
Beyond an interest to accurately define Kd and conditions for study of the 1:1 complex, the simple expedient of comparing affinities at 0.2 M NaCl or 18 mM MgCl2 is sufficient to suppress the non-sequence-specific interactions to the point that anti-NC agents can be found to interrupt the specific interactions (43, 52–53).
Implications for packaging specificity
In vitro measurements of NC interactions with RNA and DNA show that the interactions with unpaired bases are much stronger than with paired strands (35–36, 42, 54). Measuring the affinity for SS RNA is complicated because multiple NCp7 moieties can bind sequences that are longer than 5–6 unpaired nt (35–36, 42, 55). In previous work we have measured the Kd values of NCp7 for 35 of the 64 GNNN variants of the wild-type GGAG loop on the SL3 RNA stem at 0.2 M NaCl (32, 55). The data can be used to predict that the overall average affinity for these single-stranded loops is Kd = 2,500 nM. Thus, specific affinity for the GGAG loop is about 100 times greater than the average of these four-base loops. This ratio of specific vs. non-specific binding is comparable to many other biological interactions, and probably more than sufficient for HIV-1 to package its full-length RNA over non-genomic fragments and non-viral mRNA. This ratio of specific to non-specific affinity is similar to the antibiotic, paromomycin, which has ~100-fold higher affinity for the decoding region A-site of ribosomal RNA compared to non-specific binding to competing secondary sites (56).
Implications for chaperone activity
Rapid rearrangement of protein-nucleic acid complexes is one of the major components of the NC nucleic acid chaperone function (5, 11, 57). In Results we reported that adding concentrated NaCl to R1Pn>1 at low salt produced a rapid rearrangement to R1P1 even in the presence of excess protein. It is apparent that the collection of free and bound species can rearrange within seconds to changes in the balance of specific and electrostatic interactions. This is supported by NMR observations (45), which showed that free and bound SL3 and NCp7 exhibit exchange-crosspeaks having a dissociation rate constant of 5 s−1.
Implications for analysis of condensed RNA-NCp7 interactions
Recent analyses of spin-labeled SL3 interacting with NCp7 at low salt have been shown by EPR to have intriguing properties that should be similar to genomic RNA in mature virions (44). AddPro titrations similar to those described in Fig. S4 may be useful in guiding the construction of nearly pure R1P2 complexes.
Supplementary Material
Acknowledgments
We gratefully acknowledge Drs. Andrew Paoletti and Michael Shubsda, who first noticed the unusual characteristics of AddNA assays at low salt, Dr. Chris DeCiantis, who performed the earliest AddPro assays.
ABBREVIATIONS AND TEXTUAL FOOTNOTE
- SL3
stem-loop 3 with unpaired residues at G317-G318-A319-G-320 of the 5′-leader of HIV-1 genomic RNA
- NCp7
HIV-1 nucleocapsid protein
- Kd
equilibrium constant for the dissociation of a bimolecular complex
- Pt
total concentration of protein
- Rt
total strand concentration of RNA
- MS
mass spectrometry
- ESI
electrospray ionization
- SPR
surface plasmon resonance
- ITC
isothermal titration calorimetry
Footnotes
Supported in part by NIH grant R01 GM32691.
SUPPORTING INFORMATION AVAILABLE
Three Figures describe theoretical AddNA and AddPro assays at a variety of Kd values, and experimental AddPro titrations at very low NaCl concentrations. This material is available free of charge via the Internet at http://pubs.acs.org.
Contributor Information
Shreyas S. Athavale, Email: shreyas.athavale@biology.gatech.edu.
Wei Ouyang, Email: wouyang@syr.edu.
Mark P. McPike, Email: mpmcpike@syr.edu.
Bruce S. Hudson, Email: bshudson@syr.edu.
Philip N. Borer, Email: pnborer@syr.edu.
References
- 1.Linial ML, Miller AD. Retroviral RNA packaging: sequence requirements and implications. Curr Top Microbiol Immunol. 1990;157:125–152. doi: 10.1007/978-3-642-75218-6_5. [DOI] [PubMed] [Google Scholar]
- 2.Wills JW, Craven RC. Form, function, and use of retroviral gag proteins. Aids. 1991;5:639–654. doi: 10.1097/00002030-199106000-00002. [DOI] [PubMed] [Google Scholar]
- 3.Oertle S, Spahr PF. Role of the gag polyprotein precursor in packaging and maturation of Rous sarcoma virus genomic RNA. J Virol. 1990;64:5757–5763. doi: 10.1128/jvi.64.12.5757-5763.1990. [DOI] [PMC free article] [PubMed] [Google Scholar]
- 4.Damgaard CK, Dyhr-Mikkelsen H, Kjems J. Mapping the RNA binding sites for human immunodeficiency virus type-1 gag and NC proteins within the complete HIV-1 and -2 untranslated leader regions. Nucleic Acids Res. 1998;26:3667–3676. doi: 10.1093/nar/26.16.3667. [DOI] [PMC free article] [PubMed] [Google Scholar]
- 5.Williams MC, Rouzina I, Wenner JR, Gorelick RJ, Musier-Forsyth K, Bloomfield VA. Mechanism for nucleic acid chaperone activity of HIV-1 nucleocapsid protein revealed by single molecule stretching. Proc Natl Acad Sci U S A. 2001;8:8. doi: 10.1073/pnas.101033198. [DOI] [PMC free article] [PubMed] [Google Scholar]
- 6.Darlix JL, Cristofari G, Rau M, Pechoux C, Berthoux L, Roques B. Nucleocapsid protein of human immunodeficiency virus as a model protein with chaperoning functions and as a target for antiviral drugs. Adv Pharmacol. 2000;48:345–372. doi: 10.1016/s1054-3589(00)48011-7. [DOI] [PubMed] [Google Scholar]
- 7.Muriaux D, De Rocquigny H, Roques BP, Paoletti J. NCp7 activates HIV-1Lai RNA dimerization by converting a transient loop- loop complex into a stable dimer. J Biol Chem. 1996;271:33686–33692. doi: 10.1074/jbc.271.52.33686. [DOI] [PubMed] [Google Scholar]
- 8.Fu W, Gorelick RJ, Rein A. Characterization of human immunodeficiency virus type 1 dimeric RNA from wild-type and protease-defective virions. J Virol. 1994;68:5013–5018. doi: 10.1128/jvi.68.8.5013-5018.1994. [DOI] [PMC free article] [PubMed] [Google Scholar]
- 9.Rist MJ, Marino JP. Mechanism of Nucleocapsid Protein Catalyzed Structural Isomerization of the Dimerization Initiation Site of HIV-1. Biochemistry. 2002;41:14762–14770. doi: 10.1021/bi0267240. [DOI] [PubMed] [Google Scholar]
- 10.Prats AC, Sarih L, Gabus C, Litvak S, Keith G, Darlix JL. Small finger protein of avian and murine retroviruses has nucleic acid annealing activity and positions the replication primer tRNA onto genomic RNA. Embo J. 1988;7:1777–1783. doi: 10.1002/j.1460-2075.1988.tb03008.x. [DOI] [PMC free article] [PubMed] [Google Scholar]
- 11.Hargittai MR, Gorelick RJ, Rouzina I, Musier-Forsyth K. Mechanistic insights into the kinetics of HIV-1 nucleocapsid protein-facilitated tRNA annealing to the primer binding site. J Mol Biol. 2004;337:951–968. doi: 10.1016/j.jmb.2004.01.054. [DOI] [PubMed] [Google Scholar]
- 12.Druillennec S, Caneparo A, de Rocquigny H, Roques BP. Evidence of interactions between the nucleocapsid protein NCp7 and the reverse transcriptase of HIV-1. J Biol Chem. 1999;274:11283–11288. doi: 10.1074/jbc.274.16.11283. [DOI] [PubMed] [Google Scholar]
- 13.Lener D, Tanchou V, Roques BP, Le Grice SF, Darlix JL. Involvement of HIV-I nucleocapsid protein in the recruitment of reverse transcriptase into nucleoprotein complexes formed in vitro. J Biol Chem. 1998;273:33781–33786. doi: 10.1074/jbc.273.50.33781. [DOI] [PubMed] [Google Scholar]
- 14.de Rocquigny H, Caneparo A, Delaunay T, Bischerour J, Mouscadet JF, Roques BP. Interactions of the C-terminus of viral protein R with nucleic acids are modulated by its N-terminus. Eur J Biochem. 2000;267:3654–3660. doi: 10.1046/j.1432-1327.2000.01397.x. [DOI] [PubMed] [Google Scholar]
- 15.Berthoux L, Pechoux C, Darlix JL. Multiple effects of an anti-human immunodeficiency virus nucleocapsid inhibitor on virus morphology and replication. J Virol. 1999;73:10000–10009. doi: 10.1128/jvi.73.12.10000-10009.1999. [DOI] [PMC free article] [PubMed] [Google Scholar]
- 16.Stephen AG, Rein A, Fisher RJ, Shoemaker RH. The nucleocapsid protein as a target for novel anti-HIV drugs. Current Drug Discovery. 2003 August;:33–36. [Google Scholar]
- 17.Yuan Y, Kerwood DJ, Paoletti AC, Shubsda MF, Borer PN. Stem of SL1 RNA in HIV-1: Structure and Nucleocapsid Protein Binding for a 1 × 3 Internal Loop. Biochemistry. 2003;42:5259–5269. doi: 10.1021/bi034084a. [DOI] [PubMed] [Google Scholar]
- 18.Cruceanu M, Stephen AG, Beuning PJ, Gorelick RJ, Fisher RJ, Williams MC. Single DNA molecule stretching measures the activity of chemicals that target the HIV-1 nucleocapsid protein. Analytical biochemistry. 2006;358:159–170. doi: 10.1016/j.ab.2006.08.037. [DOI] [PMC free article] [PubMed] [Google Scholar]
- 19.Vogt VM, Simon MN. Mass determination of rous sarcoma virus virions by scanning transmission electron microscopy. J Virol. 1999;73:7050–7055. doi: 10.1128/jvi.73.8.7050-7055.1999. [DOI] [PMC free article] [PubMed] [Google Scholar]
- 20.Coffin JM, Hughes SH, Varmus HE. Retroviruses. Cold Spring Harbor Lab Press; Plainview, NY: 1997. [PubMed] [Google Scholar]
- 21.Gelderblom HR. Assembly and morphology of HIV: potential effect of structure on viral function. Aids. 1991;5:617–637. [PubMed] [Google Scholar]
- 22.Clever J, Sassetti C, Parslow TG. RNA secondary structure and binding sites for gag gene products in the 5′ packaging signal of human immunodeficiency virus type 1. J Virol. 1995;69:2101–2109. doi: 10.1128/jvi.69.4.2101-2109.1995. [DOI] [PMC free article] [PubMed] [Google Scholar]
- 23.Clever JL, Eckstein DA, Parslow TG. Genetic dissociation of the encapsidation and reverse transcription functions in the 5′ R region of human immunodeficiency virus type 1. J Virol. 1999;73:101–109. doi: 10.1128/jvi.73.1.101-109.1999. [DOI] [PMC free article] [PubMed] [Google Scholar]
- 24.Clever JL, Parslow TG. Mutant human immunodeficiency virus type 1 genomes with defects in RNA dimerization or encapsidation. J Virol. 1997;71:3407–3414. doi: 10.1128/jvi.71.5.3407-3414.1997. [DOI] [PMC free article] [PubMed] [Google Scholar]
- 25.McBride MS, Panganiban AT. The human immunodeficiency virus type 1 encapsidation site is a multipartite RNA element composed of functional hairpin structures. J Virol. 1996;70:2963–2973. doi: 10.1128/jvi.70.5.2963-2973.1996. [DOI] [PMC free article] [PubMed] [Google Scholar]
- 26.McBride MS, Schwartz MD, Panganiban AT. Efficient encapsidation of human immunodeficiency virus type 1 vectors and further characterization of cis elements required for encapsidation. J Virol. 1997;71:4544–4554. doi: 10.1128/jvi.71.6.4544-4554.1997. [DOI] [PMC free article] [PubMed] [Google Scholar]
- 27.Shubsda MF, Paoletti AC, Hudson BS, Borer PN. Affinities of Packaging Domain Loops in HIV-1 RNA for the Nucleocapsid Protein. Biochemistry. 2002;41:5276–5282. doi: 10.1021/bi016045+. [DOI] [PubMed] [Google Scholar]
- 28.Darlix JL, Lapadat-Tapolsky M, de Rocquigny H, Roques BP. First glimpses at structure-function relationships of the nucleocapsid protein of retroviruses. J Mol Biol. 1995;254:523–537. doi: 10.1006/jmbi.1995.0635. [DOI] [PubMed] [Google Scholar]
- 29.Hayashi T, Ueno Y, Okamoto T. Elucidation of a conserved RNA stem-loop structure in the packaging signal of human immunodeficiency virus type 1. FEBS Lett. 1993;327:213–218. doi: 10.1016/0014-5793(93)80172-q. [DOI] [PubMed] [Google Scholar]
- 30.Hayashi T, Shioda T, Iwakura Y, Shibuta H. RNA packaging signal of human immunodeficiency virus type 1. Virology. 1992;188:590–599. doi: 10.1016/0042-6822(92)90513-o. [DOI] [PubMed] [Google Scholar]
- 31.De Guzman RN, Wu ZR, Stalling CC, Pappalardo L, Borer PN, Summers MF. Structure of the HIV-1 nucleocapsid protein bound to the SL3 psi-RNA recognition element. Science. 1998;279:384–388. doi: 10.1126/science.279.5349.384. [DOI] [PubMed] [Google Scholar]
- 32.Paoletti AC, Shubsda MF, Hudson BS, Borer PN. Affinities of the Nucleocapsid Protein for Variants of SL3 RNA in HIV-1. Biochemistry. 2002;41:15423–15428. doi: 10.1021/bi026307n. [DOI] [PubMed] [Google Scholar]
- 33.Summers MF, Henderson LE, Chance MR, Bess JW, South TL, Blake PR, Sagi I, Perez-Alvarado G, Sowder RC, Hare I, DR, Arthur LO. Nucleocapsid zinc fingers detected in retroviruses: EXAFS studies of intact viruses and the solution-state structure of the nucleocapsid protein from HIV-1. Protein Sci. 1992;1:563–574. doi: 10.1002/pro.5560010502. [DOI] [PMC free article] [PubMed] [Google Scholar]
- 34.Cornille F, Mely Y, Ficheux D, Savignol I, Gerard D, Darlix JL, Fournie-Zaluski MC, Roques BP. Solid phase synthesis of the retroviral nucleocapsid protein NCp10 of Moloney murine leukaemia virus and related “zinc-fingers” in free SH forms. Influence of zinc chelation on structural and biochemical properties. Int J Pept Protein Res. 1990;36:551–558. [PubMed] [Google Scholar]
- 35.Vuilleumier C, Bombarda E, Morellet N, Gerard D, Roques BP, Mely Y. Nucleic acid sequence discrimination by the HIV-1 nucleocapsid protein NCp7: a fluorescence study. Biochemistry. 1999;38:16816–16825. doi: 10.1021/bi991145p. [DOI] [PubMed] [Google Scholar]
- 36.Fisher RJ, Rein A, Fivash M, Urbaneja MA, Casas-Finet JR, Medaglia M, Henderson LE. Sequence-specific binding of human immunodeficiency virus type 1 nucleocapsid protein to short oligonucleotides. J Virol. 1998;72:1902–1909. doi: 10.1128/jvi.72.3.1902-1909.1998. [DOI] [PMC free article] [PubMed] [Google Scholar]
- 37.Shubsda MF, Kirk CA, Goodisman J, Dabrowiak JC. Binding of human immunodeficiency virus type 1 nucleocapsid protein to psi-RNA-SL3. Biophysical chemistry. 2000;87:149–165. doi: 10.1016/s0301-4622(00)00188-5. [DOI] [PubMed] [Google Scholar]
- 38.Maki AH, Ozarowski A, Misra A, Urbaneja MA, Casas-Finet JR. Phosphorescence and Optically Detected Magnetic Resonance of HIV-1 Nucleocapsid Protein Complexes with Stem-Loop Sequences of the Genomic Psi-Recognition Element. Biochemistry. 2001;40:1403–1412. doi: 10.1021/bi002010i. [DOI] [PubMed] [Google Scholar]
- 39.Amarasinghe GK, Zhou J, Miskimon M, Chancellor KJ, McDonald JA, Matthews AG, Miller RR, Rouse MD, Summers MF. Stem-loop SL4 of the HIV-1 psi RNA packaging signal exhibits weak affinity for the nucleocapsid protein. structural studies and implications for genome recognition. J Mol Biol. 2001;314:961–970. doi: 10.1006/jmbi.2000.5182. [DOI] [PubMed] [Google Scholar]
- 40.Urbaneja MA, Wu M, Casas-Finet JR, Karpel RL. HIV-1 nucleocapsid protein as a nucleic acid chaperone: spectroscopic study of its helix-destabilizing properties, structural binding specificity, and annealing activity. J Mol Biol. 2002;318:749–764. doi: 10.1016/S0022-2836(02)00043-8. [DOI] [PubMed] [Google Scholar]
- 41.Hagan N, Fabris D. Direct mass spectrometric determination of the stoichiometry and binding affinity of the complexes between nucleocapsid protein and RNA stem-loop hairpins of the HIV-1 Psi-recognition element. Biochemistry. 2003;42:10736–10745. doi: 10.1021/bi0348922. [DOI] [PubMed] [Google Scholar]
- 42.Fisher RJ, Fivash MJ, Stephen AG, Hagan NA, Shenoy SR, Medaglia MV, Smith LR, Worthy KM, Simpson JT, Shoemaker R, McNitt KL, Johnson DG, Hixson CV, Gorelick RJ, Fabris D, Henderson LE, Rein A. Complex interactions of HIV-1 nucleocapsid protein with oligonucleotides. Nucleic Acids Res. 2006;34:472–484. doi: 10.1093/nar/gkj442. [DOI] [PMC free article] [PubMed] [Google Scholar]
- 43.Yang L. PhD dissertation. Syracuse University; 2008. NMR analysis of structural features of the HIV-1 nucleocapsid protein in response to mutation and interaction with RNA and drug candidates. [Google Scholar]
- 44.Xi X, Sun Y, Karim CB, Grigoryants VM, Scholes CP. HIV-1 nucleocapsid protein NCp7 and its RNA stem loop 3 partner: rotational dynamics of spin-labeled RNA stem loop 3. Biochemistry. 2008;47:10099–10110. doi: 10.1021/bi800602e. [DOI] [PubMed] [Google Scholar]
- 45.Amarasinghe GK, De Guzman RN, Turner RB, Chancellor KJ, Wu ZR, Summers MF. NMR structure of the HIV-1 nucleocapsid protein bound to stem-loop SL2 of the psi-RNA packaging signal. Implications for genome recognition. J Mol Biol. 2000;301:491–511. doi: 10.1006/jmbi.2000.3979. [DOI] [PubMed] [Google Scholar]
- 46.Cantor CR, Schimmel PR. The behavior of biological macromolecules. Part III. W.H. Freeman; San Francisco: 1980. Biophysical Chemistry. [Google Scholar]
- 47.Truesdell AH. Activity Coefficients of Aqueous Sodium Chloride from 15{degrees} to 50{degrees}C Measured with a Glass Electrode. Science. 1968;161:884–886. doi: 10.1126/science.161.3844.884. [DOI] [PubMed] [Google Scholar]
- 48.Hostetler PB, Truesdell AH, Christ CL. Activity Coefficients of Aqueous Potassium Chloride Measured with a Potassium-Sensitive Glass Electrode. Science. 1967;155:1537–1539. doi: 10.1126/science.155.3769.1537. [DOI] [PubMed] [Google Scholar]
- 49.Weast RC, Astle MJ. CRC Handbook of Chemistry and Physics. 63. CRC Press; Boca Raton, Fl: 1982. [Google Scholar]
- 50.Stokes RH, Robinson RA. Ionic hydration and activity in electrolyte solutions. J Am Chem Soc. 1948;70:1870–1878. doi: 10.1021/ja01185a065. [DOI] [PubMed] [Google Scholar]
- 51.Robinson RA, Stokes RH. Electrolyte Solutions. Butterworths; London: 1959. [Google Scholar]
- 52.DeCiantis CL, Jensen DK, Hudson BS, Borer PN. A nucleic acid switch triggered by the HIV-1 nucleocapsid protein. Biochemistry. 2007;46:9164–9173. doi: 10.1021/bi700031j. [DOI] [PubMed] [Google Scholar]
- 53.Deciantis CL. PhD Dissertation. Syracuse University; 2008. A FRET Based Bistable Oligonucleotide Switch, AlloSwitch, Designed for Specific Recognition of HIV-1 NCp7 and Use in High Throughput Screening. [Google Scholar]
- 54.Wenner JR, Williams MC, Rouzina I, Bloomfield VA. Salt dependence of the elasticity and overstretching transition of single DNA molecules. Biophys J. 2002;82:3160–3169. doi: 10.1016/S0006-3495(02)75658-0. [DOI] [PMC free article] [PubMed] [Google Scholar]
- 55.Paoletti AC. PhD Dissertation. Syracuse University; 2004. Affinity of the HIV-1 nucleocapsid protein for structural motifs in the genomic RNA packaging domain. [Google Scholar]
- 56.Kaul M, Barbieri CM, Kerrigan JE, Pilch DS. Coupling of drug protonation to the specific binding of aminoglycosides to the A site of 16 S rRNA: elucidation of the number of drug amino groups involved and their identities. J Mol Biol. 2003;326:1373–1387. doi: 10.1016/s0022-2836(02)01452-3. [DOI] [PubMed] [Google Scholar]
- 57.Cruceanu M, Gorelick RJ, Musier-Forsyth K, Rouzina I, Williams MC. Rapid kinetics of protein-nucleic acid interaction is a major component of HIV-1 nucleocapsid protein’s nucleic acid chaperone function. J Mol Biol. 2006;363:867–877. doi: 10.1016/j.jmb.2006.08.070. [DOI] [PubMed] [Google Scholar]
Associated Data
This section collects any data citations, data availability statements, or supplementary materials included in this article.