Abstract
Nylon mesh substrates were derivatized to include VICATSH, a biotinylated reagent that contains both a photolabile linking group and a thiol specific capture agent. The enhanced mesh substrates were then used to capture sulfhydryl analytes directly from urine and plasma samples via covalent reaction between the reactive thiols of the analytes and the iodoacetaminyl unit of VICATSH. Photocleavage of the labile linker was followed by direct analysis of the mesh surface via transmission mode desorption electrospray ionization (TM-DESI). This chemoselective capture method promoted enrichment of sulfhydryl analytes and reduced matrix interferences, thereby resulting in increased analytical performance of surface enhanced TM-DESI-MS when compared to standard DESI-MS. The present work describes the manufacture of the derivatized mesh substrates and the quality control assessments made during the manufacturing process; the optimization of the chemoselective capture method; and results of experiments pertinent to biological applications. Integration of the chemoselective capture materials with ambient ionization and tandem mass spectrometry results in a powerful combination of speed and selectivity for targeted analyte screening.
Chemoselective and affinity based capture methods are sample preparation techniques used throughout chemistry, biochemistry, and molecular biology to recover targeted analytes of interest from complex matrices, thereby increasing analytical specificity and sensitivity through analyte enrichment and the reduction of interferences.1–4 For example, medical diagnostics and proteomics studies routinely employ affinity based capture methods to investigate the relationship between antibodies and antigens, often resulting in the development of detection assays for metabolic biomarkers, peptides and proteins.1,2 Similarly, metabolite enrichment by tagging and proteolytic release (METPR), utilizes chemoselective probes to capture and covalently conjugate small molecule metabolites containing targeted functional groups to solid phase resins.3,4 In some capture methods, such as western or Southern blotting techniques, the captured analytes are physically transferred to a secondary nitrocellulose surface for analysis.5,6 In other cases, including METPR and various affinity chromatography methods, a secondary liquid extraction step is used to re-introduce the captured analytes to solution for standard LC-MS analysis.3,4,7 In either of these scenarios, extraction of captured analytes from the affinity or chemoselective substrate to a secondary surface or solution inevitably results in some analyte loss; therefore, there is continued interest in developing methods to analyze capture surfaces directly (i.e., without additional extraction steps.)
Fluorometry, surface plasmon resonance, and mass spectrometry are the detection methods most often utilized for direct analysis of capture surfaces. Due to its impressive sensitivity, enzyme linked immunosorbent assays (ELISA) and other immunological assays rely primarily on fluorometry.8 In these methods, which are often developed in multi-component arrays, detection antibodies containing fluorophore tags are used to identify antigens that have been sequestered by surface-bound capture antibodies.8 An increase in fluorescent signal is then directly correlated to the extent of binding for a specific antigen or set of antigens. Similarly, surface plasmon resonance (SPR) can be used to detect the binding of specific analytes to specialized substrates via the alteration of the refractive index of the surface.9 Once the SPR analysis is complete, captured molecules can be eluted from the substrate and subsequently analyzed via electrospray ionization-mass spectrometry in a technique deemed biomolecular interaction mass spectrometry (BIA-MS).10 In contrast to BIA-MS, direct mass spectrometric analysis of the capture surface typically utilizes desorption/ionization on porous silicon (DIOS)11, surface-enhanced affinity capture (SEAC)12, self-assembled monolayer desorption/ionization mass spectrometry (SAMDI)13,14, or more commonly, surface-enhanced laser desorption ionization (SELDI).15–28
While it has been explored most prominently in the field of proteomics, SELDI is theoretically applicable to nearly any application. In the SELDI process a surface is modified with an affinity based probe designed to capture either a specific molecule via antibody-antigen interactions, or a broader class of molecules such as bacteria or microorganisms. To complete the analysis, surfaces containing the captured analytes are rinsed to remove interfering substances, introduced into the vacuum region of a mass spectrometer, and subjected to laser desorption ionization (LDI) either directly, or following the addition of a suitable matrix (i.e., MALDI). Surfaces for SELDI-MS have taken a variety of forms including polyvinylidene difluoride (PVDF),20,21 dextran,22 polyethylene,23 and polyester.24 One particularly effective SELDI surface which utilizes immobilized metal affinity chromatography (IMAC)15,16,25–28 for the selective capture of histidine-containing or phosphorylated peptides and proteins has been commercialized, and the use of IMAC SELDI biochips has been reported in numerous studies, especially those targeting post-translational protein modifications25,26 and disease biomarkers.27,28
Recent developments in ambient ionization methods, such as desorption electrospray ionization (DESI)29–31 and direct analysis in real time (DART)32 have facilitated a new era of high throughput mass spectrometry, where samples can be analyzed in their native environment and analysis times are typically only seconds per sample. While the speed of these techniques is among the primary advantages, the elimination of the chromatographic separation afforded by GC-MS and LC-MS typically results in decreased specificity and ion suppression for low concentration species. While some selectivity can be regained via the careful choice of the desorption electrospray solvent30 or via the introduction of reagents to facilitate ion/molecule reactions with analytes of interest,33–35 these methods are not universally applicable, and thus it is generally recognized that specificity and/or sensitivity are compromised for the dramatic increase in analytical speed that is gained through ambient ionization mass spectrometry.
The results presented here demonstrate that the increased selectivity afforded by analyte capture can be merged with the high throughput capabilities of ambient ionization mass spectrometry via the utilization of mesh substrates specifically designed to both chemoselectively capture target analytes from solution and integrate seamlessly to transmission mode desorption electrospray ionization mass spectrometry (TM-DESI-MS).36–38 While broadly applicable, the present study focuses specifically on sulfhydryl analytes which are prevalent in pharmaceuticals and human metabolism.39–41 Compared to highly basic or acidic molecules such as amines and carboxylic acids, sulfhydryls are more difficult to ionize via electrospray ionization and are generally suppressed by easily ionized matrix interferences, thereby making them a suitable set of analytes to demonstrate the benefits of the approach for high throughput screening applications. This work describes the construction and development of sulfhydryl specific mesh substrates using readily available polyamide mesh materials that are partially hydrolyzed and further derivatized with neutravidin to create a binding surface for VICATSH, a biotinylated sulfhydryl capture agent containing a photolabile linker.42,43 In addition, results are presented for the capture and analysis of sulfhydryl analytes directly from complex biological matrices such as plasma and urine.
Experimental Section
Chemicals and Materials
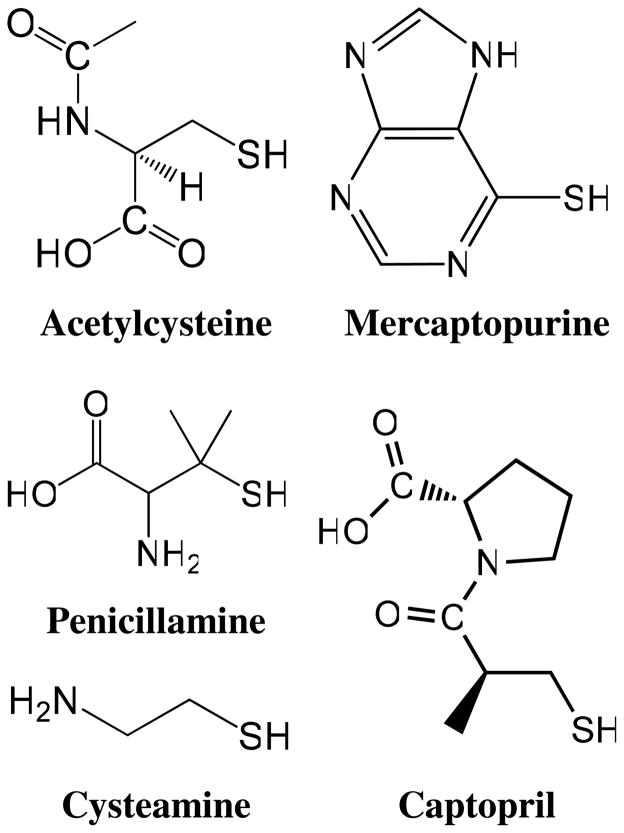
Hydrochloric acid, sodium hydroxide, methanol, acetonitrile, and water (HPLC grade) were purchased from Fisher Scientific (Hampton, NH). N-acetyl-L-cysteine, captopril, cysteamine, 6-mercaptopurine, MES hydrate, penicillamine, 4-[2-[(Cyclohexylcarbonimidoyl)amino]ethyl]-4-methylmorpholinium p-toluenefulfonate (CMC), and phosphate buffered saline were purchased from Sigma Aldrich (St. Louis, MO). Neutravidin (a deglycosylated form of avidin) and fluorescein isothiocyanate (FITC) derivatized neutravidin were purchased from Pierce Biotechnology (Rockford, IL). Synthrapol dying detergent was purchased from Dharma Trading Company (San Rafael, CA). Polyamide mesh sheets (nylon-6,6) with a strand diameter of 125 μm encompassing an open space of 190 μm were purchased from Small Parts Inc. (Miramar, Fl.) VICATSH, a biotinylated molecule incorporating an iodoacetaminyl group for the selective capture of sulfhydryls and a photolabile o-nitrobenzyl linkage between the biotin and the capture agent was synthesized in the laboratory of Dr. Michael Gelb at the University of Washington using previously reported procedures.42 The structures of the sulfhydryl analytes investigated in this work are shown in Figure 1.
Figure 1.
Sulfhydryl analyte structures.
Manufacture of Enhanced Mesh Materials
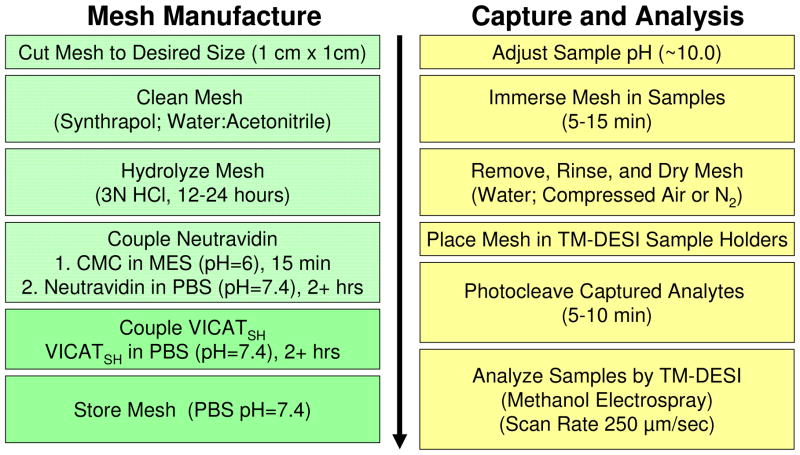
Scheme 1 summarizes the steps involved in manufacturing the surface-enhanced meshes. Mesh materials were marked, cut into 1 cm squares and cleaned thoroughly with methanol to remove any residual ink. The mesh pieces were then sonicated in an aqueous solution of Synthrapol (1%) to remove any remaining surface contaminants. Following a thorough rinse with deionized H2O, the cleaning procedure was completed by sonicating the materials in an acetonitrile and water solution (50:50 v:v) for five minutes. Batches of cleaned materials were stored in HPLC grade H2O for future use.
Scheme 1.
Work flow for the manufacture of surface-enhanced materials and the capture and analysis of sulfhydryl compounds using surface enhanced TM-DESI-MS.
Acid-catalyzed hydrolysis of polyamide materials to expose carboxyl groups was performed by submerging the mesh pieces in a 3 M solution of HCl for approximately 24 hours at room temperature. Following hydrolysis, mesh materials were rinsed with HPLC grade H2O to remove any residual acid, blown dry with compressed air, and stored dry in a sealed PTFE container.
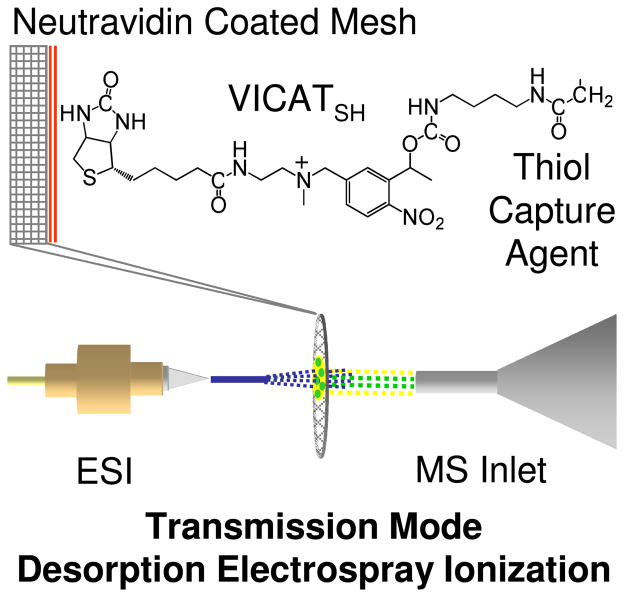
Derivatization of the hydrolyzed mesh materials with neutravidin was performed using a two step procedure for carbodiimide mediated coupling of surface carboxyl groups to the primary amines of the protein. In the first step, the free carboxyl groups of the hydrolyzed mesh were reacted with a room temperature solution of CMC (108 mM) in MES (50 mM) buffer (pH = 6) for 15 min. After rinsing the mesh materials in phosphate buffered saline (pH = 7.4), neutravidin (either in its FITC derivatized or native form) was coupled to the mesh materials by immersion of the meshes (10 per 5 mL batch) for at least 2 hours in a 70 μg/mL (1.2 μM) solution of the protein in PBS (pH = 7.4). Following protein derivatization, the mesh materials were rinsed free of excess protein with additional PBS and immersed in 5 mL of a 1 μg/mL solution of VICATSH for at least 2 hours in the dark. The biotin group of VICATSH binds to neutravidin, thus anchoring VICATSH to the mesh, while the iodoacetaminyl capture agent of VICATSH remains available to react specifically with analytes containing free thiol groups. (Figure 2)
Figure 2.
Schematic view of surface-enhanced transmission mode desorption electrospray ionization employing VICATSH as a thiol capture reagent attached to a neutravidin-coated mesh.
Mass Spectrometry
A one-dimensional automated scanning Omni Spray ion source (Prosolia, Inc., Indianapolis, IN) was mounted to a Thermo Fisher Scientific LTQ XL (Thermo Fisher Scientific Inc., Waltham, MA). A prototype TM-DESI adaptor kit also manufactured by Prosolia Inc. was used to convert the standard Omni Spray 1-D scanning source to a customized source more suitable for TM-DESI. The adaption included a slotted sample holder in place of the conventional slide holder and the use of custom sized TM-DESI mesh holders. The mesh was held in place by affixing it to a 26 mm by 76 mm × 3 mm PEEK backing plate with an 8 mm by 38 mm slot cut into it to facilitate transmission of the electrospray through both the sample and the backing plate. In addition, adaptation included a modified spray arm that facilitated a 0° angle between the electrospray tip and capillary inlet to the mass spectrometer and an extended heated capillary. All analyses were conducted at a distance of 2 mm between the electrospray tip and the mesh surface and a distance of 6 mm between the mesh sample and the capillary inlet of the mass spectrometer. Methanol at a flow rate of 10 μL/min was used as the electrospray solvent and nitrogen at a pressure of 110 psi was used as the nebulizing gas. The electrospray voltage was set to 4.0 kV, the ion accumulation time set to 100 ms and signal averaging set for three microscans. All mass spectra were acquired in the positive ion mode by scanning the sample at a rate of 250 μm/sec. Collisionally induced dissociation spectra were acquired using an isolation window of 1 Da, a q value of 0.25, and an activation time of 30 ms. Collisional energy ranged from 20 to 35 arbitrary units and was optimized for each ion.
Fluorescence Microscopy and Fluorometry
Analysis of the distribution of fluorescently labeled neutravidin on derivatized mesh materials was performed using the 2.5X objective of an Olympus BX2 epifluorescent microscope equipped with a 12 bit CCD camera (DVC Co., Austin, TX) and high pressure mercury bulb excitation source. Excitation of the fluorescein isothiocyanate tag occurred at 480 nm and emission was monitored at 535 nm. Photomicrographs were captured via DVC software with adjustable gain, offset, and exposure time.
The reproducibility of polyamide hydrolysis and neutravidin coupling was monitored through several fluorimetric assays. All assays were performed on a Perkin Elmer Victor 3 fluorimeter equipped to read samples presented in 24 well plates. Aqueous samples (1 mL) were deposited in the plate wells and the analysis time was optimized to provide maximum fluorescence intensity for positive control samples while maintaining minimal signal intensity from control blanks. Experiments involved fluorescein or fluorescein isothiocyanate, thus excitation and emission were modulated using filters of 485 nm and 535 nm, respectively. To assess polyamide hydrolysis, representative hydrolyzed mesh materials (5 per hydrolysis batch) were weighed and each submerged in 1 mL of an aqueous fluorescein sample (1 μM) and allowed to equilibrate for 10 minutes. The fluorescence intensity of the solution was then measured for 100 ms, and mass corrections were applied to account for any differences in mesh surface area. The fluorescence of the solution was used as an accurate measure for pH, and hence correlated to the presence of surface carboxyl groups. The reproducibility of neutravidin coupling was assayed by measuring the fluorescence of nylon mesh materials derivatized with FITC-derivatized neutravidin. In this case, the protein coated materials were placed in wells of a 24-well glass bottom plate and the fluorescence was measured using a similar set of instrument conditions. The protein derivatization assay was non-destructive and thus each batch of materials underwent a quality control assessment following this derivatization step.
Execution of Surface-Enhanced TM-DESI Analysis
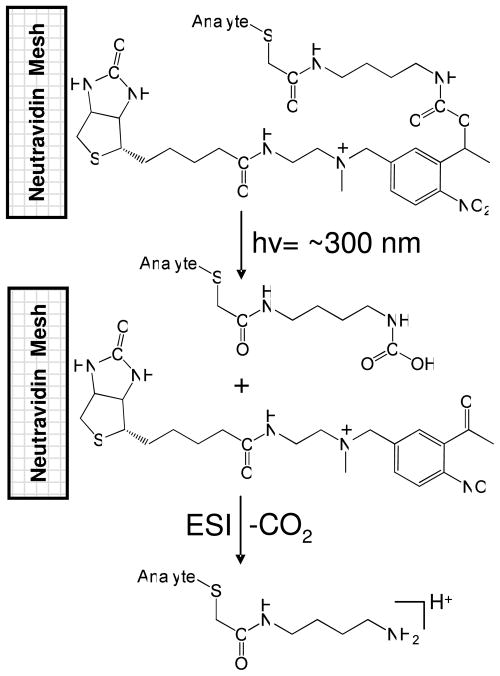
The right-hand side of Scheme 1 also provides an overview of the analytical workflow. First, the pH of the samples was adjusted to the appropriate range for the capture agent (e.g., ~10 for VICATSH capture of sulfhydryls), and a mesh was submerged in each sample solution to capture the targeted analytes. Analyte capture by the iodoacetaminyl unit of the VICATSH reagent was complete in approximately 5–10 minutes, depending on the volume of the solution. Next, the meshes were removed from the samples, rinsed thoroughly with water to remove matrix interferences (e.g., salts) and non-sulfhydryl-containing compounds, blown dry with air, and placed under a UV lamp for 10 minutes to induce photocleavage of the o-nitrobenzyl linkage. The meshes were then placed in line with the electrospray and analyzed directly by TM-DESI-MS using methanol as the electrospray solvent. As an example, the photocleavage of a sulfhydryl analyte captured by the VICATSH-modified mesh is depicted in Scheme 2. It should be noted that the current study was not exclusively aimed at optimizing the quantitative aspects of the analysis, but instead was focused on developing the technique for capture, release, and analysis of sulfhydryl analytes for screening applications. Thus, for more quantitative purposes, a disulfide reduction step utilizing tris(2-carboxyethyl)phosphine (TCEP) or another suitable reducing agent should be inserted prior to immersing the mesh materials in the sample in order to ensure conversion of non-reactive disulfides to reactive, capturable sulfhydryls.40,41
Scheme 2.
Schematic overview of the photocleavage reaction for a sulfhydryl-containing analyte captured by VICATSH. The biotinylated linker molecule remains attached to the mesh surface while the mass tagged analyte is released. The initial photocleavage product contains a carbamic acid that undergoes spontaneous decarboxylation prior to ionization to give the final photocleavage product (shown in protonated form). Capture and release results in a mass shift of 129 Da of the analyte.
Results and Discussion
DESI is an inherently fast ambient ionization mass spectrometric technique that may suffer from suppression of low abundance and low polarity analytes when highly polar interferences are abundant in the sample matrix. However, integration of DESI with specifically designed chemoselective capture surfaces can overcome these matrix interferences and also provide targeted analyte enrichment, thereby resulting in improvements in analytical specificity and sensitivity. The present study details the development of mesh materials specifically designed for sulfhydryl analyte capture; example quality control techniques useful in their preparation; the optimization of the capture and analysis methods, and the application of surface-enhanced TM-DESI for the analysis of sulfhydryl analytes in complex biological matrices such as urine and plasma. Specific studies demonstrate the utility and performance limits of the technique, while simultaneously highlighting several nuances associated with integrating analyte capture and direct mass spectrometric analysis.
Mesh Manufacture and Quality Control
The development of chemoselective and affinity capture techniques is intrinsically dependent on the number and density of the reactive sites used to tether capture agents to the surface. Due to incomplete polymerization, some reactive carboxyl and primary amino terminal groups are present in most polyamides. However, the number and density of these groups can be dramatically increased by partially hydrolyzing the material, thereby cleaving surface amide bonds and creating reactive carboxyl and amino groups in their place. While polyamide hydrolysis can be accomplished under both acidic and basic conditions,44–46 the studies reported here utilized an acid-catalyzed hydrolysis with 3N HCl. This concentration was reported to be optimal for several forms of nylon44,45 and found here to be the highest tolerable concentration the 125 μm mesh strands could withstand. Increasing the concentration beyond 3N either dissolved the material completely or resulted in a severe loss of structural integrity. While exposure of polyamide mesh materials to 3N HCl undoubtedly resulted in the creation of additional carboxyl groups, it was also necessary to evaluate the performance of the hydrolysis reaction.
It is well known that the fluorescence intensity of an aqueous fluorescein solution is dependent on the equilibrium between its cationic, neutral, anionic, and dianionic forms.47 In the case of fluorescein, the dianion and anion have much larger extinction coefficients and quantum yields than the neutral molecule.47 As the solution pH decreases with the presence of additional carboxyl groups, the shift of the equilibrium from primarily anions and dianions under neutral conditions to fewer anions and neutral species results in a large decrease in solution fluorescence. Thus, an assay that utilized the change in fluorescence of aqueous solutions of fluorescein following exposure to hydrolyzed mesh materials was developed as a fast and accurate way to study the efficiency and reproducibility of the hydrolysis, that ultimately provides an indication of mesh carboxylic acid content. Mesh samples were hydrolyzed for durations ranging from 5 minutes to 24 hours. Overall, the extent of hydrolysis was observed to increase with exposure time and eventually plateau after 16–24 hours. Furthermore, the reproducibility of the hydrolysis after this extended time period was excellent with less than 5% relative standard deviation.
Neutravidin Coupling
In the present study, neutravidin was coupled directly to the exposed carboxyl groups of the hydrolyzed mesh via a two-step carbodiimide mediated method to form a binding layer for the subsequent attachment of the biotinylated photocleavable reactive capture agent, VICATSH. Because the performance of surface-enhanced TM-DESI is ultimately dependent on the total number of accessible reactive capture agent sites on the mesh, it is critical that the neutravidin surface layer used to anchor the VICATSH agent be uniform, robust and reproducible. To evaluate the preparation of the neutravidin-modified meshes prior to further derivatization with the biotinylated reactive capture agent, the performance of the neutravidin-coupling method was assessed by fluorescence microscopy and fluorometry using FITC-labeled neutravidin. A fluorescent micrograph of a polyamide mesh successfully derivatized with FITC-labeled neutravidin alongside a control mesh that was cleaned and hydrolyzed, but not derivatized with the protein is provided in the Supporting Information (Figure S1) The bright green fluorescence observed for the derivatized mesh compared to the dull outline observed for the control mesh provides convincing evidence that the neutravidin coupling was both successful and relatively uniform.
In addition to the qualitative microscopy results, the reproducibility of the neutravidin coupling to the mesh was determined by quantifying the fluorescence of the meshes. In this case, the materials were removed from the reaction vials, rinsed with water, blown dry with air, weighed, and assayed for fluorescence. Overall, the derivatization process was quite reproducible as the percent relative standard deviation over several batches was typically less than 10%. Perhaps more importantly, the nondestructive nature of the fluorescence assay facilitated a rapid quality control measure which enabled the confident identification and removal of any poorly performing mesh substrates before they were used for sample analysis.
Coupling of VICATSH
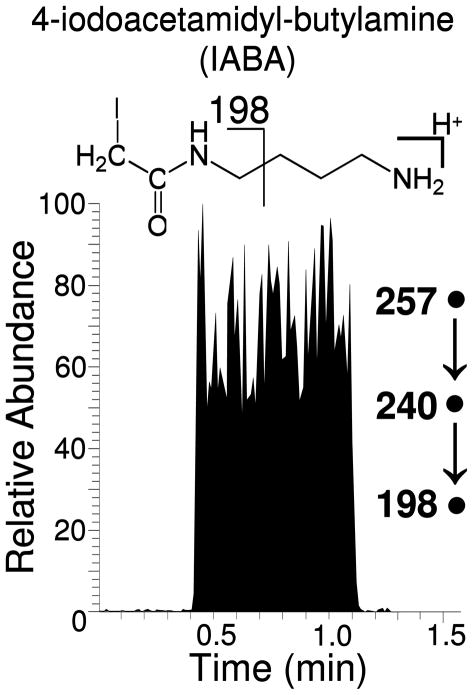
The efficacy of the biotin-neutravidin binding, and thus the attachment of VICATSH to the neutravidin-derivatized mesh, was assayed by TM-DESI-MS using VICATSH as a probe molecule in the absence of any sulfhydryl analytes. In this case, representative samples from each preparation batch were removed from the final derivatization solution, rinsed with water, blown dry with air, and placed under a UV lamp for 10 minutes to induce photocleavage of the bound VICATSH. The meshes were then subjected to TM-DESI-MS to detect the release of 4-iodoacetamidyl-butylamine (IABA) from the photocleaved VICATSH by selected reaction monitoring for conversion of the IABA precursor ion of m/z 257 to the product ion of m/z 240 upon CID. This product ion was then isolated and subjected to further CID to produce the MS3 product ions of m/z 198 and m/z 113. A representative extracted ion chronogram for m/z 198 is shown in Figure 3, while mass tandem mass spectra and fragmentation pathways for IABA are provided in the supplementary information. (Figure S2)
Figure 3.
The distribution of VICATSH across the derivatized mesh was monitored by TM-DESI-MS. The 1 cm square mesh was affixed to the backing plate and scanned at a rate of 250 μm/sec, resulting in exposure of the mesh to the DESI spray for approximately 0.66 min. Photocleavage of unreacted VICATSH followed by desorption electrospray ionization and spontaneous loss of CO2 produces the stable ion of m/z 257, which corresponds to protonated 4-iodoacetamidyl-butylamine (IABA). Collisional induced dissociation (MS3) results in the formation of the product ion of m/z 198. (XIC shown)
The extracted ion chronograms generally showed a distribution of VICATSH across the mesh surface, indicating that the biotin binding sites are fairly evenly distributed. However, in some cases, larger responses were observed near the edges of the mesh. To investigate these anomalies, mesh samples were scanned multiple times across the same path, and while the intensity of the extracted ion chronogram decreased with each pass, the shape was relatively consistent (i.e. with enhanced signal intensities near the mesh edge). There are several possible causes for these edge effects: 1) they may be related to the analysis method (i.e., there is a difference in the manner in which the electrospray interacts with the mesh at the edges); 2) the mesh materials had more reactive carboxyl groups on the edges due to more complete hydrolysis of the cut strand cross-section; 3) the materials had more neutravidin on the edges of the mesh due to increased efficiency or non-specific binding on the cut edges, or 4) there was increased biotin binding efficiency at the edges. Further studies are necessary before a definitive conclusion can be drawn. In any case, the enhancement of signal near the edges of the mesh did not significantly alter the capture and release of the targeted sulfhydryl analytes.
Optimization of Analysis Methods and Capture Conditions
As depicted in Scheme 2, photocleavage of VICATSH results in the introduction of an easily ionized amine-terminated mass tag to each sulfhydryl compound. In the gas phase, each resulting protonated species undergoes characteristic dissociation pathways upon collisional activation, thus allowing ready identification by tandem mass spectrometry (MSn). Initial experiments to establish the fragmentation patterns of VICATSH tagged analytes were conducted in matrix-free aqueous solutions (100 μM) of each of the five target analytes. The precursor and product ions for each stage of mass spectrometry are summarized in Table 1. The associated mass spectra and the specific conditions used for isolation and collisionally induced dissociation of the target analytes are presented in the supplementary information.(Figure S3–S7)
Table 1.
Precursor and Product Ions for Tandem Mass Spectrometry
| Analyte (Precursor m/z)a | Product m/z (MS2)b | Product m/z (MS3)c |
|---|---|---|
| Mercaptopurine (281) | 193, 263, 89 | 165 |
| Captopril (346) | 231, 249, 213, 329 | 213, 145, 72 |
| Penicillamine (278) | 89, 260, 217 | 243, 189, 215, 145 |
| Acetylcysteine (292) | 275, 187, 232, 163, 146, 250 | 146, 257, 233, 198 |
| Cysteamine (206) | 89, 72, 188 | 171, 117, 72 |
| VICATSH (257) | 240 | 198, 113 |
including the acetamidyl-butylamine mass tag transferred from the VICATSH capture reagent
CID product ions (MS2) are listed in order of descending abundance. The ion isolated for MS3 analysis is in bold type.
CID product ions (MS3) are listed in order of descending abundance.
A series of experiments were performed to assess the impact of the sample pH (7 to 11), sample exposure time, and photocleavage conditions on the efficacy of the capture and analysis. Results indicated that pH had a tremendous impact on the reaction as little to no reaction between VICATSH and the sulfhydryl analytes was observed at pH values between 7 and 8, a result consistent with the low nucleophilicity of peptidyl -SH groups versus -S−.48 However, when the pH exceeded 9, the reaction was very efficient and no unreacted VICATSH was observed during the subsequent ESI-MS analyses. With respect to the capture efficiency and sample exposure time, the capture rate is dependent on the analyte concentration which affects the frequency with which analyte molecule interact with the mesh. Thus, it is expected that longer sample exposure times may be required for extremely low analyte concentrations
The o-nitrobenzyl group incorporated in VICATSH has been used in a number of photolabile probes and crosslinking agents, some of which have become staples of oligonucleotide synthesis schemes.49–51 Previous reports concerning the use of VICATSH for quantifying absolute amounts of proteins in cell lysates utilized photocleavage times of 16 min.43 while other reports discussing similar o-nitrobenzyl photolabile compounds used exposure times as low as 5 min. to induce photocleavage.49 Since photocleavage is dependent on the wattage and flux of the UV source, (in this case the UV lamp was a 20 Watt lamp with a wavelength of 365 nm and the sample was placed approximately 5 cm from the lamp), the impact of photocleavage time on the observed response was also investigated. In this study, VICATSH meshes that had not been exposed to sulfhydryl analytes were exposed to UV light for times ranging between 5 min and 30 min and the detection of IABA (the reporter ion from photocleavage of VICATSH) by tandem MS was used to monitor performance. The results showed that photocleavage times of approximately 8 to 10 minutes were sufficient using the aforementioned UV source and that longer exposure times produced little to no additional response.
Capture of Sulfhydryl Analytes from Biological Matrices
Sulfhydryl containing compounds are prevalent in pharmaceuticals and human metabolism.39–41 Captopril, acetylcysteine, penicillamine, and mercaptopurine are all well established drugs that are used to treat a variety of diseases ranging from hypertension to childhood leukemia.39 Typical doses of these drugs are in the range of mg of drug per kg body weight, and concentrations in plasma are typically in the low micromolar range prior to excretion of the excess dose in the urine.52–54 Other sulfhydryl compounds such as cysteine, homocysteine, glutathione, and cysteinylglycine are meaningful components of the human metabolome, with normal concentrations in the low to mid micromolar range.55 Therefore, it is not surprising that significant efforts have been made to analyze sulfhydryl compounds in biological matrices, most of which have utilized LC-MS or GC-MS following solution phase derivatization.55–59 The five compounds shown in Figure 1 are commonly studied sulfhydryl analytes that were chosen as a model set to illustrate the application of surface-enhanced TM-DESI-MS to biological matrices such as urine and plasma. While these analytes are primarily pharmaceuticals, the surface-enhanced technique described here could be extended to endogenous metabolites, other xenobiotics, or environmental contaminants containing the reactive thiol.
Prior to investigating analyte capture via the surface-enhanced TM-DESI-MS approach, a series of control experiments utilizing blank urine and plasma were performed to probe these matrices for inherent interferences that could cause false positive identifications of the five target analytes. The results of these control experiments indicated that the tandem mass spectrometry analysis (MS3) essentially eliminated false positive analyte identifications as no target analyte response was consistently observed in any of the blanks tested. Additional control samples utilizing urine and plasma spiked with captopril were also prepared. In these analyses, the mesh substrate was either an underivatized nylon mesh substrate, a mesh derivatized with neutravidin but not with VICATSH, or a mesh derivatized with both neutravidin and VICATSH but not subjected to photocleavage. In all cases, the resulting mass spectra showed no evidence of captopril or its VICATSH derivative, thereby confirming that underivatized nylon or neutravidin does not capture sulfhydryl analytes and that if VICATSH does capture sulfhydryl analytes, then subsequent photocleavage is essential to produce the derivatized analyte spectra.
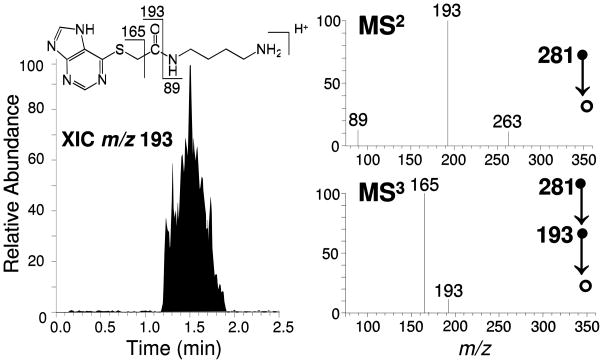
For comparison, positive control samples were prepared by spiking each of the target analytes into aliquots of either urine or plasma. In these cases, the capture and analysis protocol detailed in Scheme 1 produced unequivocal analyte identification. For example, Figure 4 depicts the results of a surface-enhanced TM-DESI-MS analysis of a 1 mL plasma sample containing 50 μM mercaptopurine. The extracted ion chronogram of the CID product ion of m/z 193 obtained upon MS3 (281 → 193 →) confirms that mercaptopurine was successfully captured and retained by the mesh material. In this case, the protonated species of m/z 281 underwent CID by cleavage of the amide bond to produce the ion of m/z 193. Subsequent isolation of this product ion followed by dissociation second stage of collisional activation favors the production of the ion of m/z 165, which is indicative of the captured mercaptopurine. Extension of these positive control studies to samples with decreasing amounts of mercaptopurine resulted in a limit of detection of approximately 10 nmoles, as confirmed by MS3. This limit was slightly lower using MS2 or full scan analysis, but the benefit of the increased selectivity afforded by the additional stage of mass spectrometry was lost in these cases. Furthermore, incorporation of a disulfide cleavage step in the sample preparation and improvements to capture agent density on the mesh substrate should also result in additional improvements to the limit of detection.
Figure 4.
Surface-enhanced TM-DESI analysis of a 1 mL plasma sample containing mercaptopurine (50 μM). The extracted ion chronogram of the collisionally induced dissociation product ion of m/z 193 is shown on the left, while MS2 and MS3 spectra for the captured analyte are shown on the right.
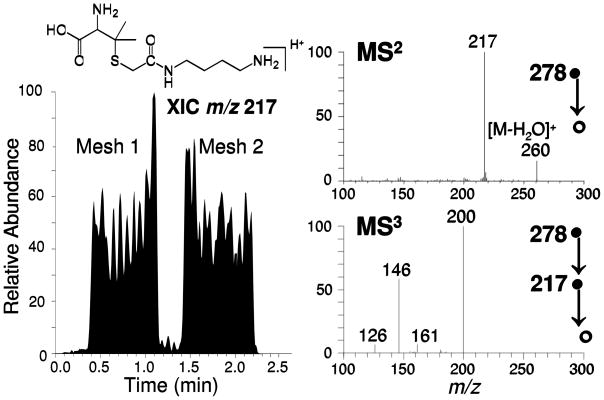
Figure 5 provides further evidence for sulfhydryl capture, in this case from urine. A 40 mL urine sample containing penicillamine (20 μM) was simultaneously sampled in parallel by using two VICATSH-modified meshes. The extracted ion chronogram for the CID product ion of m/z 217 (associated with the loss of CO2 and ammonia from the protonated precursor), shows the successful capture of penicillamine by each mesh. Isolation of the product ion of m/z 217 followed by a second stage of collisional activation results in formation of MS3 product ions of m/z 146, 161, and 200 which confirm the identity of the captured penicillamine. Furthermore, this example illustrates that the sample volume for the surface enhanced TM-DESI-MS method can be extended to much larger sample sizes (i.e., 40 mL) and a single sample can be exposed to multiple meshes for replicate analysis or presumably to capture different classes of compounds depending on the nature of the modified mesh.
Figure 5.
Surface-enhanced TM-DESI analysis of a 40 mL urine sample containing penicillamine (20 μM). The extracted ion chronogram of the collisionally induced dissociation product ion of m/z 217 is shown on the left, while MS2 and MS3 spectra for the captured sulfhydryl analyte are shown on the right. In this case, two mesh materials were submerged in the urine sample and analyzed as duplicates.
To further explore the range of sample volumes, 100 μL samples of plasma were also spiked with mercaptopurine (50 μM). In this case the entire sample volume (100 μL) was deposited onto the mesh and an additional 20 μL of 0.1 M aqueous sodium hydroxide was added to the mesh to increase the pH to promote the capture reaction. The resulting tandem mass spectra and extracted ion chronograms for these experiments resembled those obtained for the larger sample volume (Figure 4). Thus, it is conceivable that small plasma or blood spots could be deposited onto mesh substrates, dried, and later reconstituted with an aqueous base solution that effectively dissolved the analytes and facilitated capture of any free sulfhydryls.
Impact of Mesh Rinsing Method
One common advantage of many capture approaches is the capability to rinse away the sample matrix prior to analysis. In the present case, the covalent capture of the target analytes was expected to result in a robust method that could tolerate thorough rinsing of the capture surface and thereby overcome the presence of salts and other easily ionized molecules that cause suppression of low abundance species. Therefore, experiments were conducted to investigate the impact of rinsing the mesh with various solvents (water, ethanol, methanol, acetonitrile) prior to photocleavage. In the first series of experiments, VICATSH derivatized mesh materials were immersed in blank urine and plasma. After 10 minutes of exposure the mesh materials were removed from the sample and either immediately dried (without rinsing) or rinsed with one of the aforementioned solvents before being subjected to UV photocleavage. Again, the performance was measured using tandem mass spectrometry (MS3) of IABA, the photocleavage product of VICATSH.
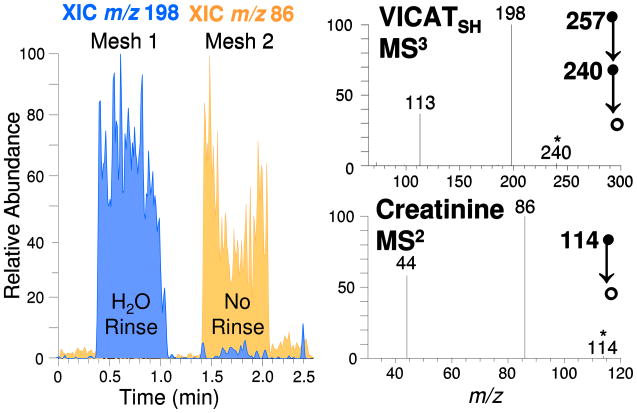
As shown in Figure 6, sample rinsing was found to greatly improve mesh performance. In this example, one of the modified meshes (Mesh 1) was rinsed thoroughly with water prior to TM-DESI-MS analysis, while a second mesh (Mesh 2) was air dried without any additional rinsing. The extracted ion chronogram for m/z 198 (depicted in blue) shows strong signals for IABA from Mesh 1 but much lower responses for Mesh 2, thereby illustrating that the response for the photocleaved ion was dramatically reduced when the mesh was not rinsed. The overlaid extracted ion chronogram for m/z 86 (depicted in gold) corresponds to the presence of creatinine, an abundant component of urine (typically in the range ~1 mg/mL) that is readily ionized due to the presence of three highly basic nitrogen atoms.60 Without rinsing, the overwhelming abundance of creatinine in the urine clearly caused suppression of the lower abundance IABA ions.
Figure 6.
Analysis of VICATSH-modified mesh substrates submerged in urine samples. Mesh 1 was rinsed with H2O prior to TM-DESI-MS analysis while Mesh 2 was air dried without any additional rinsing. The extracted ion chronogram for the ion of m/z 198 (blue) illustrates that the response for VICATSH is dramatically reduced when the sample was not rinsed. The extracted ion chronogram for the ion of m/z 86 (gold) corresponds to the presence of creatinine, an abundant component of urine whose presence causes ion suppression of lower abundance analytes. Together the two chronograms illustrate the impact of effective matrix removal following analyte capture.
Experiments conducted using plasma samples produced similar results, again illustrating that rinsing of mesh materials with water readily removed matrix interferences without noticeable differences in IABA response. In contrast, mesh materials that were immersed in plasma and subsequently analyzed without rinsing showed poor performance due to the viscosity of the residual plasma and abundance of ionizable plasma components.
A side-by-side comparison for the capture of mercaptopurine from water, urine, and plasma was also performed. In this case, an equal amount of mercaptopurine (1 μmole) was spiked into 1 mL samples of each matrix. Since the goal of this particular study was to determine whether rinsing procedures improved method performance, the relatively high concentrations of mercaptopurine (1 mM) compared to the natural abundance of endogenous thiols such as glutathione, cysteine, and cysteine-glycine ensured that the capture of mercaptopurine was stoichiometrically favored over the other endogenous sulfhydryls. Each spiked sample was then processed using the protocol presented in Scheme 1 and the total response for mercaptopurine was measured by the area of the peak in the extracted ion chronogram of m/z 193. Results indicated that the responses was nearly the same in each case, thereby illustrating that analyte capture followed by mesh rinsing effectively removes non-sulfhydryl matrix interferences. Similar results have been previously reported for the surface-enhanced TM-DESI-MS analysis of captopril in the presence of nicotine and high salt concentrations.38
Mesh Capacity and Analyte Enrichment
Another common advantage of capture methods is the capability of extracting target analytes from dilute solutions and thus affording significant analyte enrichment. These methods are similar to other solid phase extraction methods in that they provide a means of localizing dissolved analytes to a small surface area; however, in this case the localization comes with the added benefit of increased selectivity. The magnitude of the enrichment depends on the design of the capture surface and is highly dependent on the surface area of the material and the density of the capture agents. Experiments were conducted to investigate the ability of the mesh materials to capture a constant amount of analyte (250 nmoles of captopril) in increasingly large sample volumes (1 mL, 5 mL, 50 mL, and 250 mL). These solutions ranged from 4 μM to 250 μM and effectively tested the ability of the mesh to extract and concentrate the sample. Each spiked sample was processed using the protocol presented in Scheme 1 (except the capture time was extended to 30 minutes), and the total response for captopril was measured by the area of the peak in the extracted ion chronogram of m/z 213. Results indicated that captopril could indeed be extracted from each sample and that the total area in extracted ion chronogram was fairly consistent. While a net decrease in response of approximately 20% was observed for the 250 mL sample, it is reasonable to assume that the recovery could be increased with additional capture time for this most dilute sample.
Along with analyte enrichment, all capture methods inherently reach a capacity after which no additional analyte can be retained. Again, this property is dependent on the surface area of the material and the density of the capture agents on the surface. To test the capacity of the mesh substrates used in this study, experiments were also conducted wherein a constant sample volume (5 mL) was spiked with increasing amounts of captopril (0.25 μmoles, 1 μmole, 5 μmoles, 20 μmoles) to create a series of solutions ranging from 50 μM to 4 mM. In these experiments each sample mesh was scanned twice, once for the presence of captured captopril and once for the presence of unbound VICATSH, as measured by the detection of IABA. These results followed the expected inverse relationship of analyte abundance (See Supporting Information Figure S8). As the amount of captopril in solution increases, the amount of captopril captured by VICATSH increases, and thus the observed response for captopril also increases. Simultaneously, increases in captopril concentration resulted in more captopril capture by VICATSH and corresponding reductions in the abundance of free VICATSH. Ultimately, the response for captopril appears to plateau at analyte loading amounts around 20 μmoles, thereby indicating that the mesh has approached capacity. The corresponding decrease in the detection of IABA as the amount of captopril increases provides additional evidence that the majority of VICATSH bound to the surface was reacted.
Simultaneous Capture of Multiple Analytes in Urine
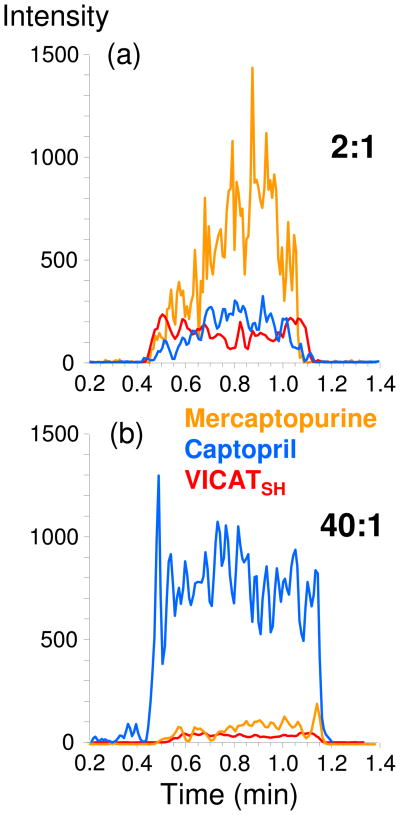
The previous experiments investigated the capture of a single sulfhydryl analyte in a variety of matrices, but did not directly address the competition between multiple sulfhydryl analytes in the same solution. Therefore, several experiments were conducted to investigate the performance of the modified meshes when two sulfhydryl analytes (mercaptopurine and captopril) were present at varying amounts and at various ratios. The results of two of these experiments are presented in Figure 7.
Figure 7.
Overlaid extracted ion chronograms for surface-enhanced TM-DESI analysis of mixtures of captopril and mercaptopurine in urine. The molar ratio of analytes is given as captopril:mercaptopurine. In each case the chronogram corresponds to the primary MS3 ion listed in Table 1.
In the first example (Figure 7a) 15 μmoles of captopril and 7.5 μmoles of mercaptopurine were spiked into a 40 mL urine sample, thereby resulting in an analyte ratio of 2:1 (captopril:mercaptopurine) and a total sulfhydryl amount of 22.5 μmoles (neglecting any endogenous thiols). The results illustrate several key points: 1) both captopril and mercaptopurine could be captured and identified; 2) the response for mercaptopurine was larger than for captopril even though twice as much captopril was present, potentially indicating a more facile capture of mercaptopurine or higher ionization efficiency of the derivatized analyte, and 3) the response for IABA (displayed as VICATSH in Figure 7) was relatively low indicating that a majority of the VICATSH on the surface had been reacted, a result that was consistent with the previous experiments that specifically investigated mesh capacity.
In the second example (Figure 7b), 1 μmole of mercaptopurine and 40 μmoles of captopril were spiked into 40 mL urine samples, thereby resulting in an analyte ratio of 40:1 (captopril:mercaptopurine) and a total sulfhydryl amount of 41 μmoles. These results also illustrate several key points: 1) the responses for the two analytes change in accordance with their molar amounts; 2) a sulfhydryl analyte of lower concentration can be detected in the presence of another of higher concentration, and 3) the total amount of 40 μmoles (mostly from captopril) results in near total consumption of VICATSH on the mesh. Results for additional experiments, in which the ratio of mercaptopurine to captopril ranged from equimolar to 40:1, produced similar conclusions. Likewise, when the total amount of sulfhydryl analyte was reduced to the nmole range instead of μmoles, both analytes were detected but the response for IABA was larger than that of captopril or mercaptopurine. This result echoes the data presented in Figure 4 for a single analyte.
While the data presented in Figure 7 demonstrate that multiple analytes with varying concentrations can be analyzed, it is expected that there is a limit to the tolerable difference in concentrations. Ultimately, as the ratio of the major component to the minor component becomes very large, detection of the minor component will be precluded simply based on stoichiometric considerations. In this case, the major component would become an interference and a more specific capture agent that was selective against it would have to be utilized. This phenomena is not specific to surface-enhanced TM-DESI, but rather a challenge of chemoselective and affinity capture in general.
Conclusions
The methods and results presented herein illustrate the enormous potential for coupling chemoselective capture methods to ambient ionization mass spectrometry. In this case, targeted sulfhydryl analytes were successfully extracted from complex biological matrices, and analyte enrichment facilitated the rapid screening of selected targets via tandem mass spectrometry which provided additional selectivity beyond that already provided by the specific capture agent. The methods used to produce the selective mesh materials (i.e., nylon hydrolysis, carbodiimide mediated coupling, avidin-biotin binding) are well documented and quality control assays can be easily incorporated as a means of discarding poorly constructed materials prior to their use. Furthermore, the covalent capture of analytes allows the use of an ample rinsing step to remove undesired matrix components, resulting in the dramatic reduction of easily ionized interferences that tend to suppress low abundance ions in many desorption electrospray ionization analyses.
While this methodology specifically focuses on the capture of sulfhydryl analytes, the surface-enhanced TM-DESI-MS strategy is a tunable approach and should be amenable to the selective capture, release, and analysis of other targeted molecules from complex mixtures through the incorporation of an appropriate capture agent. Moreover, the results presented here were obtained using immediately available mesh materials and established derivatization methods. Continued research devoted to developing new mesh materials and increasing electrospray transmission, capture agent density, and reaction yields will result in improved performance.
Supplementary Material
Acknowledgments
Support from NIH (Grants 1RC1AG035713, J.S.B., and DK67869, M.H.G.) and the Welch Foundation (F1155 to J.S.B.) is gratefully acknowledged.
References
- 1.Poetz O, Hoeppe S, Templin MF, Stoll D, Joos TO. Proteomics. 2009;9:1518–1523. doi: 10.1002/pmic.200800842. [DOI] [PubMed] [Google Scholar]
- 2.Guillo C, Roper MG. Analyst. 2008;133:1481–1485. doi: 10.1039/b808735k. [DOI] [PMC free article] [PubMed] [Google Scholar]
- 3.Carlson EE, Cravatt BF. Nature Methods. 2007;4(5):429–435. doi: 10.1038/nmeth1038. [DOI] [PubMed] [Google Scholar]
- 4.Carlson EE, Cravatt BF. J Am Chem Soc. 2007;129:15780–15782. doi: 10.1021/ja0779506. [DOI] [PubMed] [Google Scholar]
- 5.Burnette WN. Anal Biochem. 1981;112(2):195–203. doi: 10.1016/0003-2697(81)90281-5. [DOI] [PubMed] [Google Scholar]
- 6.Southern EM. J Mol Biol. 1975;98(3):503–17. doi: 10.1016/s0022-2836(75)80083-0. [DOI] [PubMed] [Google Scholar]
- 7.Urh M, Simpson D, Zhao K. Meth Enzymology. 2009;463:417–438. doi: 10.1016/S0076-6879(09)63026-3. [DOI] [PubMed] [Google Scholar]
- 8.Methods Mol Biol. Totowa, N. J.: 1995. ELISA: Theory and Practice. [DOI] [PubMed] [Google Scholar]
- 9.Anker JN, Hall WP, Lyandres O, Shah NC, Zhao J, Van Duyne RP. Nature Materials. 2008;7:442–453. doi: 10.1038/nmat2162. [DOI] [PubMed] [Google Scholar]
- 10.Nelson RW. Mass Spectrom Rev. 1997;16:353–376. doi: 10.1002/(SICI)1098-2787(1997)16:6<353::AID-MAS3>3.0.CO;2-G. [DOI] [PubMed] [Google Scholar]
- 11.Lewisa WG, Shen Z, Finna MG, Siuzdaka G. Int J Mass Spectrom. 2003;226:107–116. [Google Scholar]
- 12.Hutchens TW, Yip TT. Rapid Comm Mass Spectrom. 1993;7:576–580. [Google Scholar]
- 13.Mrksich M. ACS Nano. 2008;2(1):7–18. doi: 10.1021/nn7004156. [DOI] [PMC free article] [PubMed] [Google Scholar]
- 14.Patrie SM, Mrksich M. Anal Chem. 2007;79:5878–5887. doi: 10.1021/ac0701738. [DOI] [PMC free article] [PubMed] [Google Scholar]
- 15.Nelson RW. Mass Spec Rev. 1997;16:353–376. doi: 10.1002/(SICI)1098-2787(1997)16:6<353::AID-MAS3>3.0.CO;2-G. [DOI] [PubMed] [Google Scholar]
- 16.Tang N, Tornatore P, Weinberger SR. Mass Spec Rev. 2004;23:34–44. doi: 10.1002/mas.10066. [DOI] [PubMed] [Google Scholar]
- 17.Vekey K, Telekes A, Vertes A. Med App of Mass Spectrom. 2008:379–406. [Google Scholar]
- 18.Petricoin EF, Liotta LA. In: Prot in Cancer Res. Liebler DC, editor. 2005. pp. 117–131. [Google Scholar]
- 19.Lomas Lee O, Weinberger Scot R. In: Handbook of Biosensors and Biochips. Marks RS, editor. Vol. 2. 2007. pp. 885–894. [Google Scholar]
- 20.Hillenkamp F, Strupat K, Karas M, Eckerskorn C, Lottspeich F. Anal Chem. 1994:464–470. [Google Scholar]
- 21.Vestling MM, Fenselau C. Anal Chem. 1994;66:471–477. [Google Scholar]
- 22.Brockman AH, Orlando R. Rapid Comm Mass Spectrom. 1994;10:1688–1692. doi: 10.1002/(SICI)1097-0231(199610)10:13<1688::AID-RCM717>3.0.CO;2-3. [DOI] [PubMed] [Google Scholar]
- 23.Blackledge JA, Alexander AJ. Anal Chem. 1995;67:843–848. doi: 10.1021/ac00101a009. [DOI] [PubMed] [Google Scholar]
- 24.Wang H, Tseng K, Lebrilla CB. Anal Chem. 1999;71:2014–2020. doi: 10.1021/ac981347b. [DOI] [PubMed] [Google Scholar]
- 25.Suen SY, Liu YC, Chang CS. J Chrom B. 2003;797:305–319. doi: 10.1016/s1570-0232(03)00490-2. [DOI] [PubMed] [Google Scholar]
- 26.Raska CS, Parker CE, Dominski Z, Marzluff WF, Glish GL, Pope MR, Borchers CH. Anal Chem. 2002;74:3429–3433. doi: 10.1021/ac0111199. [DOI] [PubMed] [Google Scholar]
- 27.Tetsuyuki A, Takao Y. Proteome Science. 2009;7:14–17. [Google Scholar]
- 28.Hogstrand C, Balesaria S, Glover CN. Comp Biochem Physiol B. 2002;133:523–535. doi: 10.1016/s1096-4959(02)00125-2. [DOI] [PubMed] [Google Scholar]
- 29.Takats Z, Wiseman JM, Gologan B, Cooks RG. Science. 2004;306:471–473. doi: 10.1126/science.1104404. [DOI] [PubMed] [Google Scholar]
- 30.Cooks RG, Ouyang Z, Takats Z, Wiseman JM. Science. 2006;311:1566–1569. doi: 10.1126/science.1119426. [DOI] [PubMed] [Google Scholar]
- 31.Takats Z, Wiseman JM, Cooks RG. J Mass Spectrom. 2005;40:1261–1275. doi: 10.1002/jms.922. [DOI] [PubMed] [Google Scholar]
- 32.Cody RB, Laramee JA, Durst HD. Anal Chem. 2005;77:2297–2302. doi: 10.1021/ac050162j. [DOI] [PubMed] [Google Scholar]
- 33.Huang G, Chen H, Zhang X, Cooks RG, Ouyang Z. Anal Chem. 2007;79:8327–8332. doi: 10.1021/ac0711079. [DOI] [PubMed] [Google Scholar]
- 34.Nyadong L, Green MD, De Jesus VR, Newton PN, Fernandez FM. Anal Chem. 2007;79:2150–2157. doi: 10.1021/ac062205h. [DOI] [PubMed] [Google Scholar]
- 35.Wu C, Ifa DR, Manicke NE, Cooks RG. Anal Chem. 2009;81:7618–7624. doi: 10.1021/ac901003u. [DOI] [PMC free article] [PubMed] [Google Scholar]
- 36.Chipuk JE, Brodbelt JS. J Am Soc Mass Spectrom. 2008;19:1612–1620. doi: 10.1016/j.jasms.2008.07.002. [DOI] [PubMed] [Google Scholar]
- 37.Chipuk JE, Brodbelt JS. J Am Soc Mass Spectrom. 2009;20:584–592. doi: 10.1016/j.jasms.2008.11.018. [DOI] [PubMed] [Google Scholar]
- 38.Chipuk JE, Gelb MH, Brodbelt JS. Anal Chem. 2010;82:16–18. doi: 10.1021/ac902101e. [DOI] [PMC free article] [PubMed] [Google Scholar]
- 39.Srinivas NR, Mamidi RNVS. Biomed Chromatogr. 2003;17:285–291. doi: 10.1002/bmc.256. [DOI] [PubMed] [Google Scholar]
- 40.Glowacki R, Bald E. J Liq Chrom Rel Technol. 2009;32:2530–2544. [Google Scholar]
- 41.Kuśmierek K, Glowacki R, Bald E. Anal Bioana l Chem. 2006;385:855–860. doi: 10.1007/s00216-006-0454-x. [DOI] [PubMed] [Google Scholar]
- 42.Bottari P, Aebersold R, Turecek F, Gelb MH. Bioconjugate Chem. 2004;15(2):380–388. doi: 10.1021/bc034174s. [DOI] [PubMed] [Google Scholar]
- 43.Lu Y, Bottari P, Turecek F, Aebersold R, Gelb MH. Anal Chem. 2004;76:4104–4111. doi: 10.1021/ac049905b. [DOI] [PubMed] [Google Scholar]
- 44.Edelman GM, Rutishauser U, Millette CF. Proc Nat Acad Sci USA. 1971;68:2153–2157. doi: 10.1073/pnas.68.9.2153. [DOI] [PMC free article] [PubMed] [Google Scholar]
- 45.Isgrove FH, Williams RJH, Niven GW, Andrews AT. Enzyme and Microbial Technology. 2001;28:225–232. doi: 10.1016/s0141-0229(00)00312-4. [DOI] [PubMed] [Google Scholar]
- 46.Tang J, He N, Nie L, Xiao P, Chen H. Surface Science. 2004;550:26–34. [Google Scholar]
- 47.Sojback R, Nygren J, Kubista M. Spectrochimica Acta Part A. 1995;51:L7–L21. [Google Scholar]
- 48.Nelson KJ, Day AE, Zeng BB, King SB, Poole LB. Anal Biochem. 2008;375:187–195. doi: 10.1016/j.ab.2007.12.004. [DOI] [PMC free article] [PubMed] [Google Scholar]
- 49.Olejnik J, Sonar S, Krzymañska-Olejnik, Rothschild KJ. Proc Natl Acad Sci. 1995;92:7590–7594. doi: 10.1073/pnas.92.16.7590. [DOI] [PMC free article] [PubMed] [Google Scholar]
- 50.Bai X, Li Z, Jockusch S, Turro NJ, Ju J. Proc Natl Acad Sci. 2003;100(2):409–413. doi: 10.1073/pnas.242729099. [DOI] [PMC free article] [PubMed] [Google Scholar]
- 51.Olejnik J, Lüdemann HC, Krzymañska-Olejnik E, Berkenkamp S, Hillenkamp F, Rothschild KJ. Nuc Acids Res. 1999;27:4626–4631. doi: 10.1093/nar/27.23.4626. [DOI] [PMC free article] [PubMed] [Google Scholar]
- 52.Umrethia M, Ghosh PK, Majithya R, Murthy RSR. Cancer Inv. 2007;25:117–123. doi: 10.1080/07357900701224862. [DOI] [PubMed] [Google Scholar]
- 53.Longo A, Di Toro M, Galimberti C, Carenzi A. J Chromatogr. 1991;562(1–2):639–64. doi: 10.1016/0378-4347(91)80614-i. [DOI] [PubMed] [Google Scholar]
- 54.Richer C, Giroux B, Plouin PF, Maarek B, Giudicelli JF. Br J Clin Pharmacol. 1984;17:243–250. doi: 10.1111/j.1365-2125.1984.tb02338.x. [DOI] [PMC free article] [PubMed] [Google Scholar]
- 55.Seiwert B, Karst U. Anal Chem. 2007;79:7131–7138. doi: 10.1021/ac071016b. [DOI] [PubMed] [Google Scholar]
- 56.Liang SC, Wang H, Zhang ZM, Zhang HS. Anal Bioanal Chem. 2005;381:1095–1100. doi: 10.1007/s00216-004-3006-2. [DOI] [PubMed] [Google Scholar]
- 57.Kuśmierek K, Glowacki R, Bald E. Anal Bioanal Chem. 2006;385:855–860. doi: 10.1007/s00216-006-0454-x. [DOI] [PubMed] [Google Scholar]
- 58.Inoue T, Kirchhoff JR. Anal Chem. 2002;74(6):1349–1354. doi: 10.1021/ac0108515. [DOI] [PubMed] [Google Scholar]
- 59.Zacharisa CK, Tzanavaras PD, Themelisa DG. J of Pharm Biomed Anal. 2009;50:384–391. doi: 10.1016/j.jpba.2009.05.020. [DOI] [PubMed] [Google Scholar]
- 60.Park EK, Watanabe T, Gee SJ, Schenker MB, Hammock BD. J Agric Food Chem. 2008;56:333–336. doi: 10.1021/jf072433s. [DOI] [PubMed] [Google Scholar]
Associated Data
This section collects any data citations, data availability statements, or supplementary materials included in this article.


