Abstract
Atrophic changes of the hippocampus are typically regarded as an early sign of Alzheimer’s dementia (AD). Using the radial distance atrophy mapping approach, we compared the longitudinal MRI data of 10 cognitively normal elderly subjects who remained normal at 3-year and 6-year follow-up (NL-NL) and 7 cognitively normal elderly subjects who were diagnosed with mild cognitive impairment (MCI) 2.8 (range 2.0–3.9) and with AD 6.8 years (range 6.1–8.2) after baseline (NL-MCIAD). 3D statistical maps revealed greater hippocampal atrophy in the NL-MCIAD relative to the NL-NL group at baseline (left p = 0.05; right p = 0.06) corresponding to 10–15% CA1, and 10–25% subicular atrophy, and bilateral differences at 3-year follow-up (left p = 0.001, right p < 0.02) corresponding to 10–30% subicular, 10–20% CA1, and 10–20% newly developed CA2-3 atrophy. This preliminary study suggests that excess CA1 and subicular atrophy is present in cognitively normal individuals predestined to decline to amnestic MCI, while progressive involvement of the CA1 and subiculum, and atrophy spreading to the CA2-3 subfield in amnestic MCI, suggests future diagnosis of AD.
Keywords: Alzheimer’s disease (AD), Mild cognitive impairment (MCI), Magnetic resonance imaging (MRI), Memory, Hippocampus, Predicting cognitive decline
1. Introduction
Alzheimer’s disease (AD) is the most common neurodegenerative disorder. In 2003, there were 28 million AD patients worldwide, leading to an estimated 156 billion US dollars in direct and indirect healthcare costs (Wimo et al., 2006). Given the increased life expectancy and the graying of the baby boomer generation, we will soon be faced with substantially increased numbers of elderly persons with cognitive complaints in need of evaluation and anti-dementia treatment (Hebert et al., 2003). Recently the AD research spotlight has turned to the pre-symptomatic (also called latent) stage of AD, characterized by silent yet relentless spread of AD pathology through the brain. Reports of profound AD-type pathologic changes in the brains of cognitively normal elderly (Haroutunian et al., 1998; Price and Morris, 1999) emphasize the pressing need for a robust and reliable pre-symptomatic diagnostic marker. In addition to cerebrospinal fluid markers, noninvasive or mildly invasive neuroimaging techniques such as magnetic resonance imaging (MRI), positron emission tomography (PET) and amyloid imaging have received considerable attention (Dubois et al., 2007). Some markers of hippocampal damage have been shown to be useful as predictors of future conversion of mild cognitive impairment (MCI) to AD (Apostolova et al., 2006b; de Leon et al., 1993; Mosconi, 2005; Mosconi et al., 2007; Silverman and Thompson, 2006). However, the potential usefulness of hippocampal measures for predicting cognitive decline from normal aging to MCI is emerging (de Leon et al., 2001; Mosconi et al., 2007; Rusinek et al., 2003).
The hippocampus, one of the first brain regions affected by AD pathology, has been extensively studied with neuroimaging. The most commonly used technique for analyzing images of the hippocampus is the region of interest (ROI) method. It has been applied to most neurodegenerative disorders and especially to AD. ROI studies rely on a simple comparison of the average hippocampal volume between study groups. Using the ROI method, Jack et al. reported the annual hippocampal atrophy rate in normal elderly who remain cognitively intact to be 1.4% per year, but 3.3% per year in normal elderly who decline to MCI or AD (Jack et al., 2004). Newer analysis techniques can model and detect regional hippocampal changes in 3D; these have recently been used to study normal aging and AD and have reported subtle yet statistically significant shape changes in AD (Frisoni et al., 2006; Thompson et al., 2004; Wang et al., 2003), and MCI (Apostolova et al., 2006a, b; Becker et al., 2006). Some of these studies (Apostolova et al., 2006a,b) demonstrated a subregion-specific hippocampal atrophy progression that corresponds to the reported neuropathological spread of neurofibrillary tangles through the hippocampal formation (Bobinski et al., 1998,2000). Even so, no studies have yet examined the subregional hippocampal changes during decline from normal cognition to MCI and subsequently to AD.
In the present study we apply a method known as hippocampal radial distance mapping to compare baseline and 3-year follow-up 3D hippocampal maps of 17 cognitively normal subjects, retrospectively divided into those who remained cognitively stable on all annual cognitive assessments and those who carried a diagnosis of MCI at their 3-year follow-up. All subjects from the second group met diagnostic criteria for probable AD on average 6.75 years after their initial evaluation (range 6–8.2 years) while all subjects from the first group continued to be cognitively normal during an average follow-up of 9.2 years (range 6–13.6 years). We hypothesized that subjects who declined to MCI and subsequently AD (NL-MCIAD) would show atrophic changes in hippocampal regions corresponding to the subiculum and CA1 subfield as compared to the non-decliners (NL-NL).
2. Methods
2.1. Subjects
We retrospectively selected 17 subjects from a larger pool of participants, all high-functioning healthy elderly individuals at the time of the first examination, of whom 7 (41%) were known to have declined to MCI within 3(±1) years (mean time to MCI diagnosis 2.8 years; S.D. = 0.8 years; range 2.0–3.9 years) and received a diagnosis of probable AD 6 yearsorlonger after their baseline evaluation (mean 6.8 years; S.D. = 1.0 year; range 6.1–8.2 years). All subjects received yearly cognitive and neuropsychological examinations. They all had a baseline and a 3-year structural MRI scan. Our subjects were community-residing volunteers who responded to advertisements or were spouses and/or caregivers of patients with dementia who were being evaluated at the New York University (NYU) AD Research Center. All subjects signed informed consent for research participation and were administered an extensive battery of screening and diagnostic tests at baseline and follow-up inclusive of medical, neurological, psychiatric, and family history assessments, MR imaging, and a comprehensive battery of neuropsychometric tests. The measures used to assess cognition and memory included the following: the Global Deterioration Scale (GDS), with scoring based on results of extensive clinical interviews (Reisberg et al., 1988); the Mini-Mental State Examination (MMSE) (Folstein et al., 1975); and the Guild Memory Test (Gilbert et al., 1968), which included immediate and delayed recall of paragraphs, verbal and visual paired associates, digits-forward-and-backward testing, digit symbol substitution, and a vocabulary test. Also used were tests of recall of a shopping list, visual recognition memory, confrontational naming, and delayed spatial recall (Flicker et al., 1993). The baseline selection criteria were a GDS score of 1 or 2, MMSE≥ 28, age of 65 years or older, no contraindications to MR imaging, absence of gross brain abnormalities, and no evidence of neurologic, medical, or psychiatric conditions that could affect cognition. At baseline, all subjects were free of clinically detected cognitive impairmentinmemory, concentration, orientation, language, executive function, and activities of daily life. The analyses reported here were approved by the NYU Institutional Review Board.
2.2. Cognitive outcomes
The subjects received annual cognitive assessments for at least 6 years (range 6.0–13.6 years) to ascertain which subjects remained cognitively healthy and which subjects experienced cognitive decline. Decline to MCI was defined using guidelines similar to those advocated by Petersen and colleagues at the Mayo Clinic (Petersen et al., 2001). MCI was defined by the following: (a) a GDS score of 3, indicating a decline in functioning (including memory complaints) corroborated by an informant and determined by the examining physician; (b) objective memory impairments, as demonstrated by a neuropsychologic memory test score 1.5 S.D. below that of healthy elderly individuals of matching age, sex, and education; and (c) the subject not meeting criteria for dementia. The statistical distribution of the memory test scores required in point b was derived from a database of 282 longitudinal observations of healthy subjects 60–87 years of age. The diagnosis of AD was rendered according to the National Institute of Neurologic and Communicative Disorders and Stroke and the AD and Related Disorders Association (NINCDS-ADRDA) criteria (McKhann et al., 1984).
2.3. Imaging data acquisition and analysis
Two MR examinations were performed in all subjects 3(±1) years apart, and within 2 months of the clinical and neuropsychological exams. Three-dimensional Tl-weighted MR imaging was performed with a 1.5-T MR imaging unit (Signa; GE Medical Systems, Milwaukee, WI) by using a spoiled gradient-recalled acquisition in the steady state (SPGR) sequence with the following acquisition parameters: repetition time ms/echo time ms, 35/9; number of signals acquired, one; flip angle, 60°; acquisition matrix, 256 × 192; section thickness, 1.3 mm; field of view, 18 cm; and 124 contiguous coronal sections. The MR data from 10 out of the 17 subjects were previously included in another publication that used a regional brain boundary shift integral approach to evaluate changes in the medial temporal lobe region (Rusinek et al., 2003).
The imaging analysis protocol has been explained in details elsewhere (see (Thompson et al., 2004)). Briefly, after image inhomogeneity correction and 9-parameter linear spatial normalization to the ICBM53 brain atlas, all hippocampi were manually traced by one experienced tracer (AG, intra-rater reliability α = 0.98, inter-rater reliability α = 0.9) following an extensively validated hippocampal tracing protocol (Jack et al., 1995). 3D hippocampal mesh models were computed and the central core of each hippocampal structure derived, as a medial curve threading down the centroid of each individual’s hippocampus. The radial distance (i.e., the distance from the central core to each surface point) was determined and digitally recorded at each 3D coordinate location of the hippocampal mesh models. Average group hippocampal models for both baseline and follow-up were derived and statistically compared. (For a schematic of this method see Apostolova and Thompson, 2007; Thompson et al., 2004.) Permutation tests with a threshold set at p < 0.01 were applied to the hippocampal statistical maps (p maps) to control for multiple comparisons and provide an overall, global p value for the group differences shown in the map. A detailed explanation of the permutation-based correction for multiple comparisons is provided elsewhere (Thompson et al., 2004).
Additionally we investigated the associations between hippocampal radial distance and one global (MMSE) and two verbal memory cognitive measures (paired associates delayed recall and paragraph delayed recall). Individual cognitive scores were used as covariates in a general linear model that predicted hippocampal radial distance in each subject. The resulting 3D hippocampal maps showed the strength of that correlation (i.e., the correlation coefficient) at each point of the hippocampal surface. Significance maps were created and corrected for multiple comparisons by permutation testing using a threshold of p < 0.01. We hypothesized that areas that showed the greatest between-group differences at baseline and follow-up would also demonstrate strong correlations between atrophy and verbal memory and MMSE performance.
Between-group volumetric comparisons were separately performed for each time point via two-sample T-test and confirmed via one-way Analysis of Variance with Tukey-Kramer post hoc test. 3-year atrophy rates and 95% confidence intervals were computed with standard Repeated Measures Analysis of Variance via Wilks’ Lambda test (i.e. null hypothesis no time by group effects) with conventional Alpha set at 0.05. Two a priori assumptions underpinned our analyses: that the annual atrophy rate was linear and that hippocampal volume loss was not reversible. 1-year atrophy rates and their respective 95% confidence intervals were thereby determined as the negative one third of the natural logarithm of (1 minus the 3-year atrophy rate) and compared for changes over time.
3. Results
Subjects’ demographic data are shown in Table 1. Subjects who declined to MCIAD (NL-MCIAD) had fewer years of education and contained a larger proportion of women and ApoE-4 carriers (57% NL-MCIAD vs. 30% NL-NL subjects) relative to the stable NL (NL-NL) group, although these differences did not reach statistical significance. The NL-MCIAD group performed significantly worse on the paired associates test both at baseline and at 3-year follow-up and on the paragraph delayed recall test at 3-year follow-up. There were no baseline or 3-year follow-up differences in MMSE scores between the two groups. The hippocampal volumetric data and the annualized atrophy rates for each group are shown in Table 2. The left hippocampal volume was significantly smaller in the NL-MCIAD relative to the NL-NL group both at baseline (p = 0.04) and at 3-year follow-up (p = 0.006) while the right hippocampus only showed between-group difference at 3-year follow-up (p = 0.05). Repeated measures ANOVA showed significant Time and Group effects for both the left (Time F = 8.12, p = 0.01; Group F = 7.8, p = 0.01) and right hippocampus (Time F = 9.65, p < 0.01; Group F = 4.65, p < 0.05) while the interaction term (Time × Group) was not significant.
Table 1.
Demographic and cognitive data
| NL-NL |
NL-MCIAD |
Statistic | p value | |||
|---|---|---|---|---|---|---|
| Mean | S.D. | Mean | S.D. | |||
| Age (years) | 69.1 | 2.6 | 72.2 | 4.5 | T | 0.14 |
| Gender M:F | 4:6 | N/A | 0:7 | N/A | χ2 | 0.06 |
| Education (years) | 16.4 | 2.2 | 14 | 2.3 | T | 0.052 |
| ApoE4 (pos/neg) | 3/7 | N/A | 4/3 | N/A | χ2 | 0.3 |
| Time to follow-up MRI (years) | 3.2 | 0.8 | 2.9 | 0.8 | T | 0.44 |
| Time to clinical follow-up (years) | 2.8 | 1.1 | 2.8 | 0.8 | T | 0.92 |
| Baseline MMSE | 29.7 | 0.7 | 29.1 | 0.9 | T | 0.2 |
| Follow-up MMSE | 29.2 | 1.3 | 27.4 | 2.3 | T | 0.1 |
| Baseline GDS | 2 | 0 | 1.9 | 0.4 | T | 0.4 |
| Follow-up GDS | 1.9 | 0.32 | 3.0 | 0 | T | <0.001 |
| Baseline paragraph recall | 5.8 | 2.2 | 3.7 | 3.6 | T | 0.21 |
| Follow-up paragraph recall | 6.9 | 1.6 | 2.7 | 2.8 | T | 0.007 |
| Baseline PADR | 10.5 | 3.0 | 6.7 | 2.9 | T | 0.02 |
| Follow-up PADR | 10.6 | 2.1 | 4.7 | 3.8 | T | 0.005 |
PADR—paired associates delayed recall. Follow-up is at the 3-year time point.
Table 2.
Hippocampal volumetric data
| Group | Side | Volume, mm3—mean (S.D.) |
Annualized volume loss % (95% CI) | |
|---|---|---|---|---|
| Baseline | Follow-up | |||
| NL-NL | Left hippocampus | 3088 (527) | 2963 (416) | 1.1% (−1.1; 3.27) |
| Right hippocampus | 3194 (550) | 2984 (514) | 2.0% (−0.1; 4.2) | |
| NL-MCIAD | Left hippocampus | 2602 (793) | 2309 (774) | 3.7% (1.1; 6.3) |
| Right hippocampus | 2697 (846) | 2448 (813) | 3.2% (0.7; 5.8) | |
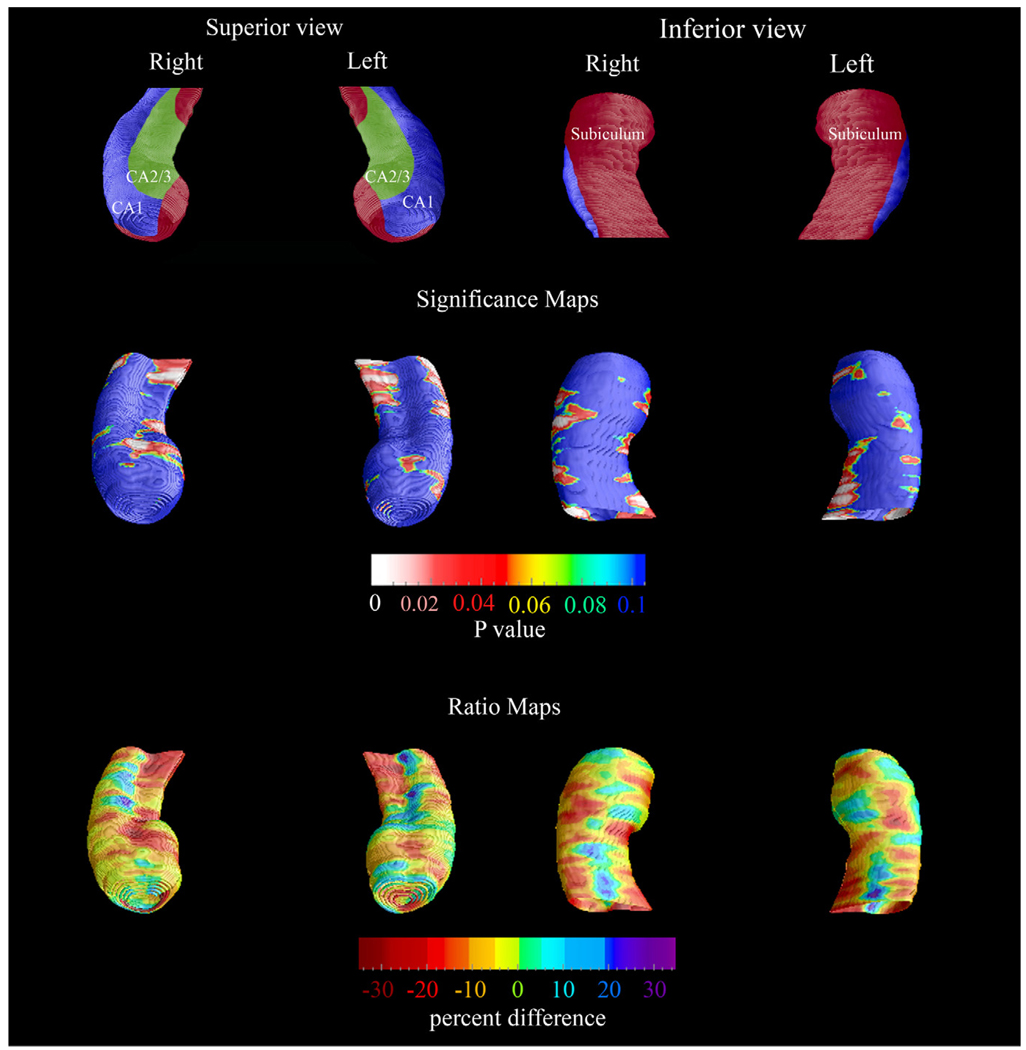
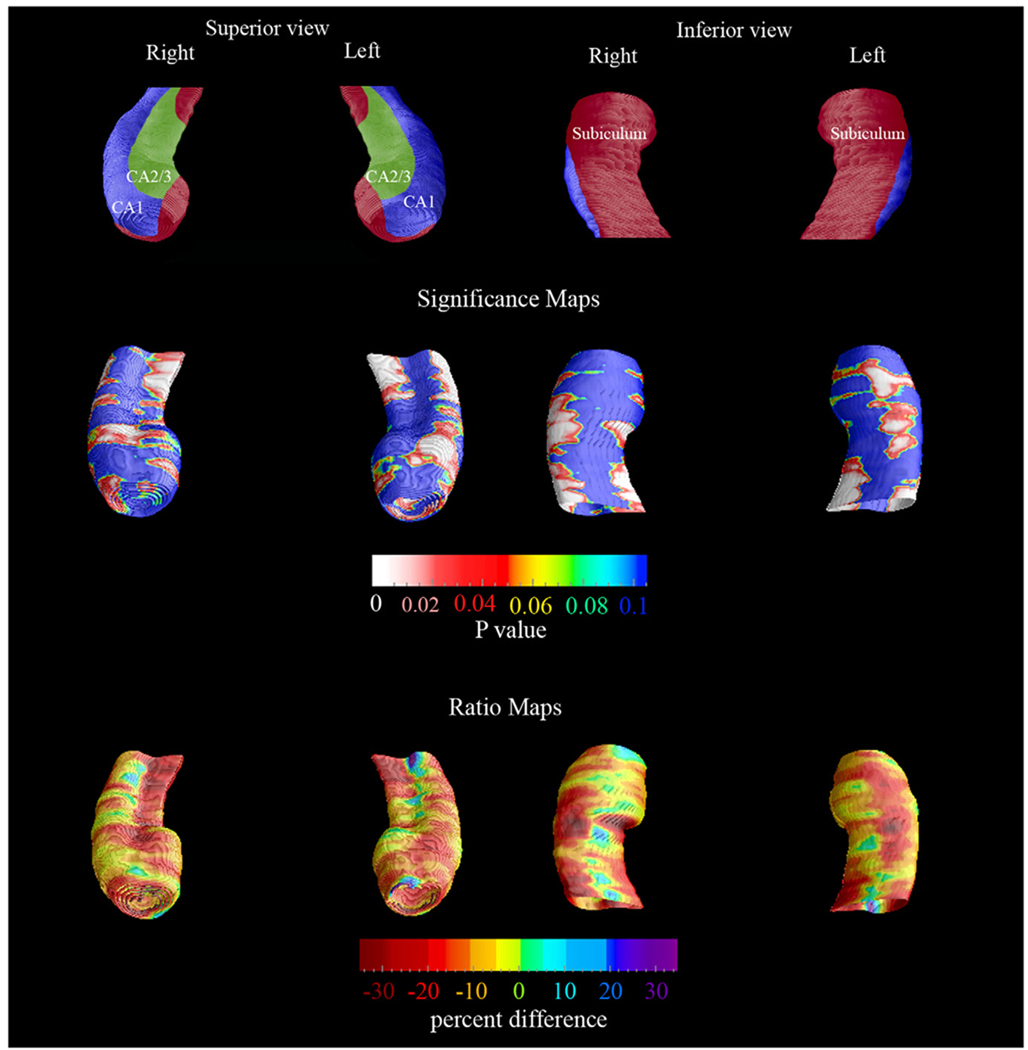
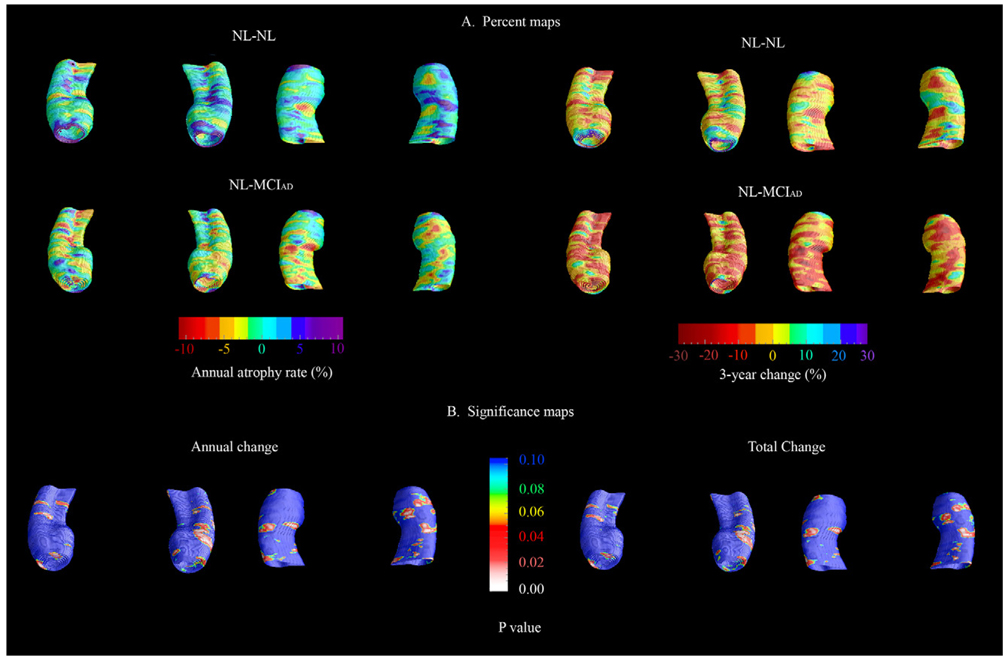
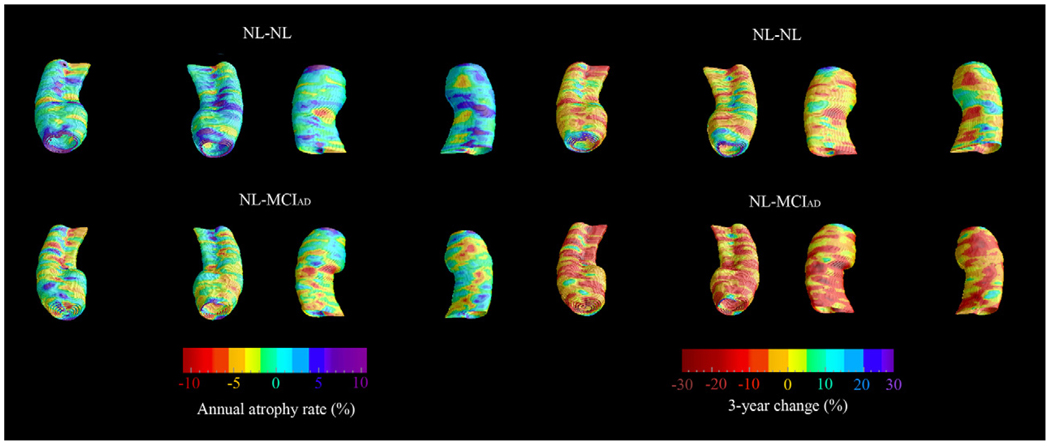
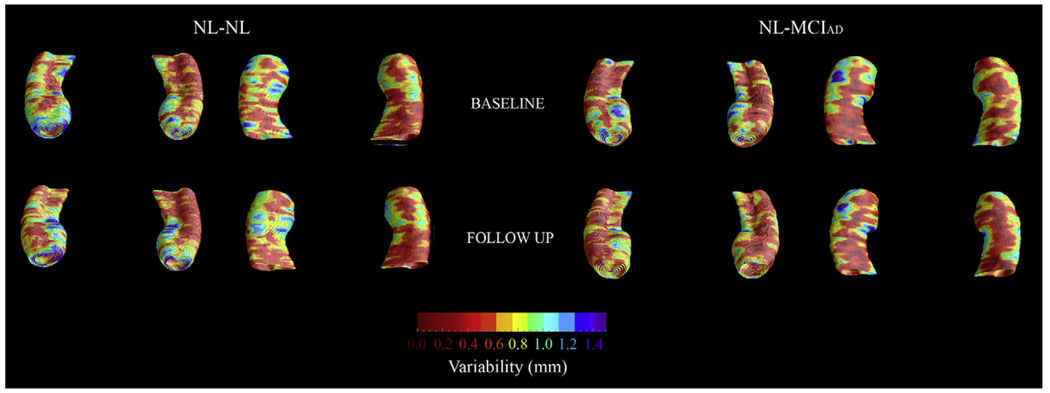
The baseline and 3-year follow-up 3-D comparison maps of the hippocampal radial distances between the NL-NL and NL-MCIAD groups are shown in Fig. 1 and Fig. 2. A 4D animation of the spread of significant changes through the hippocampus can be viewed at http://www.loni.ucla.edu/ ∼lianaa/NLtoMCI.mov. The movie frames were computed from the maps shown in the middle rows of Fig. 1 and Fig. 2 using a previously described algorithm (Thompson and Toga, 1997). We observed significant difference in the left at baseline (left pcorrected = 0.05) and a trend for significance on the right (right pcorrected = 0.06; Fig. 1 middle row). At 3-year follow-up the differences were much more pronounced (left pcorrected = 0.001, right pcorrected < 0.02; Fig. 2 middle row). At baseline, the NL-MCIAD group showed up to 30% greater atrophy in the subiculum and up to 20% greater atrophy in the CA1 area relative to the NL-NL group (Fig. 1, bottom row). At 3-year follow-up, the subicular and CA1 atrophic changes appeared greater both spatially and in magnitude. Between-group differences were also seen in the CA2 and CA3 areas at 3-year follow-up (Fig. 2, bottom row). Quantitative maps of the longitudinal within-group changes can be seen in Fig. 3 and Fig. 4. As expected the NL-MCIAD group demonstrated substantially higher annual and global atrophy rates throughout the hippocampal surface. The interim change (i.e., 3-year change from baseline to follow-up computed by subtracting the ratio maps at baseline from those at follow-up) can be seen in Fig. 4. To ascertain whether the spatial pattern of statistical differences was not influenced by between-group differences in radial distance variability, we created 3D variability maps for each group and each time point (Fig. 5).
Fig. 1.
Baseline 3-D comparison maps of the NL-NL and the NL-MCIAD groups. The significance maps show regions with significantly more atrophy in the NL-MCIAD group at baseline (middle row). The ratio maps (bottom row) show the quantitative between-group differences (in %). The subfield definitions (top row) are based on Duvernoy (1988) and West and Gundersen (1990). In the significance maps, dark blue colors denote p-values of 0.1 or higher.
Fig. 2.
Follow-up 3-D comparison maps of the NL-NL and the NL-MCIAD groups. The significance maps show regions with significantly more atrophy in the NL-MCIAD group at follow-up (middle row). The ratio maps (bottom row) show the quantitative between-group differences (in %). The subfield definitions (top row) based on Duvernoy (1988) and West and Gundersen (1990). In the significance maps, dark blue colors denote p-values of 0.1 or higher.
Fig. 3.
(A) 3-D longitudinal quantitative within-group hippocampal radial atrophy maps (in %). (Annualized atrophy change—left panel, 3-year atrophy change—right panel.) (B) 3-D statistical maps comparing the annual (left panel) and 3-year (right panel) atrophy rate of the NL-NL vs. the NL-MCIAD.
Fig. 4.
3-D quantitative maps depicting the absolute interim atrophy in NL-NL vs. NL-MCIAD (i.e., 3-year change from baseline to follow-up computed by subtracting the ratio maps at baseline from those at follow-up).
Fig. 5.
3-D radial distance variability maps (in S.D.) of the NL-NL and the NL-MCIAD groups at baseline (top row) and follow-up (bottom row).
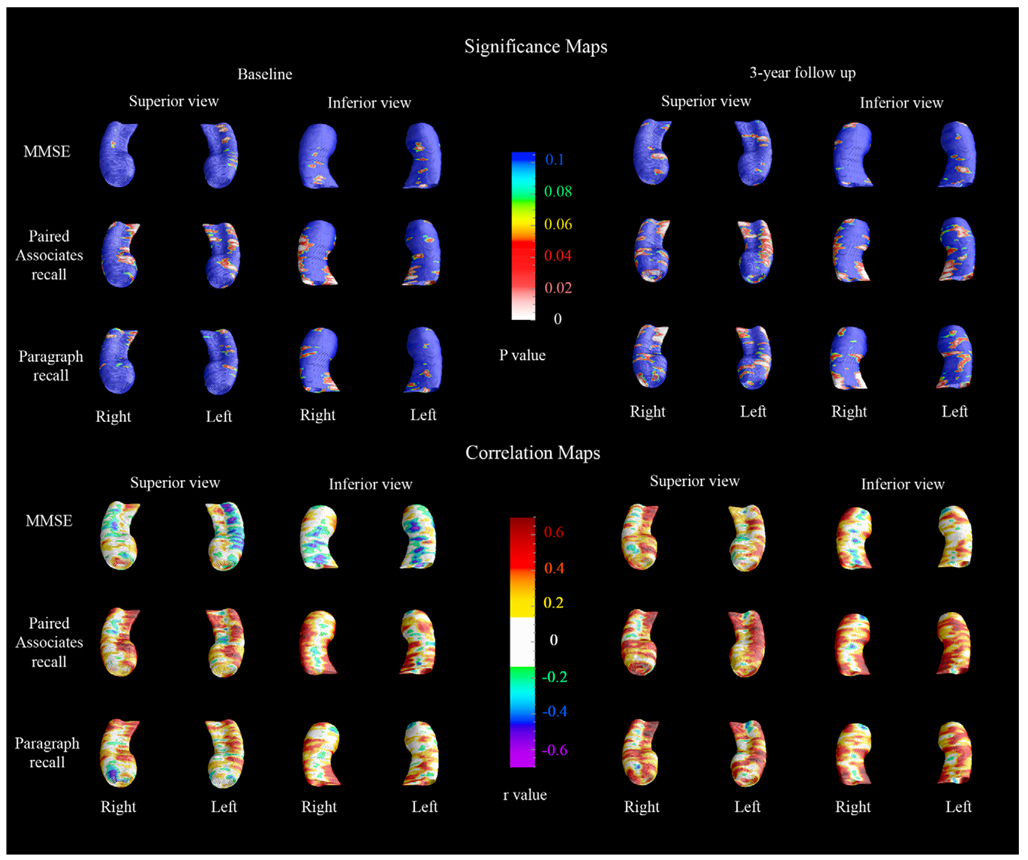
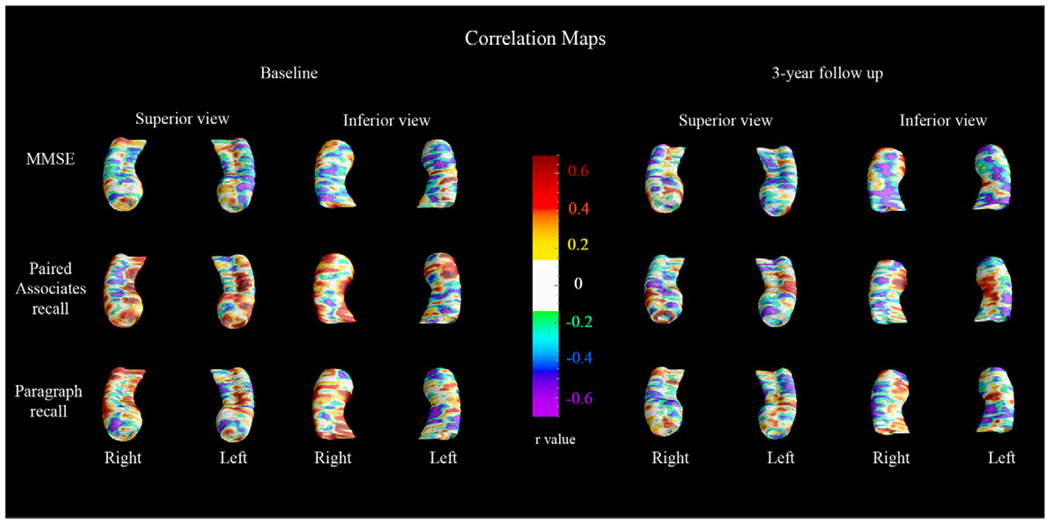
The 3-D cognitive correlation maps are shown in Fig. 6. Verbal memory performance (paragraph delayed recall and paired associates delayed recall) showed stronger correlations with hippocampal radial distance relative to MMSE both at baseline and at 3-year follow-up. As predicted, strongest cognitive correlations (r > 0.4) were observed in areas with the greatest between-group differences (see Fig. 1–Fig. 2, bottom rows and Fig. 6). In agreement with the between-group cognitive comparisons (Table 1, last column), the paired associates delayed recall score showed statistically strongest associations with hippocampal atrophy both at baseline (left pcorrected = 0.06; right pcorrected = 0.007) and follow-up (left pcorrected = 0.03; right pcorrected = 0.005) while paragraph recall only showed significant associations with the right hippocampus in follow-up (left pcorrected = 0.17; right pcorrected = 0.005). No significant associations between regional hippocampal atrophy and MMSE scores following stringent multiple comparison correction at the threshold p < 0.01 were observed. The 3D correlation maps within each group are shown in Fig. 7 and Fig. 8.
Fig. 6.
3-D cognitive correlations maps. The significance maps (top) show the regions where significant negative correlations between the given cognitive measure and hippocampal atrophy was observed. The correlation maps (bottom) show the regional strength of the cognitive correlation. In the significance maps, dark blue colors denote p-values of 0.1 or higher.
Fig. 7.
3-D cognitive correlations maps in the NL-NL group.
Fig. 8.
3-D cognitive correlations maps in the NL-MCIAD group.
4. Discussion
Neuritic plaques and neurofibrillary tangles begin accumulating years before the earliest clinical features of Alzheimer’s disease (e.g., memory loss) manifest themselves (Hyman, 1997; Price, 1997). The hippocampus is affected early in the disease process by neurofibrillary tangle accumulation, which spreads in a well-defined trajectory. The first tangles are typically seen in the entorhinal cortex; next, they spread to the CA1 and subicular areas, then to the CA2 and 3 and finally the CA4 areas of the hippocampal formation before invading the neocortex (Schonheit et al., 2004). The subfield-specific variability in tangle density and neuronal loss has been well documented. The subiculum and CA1 were reported to be the most affected and CA3 and CA4 the least affected hippocampal subfields in post-mortem AD brains (Bobinski et al., 1995, 1997). One post-mortem study of 39 nondemented elderly reported that 56% of the subjects had neurofibrillary pathology in the transentorhinal and entorhinal areas (Braak stages I and II), 28% also had moderate involvement of the CA1 and subiculum (Braak stage III) and 13% demonstrated both heavy hippocampal involvement and evidence of neocortical tangle pathology (Braak stage IV and higher) (Knopman et al., 2003). Braak stages I–IV have been assigned to more than 80% of MCI subjects at autopsy (Petersen et al., 2006). Prior MRI and PET data also suggest the vulnerability of the hippocampal formation in the early stages of AD. This has been observed in studies predicting the decline from MCI to AD and most recently from NL to MCI and AD (Apostolova et al., 2006b; de Leon et al., 1993; den Heijer et al., 2006; Mosconi et al., 2007; Rusinek et al., 2003).
We found that on average 3 years prior to the diagnosis of amnestic MCI and 6 years prior to the diagnosis of probable AD, subjects who are predestined to become demented already show disease-associated changes. Our study is the first to demonstrate that these changes initially localize to the subiculum and the CA1 subfield—the two hippocampal areas pathologically affected very early in the disease course. Upon imaging 3(±1) years later, subjects normal at baseline but now meeting MCI criteria manifested hippocampal atrophy spread to the CA2 and CA3 subfields. To our knowledge, this is the first longitudinal neuroimaging study of pre-clinical AD that maps this highly specific and orderly progression of disease-associated changes through the hippocampus. Our findings suggest CA1 and subicular involvement is predictive of cognitive decline to MCI while progressive involvement of the CA1 and subiculum and atrophy spread to the CA2-3 subfield in amnestic MCI is predictive of future diagnosis of AD.
The annual atrophy rates in the NL-NL and the NL-MCIAD group (NL-NL 1.1–2% and NL-MCIAD 3.2–3.7% annually) are comparable to those already reported in the literature (Jack et al., 2000, 1998, 2004). Both the baseline and the 3-year follow-up hippocampal comparisons demonstrated restricted areas where the NL-MCIAD group showed greater radial distance (thicker hippocampus) relative to the NL-NL group (Fig. 1 and Fig. 2, bottom row). These differences were not statistically significant. One plausible explanation is between-subject variability of hippocampal shape (Carmichael et al., 2005). However, a reassuring observation is that at 3-year follow-up, as the groups become more divergent in their cognitive performance, these areas appear much smaller relative to the baseline comparison where both groups exhibited normal cognition.
In addition we observed restricted areas of apparent gain in radial distance over time that were more pronounced in the NL-NL vs. the NL-MCIAD group (see Fig. 3). These changes were not statistically significant. There are two possible reasons for the occurrence of apparent positive change in the radial distance over time. Although presently accepted as the gold standard, hand tracing of the hippocampus or any other region of interest is not perfectly reproducible. This could lead to net gains in radial distance even when no change has occurred (i.e., in the absence of true effect). Such gains should not be interpreted as meaningful unless they beat the 0.05 significance level when corrected for multiple comparisons. Furthermore subtle movement artifacts would likewise decrease the signal-to-noise ratio and could result in non-biological effects.
In the current study we came across one occurrence of a hippocampal fissure—in the left hippocampus of one subject from the NL-MCIAD group at baseline and at 3-year follow-up. We decided to use the most conservative approach in respect to our hypotheses and did not extend the trace in the fissure (rather we have rounded the hippocampal contour and included the fissure in the trace). This ultimately leads to an increased left hippocampal volumetric measurement in this specific subject and works against our hypothesis of increased atrophy in the NL-MCIAD relative to the NL-NL group at baseline and follow-up.
Two other hippocampal imaging studies used a different but conceptually related computational anatomy technique for 3D hippocampal modeling to study the effects of normal aging vs. questionable AD (defined as subjects whose Clinical Dementia Rating scale (CDR) scores were 0 and 0.5, respectively, including both MCI and mild AD patients). One of the studies reported that subjects deemed to be cognitively normal over 2 years (i.e., who had CDR = 0 both at baseline and follow-up) showed progressive atrophy of the anterior CA1 region (localized to the hippocampal head) and the subiculum. Subjects with questionable AD at baseline (i.e., CDR = 0.5) showed additional progressive atrophy of the posterior CA1 area (Wang et al., 2003). Another study followed 49 nondemented subjects with CDR of 0 for an average of 5 years. They reported isolated progressive atrophic changes of the left CA1 subfield in subjects who declined from CDR = 0 to CDR of 0.5 (cognitively normal to questionable AD) (Csernansky et al., 2005). Our results build on these findings by showing the spread of disease-associated changes over time, through the hippocampal subfields, following the well-documented pathologic progression of AD-type pathology. These results raise hopes for the utility of this mapping technique not only as a sensitive diagnostic and prognostic tool but also as a surrogate marker for future disease-modifying clinical trials.
Two studies to date have segmented out the hippocampal subfields in cognitively normal elderly and AD subjects (Csernansky et al., 2005; Mueller et al., 2007) and a third one in young adults (Zeineh et al., 2003). At 1.5 T there was suboptimal resolution for subfield identification (Csernansky et al., 2005). In a recent 4 T study using 2 mm thick T2 hippocampal image sections Mueller et al. resolved the CA1, CA2, subiculum and the combined CA3-4 areas and traced them manually (Mueller et al., 2007). While identification of individual hippocampal layers at 4 T was still not possible, the authors used a set of reliable anatomical landmarks for boundary approximation. The authors did not resolve and trace the subfields of the whole structure; they estimated the subfield volumes from a set of three contiguous slices immediately posterior to the hippocampal head under the assumption that this 3-slice measurement correlates well with the volume of the whole subfield. The study reported that the three AD subjects had smaller CA1 and subiculum measurements relative to their age-matched control counterparts, while advanced age seemed to exert an effect on the CA1 subfield (Mueller et al., 2007).
Several strengths and weaknesses of our study need to be recognized. Major strengths of the study are the well-characterized patient population and the longitudinal design. As MCI is heterogeneous, a strength of the study design is the inclusion of cognitively normal subjects who were closely followed-up until they met the stringent NINCDS-ADRDA criteria for probable AD, minimizing possible contamination with other dementing disorders. The use of a state-of-the art computational anatomy technique enabled us to uncover sub-regionally specific hippocampal involvement in subjects with pre-clinical AD and to dissociate different patterns of involvement in cognitively normal subjects who are transitioning to MCI and MCI subjects who are transitioning to AD. The limitations of our study lie in the relatively small sample size restricting our ability to generalize our findings and the strict inclusion of only the amnestic MCI subtype that prevents extension of our conclusions to subjects with nonamnestic MCI. The resolution at1.5 Tdoes not permit accurate subfield delineation. Thus our conclusions in respect to selective subfield involvement are based on assumptions about the location of each subfield boundary made in consultation with two well-established hippocampal histologic atlases (Duvernoy, 1988; West and Gundersen, 1990). Although our findings seem consistent with the previously published pathologic evidence of the trajectory of neurofibrillary tangle spread through the hippocampus (Bobinski et al., 1998, 2000), the lack of histology-based subfield definition calls for caution when drawing conclusions from these data. Without pathological validation, both the diagnosis of AD and the inference that there is underlying neurofibrillary tangle pathology in the specific hippocampal subfields remain to be ascertained.
Our algorithm, as well as several approaches developed by other groups (e.g., Csernansky et al., 2005), measures the extent and severity of hippocampal shape deformations as a proxy for hippocampal atrophy. To estimate the severity of the inward deformations or hippocampal thinning that occurs with hippocampal atrophy we compute the radial distance from the central core of each hippocampal structure to the respective points on the surface. The areas of thinning thus have smaller radial distance to the core. Even so, it cannot be ruled out that hippocampal deformations may have mimicked subfield atrophy, and there are some limitations in using surface mesh models to detect heterogeneous hippocampal atrophy. For example, if atrophy occurred in the dorsal side while volume increase occurred in the ventral side, this could result in a non-significant finding due to the shifting of the central skeleton. This is unlikely, as hippocampal growth or hypertrophy is not expected in aging or AD. Even so, the use of the central axis as a reference to gauge atrophy is a strength in many ways as the radial atrophy measures will be invariant to any overall shifting of the structure in space. In addition, the manual delineations allow highly precise delineation of boundaries for assessing atrophy, whereas a more automated registration method, like voxel-based morphometry, can typically match the hippocampal boundaries across subjects only very approximately.
Another strong advantage of the surface-based mapping technique relative to other voxel-based mapping approaches is its imperviousness to shifts in stereotaxic space. In other voxel-based mapping approaches, if a structure shifts in stereotaxic space, the shift can be recovered using automated nonlinear registration as a deformation, but it is highly unlikely that an automated alignment will register the complex shape boundaries of the hippocampus accurately across subjects, and because the deformation is constrained to be spatially smooth, it is almost inevitable that some changes in the structure would be incorrectly inferred if the structures only shifted. In the medial axis mapping approach we used here, however, if the structure shifts, the medial axis is translated by a corresponding amount, so there is no net alteration in the amount of atrophy. This is an advantage of using the medial axis curve as a reference, as the measures of 3D atrophy relative to this curve are shift invariant, and as intrinsic measures they should also not depend on the specifics of how the images are registered.
Acknowledgments
This work was generously supported by NIA K23 AG026803 (jointly sponsored by NIA, AFAR, The John A. Hartford Foundation, the Atlantic Philanthropies, the Starr Foundation and an anonymous donor; to LGA), NIA P50 AG16570 (to LGA and PMT); NIBIB EB01651, NLM LM05639, NCRR RR019771, NIH/NIMH R01 MH071940, NIH/NCRR P41 RR013642 and NIH U54 RR021813 (to PMT); the Alzheimer’s Association (to LM); and NIH-NIA AG13616, AG12101, AG08051, and AG022374 (to MdL).
Footnotes
Conflicts of interest
Dr. Thompson, Ms. Green and Ms. Mistur have no conflicts of interest. Ms. Hwang and Mr. Ramirez have nothing to disclose.
Disclosures
Dr. Apostolova received personal compensation for speaking for Forest, OMN and Myriad. The reported financial disclosures are not in any way related to the work presented in this manuscript.
Dr. Mosconi is a consultant for Abiant Imaging Inc., Chicago, IL. Drs Mosconi, Tsui, and de Leon are coinventors of and own a patent on the HipMask technology. Abiant Imaging Inc. entered into a License Agreement with New York University based on this technology and, as such, the authors have a financial interest in this License Agreement and hold stock and stock options on the company. The HipMask technology has not been used in the data analyses reported in this manuscript and the reported financial disclosures are not in any way related to the work presented in this manuscript.
References
- Apostolova LG, Dinov ID, Dutton RA, Hayashi KM, Toga AW, Cummings JL, Thompson PM. 3D comparison of hippocampal atrophy in amnestic mild cognitive impairment and Alzheimer’s disease. Brain. 2006a;129(Pt 11):2867–2873. doi: 10.1093/brain/awl274. [DOI] [PubMed] [Google Scholar]
- Apostolova LG, Dutton RA, Dinov ID, Hayashi KM, Toga AW, Cummings JL, Thompson PM. Conversion of mild cognitive impairment to Alzheimer disease predicted by hippocampal atrophy maps. Arch. Neurol. 2006b;63(5):693–699. doi: 10.1001/archneur.63.5.693. [DOI] [PubMed] [Google Scholar]
- Apostolova LG, Thompson PM. Brain mapping as a tool to study neurodegeneration. Neurotherapeutics. 2007;4(3):387–400. doi: 10.1016/j.nurt.2007.05.009. [DOI] [PMC free article] [PubMed] [Google Scholar]
- Becker JT, Davis SW, Hayashi KM, Meltzer CC, Toga AW, Lopez OL, Thompson PM. Three-dimensional patterns of hippocampal atrophy in mild cognitive impairment. Arch. Neurol. 2006;63(1):97–101. doi: 10.1001/archneur.63.1.97. [DOI] [PubMed] [Google Scholar]
- Bobinski M, de Leon MJ, Tarnawski M, Wegiel J, Reisberg B, Miller DC, Wisniewski HM. Neuronal and volume loss in CA1 of the hippocampal formation uniquely predicts duration and severity of Alzheimer disease. Brain Res. 1998;805(1–2):267–269. doi: 10.1016/s0006-8993(98)00759-8. [DOI] [PubMed] [Google Scholar]
- Bobinski M, de Leon MJ, Wegiel J, Desanti S, Convit A, Saint Louis LA, Rusinek H, Wisniewski HM. The histological validation of post mortem magnetic resonance imaging-determined hippocampal volume in Alzheimer’s disease. Neuroscience. 2000;95(3):721–725. doi: 10.1016/s0306-4522(99)00476-5. [DOI] [PubMed] [Google Scholar]
- Bobinski M, Wegiel J, Tarnawski M, Bobinski M, Reisberg B, de Leon MJ, Miller DC, Wisniewski HM. Relationships between regional neuronal loss and neurofibrillary changes in the hippocampal formation and duration and severity of Alzheimer disease. J. Neu-ropathol. Exp. Neurol. 1997;56(4):414–420. doi: 10.1097/00005072-199704000-00010. [DOI] [PubMed] [Google Scholar]
- Bobinski M, Wegiel J, Wisniewski HM, Tarnawski M, Reisberg B, Mlodzik B, de Leon MJ, Miller DC. Atrophy of hippocampal formation subdivisions correlates with stage and duration of Alzheimer disease. Dementia. 1995;6(4):205–210. doi: 10.1159/000106948. [DOI] [PubMed] [Google Scholar]
- Carmichael OT, Aizenstein HA, Davis SW, Becker JT, Thompson PM, Meltzer CC, Liu Y. Atlas-based hippocampus segmentation in Alzheimer’s disease and mild cognitive impairment. Neuroimage. 2005;27(4):979–990. doi: 10.1016/j.neuroimage.2005.05.005. [DOI] [PMC free article] [PubMed] [Google Scholar]
- Csernansky JG, Wang L, Swank J, Miller JP, Gado M, McKeel D, Miller MI, Morris JC. Preclinical detection of Alzheimer’s disease: hippocampal shape and volume predict dementia onset in the elderly. Neuroimage. 2005;25(3):783–792. doi: 10.1016/j.neuroimage.2004.12.036. [DOI] [PubMed] [Google Scholar]
- de Leon MJ, Convit A, Wolf OT, Tarshish CY, DeSanti S, Rusinek H, Tsui W, Kandil E, Scherer AJ, Roche A, Imossi A, Thorn E, Bobinski M, Caraos C, Lesbre P, Schlyer D, Poirier J, Reisberg B, Fowler J. Prediction of cognitive decline in normal elderly subjects with 2-[(18)F]fluoro-2-deoxy-D-glucose/positron-emission tomography (FDG/PET) Proc. Natl. Acad. Sci. U.S.A. 2001;98(19):10966–10971. doi: 10.1073/pnas.191044198. [DOI] [PMC free article] [PubMed] [Google Scholar]
- de Leon MJ, Golomb J, George AE, Convit A, Tarshish CY, McRae T, De Santi S, Smith G, Ferris SH, Noz M. The radiologic prediction of Alzheimer disease: the atrophic hippocampal formation. AJNR Am. J. Neuroradiol. 1993;14(4):897–906. [PMC free article] [PubMed] [Google Scholar]
- den Heijer T, Geerlings MI, Hoebeek FE, Hofman A, Koudstaal PJ, Breteler MM. Use of hippocampal and amygdalar volumes on magnetic resonance imaging to predict dementia in cognitively intact elderly people. Arch. Gen. Psychiatry. 2006;63(1):57–62. doi: 10.1001/archpsyc.63.1.57. [DOI] [PubMed] [Google Scholar]
- Dubois B, Feldman HH, Jacova C, Dekosky ST, Barberger-Gateau P, Cummings J, Delacourte A, Galasko D, Gauthier S, Jicha G, Meguro K, O’Brien J, Pasquier F, Robert P, Rossor M, Salloway S, Stern Y, Visser PJ, Scheltens P. Research criteria for the diagnosis of Alzheimer’s disease: revising the NINCDS-ADRDA criteria. Lancet Neurol. 2007;6(8):734–746. doi: 10.1016/S1474-4422(07)70178-3. [DOI] [PubMed] [Google Scholar]
- Duvernoy H. An Atlas of Applied Anatomy. Munich: J.F. Bergmann Verlag; 1988. The Human Hippocampus. [Google Scholar]
- Flicker C, Ferris SH, Reisberg B. A two-year longitudinal study of cognitive function in normal aging and Alzheimer’s disease. J. Geriatr. Psychiatry Neurol. 1993;6(2):84–96. doi: 10.1177/089198879300600205. [DOI] [PubMed] [Google Scholar]
- Folstein MF, Folstein SE, McHugh PR. Mini-Mental State: a practical method for grading the cogntive state of patients for the clinician. J. Psychiatr. Res. 1975;12:189–198. doi: 10.1016/0022-3956(75)90026-6. [DOI] [PubMed] [Google Scholar]
- Frisoni GB, Sabattoli F, Lee AD, Dutton RA, Toga AW, Thompson PM. In vivo neuropathologyof the hippocampal formationin AD: a radial mapping MR-based study. Neuroimage. 2006;32(1):104–110. doi: 10.1016/j.neuroimage.2006.03.015. [DOI] [PubMed] [Google Scholar]
- Gilbert JG, Levee RF, Catalano FL. A preliminary report on a new memory scale. Percept. Mot. Skills. 1968;27:277–278. doi: 10.2466/pms.1968.27.1.277. [DOI] [PubMed] [Google Scholar]
- Haroutunian V, Perl DP, Purohit DP, Marin D, Khan K, Lantz M, Davis KL, Mohs RC. Regional distribution of neuritic plaques in the nondemented elderly and subjects with very mild Alzheimer disease. Arch. Neurol. 1998;55(9):1185–1191. doi: 10.1001/archneur.55.9.1185. [DOI] [PubMed] [Google Scholar]
- Hebert LE, Scherr PA, Bienias JL, Bennett DA, Evans DA. Alzheimer disease in the US population: prevalence estimates using the 2000 census. Arch. Neurol. 2003;60(8):1119–1122. doi: 10.1001/archneur.60.8.1119. [DOI] [PubMed] [Google Scholar]
- Hyman BT. The neuropathological diagnosis of Alzheimer’s disease: clinical-pathological studies. Neurobiol. Aging. 1997;18(4 Suppl.):S27–S32. doi: 10.1016/s0197-4580(97)00066-3. [DOI] [PubMed] [Google Scholar]
- Jack CR, Jr, Petersen RC, Xu Y, O’Brien PC, Smith GE, Ivnik RJ, Boeve BF, Tangalos EG, Kokmen E. Rates of hippocam-pal atrophy correlate with change in clinical status in aging and AD. Neurology. 2000;55(4):484–489. doi: 10.1212/wnl.55.4.484. [DOI] [PMC free article] [PubMed] [Google Scholar]
- Jack CR, Jr, Petersen RC, Xu Y, O’Brien PC, Smith GE, Ivnik RJ, Tangalos EG, Kokmen E. Rate of medial temporal lobe atrophy in typical aging and Alzheimer’s disease. Neurology. 1998;51(4):993–999. doi: 10.1212/wnl.51.4.993. [DOI] [PMC free article] [PubMed] [Google Scholar]
- Jack CR, Jr, Shiung MM, Gunter JL, O’Brien PC, Weigand SD, Knopman DS, Boeve BF, Ivnik RJ, Smith GE, Cha RH, Tangalos EG, Petersen RC. Comparison of different MRI brain atrophy rate measures with clinical disease progression in AD. Neurology. 2004;62(4):591–600. doi: 10.1212/01.wnl.0000110315.26026.ef. [DOI] [PMC free article] [PubMed] [Google Scholar]
- Jack CR, Jr, Theodore WH, Cook M, McCarthy G. MRI-based hippocampal volumetrics: data acquisition, normal ranges, and optimal protocol. Magn. Reson. Imaging. 1995;13(8):1057–1064. doi: 10.1016/0730-725x(95)02013-j. [DOI] [PubMed] [Google Scholar]
- Knopman DS, Parisi JE, Salviati A, Floriach-Robert M, Boeve BF, Ivnik RJ, Smith GE, Dickson DW, Johnson KA, Petersen LE, McDonald WC, Braak H, Petersen RC. Neuropathology of cognitively normal elderly. J. Neuropathol. Exp. Neurol. 2003;62(11):1087–1095. doi: 10.1093/jnen/62.11.1087. [DOI] [PubMed] [Google Scholar]
- McKhann G, Drachman D, Folstein M, Katzman R, Price D, Stadlan EM. Clinical diagnosis of Alzheimer’s disease: report of the NINCDS-ADRDA Work Group under the auspices of Department of Health and Human Services Task Force on Alzheimer’s Disease. Neurology. 1984;34(7):939–944. doi: 10.1212/wnl.34.7.939. [DOI] [PubMed] [Google Scholar]
- Mosconi L. Brain glucose metabolism in the early and specific diagnosis of Alzheimer’s disease. FDG-PET studies in MCI and AD. Eur. J. Nucl. Med. Mol. Imaging. 2005;32(4):486–510. doi: 10.1007/s00259-005-1762-7. [DOI] [PubMed] [Google Scholar]
- Mosconi L, De Santi S, Li J, Tsui WH, Li Y, Boppana M, Laska E, Rusinek H, de Leon MJ. Hippocampal hypometabolism predicts cognitive decline from normal aging. Neurobiol. Aging. 2007 doi: 10.1016/j.neurobiolaging.2006.12.008. [DOI] [PMC free article] [PubMed] [Google Scholar]
- Mueller SG, Stables L, Du AT, Schuff N, Truran D, Cashdollar N, Weiner MW. Measurement of hippocampal subfields and age-related changes with high resolution MRI at 4T. Neurobiol. Aging. 2007;28(5):719–726. doi: 10.1016/j.neurobiolaging.2006.03.007. [DOI] [PMC free article] [PubMed] [Google Scholar]
- Petersen RC, Doody R, Kurz A, Mohs RC, Morris JC, Rabins PV, Ritchie K, Rossor M, Thal L, Winblad B. Current concepts in mild cognitive impairment. Arch. Neurol. 2001;58(12):1985–1992. doi: 10.1001/archneur.58.12.1985. [DOI] [PubMed] [Google Scholar]
- Petersen RC, Parisi JE, Dickson DW, Johnson KA, Knopman DS, Boeve BF, Jicha GA, Ivnik RJ, Smith GE, Tangalos EG, Braak H, Kokmen E. Neuropathologic features of amnestic mild cognitive impairment. Arch. Neurol. 2006;63(5):665–672. doi: 10.1001/archneur.63.5.665. [DOI] [PubMed] [Google Scholar]
- Price JL. Diagnostic criteria for Alzheimer’s disease. Neurobiol. Aging. 1997;18(4 Suppl.):S67–S70. doi: 10.1016/s0197-4580(97)00072-9. [DOI] [PubMed] [Google Scholar]
- Price JL, Morris JC. Tangles and plaques in nondemented aging and “preclinical” Alzheimer’s disease. Ann. Neurol. 1999;45(3):358–368. doi: 10.1002/1531-8249(199903)45:3<358::aid-ana12>3.0.co;2-x. [DOI] [PubMed] [Google Scholar]
- Reisberg B, Ferris SH, de Leon MJ, Crook T. Global Deterioration Scale (GDS) Psychopharmacol. Bull. 1988;24(4):661–663. [PubMed] [Google Scholar]
- Rusinek H, De Santi S, Frid D, Tsui WH, Tarshish CY, Convit A, de Leon MJ. Regional brain atrophy rate predicts future cognitive decline: 6-year longitudinal MR imaging study of normal aging. Radiology. 2003;229(3):691–696. doi: 10.1148/radiol.2293021299. [DOI] [PubMed] [Google Scholar]
- Schonheit B, Zarski R, Ohm TG. Spatial and temporal relationships between plaques and tangles in Alzheimer-pathology. Neurobiol. Aging. 2004;25(6):697–711. doi: 10.1016/j.neurobiolaging.2003.09.009. [DOI] [PubMed] [Google Scholar]
- Silverman DHS, Thompson PM. Structural and functional neu-roimaging: focussing on mild cognitive impairment. Appl. Neurol. 2006:10–24. [Google Scholar]
- Thompson PM, Hayashi KM, De Zubicaray GI, Janke AL, Rose SE, Semple J, Hong MS, Herman DH, Gravano D, Doddrell DM, Toga AW. Mapping hippocampal and ventricular change in Alzheimer disease. Neuroimage. 2004;22(4):1754–1766. doi: 10.1016/j.neuroimage.2004.03.040. [DOI] [PubMed] [Google Scholar]
- Thompson PM, Toga AW. Detection, visualization and animation of abnormal anatomic structure with a deformable probabilistic brain atlas based on random vector field transformations. Med. Image Anal. 1997;1(4):271–294. doi: 10.1016/s1361-8415(97)85002-5. [DOI] [PubMed] [Google Scholar]
- Wang L, Swank JS, Glick IE, Gado MH, Miller MI, Morris JC, Csernansky JG. Changes in hippocampal volume and shape across time distinguish dementia of the Alzheimer type from healthy aging. Neuroimage. 2003;20(2):667–682. doi: 10.1016/S1053-8119(03)00361-6. [DOI] [PubMed] [Google Scholar]
- West MJ, Gundersen HJ. Unbiased stereological estimation of the number of neurons in the human hippocampus. J. Comp. Neurol. 1990;296(1):1–22. doi: 10.1002/cne.902960102. [DOI] [PubMed] [Google Scholar]
- Wimo A, Jonsson L, Winblad B. An estimate of the worldwide prevalence and direct costs of dementia in 2003. Dement. Geriatr. Cogn. Disord. 2006;21(3):175–181. doi: 10.1159/000090733. [DOI] [PubMed] [Google Scholar]
- Zeineh MM, Engel SA, Thompson PM, Bookheimer SY. Dynamics of the hippocampus during encoding and retrieval of face-name pairs. Science. 2003;299(5606):577–580. doi: 10.1126/science.1077775. [DOI] [PubMed] [Google Scholar]


