

Abstract
The distribution of compounds between blood and brain is a very important consideration for new candidate drug molecules. In this paper, we describe the derivation of two linear discriminant analysis (LDA) models for the prediction of passive blood-brain partitioning, expressed in terms of log BB values. The models are based on computationally derived physicochemical descriptors, namely the octanol/water partition coefficient (log P), the topological polar surface area (TPSA) and the total number of acidic and basic atoms, and were obtained using a homogeneous training set of 307 compounds, for all of which the published experimental log BB data had been determined in vivo. In particular, since molecules with log BB > 0.3 cross the blood-brain barrier (BBB) readily while molecules with log BB < −1 are poorly distributed to the brain, on the basis of these thresholds we derived two distinct models, both of which show a percentage of good classification of about 80%. Notably, the predictive power of our models was confirmed by the analysis of a large external dataset of compounds with reported activity on the central nervous system (CNS) or lack thereof. The calculation of straightforward physicochemical descriptors is the only requirement for the prediction of the log BB of novel compounds through our models, which can be conveniently applied in conjunction with drug design and virtual screenings.
Keywords: blood-brain barrier, blood-brain partitioning, log BB, central nervous system, linear discriminant analysis, QSAR
1. Introduction
The endothelial cells of the capillaries in the brain form a cellular barrier, known as blood-brain barrier (BBB), that prevents the access of polar molecules to the brain. Highly lipophilic compounds are capable of moving across the BBB by diffusion. Less lipophilic molecules, instead, cross the BBB only through active transport mediated by specific carriers. The distribution of the compounds between blood and brain is a very important consideration for new candidate drug molecules. The BBB should be crossed to reach the desired therapeutic effect in the case of drugs designed for the Central Nervous System (CNS) targets. Otherwise, in the search of drugs without undesirable side effects in the CNS, it is important that they do not cross the BBB [1, 2].
The log BB, defined as the logarithm of the ratio of the concentration of a drug in the brain and in the blood, measured at equilibrium, is an index of BBB permeability. Log BB values can be experimentally derived either in vivo, usually in rats, or in vitro [3, 4]. For in vivo determinations, a drug is administered to a rat and, after the reach of equilibrium, its concentration is measured in the brain and in the blood. For in vitro determinations, which have been used mostly for volatile compounds [3], gas to blood and gas to brain partition coefficients are measured separately and successively combined into a log BB value. Remarkably, in the case of hexane log BB values determined in vivo and in vitro resulted in a relatively good agreement, with 0.4 log units of difference [5, 6]. Several models have been published trying to predict log BB values from various physicochemical properties of molecules, including, among others, molecular size, lipophilicity or number of groups that can establish potential hydrogen bonds [7–10]. For example, in 1999 Clark analyzed a set of 55 diverse organic compounds and generated a multiple linear regression model based on in silico calculated polar surface area (PSA) and log P values [11]. More recently, Abraham et al. analyzed 207 compounds, for which in vivo log BB values had been published, and generated a model based on experimental chromatographic descriptors with a square of the correlation coefficient (r2) of 0.75 [3]. Despite the fact that, as mentioned, log BB values determined in vivo and in vitro have been found in some cases in agreement, Abraham et al. showed that their combination for the generation of computational predictive models is not advisable [3]. This is probably due also to the very different chemical nature of the compounds that have been studied with in vivo and in vitro methodologies: the first group is composed by drug like molecules, while the second one by volatile compounds. Thus, because of our pharmaceutical interests, here we collected 307 compounds, for which in vivo log BB had been published, and derived classification models based on Linear Discriminant Analysis (LDA) and on physicochemical descriptors calculated in silico. In particular, since it was shown that molecules with log BB > 0.3 cross the BBB readily while molecules with log BB < −1 are poorly distributed to the brain [11, 12], we derived two distinct classification models based on the mentioned thresholds, to predict the passive penetration. Each of these functions proved capable of accurately classifying the compounds into two categories, separating those with log BB ≥ the selected threshold from those with log BB < the selected threshold.
2. Methodology
2.1 Construction of the dataset
From a number of published papers, we collected 307 compounds for which log BB values had been measured in vivo, for the most part in rats [3, 8, 10, 11, 13–18]–the compiled dataset is provided in Excel format in the Table S1 of the Supplementary Data, along with chemical formulas in smiles code format, log BB values and calculated descriptors. When data for one compound were reported in multiple articles, we calculated an average log BB value; however, we excluded from the training set eight compounds for which large discrepancies were noted. The dataset includes compounds for which the partition had been measured from blood to brain, from plasma to brain and from serum to brain. As Abraham et al. concluded, differences between log BB values determined in such ways are negligible [3]. Instead, we did not consider those molecules, found within the same articles, that Abraham et al. identified as organic volatile compounds for which the log BB values had been determined in vitro [3].
To validate our models we used an external prediction set based on a Central Nervous System (CNS) library [19], which separates compounds for which some sort of CNS activity has been reported from those without CNS activity.
2.2 Descriptors calculation
The ligands were prepared with the LigPrep module of Maestro 9.0. [20], at pH 7, with ionizer. Whenever multiples protonation states were found in the output, the lowest protonation state was used for the descriptors calculation. After calculation of the atomic charges with the Gasteiger (PEOE) model, 184 2D descriptors were calculated with MOE 2008.10.[21].
2.3 Statistical analysis
Two log BB thresholds values were established: 0.3 for model 1 and −1 for the model 2. To the dependent variable was then assigned a value of 1 when the compounds had log BB ≥ the threshold and a value of −1 when the log BB was lower than the threshold. Statistical analysis were carried out with STATISTICA package [22]. Linear Discriminant Analysis (LDA) [23] was used to find two different classifier functions. The forward stepwise algorithm was employed to select the independent variables. The tolerance parameter was set to 0.01, which is the default value for the minimum acceptable tolerance. The quality of the models was determined according to Wilks’ statistic (U), Fisher ratio (F), significance level (p) and the percentage of good classification.
3. Results and Discussion
3.1 Construction of the models
As mentioned, it has been described that compounds with log BB > 0.3 cross the BBB readily and compounds with log BB < −1 are poorly distributed in the brain [11, 12]. Thus, on the basis of log BB threshold values set to 0.3 and −1, we generated the following two classification models:
Model 1 threshold: log BB ≥ 0.3
| (1) |
Model 2 threshold: log BB ≥ −1
| (2) |
where N is the number of compounds included in the LDA analysis, U is the Wilks’ statistic, F is the Fisher ratio and p is the significance level. The percentage of good classification for both models is around 80% (see Figure 1). Equations with standardized descriptors are given in the Table S1 of the Supplementary Data.
Figure 1.

Percentages of good classification and statistical parameters for model 1 and model 2. Compounds with log BB values ≥ 3 readily cross the BBB, while those with log BB values < 1 are poorly distributed to the brain.
Both models conform to the principle of parsimony, i.e. we chose the functions with the lowest possible number of variables and with high statistical significance, with model 1 and 2 based on two and three descriptors, respectively. In particular, model 1 is based on the logarithm of the octanol/water partition coefficient (log P) and the topological polar surface area (TPSA), while model 2 is based on the same descriptors with the addition of the sum of number of acidic and basic atoms (a_acid + a_base). In both models, high log BB values are favored by high log P values and low TPSA values. Additionally, according to model 2, high log BB values are also favored by a low content of acidic and basic atoms. For model 1, this is visually represented by the plot shown in Figure 2, which reports the calculated log P and TPSA values for all the studied compounds and the demarcation line described by the model. As it is evident from the figure, most of the compounds with log BB ≥ 0.3 lay above the demarcation line, while most of those with log BB < 0.3 lay below it, according to the percentages of good classification shown in Figure 1. For the model 2, which involve three descriptors, we represented the data by means of 2D desirability maps (Figure 3) that visually illustrate how the probability of high log BB values rises with the increase of the log P and diminishes with the increase of the TPSA and the total number of acidic and basic atoms. Our models are in accordance with several of those reported in the past, where log BB values have related with lipophilicity descriptors [11, 24, 25], hydrogen-bond capacity [26, 27] and polar surface areas [11, 28, 29]. However, the models described here are based on a larger and biologically consistent database, with all the data referring to in vivo log BB measurements. Abraham et al. [3] recently described an excellent model (r2=0.75), based on a biologically uniform training set of 207 compounds. However, this model is based on experimental derived chromatographic descriptors, while our models are based on straightforward in silico calculated physicochemical descriptors. Other good models available in the literature, such as the one described by Garg et al., are based on complex methodologies such as artificial neural networks [13], while our LDA models resulted in two simple equations in which to insert the values of the calculated descriptors to obtain a binary prediction.
Figure 2.

Plot of the log P vs. TPSA values for compounds with log BB ≥ 0.3 (in white) and compounds with log BB < 0.3 (in black). The demarcation line identified by model 1, indicated by the black diagonal line, provides 80 % of good classification for the two categories of compounds.
Figure 3.

Desirability analysis of the descriptors that compose model 2. The green color indicates areas that are predicted to favor log BB ≥ −1, while the red color indicates areas that are predicted to favor log BB < −1.
3.2 Validation of the models with an external test set
In order to demonstrate the predictive power of our models, we used a Central Nervous System (CNS) dataset previously reported in the literature [30]. This dataset lists compounds which have a reported CNS activity (CNS+), such as anticonvulsants, antidepressants, antipsychotics etc., and molecules with no known activity in the CNS (CNS−). We worked with the database as filtered by Zhao et al. [19], from which we eliminated 79 known substrates of the P-glycoprotein (P-gp) efflux pump and 57 compounds that were already used in the training of our models – we wanted a completely independent test set. In total, our prediction set consisted of 1,457 molecules, of which 1,222 were CNS+ and 235 were CNS−.
Although log BB (training set) and CNS activity (prediction set) do not encode the same information, there is a clear relationship between both properties, since CNS activity implies BBB penetration. The data reported in Table 1 clearly show how molecules predicted to have log BB ≥ 0.3 or ≥ −1 are very likely to have CNS activity, while many of those with log BB < −1 do not show CNS activity. The presence of a relatively high number of CNS+ molecules for which our models predict a log BB < −1 might be attributed to their crossing the BBB through active transport mechanism, in addition, clearly, to the inherent limits of the models. Taken together, these data confirm the predictivity of our classification models. The same indication emerges clear also from the Receiver Operating Characteristic (ROC) curves for both models reported in Figure 4, where the fraction of true positives (sensitivity) is plotted against the fraction of false positives (1-specificity). For a perfect classifier model the area under the curve would be 1, while for a random classifier it would be 0.5. We detected an area under the ROC curve of 0.95 for model 1 and 0.97 for model 2, demonstrating once again the high predictive power of our models.
Table 1.
Analysis of an external test set of 1,457 compounds, of which 1,222 have been reported to have activity on the CNS (CNS+) and 235 have been reported to lack it (CNS−). Confirming the predictive capability of our models, almost all the compounds with a predicted log BB ≥ 0.3 or between 0.3 and 1 are CNS+, while many compounds with a predicted log BB < −1 are CNS−.
Compounds with predicted log BB ≥ 0.3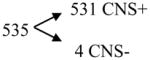
|
[positive model 1] |
Compounds with predicted 0.3 > log BB ≥ −1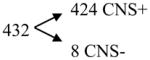
|
[positive model 2 minus positive model 1] |
Compounds with predicted log BB < −1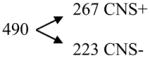
|
[negative model 2 minus positive model 1] |
Figure 4.

ROC curves relative to the analysis of an external dataset of compounds with reported CNS activity of lack thereof. The area under the curve is 0.95 and 0.97 respectively, indicating a very high predictive power for both models. A perfect model would have an area of 1, while a random model, denoted by the diagonal line, would have an area of 0.5.
4. Conclusions
Using a large and biologically consistent database, we derived two binary models for the prediction of log BB values. In our models, log P is a factor that contributes positively to the log BB of the compounds, while the polar surface area and the number of acidic and basic atoms contribute negatively. This fits with the fact that lipophilicity is a known important factor in transport across biological membranes, while the ability of forming hydrogen bonds has been reported to prevent a high brain/blood partitioning [31, 32]. While these physicochemical properties can provide a high predictive power when the compounds cross the barrier by passive diffusion, one has to keep in mind that the mechanisms by which chemicals can cross the BBB may involve active transport or efflux pumps, which cannot be easily predicted on the basis of physicochemical properties [33]. Thus, active transport, together with inherent limitations of the models, may be the reason why we correctly classified 80%, not 100%, of the studied compounds. Importantly, the predictive power of our models was amply confirmed by the analysis of a large external dataset of molecules with reported CNS activity or lack thereof.
These models are very easy to use and require only the calculation of three straightforward physicochemical descriptors that can be done with a number of readily available software packages. To predict the log BB of novel compounds the only necessary steps are: protonation of the new molecules at pH 7, calculation of the Gasteiger (PEOE) charges, calculation of the three physicochemical descriptors and introduction of the descriptors’ values in equations (1) and (2). If the result of the equation is > 0, the novel compound is predicted to have a log BB value ≥ 0.3 for model 1 and a log BB value ≥ −1 for model 2. Combining the two models, compounds can conveniently be classified into three categories, as shown in Table 1 for the external test set: compounds with log BB values ≥ 0.3, which readily cross the blood-brain barrier; compounds with log BB values comprised between 0.3 and −1, which still have access to the CNS; and compounds with log BB values < −1, which are poorly distributed to the brain.
Supplementary Material
Acknowledgments
This research was supported by Intramural Research Program of the NIH, NIDDK.
Footnotes
Supplementary Data Available. Table S1 shows the training database, with chemical formulas expressed by means of two different smile codes, log BB values, calculated physicochemical descriptors and references. Table S2 shows the compounds not included in the calculations due to the discrepant log BB values found in the literature. Table S3 shows the organic volatile compounds not included in the calculations. Table S4 shows the classification equations with standardized descriptors. This material is available and free of charge in the online version.
Publisher's Disclaimer: This is a PDF file of an unedited manuscript that has been accepted for publication. As a service to our customers we are providing this early version of the manuscript. The manuscript will undergo copyediting, typesetting, and review of the resulting proof before it is published in its final citable form. Please note that during the production process errors may be discovered which could affect the content, and all legal disclaimers that apply to the journal pertain.
Reference List
- 1.Begley DJ. Understanding and circumventing the blood-brain barrier. Acta Paediatrica. 2003;92:83–91. doi: 10.1111/j.1651-2227.2003.tb00226.x. [DOI] [PubMed] [Google Scholar]
- 2.Banks WA. Characteristics of compounds that cross the blood-brain barrier. Bmc Neurology. 2009;9 doi: 10.1186/1471-2377-9-S1–S3. [DOI] [PMC free article] [PubMed] [Google Scholar]
- 3.Abraham MH, Ibrahim A, Zhao Y, Acree WE. A data base for partition of volatile organic compounds and drugs from blood/plasma/serum to brain, and an LFER analysis of the data. J Pharm Sci. 2006;95:2091–2100. doi: 10.1002/jps.20595. [DOI] [PubMed] [Google Scholar]
- 4.Abraham MH, Ibrahim A, Acree WE. Air to brain, blood to brain and plasma to brain distribution of volatile organic compounds: linear free energy analyses. Eur J Med Chem. 2006;41:494–502. doi: 10.1016/j.ejmech.2006.01.004. [DOI] [PubMed] [Google Scholar]
- 5.Lombardo F, Blake JF, Curatolo WJ. Computation of brain-blood partitioning of organic solutes via free energy calculations. J Med Chem. 1996;39:4750–4755. doi: 10.1021/jm960163r. [DOI] [PubMed] [Google Scholar]
- 6.Abraham MH, Chadha HS, Mitchell RC. Hydrogen-Bonding.33. Factors That Influence the Distribution of Solutes Between Blood and Brain. J Pharm Sci. 1994;83:1257–1268. doi: 10.1002/jps.2600830915. [DOI] [PubMed] [Google Scholar]
- 7.Vastag M, Keseru GM. Current in vitro and in silico models of blood-brain barrier penetration: A practical view. Curr Opin Drug Disc. 2009;12:115–124. [PubMed] [Google Scholar]
- 8.Konovalov DA, Coomans D, Deconinck E, Vander Heyden Y. Benchmarking of QSAR models for blood-brain barrier permeation. J Chem Inf Model. 2007;47:1648–1656. doi: 10.1021/ci700100f. [DOI] [PubMed] [Google Scholar]
- 9.Kaliszan R, Markuszewski M. Brain/blood distribution described by a combination of partition coefficient and molecular mass. Int J Pharm. 1996;145:9–16. [Google Scholar]
- 10.Luco JM. Prediction of the brain-blood distribution of a large set of drugs from structurally derived descriptors using partial least-squares (PLS) modeling. J Chem Inf Comput Sci. 1999;39:396–404. doi: 10.1021/ci980411n. [DOI] [PubMed] [Google Scholar]
- 11.Clark DE. Rapid calculation of polar molecular surface area and its application to the prediction of transport phenomena. 2. Prediction of blood-brain barrier penetration. J Pharm Sci. 1999;88:815–821. doi: 10.1021/js980402t. [DOI] [PubMed] [Google Scholar]
- 12.Abraham MH, TakacsNovak K, Mitchell RC. On the partition of ampholytes: Application to blood-brain distribution. J Pharm Sci. 1997;86:310–315. doi: 10.1021/js960328j. [DOI] [PubMed] [Google Scholar]
- 13.Garg P, Verma J. In silico prediction of blood brain barrier permeability: An artificial neural network model. J Chem Inf Model. 2006;46:289–297. doi: 10.1021/ci050303i. [DOI] [PubMed] [Google Scholar]
- 14.Mente SR, Lombardo F. A recursive-partitioning model for blood-brain barrier permeation. J Comput Aided Mol Des. 2005;19:465–481. doi: 10.1007/s10822-005-9001-7. [DOI] [PubMed] [Google Scholar]
- 15.Ooms F, Weber P, Carrupt PA, Testa B. A simple model to predict blood-brain barrier permeation from 3D molecular fields. BBA-Mol Basis Dis. 2002;1587:118–125. doi: 10.1016/s0925-4439(02)00074-1. [DOI] [PubMed] [Google Scholar]
- 16.Escuder-Gilabert L, Molero-Monfort A, Villanueva-Camanas RM, Sagrado S, Medina-Hernandez MJ. Potential of biopartitioning micellar chromatography as an in vitro technique for predicting drug penetration across the blood-brain barrier. J Chromatogr B. 2004;807:193–201. doi: 10.1016/j.jchromb.2004.04.004. [DOI] [PubMed] [Google Scholar]
- 17.Rose K, Hall LH, Kier LB. Modeling blood-brain barrier partitioning using the electrotopological state. J Chem Inf Comput Sci. 2002;42:651–666. doi: 10.1021/ci010127n. [DOI] [PubMed] [Google Scholar]
- 18.Usansky HH, Sinko PJ. Computation of log BB values for compounds transported through carrier-mediated mechanisms using in vitro permeability data from brain microvessel endothelial cell (BMEC) monolayers. Pharm Res. 2003;20:390–396. doi: 10.1023/a:1022647903205. [DOI] [PubMed] [Google Scholar]
- 19.Zhao YH, Abraham MH, Ibrahim A, Fish PV, Cole S, Lewis ML, de Groot MJ, Reynolds DP. Predicting penetration across the blood-brain barrier from simple descriptors and fragmentation schemes. J Chem Inf Model. 2007;47:170–175. doi: 10.1021/ci600312d. [DOI] [PubMed] [Google Scholar]
- 20.Maestro, version 9.0. Schrödinger, LLC; New York, NY: 2009. [Google Scholar]
- 21.MOE, version 2008.10. Chemical Computing Group, Inc; 2008. www.chemcomp.com. [Google Scholar]
- 22.STATISTICA (data analysis software system), version 8.0. StatSoft, Inc; Tulsa, OK, USA: 2008. [Google Scholar]
- 23.Hill T, Lewicki P. A Comprehensive Reference for Science, Industry and Data Mining. StatSoft; Tulsa: 2009. Statistical Methods and Applications. [Google Scholar]
- 24.Hansch C, Bjorkroth JP, Leo A. Hydrophobicity and Central-Nervous-System Agents - on the Principle of Minimal Hydrophobicity in Drug Design. J Pharm Sci. 1987;76:663–687. doi: 10.1002/jps.2600760902. [DOI] [PubMed] [Google Scholar]
- 25.Dischino DD, Welch MJ, Kilbourn MR, Raichle ME. Relationship Between Lipophilicity and Brain Extraction of C-11-Labeled Radiopharmaceuticals. J Nucl Med. 1983;24:1030–1038. [PubMed] [Google Scholar]
- 26.Chikhale EG, Ng KY, Burton PS, Borchardt RT. Hydrogen-Bonding Potential As A Determinant of the In-Vitro and In-Situ Blood-Brain-Barrier Permeability of Peptides. Pharm Res. 1994;11:412–419. doi: 10.1023/a:1018969222130. [DOI] [PubMed] [Google Scholar]
- 27.Vandewaterbeemd H, Kansy M. Hydrogen-Bonding Capacity and Brain Penetration. Chimia. 1992;46:299–303. [Google Scholar]
- 28.Kelder J, Grootenhuis PDJ, Bayada DM, Delbressine LPC, Ploemen JP. Polar molecular surface as a dominating determinant for oral absorption and brain penetration of drugs. Pharm Res. 1999;16:1514–1519. doi: 10.1023/a:1015040217741. [DOI] [PubMed] [Google Scholar]
- 29.Ertl P, Rohde B, Selzer P. Fast calculation of molecular polar surface area as a sum of fragment-based contributions and its application to the prediction of drug transport properties. J Med Chem. 2000;43:3714–3717. doi: 10.1021/jm000942e. [DOI] [PubMed] [Google Scholar]
- 30.Adenot M, Lahana R. Blood-brain barrier permeation models: Discriminating between potential CNS and non-CNS drugs including P-glycoprotein substrates. J Chem Inf Comput Sci. 2004;44:239–248. doi: 10.1021/ci034205d. [DOI] [PubMed] [Google Scholar]
- 31.Conradi RA, Burton PS, Borchardt RT. Physicochemical and biological factors that influence a drug’s cellular permeability by passive diffusion. In: Pliska V, Testa B, Van de Waterbeemd H, editors. Lipophilicity in Drug Action and Toxicology. VCH; Weinheim: 1996. [Google Scholar]
- 32.Norinder U, Sjoberg P, Osterberg T. Theoretical calculation and prediction of brain-blood partitioning of organic solutes using MolSurf parametrization and PLS statistics. J Pharm Sci. 1998;87:952–959. doi: 10.1021/js970439y. [DOI] [PubMed] [Google Scholar]
- 33.Ware JA. Membrane transporters in drug discovery and development: A new mechanistic ADME era. Mol Pharmaceut. 2006;3:1–2. doi: 10.1021/mp058084b. [DOI] [PubMed] [Google Scholar]
Associated Data
This section collects any data citations, data availability statements, or supplementary materials included in this article.