Abstract
Using biochemical, imaging and histological methods, we employed transcriptional targeting to increase the specificity of tumor gene expression in vivo for intravenously administered recombinant adenovirus vectors. Surprisingly, the relative specificity of tumor expression in comparison to other tissues was increased for a constitutively expressing recombinant adenovirus, AdCMVLuc, by simply reducing the viral dose. Even at lower doses, however, the high frequency of viral infection and transgene expression in the liver using constitutive promoters still represents a substantial problem. To further augment tumor specificity, we constructed a series of adenoviruses expressing luciferase from several other promoters and tested their ability to selectively transcribe genes in tumor cells both in vitro and in vivo. Constitutively active viral promoters (RSV, SRα) varied widely in their tumor selectivity, but hypoxia-responsive promoters (carbonic anhydrase 9, PAI-1, SOD2, and several chimeric constructs) demonstrated the most tumor-selective expression. Our results show that tumor targeting to HT1080 fibrosarcomas was readily achieved using transcriptional targeting mechanisms. We attribute the relatively high level of gene transfer and expression in HT1080 tumors in vivo to increased viral access to the tumor, presumably due to discontinuities in tumor vasculature and augmented expression from stress-responsive promoters in the hypoxic and inflammatory tumor microenvironment.
Keywords: promoter, hypoxia, transcription, bioluminescence, imaging
Introduction
Biochemical and cellular processes exhibited by cancerous cells contribute to their growth and survival. These processes do not fully recapitulate normal cellular and developmental processes, however, despite the induction of genes that regulate these physiological events. For example, compared to normal vessels, the developing tumor vasculature is highly disorganized and leaky due to endothelial discontinuities.1 Therefore, tumor vasculature differs substantially from normal vasculature and blood flow through tumor capillaries is often slow, static or even retrograde, which leads to depletion of oxygen in the hemoglobin of erythrocytes.2 As a result, seemingly well-vascularized regions of a tumor can be hypoxic, nutrient-starved, and subjected to other environmental stresses associated with inadequate oxygenation including oxidative and inflammatory stresses.
For some cellular proteins induced during cancer cell growth, therapeutic strategies that block the action of these inappropriately elevated factors are being developed. For example, vascular endothelial growth factor (VEGF) inhibits apoptosis in endothelial cells and stimulates the active angiogenesis and vascular sprouting often seen in tumors.3 Targeting of key cellular factors such as VEGF may be of therapeutic value to cancer patients, and the critical role of VEGF in tumor growth has been validated by the positive therapeutic effects of the anti-VEGF monoclonal antibody bevacizumab/Avastin®.4 Because the signal transducers activated in tumors are often responsible for the preferential induction of specific genes such as VEGF,5 regulatory regions that control expression of genes induced at high levels in tumors may also be used to target the expression of therapeutic factors to tumor cells.
Specific gene targeting of tumor tissue is a major goal of cancer gene therapy. Tumor cells frequently up-regulate select signal transduction pathways. One affected pathway involves signaling mediated by the hypoxia-inducible transcription factors Hif-1α and Hif-2α,6,7 and other important pathways involve NF-κb8,9 and/or SP-110 activation. Activation of all three of these pathways can lead to the induction of pro-survival gene products, and promoters of their target genes that are specifically expressed in cancer cells are potential candidates for use in transcriptional targeting of gene therapy to tumors in vivo.11
Adenovirus has been used as a gene transfer vector both in vitro and in vivo. The primary advantages of using adenoviral vectors in vivo are the high titers of vector that can be achieved, the relatively efficient distribution to tissues via the vasculature, the structural stability of these viral particles in the bloodstream, and their ability to target non-proliferating cells. One aspect that is of particular interest for cancer investigators is the relatively leaky nature of tumor vasculature,12 which could lead to increased adenoviral transduction of tumor cells compared to normal tissues. In conjunction with tumor-selective expression techniques, localized enrichment of adenovirus in tumors provides opportunities for augmented expression of therapeutic agents in the target cells. Our primary goal was to achieve a high level of tumor-specific transcriptional targeting in vitro and in vivo by examining the efficiency of a various promoter elements driving the expression of a luciferase reporter under a variety of experimental conditions. Our results show that using an optimized dose of adenoviral vector with a tumor-selective promoter results in highly selective gene expression in developing tumors in vivo.
Materials and Methods
Adenoviral expression vectors
AdCMVLuc and AdCMVβgal, with sequences from the human CMV immediate early promoter have been previously published.13 The inflammation-inducible AdC3/CMVluc containing a chimera of the human complement C3 enhancer and CMV promoter14 was kindly provided by Dr. Alan Varley. For other promoters, the transcriptional control sequences were cloned into a pACLuc shuttle plasmid that already contained the firefly luciferase cDNA insert15 and SV40 splice/polyA signal (Table 1). To construct the Hy3PAI-1 chimeric promoter, three 50np tripartite hypoxia responsive elements (Hre) derived from the human epo gene19 were ligated upstream of the human PAI-1 promoter20 before insertion into pACLuc. AdSRαLuc contains the SRα promoter, which is a chimera of the SV40 early and HTLV-1 LTR promoters,16 and the promoter-containing KpnI-XbaI fragment was isolated from a plasmid kindly provided by Dr. Robert Meidell. For AdPAI-1Luc, a human genomic clone was used to PCR amplify a PAI-1 promoter fragment for insertion into pACLuc. The aforementioned constructs were used to construct recombinant adenoviruses using homologous recombination in 911 cells.
Table I. Promoter/Enhancer elements used in the construction of adenoviral vectors.
| Promoter | Gene source and promoter regions | Organism | Binding site sequence | References |
|---|---|---|---|---|
| SRa | Chimera of SV40 early promoter (-286,+63) + HTLV-1 LTR (+1,+267) | Viral | 16 | |
| SURV | Survivin promoter (-938,+39) | Human | 18 | |
| RSV | Rous Sarcoma Virus LTR | Viral | 19 | |
| CMV | Cytomegalovirus immediate early promoter (-804,+7) | Viral | 13 | |
| C3/CMV | Chimera of murine complement C3 enhancer (-386,-25), mJunB1 binding site (x2) and CMV i.e. promoter (-121,+5) | Mouse/Viral | 5′-CGGGAAGTTC-3′ | 14 |
| Fbe8TK | FoxO binding element (x8) + HSV thymidine kinase promoter (-112,+57) | Human/Viral | 5′-CTCCAATAAACAAGCCTCGA-3′ | 25 |
| mEpo | Erythropoietin promoter (-410,+1) + 3′ enhancer element | Mouse | NT_039315.7 np#212282-212214 | 21, 22 |
| SOD2 | Superoxide Dismutase 2 promoter (-1452,+40) | Mouse | 20, 22 | |
| CAIX | Carbonic Anhydrase IX promoter (-440,+31) | Human | 21 | |
| PAI-1 | Plasminogen Activator Inhibitor-1 (-787,+65) | Human | 41 | |
| Hy3PAI | HIF-1a Response Element from hEpo (x3) + Plasminogen Activator Inhibitor-1 promoter (-809,+26) | Human | 5′-GCCCTACGTGCTGTCTCACACAGCCTGTCTGACCTCT CGACCTACCGGCC-3′ | 41, 42 |
| Hre3TK | HIF-1a Response Element from Epo (x3) + HSV Thymidine Kinase promoter (-112,+57) | Human/Viral | 5′-AGCCCTACGTGCTGTCTCACACAGCCTGTCTGACCTC TCGACCTACCGGCCGTTCGA-3′ | 23, 24 |
| Myo2.0 | Myoglobin promoter (-2038,+7) | Human | 43 |
All subsequent promoters were constructed into viral vectors using the cre-loxP recombination method to reconstruct the intact viral genome in vitro.17 AdSURVluc contains a 1.0 Kb fragment of the human survivin promoter derived from pSRVN-Luc18 that was kindly provided by Dr. Mien-Chie Hung at MD Anderson. The entire transcription unit was excised with restriction enzymes EcoRI and BamHI and ligated into the pACpL+loxPSSP shuttle plasmid.25 AdMYO2.0Luc contains 2.0 Kb of the human myoglobin promoter subcloned from a plasmid provided by R. Sanders Williams.26 For AdRSVLuc, the luciferase cDNA was inserted into the shuttle vector pACRSVpLpA(-)loxP-SSP that contains the RSV LTR obtained from the University of Michigan Vector Core.19 The mouse SOD2 promoter20 and Epo enhancer-promoter21 regulatory regions were isolated from previously described reporters.22 The human CAIX promoter was PCR amplified from human genomic DNA.21 The synthetic Hre3TK promoter was isolated from a previously described reporter23 that contains three copies of the Hre upstream of a minimal thymidine kinase (TK) promoter.24 The Fbe8TK reporter contains eight FoxO binding elements (Fbe) concatemerized upstream of the same TK promoter and was isolated from a previously described promoter, 8xFK1tkLuc, generously provided by Dr. William Biggs.25 All newly cloned regulatory regions were initially placed upstream of the firefly luciferase cDNA in the reporter pGL3-basic and were tested for their transcriptional activation.21, 22 The regulatory regions and luciferase cassettes were subsequently excised with restriction enzymes and cloned into the adenoviral shuttle vector for use in virus production in 911 cells. Constitutively active Hif-1α and Hif-2α expressing adenoviral vectors have been previously published.22
Viruses were constructed using either the cre-loxP method 17 or classic homologous recombination, propagated and purified as previously described 26 for use in vivo. Briefly, adenoviruses were cloned by plaque assay, propagated on 911 cells and titered by plaque assay on 911 cells for use in vitro.26 Plaque assays were performed in 60mm dishes with viruses diluted in 1 ml Dulbecco's minimal essential medium (DMEM) containing 2% fetal bovine serum (FBS) and absorbed for 1 hr at 37°C prior to agar overlay. For in vivo use, crude stocks were purified sequentially by centrifugation on CsCl step gradients and gel filtration on Sepharose CL-4B columns equilibrated with Tris-buffered isotonic saline (137 mM NaCl, 5 mM KCl, 10 mM Tris-HCl pH7.4, 1 mM MgCl2). Absorbance at 260nm (1A260 equals 1×10¹² particles/ml) was used to determine particle concentration. After the addition of 10% glycerol, viruses were stored frozen at -80°C at concentrations between 1012 and 1013 particles/ml until use. Particle/pfu ratios for the different viral preparations ranged from 16 to 85.
Cell culture
Both a single cell clone of HT1080 human fibrosarcoma cells and the adenoviral host cells 911 were propagated in DMEM containing 10% FBS. Infections of HT1080 cells in vitro were performed with crude stocks of viruses diluted in DMEM+2% FBS. Equivalent titers were used for infection. Hypoxia induction of gene expression was performed in 1% oxygen, 5% CO2 starting 4 hours post-infection. Cytokine induction was performed immediately after viral infection using a 1:6 dilution of cytokine-rich conditioned medium prepared from LPS-induced human monocyte cultures27 that was kindly provided by Dr. Alan Varley. Both types of induction were carried out overnight before cells were harvested and luciferase activity determined.
Animal experiments
All animal experiments were approved by the Institutional Animal Care and Use Committee. Female mice were used preferentially for HT1080 tumor cell implantation, although not exclusively. Mice were injected subcutaneously with 3-5×10⁶ cells suspended in 0.5ml DMEM on the dorsal flank. Tumors were allowed to grow until 0.4-0.8 cc in size as measured by calipers, at which time purified adenovirus was injected via the tail vein at doses from 109 to 1012 particles per mouse. Three days after virus injection, mice to be imaged were anaesthetized with isoflurane and injected subcutaneously with luciferin (0.1 mg/g body weight). Whole body luciferase activity was imaged with either a Lumina or Spectrum bioluminescence imaging system (Caliper Biosciences, Hopkinton, MA). Total tumor light flux was quantified using the manufacturer's imaging software. Mice were subsequently sacrificed and major organs and tumors removed for biochemical determination of luciferase activity performed as described by the luciferase assay system (Promega, Madison, WI). Individual tissues were weighed and homogenized using a PowerGen 700D homogenizer (Thermo Fisher Scientific, Waltham, MA) in lysis reagent (25 mM Tris-phosphate pH 7.8, 2 mM DTT, 2mM 1,2 diaminocyclohexane-N,N,N′,N′- tetra-acetic acid, 10% glycerol, 1% NP-40) containing soybean trypsin inhibitor (0.2 mg/ml) and bovine serum albumin (0.2 mg/ml). Samples were diluted in 100 μl lysis reagent containing 2.5 mM MgCl2 and 50 μl luciferin reagent (20 mM tricine, 1 mM (MgCO3)4Mg(OH)2. 5H2O, 2.67 mM MgSO4, 0.1 mM EDTA, 33 mM DTT, 0.27 mM Coenzyme Q, 0.47 mM luciferin, 0.53 mM ATP, pH 7.8) was mixed into the reaction immediately before measurement for 10sec in a Sirius single tube luminometer (Berthold Detection Systems, Pforzheim, Germany).
Viral DNA content in tissues was measured by real time PCR detection of the adenovirus type 5 hexon gene using either an ABI 7000 or an ABI StepOne. Samples of tissue extracts were diluted 10-fold into buffer containing 50 mM KCl, 10 mM Tris HCl pH 8.0, 2.5mM MgCl2, 1% NP-40, 20 μg/ml proteinase K, 0.2 μg/ml herring DNA and incubated first at 37°C overnight then at 95°C for 30 min. TaqMan primers (fwd 5′-CTTCGATGATGCCGCAGTG-3′, rev 5′-GGGCTCAGGTACTCCGAGG-3′) and probe (5′HEX-TTACATGCACATCTCGGGCCAGGAC-3′BHQ) for detection were synthesized by Integrated DNA Technologies (Coralville, IA) and used in a manner similar to that previously described.28 Purified Ad5 virus was used to construct the standard curve for copy number determination.
Staining of tissues for β-galactosidase activity was performed as follows. Mice were anaesthetized and a thoracotomy was performed. Animals were perfused with 4% paraformaldehyde in PBS, and the liver and tumor removed and embedded in Tissue-Tek O.C.T. (Ted Pella, Inc., Redding, CA) for freezing. Cryosections 6 μm thick were cut, the slides were fixed in 0.5% glutaraldehyde in PBS for 5 min, and then stained with X-gal overnight at 37°C. A light eosin counter stain was used for contrast.
Statistical Analyses
None of the data sets analyzed were well-modeled by a normal distribution, so data presented for varying doses of AdCMVLuc were first analyzed using Kruskal-Wallis one way analysis of variance on ranks of values obtained from individual dosing groups. When differences among the treatment groups were significantly different, multiple pairwise comparisons between individual viral doses were performed using the Mann-Whitney Rank Sum Test. SigmaStat for Windows v3.11 was used to perform the analyses. A Jonckheere-Terpstra test for a trend in response (increasing expression in liver and decreasing tumor/liver ratios as a function of viral dose) was performed using the R statistical package.29
Results
Dose-dependent Gene Expression in Mice
To assess the ability of intravenously delivered adenoviral vectors to transduce genes and express them in developing tumors, varying doses (109 to 1012 particles) of AdCMVLuc were injected into the tail vein of HT1080 tumor-bearing nude mice. After three days, luciferase expression was visualized in intact animals using bioluminescent imaging. Mice were then sacrificed and the tumors and major organs excised for biochemical determination of luciferase expression and viral DNA content.
Luciferase expression in tumors was frequently observed using whole animal bioluminescence, even when expression in other tissues was not. This was somewhat surprising as our prior studies in mice with intravenously injected adenoviral vectors13 have shown the liver is the primary target of gene transfer and expression. Only at higher doses of AdCMVLuc was the liver the apparent primary site of gene expression (Figure 1, panel A).
Figure 1.
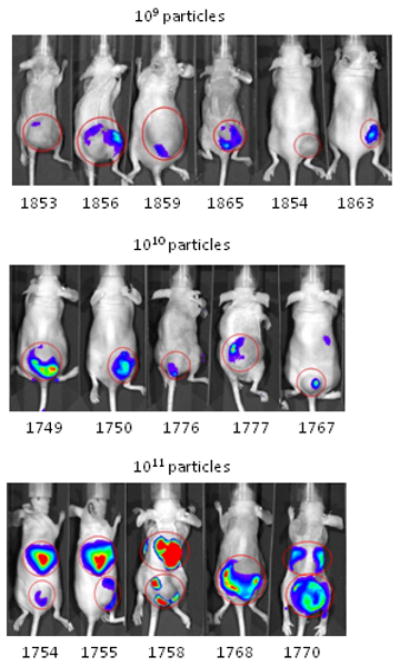
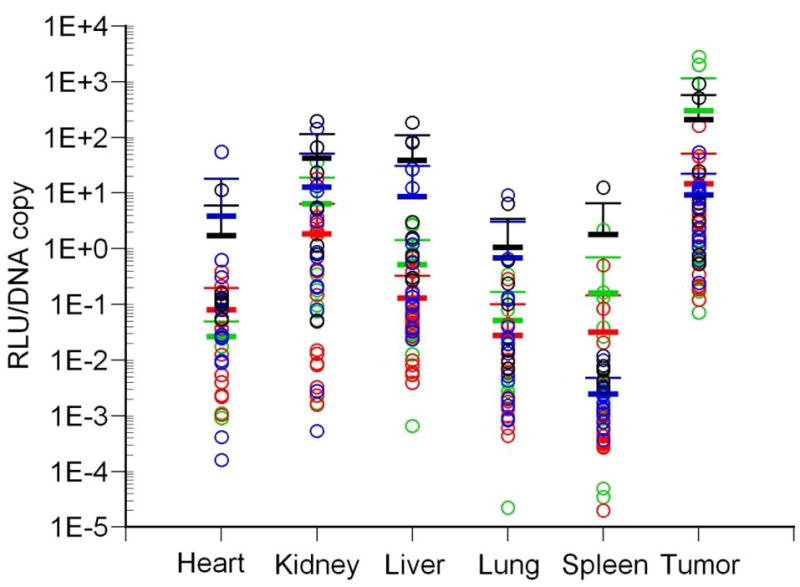
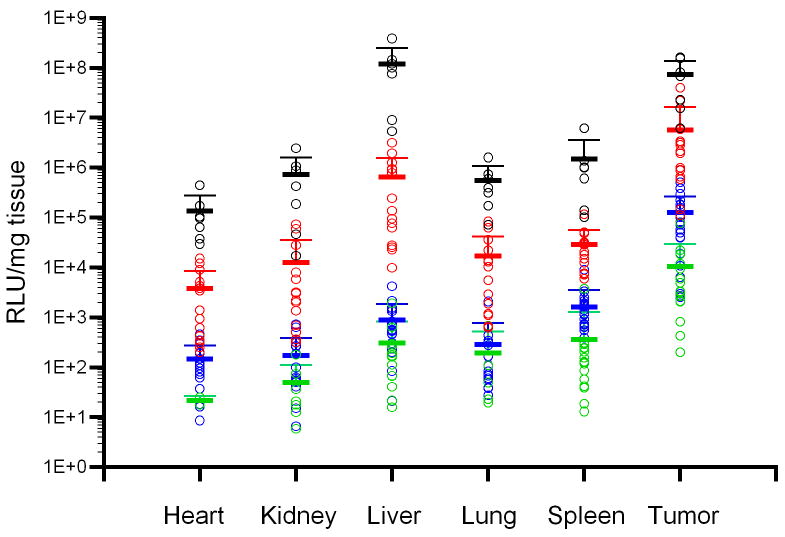
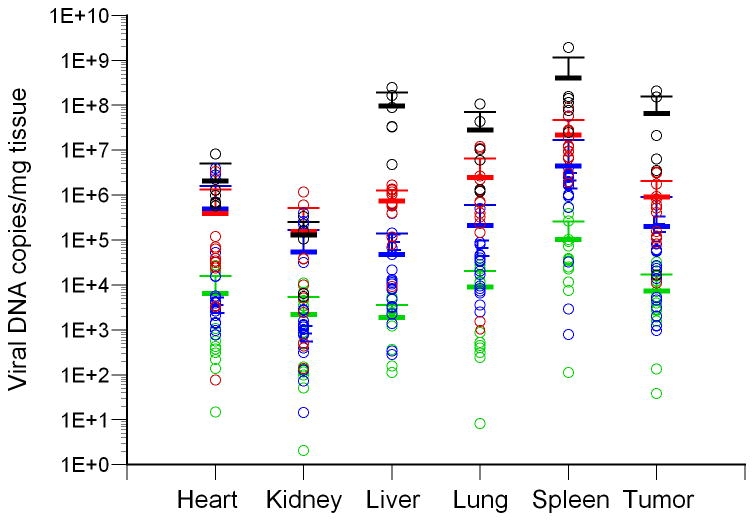
The biodistribution of luciferase activity in major tissues of tumor-bearing mice following intravenous injection with varying doses of AdCMVLuc is shown. Panel A, bioluminescent imaging of luciferase expression at different viral doses. Mice were imaged for 1 minute (1010 and 1011 viral particles) or 3 minutes (109 particles). Regions of interest used for quantitation of luciferase expression by imaging software, with red indicating the highest level of signal intensity, are shown by red circles. Panels B-D, black symbols, 1012 viral particles per mouse; red symbols, 1011 viral particles; blue symbols, 1010 viral particles; green symbols, 109 viral particles. Horizontal bars indicate the mean of each group, with standard deviation indicated by the error bars. Panel B, Luciferase activity was quantified in major organs and tumors by biochemical means and was expressed in relative light units (RLU) per milligram of tissue. Panel C, Viral DNA content in individual tissues was measured by real-time PCR assay for the adenovirus hexon gene. Values are expressed as DNA copies per milligram of tissue. Panel D, Specific activity, measured in RLU per DNA copy, in tissues of individual mice.
Developing HT1080 fibrosarcomas were also a major target of gene transfer and expression as shown biochemically by analyzing organ homogenates (Figure 1, panel B). Gene expression in the tumors following the administration of AdCMVLuc was clearly dose-dependent, as was expression in all other tissues tested. Although all organs showed gene expression, expression of luciferase in the tumor was higher than any other tissue at all doses below 1012 particles.
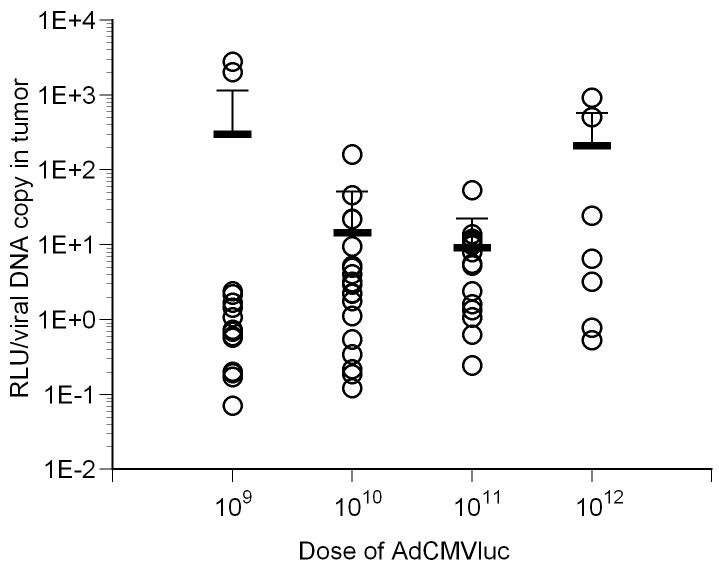
However, levels of gene transfer into individual tissues did not precisely match the levels of gene expression. Quantification of viral DNA copy number per milligram of tissue revealed variability in viral gene transfer in individual tissues, with the spleen containing the highest amount of viral DNA at any given dose (Figure 1, panel C). Therefore, luciferase activity measurements and viral DNA content were normalized to correct for gene transfer differences in the various tissues of individual mice. The results of this analysis are shown in Figure 1, panel D. Statistical analysis of the tumor data showed no significant differences between the four doses when luciferase was normalized on a per viral DNA copy basis (Figure 2, panel A).
Figure 2.
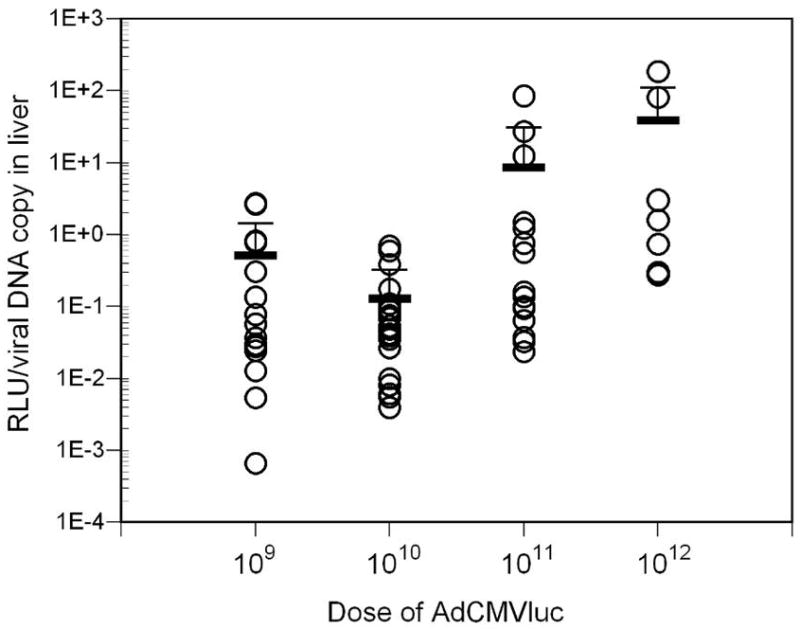
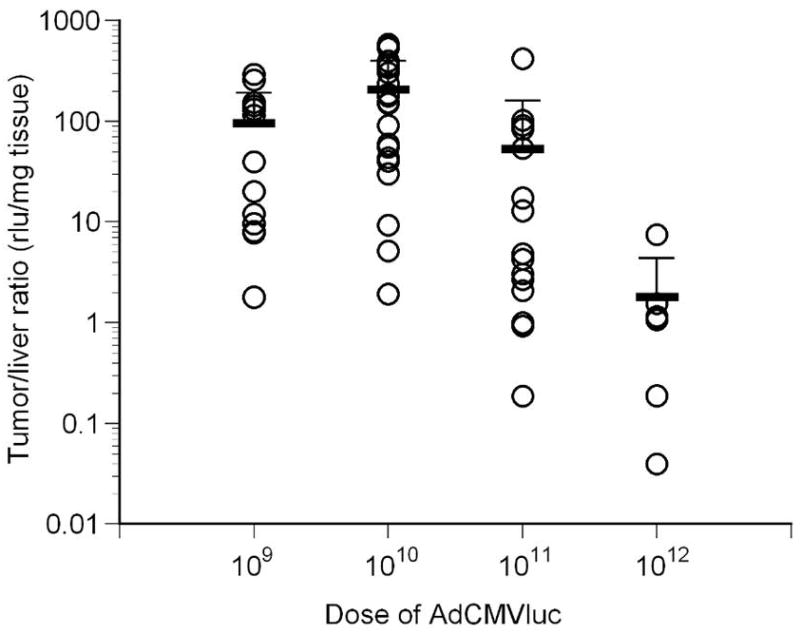
Luciferase activity and viral DNA content in tumors following intravenous injection with varying doses of AdCMVLuc. Mean and standard deviation are given by the horizontal and error bars. Panel A, specific activity in RLU/DNA copy in tumors of individual mice. No significant differences among the four doses were observed. Panel B, the specific activity in RLU/DNA copy in livers of individual mice is shown. All groups were significantly different from each other (p=0.001 by Kruskal-Wallis, Mann-Whitney p<0.002). Panel C, specificity of luciferase expression in mice, calculated from tumor/liver ratio. The ratios for all groups were significantly different from each other (p<0.001 by Kruskal-Wallis, Mann-Whitney p<0.03) except for 109 vs. 1011.
In contrast to tumors, the liver exhibited significantly higher normalized gene expression at higher viral doses compared to the lower doses (Figure 2, panel B; p<0.001 by Kruskal-Wallis), with significant differences found between the 109 versus 1012 (p=0.011) and 1010 versus both 1011 (p=0.009) and 1012 (p<0.001) doses by pairwise comparison. Furthermore, a Jonkheere-Terpstra analysis showed significantly higher luciferase expression per DNA copy in the liver with increasing viral dose (p=1.93E-14). No significant differences between the four doses administered were observed in RLU/DNA copy in any other tissue except spleen (p=0.012 by Kruskal-Wallis), where significant differences were observed between the 1010 versus 1012 (p=0.007) and 1011 versus 1012 (p=0.002) doses by pairwise comparison. Overall, these results suggest that gene expression from individual copies of viral DNA is preferentially up-regulated in liver cells in direct proportion to increasing viral dose.
The ratio of luciferase expression per mg of tissue in tumor versus liver was also determined to evaluate the specificity of gene expression in these two tissues (Figure 2, panel C). Results showed higher gene expression in the tumor compared to the liver across all viral doses (p<0.001 by Kruskal-Wallis) and for all pairwise comparisons (Mann-Whitney p<0.03) except for 109 vs 1011 (p=0.118). Even though the tumor/liver ratio for 1010 was significantly higher than 109 (mean 213 vs. 77), a Jonkheere-Terpstra test for trend showed a significantly lower tumor/liver ratio with increasing viral doses (p=5.68E-4). These data suggest that a dose at or below 1010 particles dramatically reduces liver gene expression compared to tumor, and indicate that reducing the viral dose is an effective strategy to increase tumor selectivity by transcriptional targeting.
Histological examination of gene expression following AdCMVβgal injection confirmed the dose-dependency of gene expression observed with the luciferase virus. At virus doses at or below 1010 particles, the frequency of transduced cells in the tumor was not a measurable proportion of the cells. Even at 1011 particles, the number of transduced cells in the tumor was low, and was a small percentage of the number seen in the liver (Figure 3). Only at the highest dose of 1012 particles could tumor transduction be called relatively common, and transduced tumor cells were most often observed on the periphery of the developing tumor. At this dose however, virtually every cell in the liver was transduced and histological evidence of tissue damage was evident in some mice.
Figure 3.
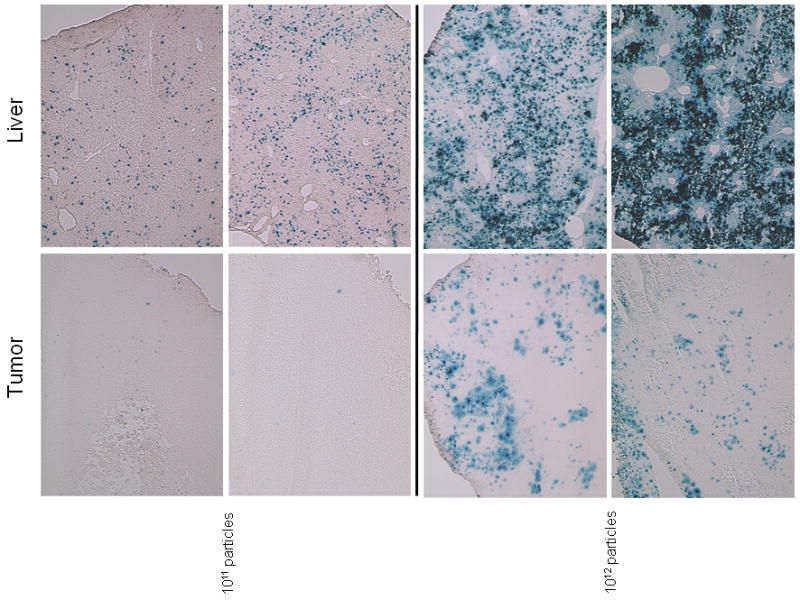
Histological detection of gene transfer into tumor and liver in mice following intravenous injection. Tumor and liver from two representative mice injected with 1011 or 1012 viral particles AdCMVβgal were cryosectioned and stained for β–galactosidase expression. A lower dose (1010 particles) revealed proportionally fewer blue cells in both liver and tumor (data not shown).
Although these results suggest that the overall level of viral transduction in tumors is low by comparison to the liver, the biochemical evidence previously described demonstrated substantial gene expression and high selectivity at doses below 1011 particles. Moreover, gene expression normalized for DNA copy number at 1010 particles in tumors exceeds that of other tissues by 10 to 1000-fold (Figure 1, panel D) demonstrating a high level of tumor selectivity. A dose of 1010 viral particles was therefore used in all subsequent experiments.
Induction of Expression from Promoters In Vitro
We next examined the relative strength of gene expression from a panel of viral, cellular and chimeric promoters in HT1080 cells in vitro. Relative expression was determined by comparison of luciferase activity following infection with equal titers of virus harboring the different promoters. Relative gene expression varied more than 3 logs (Figure 4, panel A). The mEpo, SOD2 and CAIX promoters were all less than 0.5% of CMV, as was the chimeric FoxO-responsive Fbe8TK. The cellular promoters SURV and PAI-1 were 2-3% of CMV, whereas the viral promoters RSV and SRα were 7-12% of CMV. The inflammation-responsive C3/CMV chimera was almost as strong as CMV, which is not surprising since a large portion of the CMV promoter is contained within it. Of note, the chimeric Hre3TK was 21% and the Hy3PAI-1 chimera was 97% as efficient as CMV.
Figure 4.
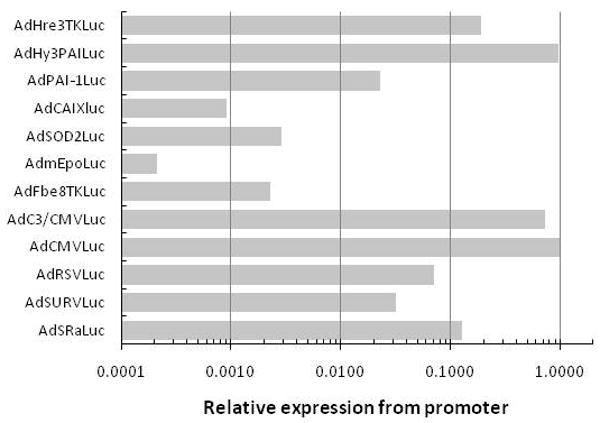
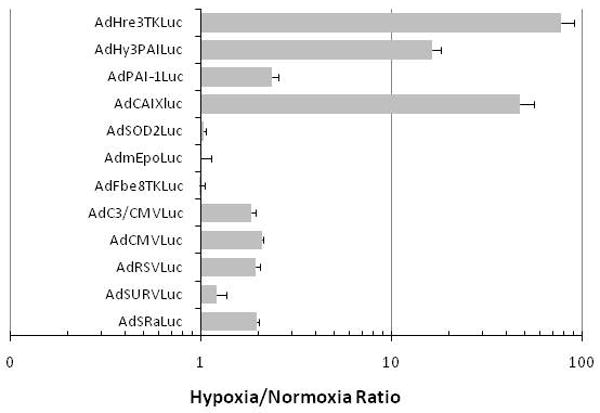
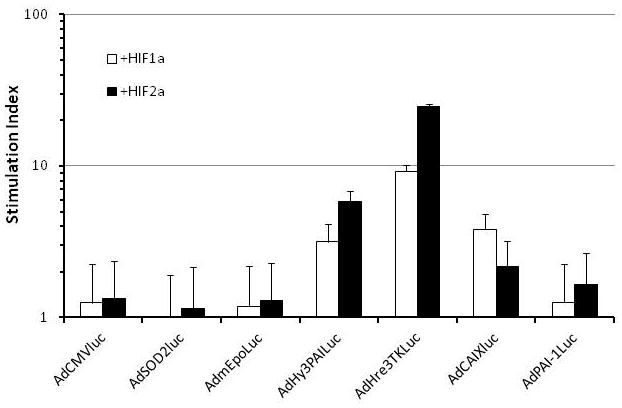
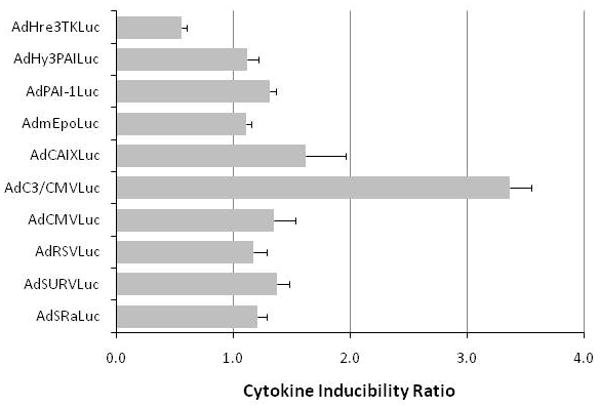
The induction of luciferase expression in HT1080 tumor cells infected with various promoter viruses by hypoxia or cytokine-rich medium. Cells were infected with equivalent MOIs of the different viruses and exposed to 1% oxygen (hypoxia) or 95% air/5% CO2 (normoxia) for 16 hr prior to biochemical determination of luciferase activity. Panel A, the relative expression of luciferase under normoxic conditions for the different promoter constructs is compared, with CMV arbitrarily set to unity. Panel B, the expression ratio for hypoxia/normoxia is graphed to show the high level of inducibility for the CAIX and Hre-containing chimeric promoters. Panel C, Ratio of expression (stimulation index) from the various promoters with and without co-infection with Hif-1α or Hif-2α expressing adenoviral vectors in HT1080 cells. Only promoters previously shown to be hypoxia responsive were stimulated by Hif co-expression. Panel D, cells were infected with equivalent MOIs of the different adenovirus vectors and exposed to cytokine-rich conditioned medium or control medium for 16 hr prior to biochemical determination of luciferase activity. Relative expression of luciferase in cells treated with the two media was then used to determine the cytokine inducibility ratio.
These same promoters were then tested for induction under hypoxic conditions (1% oxygen). Other than the CAIX promoter (induced more than 40-fold) and the two chimeras containing Hre binding sites, Hy3PAI and Hre3TK (induced 15-fold and 75-fold, respectively), no other promoter was particularly responsive to hypoxia (Figure 4, panel B). Interestingly, even the viral promoters SRα, RSV, CMV and C3/CMV consistently showed a small but reproducible level of induction (about 2-fold), and a 2-3 fold induction was also observed for PAI-1, a known hypoxia-responsive gene. Not the Fbe8TK, mEpo, SOD2 nor the SURV promoter was induced by hypoxia in HT1080 cells.
To examine the role of specific HIF factors in the hypoxia-responsive expression of the various promoters, HT1080 cells were infected with the panel of promoter viruses and co-infected with constitutively active HIF1α- or HIF2α-expressing adenovirus vector.22 Several promoters previously shown to be hypoxia responsive (Hy3PAI, Hre3TK, CAIX) were stimulated significantly by co-infection with the HIF-expressing vectors (Figure 4, panel C). However, other hypoxia inducible and HIF-responsive reporters, including ones containing regulatory regions from the SOD2 promoter20 and mEpo enhancer,21 were not activated by HIF overexpression. One possibility is that HT1080 cells lack ancillary transcription factor(s) required to drive HIF-dependent expression from promoters that are otherwise active in other cell lines. Alternatively, HT1080 cells may express repressor proteins that inhibit HIF-dependent expression from these promoters.
To evaluate the possibility that an inflammatory response could also induce gene expression of these reporters in tumor cells, cytokine induction of gene expression was examined for this panel of promoters in HT1080 cells in vitro. The results showed that the C3/CMV hybrid promoter was significantly responsive to cytokine-rich medium (Figure 4, panel D), as previously observed.14
Gene Expression from Various Promoters in Tumor-bearing Mice
Given the widely variable levels of gene expression from the different promoters in vitro and their differential responses to hypoxia and cytokine signaling, we next evaluated the relative strength and specificity of luciferase expression in HT1080 tumor-bearing mice following intravenous administration of adenoviral vectors containing the various promoters. The AdMYO2.0Luc virus was used as a negative control, since this promoter is unlikely to drive expression of luciferase in any of the tissues tested. Mice were injected with 1010 particles of virus and bioluminescent imaging was performed after three days of expression. With the exception of the AdMYO2.0Luc promoter, luciferase expression in tumors was readily observed from all promoter constructs with exposures of one to five minutes, although individual mice varied widely in expression levels (Figure 5, panel A). Some promoters also routinely showed detectable liver expression (AdC3/CMVLuc), although most did not, and luciferase activity was not readily observed in other organs. Total tumor light flux in tumors varied widely from less than 105 photons/sec to more than 108 photons/sec.
Figure 5.
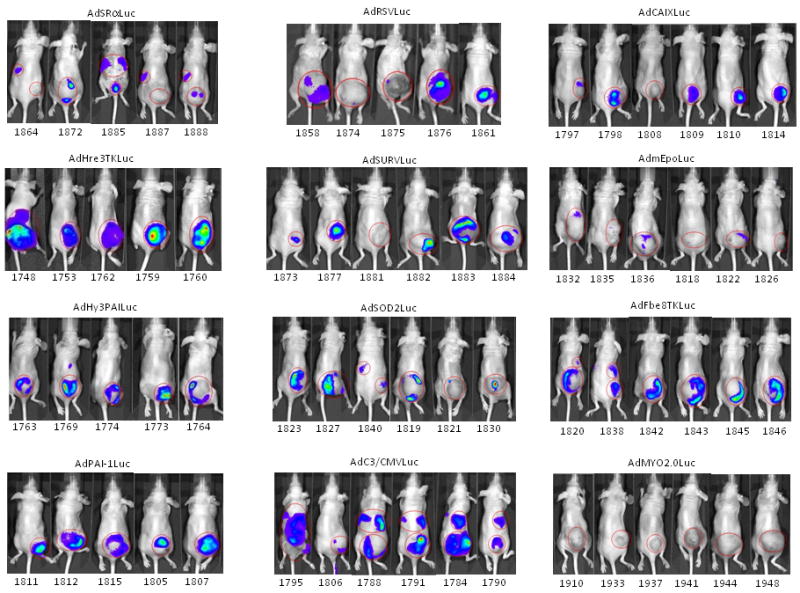
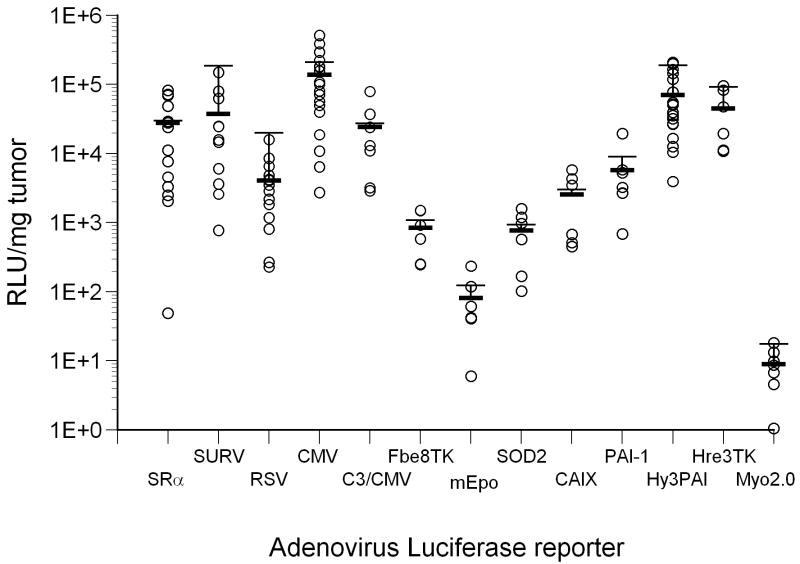
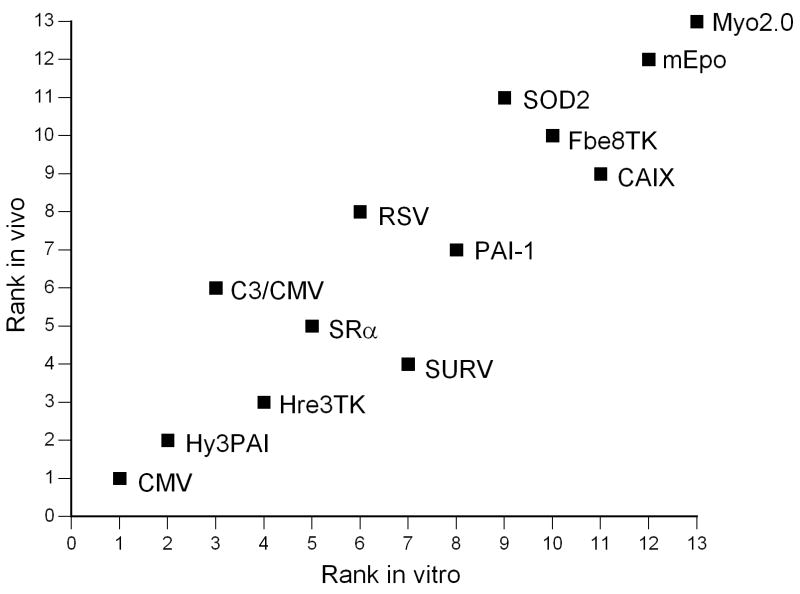
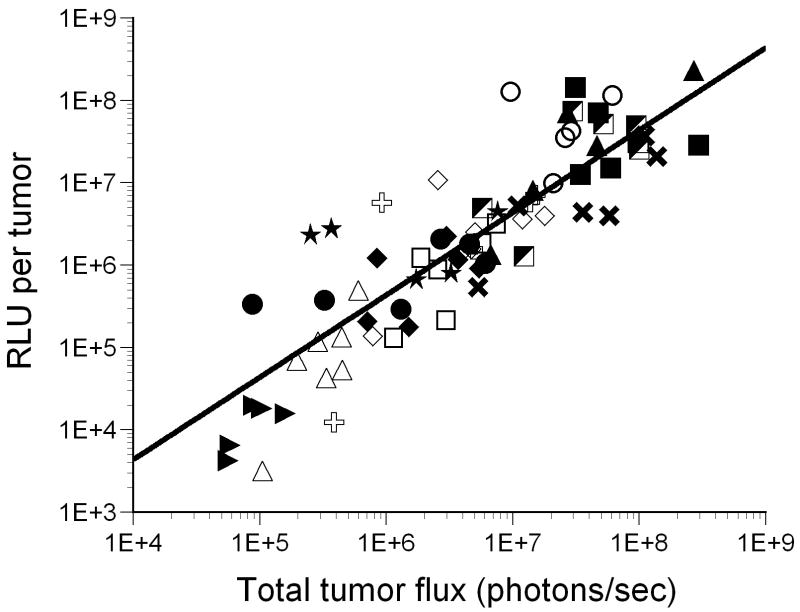
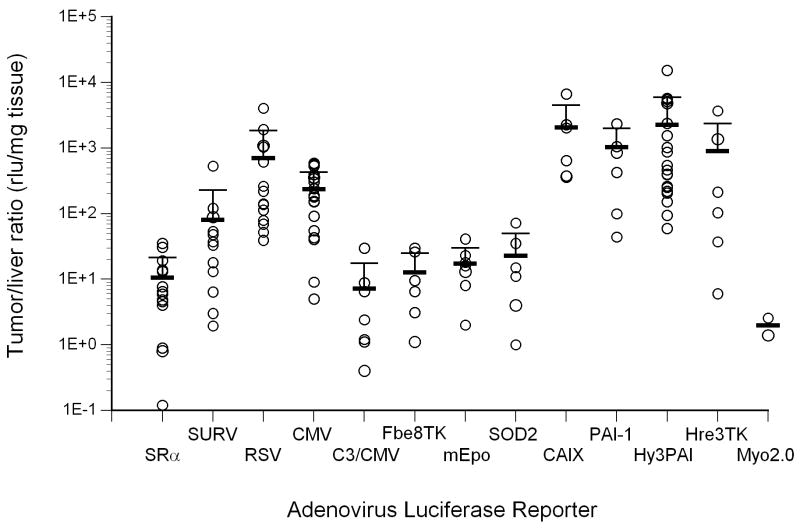
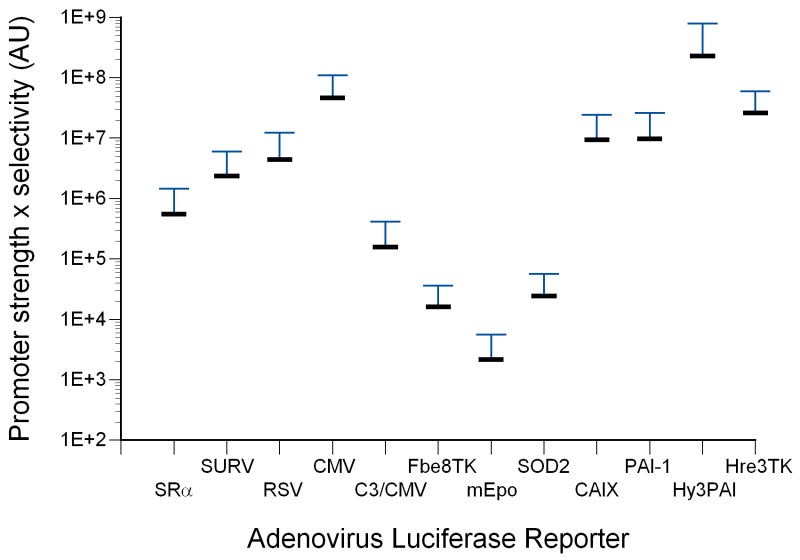
Expression of luciferase in mice following intravenous injection with recombinant adenoviruses harboring various promoter-luciferase gene combinations is shown. Panel A, expression of luciferase in tumor-bearing mice from recombinant adenoviruses harboring various promoter-luciferase gene combinations using bioluminescent imaging. Mice injected with AdHre3TKLuc, AdHy3PAI-1Luc and AdC3/CMVLuc were imaged for 1 min, and AdmEpoLuc mice were imaged for 5 min. All other mice were imaged for 3 min. Regions of interest (ROI) for determination of total light flux from the tumors are indicated by red circles. In some cases, the liver is also circled. Panel B, relative expression of luciferase in tumors (RLU/mg tissue) determined biochemically for the different promoters. Values for individual mice are shown by the circles, with mean and standard deviation indicated by the horizontal and error bars. Panel C, Rank order of gene expression levels from promoters compared in vitro and in vivo. Panel D, correlation of the total tumor flux determined by bioluminescent imaging of the ROIs shown in panel A with the biochemically determined luciferase activity (RLU per tumor). The trendline was fit to a power function with y=0.1865×1.0564 with r2= 0.772 for all available data points from all adenoviral promoter constructs injected at 1×10¹⁰ particles. AdHre3TKLuc, filled squares; AdHy3PAILuc, open circles; AdCMVLuc, filled triangles; AdEpoLuc, open triangles; AdFbe8TKLuc, open squares; AdSOD2Luc, filled diamonds; AdC3/CMVLuc, half-filled squares; AdPAI-1Luc, open diamonds; AdCAIXLuc, filled circles; AdRSVLuc, filled stars; AdSURVLuc, filled crosses; AdSRαLuc, open plusses; AdMyo2.0Luc, filled arrowheads. Panel E, Specificity of expression in tumors relative to liver. Values for individual mice are shown by the circles, with mean and standard deviation given by the horizontal and error bars. Panel F, a measure of promoter strength and selectivity, in arbitrary units, for the different promoter viruses. The mean of each group of mice is indicated by the horizontal bar, with the positive standard deviation shown by the error bar.
The distribution of luciferase expression from the various promoters in tumor-bearing mice was also examined using biochemical methods. Measurement of luciferase expression in tumors on a per weight basis revealed high levels of expression in the tumor for most promoters except for MYO2.0 (Figure 5, panel B). Greater expression in vitro also correlated well with higher expression levels in vivo when plotted as rank order of expression strength (Figure 5 panel C). The hypoxia-responsive promoters Hre3TK, PAI-1 and CAIX expressed more luciferase in vivo than expected based on the in vitro results, however, which was particularly surprising for the CAIX promoter because of the low levels of expression observed for this promoter in vitro. The highest level of expression was observed using the CMV promoter (>105 RLU/mg tumor), and the lowest level was seen with the myoglobin promoter (<101 RLU/mg tumor).
Comparison of the total light units of luciferase expression by biochemical and imaging modalities was performed for individual tumors in mice injected with the different promoter viruses (Figure 5, panel D). The quantitative values for the different promoter viruses ranged widely over several orders of magnitude. The correlation coefficient for the line plotted through all the data was 0.772, which suggests relatively close agreement of biochemically determined and bioluminescent imaging quantitation of luciferase expression.
Strength of expression was not the only important factor in evaluating gene expression from the adenoviral vectors in vivo. Specificity of tumor expression was also a primary concern due to the high levels of adenoviral infection observed in liver in prior investigations. The ratio of tumor to liver expression was therefore calculated on a weight basis for each of the vectors. Data for individual mice injected with the different promoter viruses are shown in Figure 5, panel E. For every promoter except Myo2.0, the mean ratio was significantly higher than unity (range 7-2264), indicating relatively specific gene expression in tumors compared to liver at this dose of 1010 particles. Again, the hypoxia-responsive promoters (Hy3PAI, Hre3TK, PAI-1 and CAIX) were distinctive in that they expressed significantly more luciferase in tumor than liver (range 898-2264). Also of note, the viral promoters CMV and RSV exhibited relatively high tumor selectivity that was even greater than the tumor-specific survivin promoter.18
Combining the measurements of strength and specificity of expression in tumors gives a comparative measure of the suitability of a particular promoter for gene expression in vivo in HT1080 tumors following intravenous adenovirus injection. This analysis is graphed in Figure 5, panel F, and again shows that the hypoxia-responsive promoters Hy3PAI, Hre3TK, PAI-1 and CAIX, as well as CMV, are best suited for strong and specific gene expression in tumors in vivo.
Discussion
Transcriptional targeting using adenoviral vectors has emerged as an attractive strategy for achieving tumor-specific gene expression in the treatment or imaging of solid malignancies. A number of practical issues, however, still need to be addressed. One area of primary concern is improving the specificity of these vectors for tumor tissue over normal cells to reduce potential toxicities associated with non-specific cell transduction and to improve the sensitivity of imaging modalities using these approaches. Off-target adenoviral transduction and expression is particularly problematic in the liver, where the unique vascular architecture of the sinusoidal endothelium allows unrestricted access of hepatic parenchymal cells to virus particles.30 In addition, recent evidence suggests that a primary mechanism of liver infection is independent of the adenoviral fiber: coxsackievirus-adenovirus receptor (CAR) interaction that predominates during adenoviral infection of other cells.31, 32 Ablating native fiber knob interactions would therefore be largely ineffective at detargeting adenovirus from liver tissue, and other approaches will likely be required to reduce hepatic toxicity for clinical applications. Incorporating cell-specific promoters into adenoviral vectors is a reasonable strategy to increase transgene expression specifically in cancer cells, and further work is needed to effectively develop this approach. The current study was designed to optimize adenoviral transcriptional targeting using a variety of promoters to improve the tumor-specific activation of a reporter gene.
In addition to cell-specific promoters, results from this study also show that the strong, constitutively active CMV promoter can drive gene transcription in a tumor-specific manner at lower viral doses. This improved tumor specificity at lower concentrations was surprising given the overall ubiquitous nature of the CMV regulatory element and the tendency of unmodified adenoviral particles to efficiently infect liver cells. Previous work has demonstrated that the developing neovasculature in solid tumors is highly disorganized and freely permeable to circulating proteins and other macromolecules,1, 12 and a number of proposed mechanisms have been suggested to explain this effect. The leaky tumor vasculature likely provides a route of accessibility through which adenovirus particles infect tumor cells, in a manner analogous to the general increased exposure and transduction by adenovirus normally seen in healthy liver tissue. Despite the low absolute frequency of cell transduction demonstrated by histological staining for β-galactosidase expression in tumors following intravenous injection of adenoviral vectors, it is clear that HT1080 tumor transduction can be readily detected and is likely increased by the unique microenvironment of the tumor. This increase in adenoviral transduction of the tumor probably represents a major mechanism for the selective delivery and expression of genes observed in this study.
Tumor-specific gene expression can also be explained through the selective up-regulation of CMV-driven expression in tumors by comparison to normal tissues, an effect that could be due to an inflammatory response. NF-kB is activated by inflammatory responses and is known to drive expression from CMV promoters.33, 34 The administration of adenoviral vectors also causes dose-dependent inflammatory responses,35 so reducing the viral dose likely acts to restrict CMV-mediated transgene expression in the liver. However, NF-kB is constitutively active in most cancers,9 so increased tumor-specific CMV-driven gene expression can occur even in the absence of viral inflammation. Restricting adenovirus-induced inflammatory responses in normal tissues through careful dose monitoring therefore represents another strategy to increase tumor-specific transcriptional targeting using adenoviral technology.
In addition to the constitutive inflammatory response seen in many malignancies, the disorganized and leaky vasculature observed in solid tumors often results in a profound hypoxic state,2 providing additional opportunities for tumor-specific transcriptional targeting.36-38 Results from this investigation showed that the use of hypoxia-responsive promoters resulted in selective gene expression in tumors by comparison to liver, and generally performed better than the other promoters with respect to overall expression and tumor selectivity. In particular, the hypoxia-responsive promoters CAIX, Hy3PAI, Hre3TK, and PAI-1 were highly tumor selective in vivo. Although the in vitro and in vivo levels of gene expression were generally well-correlated for the different promoters, expression of luciferase in vivo was in fact greater than expected based on in vitro results for the CAIX and PAI-1 promoters. PAI-1 is an acute phase response gene that is highly expressed in HT1080 cells,39, 40 which could account for both PAI-1 and Hy3PAI-1 promoter selectivity in the stressed tumor microenvironment. Although SOD2 and mEpo promoters are also known to be hypoxia-responsive,20-22 HT1080 cells may lack other specific transcription factors required for high level gene expression from these promoters. In general, our results support the use of hypoxia-responsive promoters to drive the expression of exogenous transgenes for tumor-specific transcriptional targeting using adenoviral vectors.
Results from this investigation suggest that tumor-specific expression of transgenes from adenoviral vectors administered intravenously can be greatly improved by reducing the viral dose and through the incorporation of hypoxia-inducible promoters. Combining these strategies could also represent an additive or synergistic improvement over either method alone, and could greatly improve the effectiveness and safety of transcriptional targeting approaches by taking advantage of the unique tumor microenvironment. Further studies focusing on the optimization of adenoviral systems using transcriptional targeting could provide researchers with valuable new therapeutic and imaging tools for the treatment and monitoring of malignant neoplasias.
Acknowledgments
The authors wish to thank Caroline Humphries, Julie Poirot and Fred Kruse for technical help with recombinant virus construction and preparation, Paul Card for preparation of the manuscript, and Phil Thorpe for critically reading it. Julia Kozlitina and Alex Pertsemlidis provided statistical advice and performed the Jonckheere-Terpstra analysis. Optical imaging was facilitated by the UTSouthwestern Small Animal Imaging Research Program funded by NCI U24 CA126608. This work was supported by a Texas Higher Education Coordinating Board Advanced Technology Program grant and by NIH R01 CA115935 to RDG.
Footnotes
Conflict of Interest: The authors declare they have no conflict of interest.
References
- 1.Ocak I, Baluk P, Barrett T, McDonald DM, Choyke P. The biologic basis of in vivo angiogenesis imaging. Front Biosci. 2007;12:3601–3616. doi: 10.2741/2337. [DOI] [PubMed] [Google Scholar]
- 2.Neri D, Bicknell R. Tumour vascular targeting. Nat Rev Cancer. 2005;5(6):436–446. doi: 10.1038/nrc1627. [DOI] [PubMed] [Google Scholar]
- 3.Gupta K, Kshirsagar S, Li W, Gui L, Ramakrishnan S, Gupta P, et al. VEGF prevents apoptosis of human microvascular endothelial cells via opposing effects on MAPK/ERK and SAPK/JNK signaling. Exp Cell Res. 1999;247(2):495–504. doi: 10.1006/excr.1998.4359. [DOI] [PubMed] [Google Scholar]
- 4.Yan L, Hsu K, Beckman RA. Antibody-based therapy for solid tumors. Cancer J. 2008;14(3):178–183. doi: 10.1097/PPO.0b013e318172d71a. [DOI] [PubMed] [Google Scholar]
- 5.Ahmed Z, Bicknell R. Angiogenic signalling pathways. Methods Mol Biol. 2009;467:3–24. doi: 10.1007/978-1-59745-241-0_1. [DOI] [PubMed] [Google Scholar]
- 6.Brahimi-Horn C, Pouyssegur J. The role of the hypoxia-inducible factor in tumor metabolism growth and invasion. Bull Cancer. 2006;93(8):E73–80. [PubMed] [Google Scholar]
- 7.Maxwell PH, Dachs GU, Gleadle JM, Nicholls LG, Harris AL, Stratford IJ, et al. Hypoxia-inducible factor-1 modulates gene expression in solid tumors and influences both angiogenesis and tumor growth. Proc Natl Acad Sci U S A. 1997;94(15):8104–8109. doi: 10.1073/pnas.94.15.8104. [DOI] [PMC free article] [PubMed] [Google Scholar]
- 8.Boehm JS, Zhao JJ, Yao J, Kim SY, Firestein R, Dunn IF, et al. Integrative genomic approaches identify IKBKE as a breast cancer oncogene. Cell. 2007;129(6):1065–1079. doi: 10.1016/j.cell.2007.03.052. [DOI] [PubMed] [Google Scholar]
- 9.Karin M. NF-kappaB and cancer: mechanisms and targets. Mol Carcinog. 2006;45(6):355–361. doi: 10.1002/mc.20217. [DOI] [PubMed] [Google Scholar]
- 10.Yao JC, Wang L, Wei D, Gong W, Hassan M, Wu TT, et al. Association between expression of transcription factor Sp1 and increased vascular endothelial growth factor expression, advanced stage, and poor survival in patients with resected gastric cancer. Clin Cancer Res. 2004;10(12 Pt 1):4109–4117. doi: 10.1158/1078-0432.CCR-03-0628. [DOI] [PubMed] [Google Scholar]
- 11.Mees C, Nemunaitis J, Senzer N. Transcription factors: their potential as targets for an individualized therapeutic approach to cancer. Cancer Gene Ther. 2009;16(2):103–112. doi: 10.1038/cgt.2008.73. [DOI] [PubMed] [Google Scholar]
- 12.Fukumura D, Jain RK. Imaging angiogenesis and the microenvironment. APMIS. 2008;116(7-8):695–715. doi: 10.1111/j.1600-0463.2008.01148.x. [DOI] [PMC free article] [PubMed] [Google Scholar]
- 13.Herz J, Gerard RD. Adenovirus-mediated transfer of low density lipoprotein receptor gene acutely accelerates cholesterol clearance in normal mice. Proc Natl Acad Sci U S A. 1993;90(7):2812–2816. doi: 10.1073/pnas.90.7.2812. [DOI] [PMC free article] [PubMed] [Google Scholar]
- 14.Varley AW, Munford RS. Physiologically responsive gene therapy. Mol Med Today. 1998;4(10):445–451. doi: 10.1016/s1357-4310(98)01333-1. [DOI] [PubMed] [Google Scholar]
- 15.de Wet JR, Wood KV, DeLuca M, Helinski DR, Subramani S. Firefly luciferase gene: structure and expression in mammalian cells. Mol Cell Biol. 1987;7(2):725–737. doi: 10.1128/mcb.7.2.725. [DOI] [PMC free article] [PubMed] [Google Scholar]
- 16.Takebe Y, Seiki M, Fujisawa J, Hoy P, Yokota K, Arai K, et al. SR alpha promoter: an efficient and versatile mammalian cDNA expression system composed of the simian virus 40 early promoter and the R-U5 segment of human T-cell leukemia virus type 1 long terminal repeat. Mol Cell Biol. 1988;8(1):466–472. doi: 10.1128/mcb.8.1.466. [DOI] [PMC free article] [PubMed] [Google Scholar]
- 17.Aoki K, Barker C, Danthinne X, Imperiale MJ, Nabel GJ. Efficient generation of recombinant adenoviral vectors by Cre-lox recombination in vitro. Mol Med. 1999;5(4):224–231. [PMC free article] [PubMed] [Google Scholar]
- 18.Chen JS, Liu JC, Shen L, Rau KM, Kuo HP, Li YM, et al. Cancer-specific activation of the survivin promoter and its potential use in gene therapy. Cancer Gene Ther. 2004;11(11):740–747. doi: 10.1038/sj.cgt.7700752. [DOI] [PubMed] [Google Scholar]
- 19.University of Michigan Vector Core. [October 12, 2009]. [Web Site]. Available at: http://www.med.umich.edu/vcore/Plasmids/pACRSVpLpA(-)loxP-SSP.htm.
- 20.Scortegagna M, Ding K, Oktay Y, Gaur A, Thurmond F, Yan LJ, et al. Multiple organ pathology, metabolic abnormalities and impaired homeostasis of reactive oxygen species in Epas1-/- mice. Nat Genet. 2003;35(4):331–340. doi: 10.1038/ng1266. [DOI] [PubMed] [Google Scholar]
- 21.Dioum EM, Clarke SL, Ding K, Repa JJ, Garcia JA. HIF-2alpha-haploinsufficient mice have blunted retinal neovascularization due to impaired expression of a proangiogenic gene battery. Invest Ophthalmol Vis Sci. 2008;49(6):2714–2720. doi: 10.1167/iovs.07-1469. [DOI] [PubMed] [Google Scholar]
- 22.Dioum EM, Chen R, Alexander MS, Zhang Q, Hogg RT, Gerard RD, et al. Regulation of hypoxia-inducible factor 2alpha signaling by the stress-responsive deacetylase sirtuin 1. Science. 2009;324(5932):1289–1293. doi: 10.1126/science.1169956. [DOI] [PubMed] [Google Scholar]
- 23.Tian H, McKnight SL, Russell DW. Endothelial PAS domain protein 1 (EPAS1), a transcription factor selectively expressed in endothelial cells. Genes Dev. 1997;11(1):72–82. doi: 10.1101/gad.11.1.72. [DOI] [PubMed] [Google Scholar]
- 24.McKnight SL, Gavis ER, Kingsbury R, Axel R. Analysis of transcriptional regulatory signals of the HSV thymidine kinase gene: identification of an upstream control region. Cell. 1981;25(2):385–398. doi: 10.1016/0092-8674(81)90057-x. [DOI] [PubMed] [Google Scholar]
- 25.Biggs WH, 3rd, Meisenhelder J, Hunter T, Cavenee WK, Arden KC. Protein kinase B/Akt-mediated phosphorylation promotes nuclear exclusion of the winged helix transcription factor FKHR1. Proc Natl Acad Sci U S A. 1999;96(13):7421–7426. doi: 10.1073/pnas.96.13.7421. [DOI] [PMC free article] [PubMed] [Google Scholar]
- 26.Gerard RD, Meidell RS. In: Adenovirus Vectors in DNA Cloning - A Practical Approach: Mammalian Systems. Hames BD, Glover D, editors. Oxford University Press; Oxford: 1995. pp. 285–307. [Google Scholar]
- 27.Varley AW, Coulthard MG, Meidell RS, Gerard RD, Munford RS. Inflammation-induced recombinant protein expression in vivo using promoters from acute-phase protein genes. Proc Natl Acad Sci U S A. 1995;92(12):5346–5350. doi: 10.1073/pnas.92.12.5346. [DOI] [PMC free article] [PubMed] [Google Scholar]
- 28.Garnett CT, Pao CI, Gooding LR. Detection and quantitation of subgroup C adenovirus DNA in human tissue samples by real-time PCR. Methods Mol Med. 2007;130:193–204. doi: 10.1385/1-59745-166-5:193. [DOI] [PubMed] [Google Scholar]
- 29.R Development Core Team. R Foundation for Statistical Computing; Vienna, Austria: 2008. R: A language and environment for statistical computing. URL http://www.R-project.org. [Google Scholar]
- 30.Wisse E, Jacobs F, Topal B, Frederik P, De Geest B. The size of endothelial fenestrae in human liver sinusoids: implications for hepatocyte-directed gene transfer. Gene Ther. 2008;15(17):1193–1199. doi: 10.1038/gt.2008.60. [DOI] [PubMed] [Google Scholar]
- 31.Kalyuzhniy O, Di Paolo NC, Silvestry M, Hofherr SE, Barry MA, Stewart PL, et al. Adenovirus serotype 5 hexon is critical for virus infection of hepatocytes in vivo. Proc Natl Acad Sci U S A. 2008;105(14):5483–5488. doi: 10.1073/pnas.0711757105. [DOI] [PMC free article] [PubMed] [Google Scholar]
- 32.Waddington SN, McVey JH, Bhella D, Parker AL, Barker K, Atoda H, et al. Adenovirus serotype 5 hexon mediates liver gene transfer. Cell. 2008;132(3):397–409. doi: 10.1016/j.cell.2008.01.016. [DOI] [PubMed] [Google Scholar]
- 33.Hayden MS, West AP, Ghosh S. NF-kappaB and the immune response. Oncogene. 2006;25(51):6758–6780. doi: 10.1038/sj.onc.1209943. [DOI] [PubMed] [Google Scholar]
- 34.DeMeritt IB, Milford LE, Yurochko AD. Activation of the NF-kappaB pathway in human cytomegalovirus-infected cells is necessary for efficient transactivation of the major immediate-early promoter. J Virol. 2004;78(9):4498–4507. doi: 10.1128/JVI.78.9.4498-4507.2004. [DOI] [PMC free article] [PubMed] [Google Scholar]
- 35.Liu Q, Muruve DA. Molecular basis of the inflammatory response to adenovirus vectors. Gene Ther. 2003;10(11):935–940. doi: 10.1038/sj.gt.3302036. [DOI] [PubMed] [Google Scholar]
- 36.Modlich U, Pugh CW, Bicknell R. Increasing endothelial cell specific expression by the use of heterologous hypoxic and cytokine-inducible enhancers. Gene Ther. 2000;7(10):896–902. doi: 10.1038/sj.gt.3301177. [DOI] [PubMed] [Google Scholar]
- 37.Post DE, Devi NS, Li Z, Brat DJ, Kaur B, Nicholson A, et al. Cancer therapy with a replicating oncolytic adenovirus targeting the hypoxic microenvironment of tumors. Clin Cancer Res. 2004;10(24):8603–8612. doi: 10.1158/1078-0432.CCR-04-1432. [DOI] [PubMed] [Google Scholar]
- 38.Binley K, Askham Z, Martin L, Spearman H, Day D, Kingsman S, et al. Hypoxia-mediated tumour targeting. Gene Ther. 2003;10(7):540–549. doi: 10.1038/sj.gt.3301944. [DOI] [PubMed] [Google Scholar]
- 39.Binder BR, Christ G, Gruber F, Grubic N, Hufnagl P, Krebs M, et al. Plasminogen activator inhibitor 1: physiological and pathophysiological roles. News Physiol Sci. 2002;17:56–61. doi: 10.1152/nips.01369.2001. [DOI] [PubMed] [Google Scholar]
- 40.Praus M, Wauterickx K, Collen D, Gerard RD. Reduction of tumor cell migration and metastasis by adenoviral gene transfer of plasminogen activator inhibitors. Gene Ther. 1999;6(2):227–236. doi: 10.1038/sj.gt.3300802. [DOI] [PubMed] [Google Scholar]
- 41.Bosma PJ, van den Berg EA, Kooistra T, Siemieniak DR, Slightom JL. Human plasminogen activator inhibitor-1 gene. Promoter and structural gene nucleotide sequences. J Biol Chem. 1988;263(19):9129–9141. [PubMed] [Google Scholar]
- 42.Semenza GL, Wang GL. A nuclear factor induced by hypoxia via de novo protein synthesis binds to the human erythropoietin gene enhancer at a site required for transcriptional activation. Mol Cell Biol. 1992;12(12):5447–5454. doi: 10.1128/mcb.12.12.5447. [DOI] [PMC free article] [PubMed] [Google Scholar]
- 43.Parsons WJ, Richardson JA, Graves KH, Williams RS, Moreadith RW. Gradients of transgene expression directed by the human myoglobin promoter in the developing mouse heart. Proc Natl Acad Sci U S A. 1993;90(5):1726–1730. doi: 10.1073/pnas.90.5.1726. [DOI] [PMC free article] [PubMed] [Google Scholar]


