Abstract
The objective of this study was to validate a deformable image registration technique, termed Hyperelastic Warping, for left ventricular strain measurement during systole using cine-gated, nontagged MR images with strains measured from tagged MRI. The technique combines deformation from high resolution, non-tagged MR image data with a detailed computational model, including estimated myocardial material properties, fiber direction, and active fiber contraction, to provide a comprehensive description of myocardial contractile function. A normal volunteer (male, age 30) with no history of cardiac pathology was imaged with a 1.5 T Siemens Avanto clinical scanner using a TrueFISP imaging sequence and a 32-channel cardiac coil. Both tagged and non-tagged cine MR images were obtained. The Hyperelastic Warping solution was evolved using a series of non-tagged images in ten intermediate phases from end-diastole to end-systole. The solution may be considered as ten separate warping problems with multiple templates and targets. At each stage, an active contraction was initially applied to a finite element model, and then image-based warping penalty forces were utilized to generate the final registration. Warping results for circumferential strain (R2 = 0.75) and radial strain (R2 = 0.78) were strongly correlated with results obtained from tagged MR images analyzed with a Harmonic Phase (HARP) algorithm. Results for fiber stretch, LV twist, and transmural strain distributions were in good agreement with experimental values in the literature. In conclusion, Hyperelastic Warping provides a unique alternative for quantifying regional LV deformation during systole without the need for tags.
Keywords: Strain, Left ventricle, Systole, Deformable image registration, Soft tissue mechanics, Finite element, Magnetic resonance imaging
1. Introduction
Left ventricular contractile function is representative of overall cardiac performance since the left ventricle (LV) controls systemic perfusion and corresponds to the oxygenation and nutrition supply of the entire body. Localized measures such as wall deformation, strain, or fiber stretch can provide regional quantification of myocardial contractile function. Typically, image-based analyses of LV function (e.g. MR tagging Axel et al., 2005; McVeigh and Zerhouni, 1991; Pai and Axel, 2006; Zerhouni et al., 1988), 2-D echocardiography (Ballo et al., 2006; Becker et al., 2006; Weidemann et al., 2001) provide fast results with clinically-relevant data, but the methods are partially limited by image noise and sparse image data. Higher resolution predictions of LV stress/strain are available with computational models that can account for localized material behavior, including fiber contraction and fiber direction (Guccione and McCulloch, 1993a,b; Veress et al., 2006), although the correspondence of these computational models with clinical data is generally unknown.
Algorithms for deformable image registration (Veress et al., 2005a,b; Weiss et al., 1998) have become a viable option for myocardial strain measurement due to the availability of images with sufficient spatial and temporal resolution using techniques such as cine-MRI (Plein et al., 2001). Deformable image registration is used to determine a deformation map that aligns the features of one image with the corresponding features in another image (Veress et al., 2005b). Regularizing functions and a priori data are typically necessary to ensure physically-reasonable predictions. Our laboratory has developed and applied Hyperelastic Warping (Veress et al., 2008; Weiss et al., 1998; Rabbitt et al., 1995) to measure strain directly from medical image data. Hyperelastic warping allows for a diffeomorphic image registration. An initial template image is chosen to represent the material in the reference configuration, while a target image is chosen to represent the same material after deformation. An image-based energy calculated from the intensity fields of the image pairs is combined with a hyperelastic regularization of the underlying deformation field. A spatially-varying body force is produced to deform the discretized template image into the target image by minimizing an energy functional.
Hyperelastic Warping has been previously validated for determination of left ventricular strains during diastole using an initial cine-MR image dataset from a normal human subject and a forward FE model of diastolic filling (Veress et al., 2005a, 2002, 2001). This approach has the potential to reduce the time required to obtain 3D myocardial strain information from MRI data and to provide better spatial resolution than tagging techniques. However, the use of deformable image registration to determine strain during systole is considerably more challenging than for diastole since the forces acting on the myocardium are generated by myofiber contraction within the ventricular wall rather than the passive mechanics associated with diastolic filling, and MR image data does not typically provide image texture within the wall to guide registration transmurally. The purpose of this study was to develop a methodology for measuring left ventricular deformation during systole with Hyperelastic Warping using cine-MR images by combining deformable image registration with a realistic model of systolic contraction directly in the image regularization term. Warping LV strains were validated with comparisons to strains from tagged images with Harmonic Phase analysis (HARP). A key advantage of this technique is that it combines high resolution, non-tagged MR image data with a detailed computational model, including material properties and active fiber contraction, to provide a comprehensive description of myocardial contractile function.
2. Materials and methods
2.1. Image acquisition
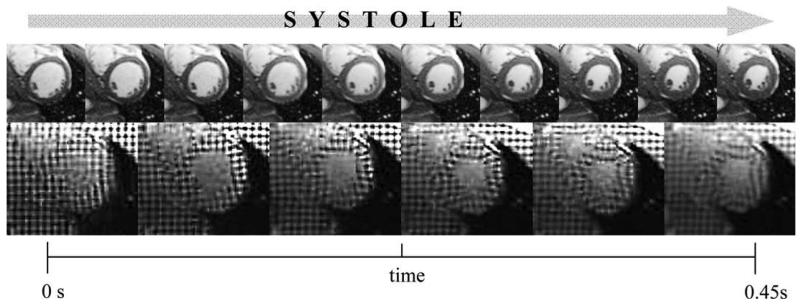
A normal volunteer with no history of cardiac pathology (male, age 30) was imaged using cine-gated MR images of the left ventricle, acquired with a TrueFISP sequence, during the entire systolic phase of the cardiac cycle. Images were obtained on a 1.5 T Siemens Avanto scanner with a prototype 32 channel cardiac coil from In Vivo (Gainesville, FL). For non-tagged images, TR = 50.0 ms, TE = 1.19 ms, flip angle = 57°, resolution = 1.7 mm × 1.7 mm, slice thickness = 4 mm. The image data were resampled for segmentation and warping and the images were cropped to focus on the left ventricle. The resampled images were 120 pixels (100 mm) × 120 pixels (100 mm) × 46 slices (2 mm thickness) (Fig. 1, top). Horizontal and vertical tagged images (Fig. 1, bottom) were also obtained in 9 short-axis slices of the LV during the same acquisition session for validation. The spacing between the tags was 6 mm and each slice was 4 mm thick. For the tagged imaging sequence, TR = 58 ms, TE = 4.6 ms, flip angle = 14°, and resolution = 1.7 mm × 1.7 mm.
Fig. 1.
Systolic contraction of the left ventricle depicted at a mid-ventricular short axis slice. Top – 10 non-tagged cine-MR images through systole were used as multiple templates/targets for Hyperelastic Warping analysis. Bottom – 6 tagged cine-MR images through systole were for HARP strain analysis.
2.2. Surface reconstruction and FE mesh generation
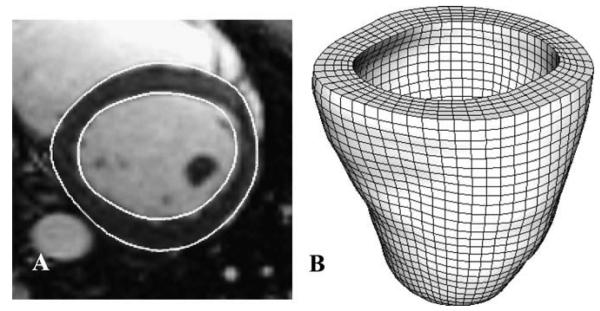
The epicardial and endocardial surfaces were manually segmented from the MR images at end-diastole. Cross-sectional contours of the left ventricle were extracted from the MRI dataset (SurfDriver, Kailua, HI) (Fig. 2A). Both triangulated myocardial surfaces were imported into a FE preprocessing software (TrueGrid, XYZ Scientific, Livermore, CA) and a hexahedral FE mesh was created by projecting to the surfaces (Fig. 2B) (Ellis et al., 2006; Gardiner and Weiss, 2003).
Fig. 2.
(A) Epicardial and endocardial contours at sample basal slice. (B) Hexahedral finite element mesh used for Hyperelastic Warping analysis.
2.3. Constitutive model
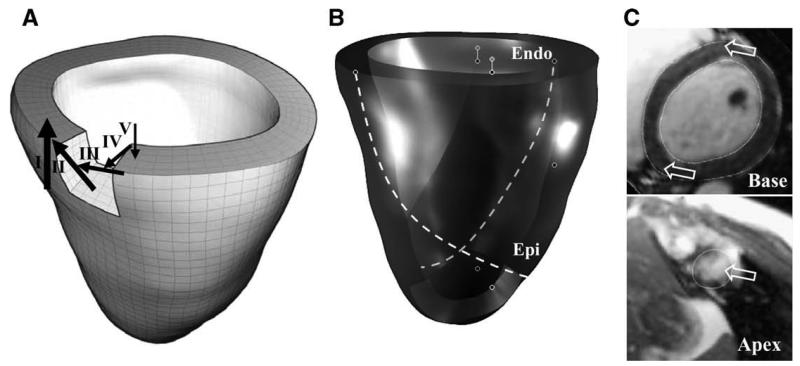
A transversely isotropic hyperelastic constitutive model was used to represent the myocardium. Realistic fiber directions were estimated with three fiber direction models, each adding a layer of complexity: (1) Fiber direction varying from −90° at the epicardial surface to +90° at the endocardial surface for the basal level (Veress et al., 2005a; Berne and Levy, 1998) (Fig. 3A). (2) Inner and outer layers were varied in a helical pattern, such that the inner layer varied from +90° to 0° from the basal level to the apical level and the outer layer varied from +90° to 0° from the basal level to the apical level (Ubbink et al., 2006)(Fig. 3B). (3) Fiber directions at the basal septum and apex were modified to align with estimations from diffusion tensor- (DT-) MRI data from canine and human cadaver hearts (Helm et al., 2005; Helm et al., 2005) (Fig. 3C).
Fig. 3.
Illustration of local fiber directions used for constitutive model. (A) Simplified representation with fiber direction varying from −90° at the epicardial surface to +90° at the endocardial surface for the basal level. (B) Helical fiber directions added for epicardial and endocardial layers. (C) Fiber directions at the basal septum (top panel) and apex (bottom panel) were modified to align with estimates from diffusion tensor- (DT-) MRI data from a human cadaver heart. Arrows in this panel show the orientation of the fiber directions at these locations.
The constitutive model represented fibers embedded in an isotropic matrix (Veress et al., 2006, 2005a):
| (1) |
Here, Ĩ1 is the first deviatoric invariant of the right Cauchy-Green deformation tensor C (Spencer, 1980), is the deviatoric fiber stretch along the local direction ao, μ is the shear modulus of the matrix, J is the Jacobian of the deformation, and K is the bulk modulus. The fiber stress-stretch behavior was represented as exponential, with no resistance to compressive load:
| (2) |
Here, C3 scales the stresses and C4 defines the fiber uncrimping rate. A detailed description of the constitutive model and its FE implementation can be found in our previous publications (Veress et al., 2005a; Weiss et al., 1996). Material coefficients were determined by a nonlinear least squares fit of the constitutive equation to published equibiaxial stress/strain curves (Veress et al., 2001) (μ = 2.50 KPa, C3 = 0.27 KPa, and C4 = 21.0) (Ellis et al., 2006). A bulk modulus K = 25 KPa was chosen to model slightly compressible material behavior as estimated by a 3D comparison of change in relative myocardial volume of 5.3% from end-diastole to end-systole.
2.4. Active fiber contraction
The implementation of active fiber contraction follows the approach used by Guccione and McCulloch (1993a) and further details can be found in our previous publication (Veress et al., 2006). The total Cauchy stress T is defined as the sum of the active stress tensor and the passive stress tensor
| (3) |
where a is the deformed fiber vector (unit length), defined by λa = F · a0, and F is the deformation gradient tensor. The time-varying elastance model is a modification of the standard Hill equation that scales the standard equation by the variable Ct which governs the shape of the activation curve. The active fiber stress T(a) is defined as
| (4) |
where Tmax = 135.7 KPa is the isometric tension under maximal activation at the peak intracellular calcium concentration of Ca0 = 4.35 μM. The length dependent calcium sensitivity is governed by the following equation:
| (5) |
where (Ca0)max = 4.35 μM is the maximum peak intracellular calcium concentration, B = 4.75 μm−1 governs the shape of the peak isometric tension-sarcomere length, l0 = 1.58 μm is the sarcomere length at which no active tension develops, and l is the sarcomere length, which is the product of the fiber stretch (deformed length/reference length) and the sarcomere unloaded length. A detailed description of the active contraction model, including the selection of the material parameters for active contraction, can be found in (Guccione and McCulloch, 1993a,b). In the FE implementation (Veress et al., 2006), the active contraction is governed by active contraction stress as described in Eq. (4), which was used to define the degree of contraction and subsequent relaxation as a function of time during systole.
2.5. Hyperelastic Warping
The Hyperelastic Warping algorithm has been integrated into the nonlinear FE code NIKE3D (Maker et al., 1990). The formulation for the warping solution is detailed in our previous publications (Veress et al., 2005a,b). The algorithm combines an initial computational FE solution based on a hyperelastic constitutive model and active fiber contraction, along with a final image-based solution based on a decisive image registration at each intermediate step with the image-based energy enforcing a hard constraint using an augmented Lagrangian technique while the mechanics proving a soft constraint. A series of 10 multiple templates/targets was used for warping analysis of the left ventricle from end-diastole to end-systole. At each stage of registration, an active contraction was initially applied to the FE model, and then image-based warping penalty forces were utilized to generate the decisive registration. The FE mesh was unconstrained in all six degrees-of-freedom during deformation. Prior to a mesh convergence study, an initial FE model consisted of 12,620 elements. Hyperelastic Warping analysis of the left ventricle was performed on an SGI Altix using four processors (Intel Itanium II 1.4 GHz).
2.6. Validation of strains with MRI tagging
Validation of the Hyperelastic Warping model was performed by comparing circumferential and radial strain predictions developed through systole at basal, mid-cavity, and apical slices with those measured from tagged MR images at mid-systole and endsystole. Tagged images were analyzed using a HARP (Harmonic Phase) algorithm implemented in Matlab, which parallels the technique introduced by Osman and Prince (2000). A complex harmonic image is obtained by band-pass filtering one of the higher-order harmonic peaks of the Fourier transform of the tagged image and computing its inverse Fourier transform, which contains a magnitude component and a phase component. The gradient of the phase angle in the HARP image is tracked, and the local deformation of the tags (in the horizontal and vertical directions) is used to compute the regional circumferential and radial strain in the LV myocardium.
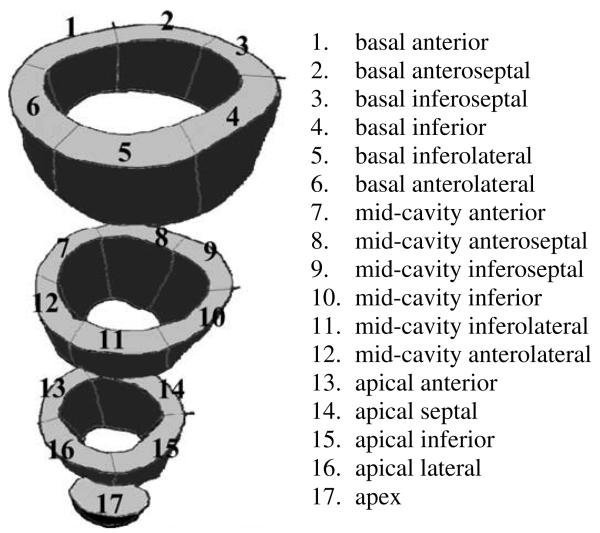
All values for fiber stretch, circumferential strain and radial strain are reported relative to the reference configuration of enddiastole. The Hyperelastic Warping analysis and HARP validation were performed from end-diastole to end-systole. The tagged images had five intermediate phases represented through the systolic phase of LV contraction, while non-tagged images used for Hyperelastic Warping had ten intermediate phases through systole. Circumferential and radial strains from Hyperelastic Warping were compared directly with tagged MR strains measured with HARP analysis and correlations calculated at twelve strain regions (Cerqueira et al., 2002) (Fig. 4) each for mid-systole and end-systole. Left ventricular twist was estimated by measuring the rotation of apical region 17 with respect to basal regions 1–6 at midsystole and end-systole.
Fig. 4.
Location of 17 left ventricular strain regions defined by anatomical landmarks, according to AHA recommendations. The centroids of these 17 landmark regions were also used to determine the accuracy of image registration with a Landmark Similarity Measure. Regions 1–12 were used to correlate Hyperelastic Warping strains and HARP tagging strains; due to the low image resolution of apical tagged slices, regions 13–17 were excluded. Rotation of region 17 with respect to regions 1–6 was used to measure ventricular twist.
2.7. Sensitivity studies
To investigate the sensitivity of the Hyperelastic Warping predictions to changes in the computational and material models, the effect of varying the following parameters was quantified: (1) compressibility (ratio of bulk modulus: shear modulus) by ± factor of 10; (2) fiber distribution (simplified +90° to −90° fiber distribution vs. helical fiber distribution vs. helical model with additional DT-MRI fiber direction estimates at apical and septal locations); (3) computational model (warping only vs. Active Contraction only vs. warping + Active Contraction).
The results of the sensitivity studies were quantified with a Landmark Similarity Measure (LSM). The final registration between the target image and the deformed FE template was assessed by comparing the 3D physical location of 17 landmarks defined at basal, mid-cavity and apical slices and corresponding to the 17 strain regions (Fig. 4). Radial and circumferential deformation was measured with a distance r and angle φ on each slice, and motion in the axial direction z was estimated by examination of adjacent slices. The percentage correspondence of the FE template deformations at these landmark locations was calculated in comparison to perfect image registration of LSM = 1. LSM was calculated for a sensitivity models with changes in shear modulus, fiber direction models, and computational models.
3. Results
A mesh convergence study determined that a LV mesh density of 10,304 elements was required for accurate analysis using Hyperelastic Warping. Further mesh refinement resulted in strain predictions that changed by less than 1%. The resulting LV mesh had 12,360 nodes and 10,304 elements, with elements that ranged from 2–4 mm in size. Hyperelastic warping analysis required approximately 35 min of wall clock time on four processors.
3.1. Validation of strains with MRI tagging
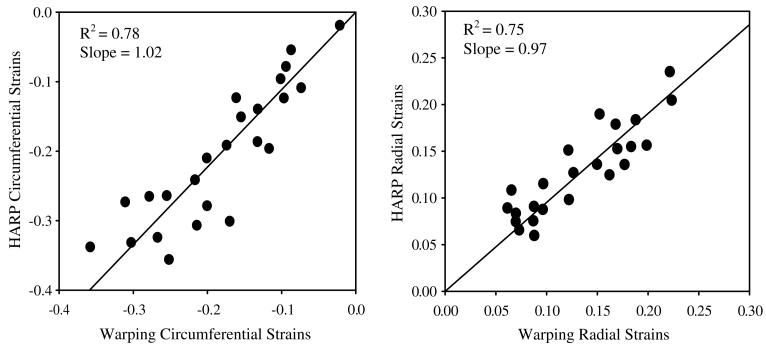
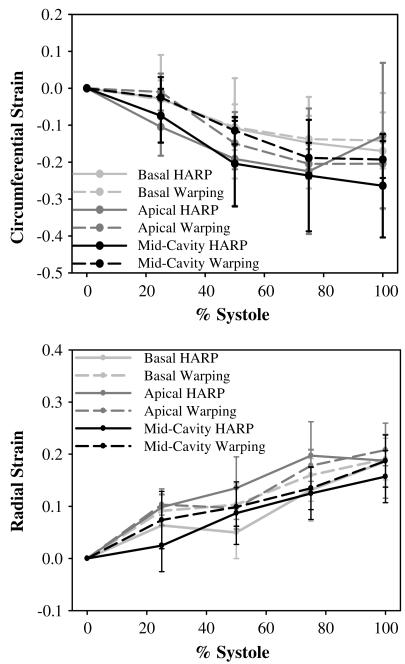
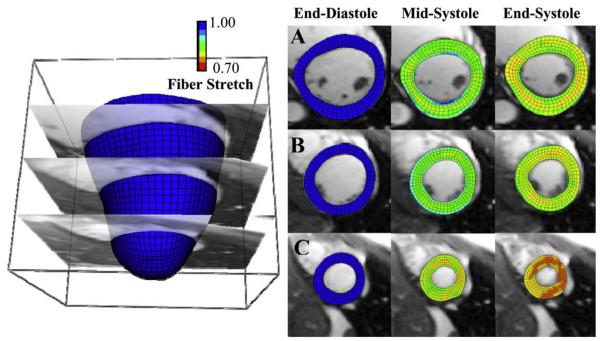
The coefficient of determination for overall correlation between Hyperelastic Warping strains versus HARP tagging strains was R2 = 0.78 for circumferential strains and. R2 = 0.75 for radial strains (Fig. 5) for mid-cavity and basal strain regions. Apical strain regions were excluded for the correlations due to the low resolution acquisition of tagged cine-MR images in these regions. Results were plotted with circumferential strain developed from end-diastole to end-systole (Fig. 6). Fiber stretch is illustrated with the reference configuration at end-diastole (Fig. 7A) defined with a fiber stretch of 1.0, and stretches at mid-systole (Fig. 7B) and end-systole (Fig. 7C) shown for apical, mid-ventricular and basal slices.
Fig. 5.
Correlation plot for strains predicted by warping versus strains measured from HARP. Left – circumferential strains. Right – radial strains. Results are comparisons of the average circumferential strain value at mid-cavity and basal slices from end-diastole through end-systole.
Fig. 6.
Strains predicted by warping (dashed lines) versus strains measured from HARP (solid lines) as a function of location and time during systole. Results are separated for apical slice (light gray), basal slice (dark gray), and mid-cavity slice (black). Error bars represent one standard deviation. Top – circumferential strains. Bottom – radial strains.
Fig. 7.
LV fiber stretch developed through systole (left column – end-diastole, fiber stretch = 1.0, middle – mid-systole, right – end-systole) with the Hyperelastic Warping solution depicted at (A) basal (B) mid-cavity and (C) apical slices.
3.2. Sensitivity studies
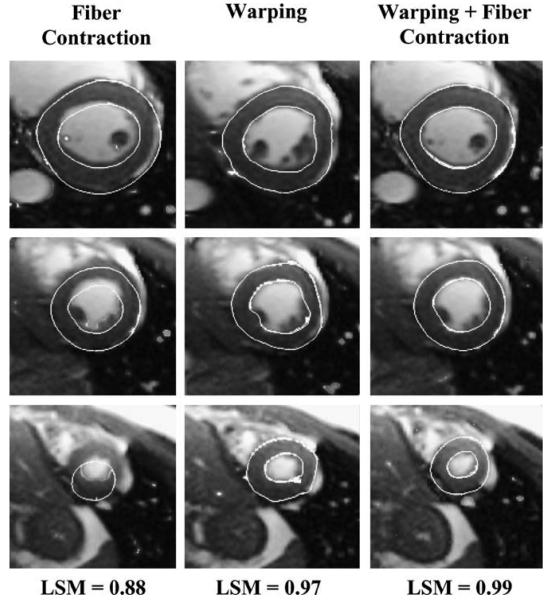
Landmark Similarity Measure (LSM) = 1 indicated a perfect match between the target image and the deformed template. Seventeen landmarks were identified to correspond with the centroids of the previously-defined strain regions (Fig. 3). The best model had LSM = 0.99, and included Hyperelastic Warping with active fiber contraction, a compressible material model, and an optimized fiber direction model using a helical distribution pattern augmented with DR-MRI estimates at the basal septum and apex (Fig. 8, right). Leaving all other parameters constant and increasing ratio of bulk modulus: shear modulus by a factor of 10 yielded LSM = 0.94 and decreasing ratio of bulk modulus: shear modulus yielded LSM = 0.96. The effect of fiber direction on image registration was estimated by evaluating three fiber direction models. The simplified model with fiber direction varying from −90° to +90° had LSM = 0.93, while adding helical fiber distribution had LSM = 0.97. Switching to an incompressible material model had LSM = 0.96. The effect of the computational solution and the image-based solution was also assessed. Using only the computational solution of an FE model with active fiber contraction yielded LSM = 0.88 (Fig. 8, left). Using only the image-based forces resulted in LSM = 0.97 (Fig. 8, middle). The best model utilized the image-based solution as a hard constraint and added the computational solution as a guide in regions of sparse image data.
Fig. 8.
Graphical depiction of image registration and corresponding values for the landmark similarity measure (LSM). Left – registration obtained using only systolic fiber contraction forces (no warping); note the poor registration in all three crosssections, LSM = 0.88. Middle – registration obtained using only warping solution, LSM = 0.97. Right – best fit, systolic fiber contraction forces with warping, LSM = 0.99.
3.3. Transmural strain distribution
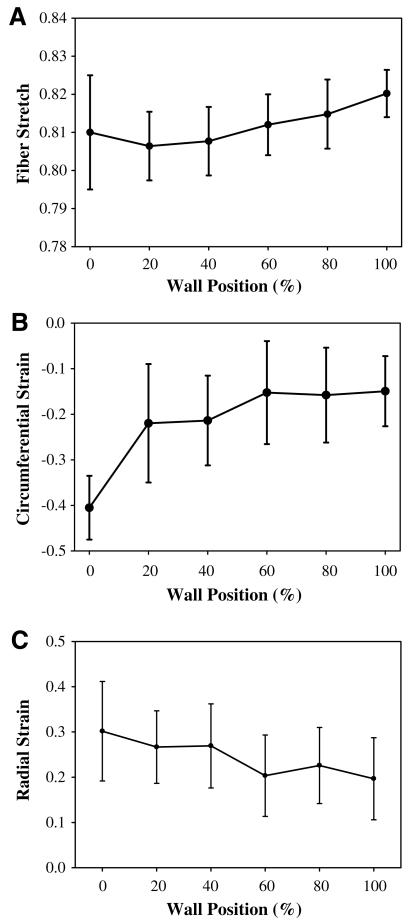
Fiber stretch, circumferential strain, and radial strain exhibited a transmural pattern when sorted by wall position from endocardium to epicardium for a sample apical slice (Fig. 9). Peak systolic fiber stretch averaged at all ventricular locations was 0.82 and showed a slight increase in stretch from the epicardial surface to the endocardial surface (Fig. 9A). Circumferential strains showed greater transmural variation and ranged from –0.15 at the epicardial surface to –0.40 at the endocardial surface (Fig. 9B). Radial strain was 0.20 at the epicardial surface and 0.30 at the endocardial surface (Fig. 9C). Left ventricular twist was 3° ±3° at mid-systole and reached a peak value of 9° ±4° at end-systole.
Fig. 9.
Predictions of transmural strains from Hyperelastic Warping analysis between end-diastole to end-systole for an apical slice location. (A) Fiber stretch, (B) circumferential strain, and (C) radial strain are plotted as a position of wall thickness, with 0% as the endocardial wall 100% as the epicardial wall.
4. Discussion
This study combined deformable image registration (Veress et al., 2005a,b) of non-tagged cine-MR images with a computational model incorporating estimates of LV myofiber direction (Ubbink et al., 2006; Helm et al., 2005) and active fiber contraction (Guccione and McCulloch, 1993a,b; Veress et al., 2006). Strain measurements from Hyperelastic Warping were validated with strains calculated from tagged images. The results demonstrate that combining Hyperelastic Warping with a priori information regarding systolic fiber contraction forces and fiber angle distribution results in good predictions of circumferential and radial strains during systole. The best predictions of strains were obtained when using a slightly compressible material model, a helical fiber distribution refined with DT-MRI data, and ten intermediate templates/target during deformable image registration combined with an active fiber contraction. Comparable approaches for measurement of myocardial strain include speckle tracking for echocardiograph images (Amundsen et al., 2006), applying nonrigid registration to tagged MRI (Petitjean et al., 2004; Rougon et al., 2005), or performing computational analysis on non-clinical data (Veress et al., 2006; Ubbink et al., 2006). Image-based myocardial strain measurement, including tagged MRI and echocardiography, are limited by low image resolution in their ability to isolate dysfunctional regions of the myocardium. In contrast, detailed computational cardiac models may isolate dysfunctional strain regions at high resolution, however the correspondence of these strains with clinical data is unknown. The present study has the advantage of combining image data with a priori knowledge of the mechanics of myocardium. Along with validation against MRI based strain measurements with HARP. A major strength of Hyperelastic Warping is that it provides a diffeomorphic deformation (one-to-one, onto, and differentiable with a differentiable inverse) and is objective for large strains and rotations.
The relative insensitivity of the strain predictions from Hyperelastic Warping to changes in material coefficients is consistent with the results of our previous studies of myocardial strain (Veress et al., 2005a), ligament strain (Phatak et al., 2007), coronary artery strain (Veress et al., 2002) and PET imaging (Veress et al., 2008). While the warping solution is ultimately driven by the image data as a “hard constraint” as enforced with the augmented Lagrangian method, active fiber contraction combined with the constitutive model act as a “soft constraint”, which guides the solution with realistic estimates for deformation in regions of sparse image data. Also, the hyperelastic material model ensures that the deformation field φ(X) is diffeomorphic and physically representative of the material of interest. In regions of the template model that have large intensity gradients, large image-based forces will be generated and the solution will be primarily determined by the image data. In regions that lack image texture or gradients, image-based forces will be smaller and the predicted deformation will be more dependent on the hyperelastic regularization (material model). A realistic representation of the material behavior helps to improve predictions in these areas.
Three fiber direction models were tested for sensitivity: a simplified model with fiber direction varying from −90° to +90°, a model with helical fiber distribution, and a model that added DTMRI estimates at basal-septal and apical locations. The results demonstrated that improved strain predictions can be obtained by using fiber angle distributions that are more physiologically accurate, although the improvements were modest. In the future, more accurate average or subject-specific fiber angles could be incorporated. Combining tagged deformation data with a separate finite element model incorporating fiber structure has been demonstrated by Tseng et al. (2000). While diffusion tensor MRI (DTMRI) has the potential to provide patient-specific fiber distribution information, difficulties with long acquisition times and motion artifacts make in vivo acquisition extremely difficult (Tseng et al., 2003, 1997). In cases where the fiber distribution cannot be estimated, for example, where extensive remodeling due to pathologies such as cardiomyopathy and myocardial infarction have taken place, fiber stretch estimates based on population averages would likely not provide an accurate representation of the true fiber angle distribution. Nevertheless, the sensitivity studies suggest that reasonable predictions of systolic strains are possible in the absence of subject-specific data on the spatial distribution of fiber angles.
Circumferential strains increased in magnitude with increased systolic contraction, and both Hyperelastic Warping and HARP strains exhibited similar trends through systole. Radial strains also increased in magnitude with increased contraction, to approximately 20% at end-systole. Again, warping and HARP strains showed similar trends. Predictions of left ventricular strain from Hyperelastic Warping were in excellent agreement with data from the literature. Mid-cavity LV fiber stretch during systole (0.88 ± 0.03, Fig. 7C) corresponded well with the values of mean systolic fiber stretch reported by Tseng et al. (0.88 ± 0.01) (Tseng et al., 2000). Transmural circumferential strains during systole (epicardial, −41.0 ± 7.0%; midwall, −23.0 ± 11.0%; endocardial, −15.0 ± 8.0%, Fig. 9B) were similar to those reported by Clark et al., who reported a transmural gradient of circumferential shortening (epicardial, −44 ± 6%; midwall, −30 ± 6%, endocardial, −22 ± 5%) (Clark et al., 1991). Estimates of peak LV twist (9 ± 4°) at end-systole (Fig. 7C) were similar to values reported by Takeuchi et al. (7.7 ± 3.5 °) (Takeuchi et al., 2006).
With Hyperelastic Warping we were able to predict high resolution strains throughout the myocardium. This has direct implications for future clinical study, since local myocardial strains are directly indicative of regional function. The most widely used technique for measurement of ventricular strains is MR tagging combined with cine-MRI acquisition. MR tagging (Axel et al., 2005; McVeigh and Zerhouni, 1991; Zerhouni et al., 1988; Moore et al., 1992) applies a local perturbation of the magnetization of the myocardium with selective radio-frequency saturation to produce multiple, thin tag planes. The resulting magnetization lines are used as fiducials to track the deformation of the myocardium. Since the technique requires the application of tags prior to imaging, the resolution is necessarily limited by tag spacing and fading of tags (Axel et al., 2005; Moore et al., 1992). In contrast, the resolution of strain predictions from Hyperelastic Warping is limited by thickness of the pixel, the resolution of the finite element mesh and the image content itself (Veress et al., 2005a,b; Phatak et al., 2007). Relative to MRI tagging analysis, a disadvantage of the Hyperelastic Warping technique is that it is more computationally expensive.
Several limitations of the present study are worth noting. 3D warping strains were postprocessed to allow comparison to strains measured with HARP since the HARP analysis was 2D. Further, due to the relatively low resolution of the HARP strain measurements, transmural warping strain predictions were not validated with HARP data. The HARP data for strain are obtained as a relatively sparse sampling in comparison to the warping predictions, so averages over pre-defined regions were compared. HARP analysis can be adversely affected by tag fading, although the technique is less sensitive to fading than but this did not appear to be an issue in this project. In addition, a transversely isotropic constitutive model was used to represent the myocardium. An orthotropic description may describe the laminar arrangement of myofibers more precisely since it can better represent the laminar (sheet) organization of ventricular myofibers and thus accommodate differences in transverse stiffness (Usyk et al., 2000). The warping analyses were conducted using a fiber contractile force that was uniform transmurally, but it has been reported that transmural gradients in cellular electrical and mechanical function exist in canine myocardium (Cordeiro et al., 2004). Thus it is possible that including this type of heterogeneity in the modeling approach could improve the predictions from warping. Currently, the analysis procedure for Hyperelastic Warping requires an expert user. Future implementations of the technique will require automation of key steps of the procedure. In addition, mapping of detailed cardiac myofiber orientation may be aided by diffusion tensor MRI, although the application of diffusion tensor MRI to live subjects remains an active area of research without a current solution. Finally, due to unfolding of the trabeculated endocardial surface during filling and refolding during ejection, there is some inherent error in identifying the endocardial surface tissue at end-diastole and end-systole. This may have caused less accurate strain estimates for the endocardial wall. Using estimates for boundary conditions of lumen pressure, fiber stress activation, and residual strain, it may be possible to predict myocardial stress as well as strain. Advances in desktop processor speeds combined with high resolution cardiac imaging will also make it feasible to measure cardiac stresses/strains with much greater accuracy, precision and speed.
In summary, Hyperelastic Warping represents a novel technique for strain measurement during systole using deformable image registration, providing a physiologically-relevant regularization term. Future applications of this method may be used to isolate regions of myocardial dysfunction, although this will require additional model input parameters to characterize dysfunctional or scarred tissue. An important feature of this method is the material constitutive model and active fiber contraction, which augments regions of sparse image data with a computational solution. In the quantitative analysis of MRI data for strain prediction, noise and resolution are often limiting factors, and Hyperelastic Warping presents an approach to circumvent these problems.
Acknowledgements
Financial support from NIH #R01-EB000121 and NSF #BES-0134503 is gratefully acknowledged.
Footnotes
Invited Manuscript from conference “Fourth International Conference on Functional Imaging and Modeling of the Heart”, Salt Lake City, June 7–9th, 2007.
References
- Amundsen BH, Helle-Valle T, Edvardsen T, Torp H, Crosby J, Lyseggen E, Stoylen A, Ihlen H, Lima JA, Smiseth OA, Slordahl SA. Noninvasive myocardial strain measurement by speckle tracking echocardiography: validation against sonomicrometry and tagged magnetic resonance imaging. J. Am. Coll. Cardiol. 2006;47(4):789–793. doi: 10.1016/j.jacc.2005.10.040. [DOI] [PubMed] [Google Scholar]
- Axel L, Montillo A, Kim D. Tagged magnetic resonance imaging of the heart: a survey. Med. Image. Anal. 2005;9(4):376–393. doi: 10.1016/j.media.2005.01.003. [DOI] [PubMed] [Google Scholar]
- Ballo P, Mondillo S, Motto A, Faraguti SA. Left ventricular midwall mechanics in subjects with aortic stenosis and normal systolic chamber function. J. Heart Valve Dis. 2006;15(5):639–650. [PubMed] [Google Scholar]
- Becker M, Bilke E, Kuhl H, Katoh M, Kramann R, Franke A, Bucker A, Hanrath P, Hoffmann R. Analysis of myocardial deformation based on pixel tracking in two dimensional echocardiographic images enables quantitative assessment of regional left ventricular function. Heart. 2006;92(8):1102–1108. doi: 10.1136/hrt.2005.077107. [DOI] [PMC free article] [PubMed] [Google Scholar]
- Berne RM, Levy MN. Physiology. Mosby Year Book; St. Louis, MO: 1998. [Google Scholar]
- Cerqueira MD, Weissman NJ, Dilsizian V, Jacobs AK, Kaul S, Laskey WK, Pennell DJ, Rumberger JA, Ryan T, Verani MS. Standardized myocardial segmentation and nomenclature for tomographic imaging of the heart: a statement for healthcare professionals from the Cardiac Imaging Committee of the Council on Clinical Cardiology of the American Heart Association. Circulation. 2002;105(4):539–542. doi: 10.1161/hc0402.102975. [DOI] [PubMed] [Google Scholar]
- Clark NR, Reichek N, Bergey P, Hoffman EA, Brownson D, Palmon L, Axel L. Circumferential myocardial shortening in the normal human left ventricle. Assessment by magnetic resonance imaging using spatial modulation of magnetization. Circulation. 1991;84(1):67–74. doi: 10.1161/01.cir.84.1.67. [DOI] [PubMed] [Google Scholar]
- Cordeiro JM, Greene L, Heilmann C, Antzelevitch D, Antzelevitch C. Transmural heterogeneity of calcium activity and mechanical function in the canine left ventricle. Am. J. Physiol. 2004;286(4):H1471–H1479. doi: 10.1152/ajpheart.00748.2003. [DOI] [PubMed] [Google Scholar]
- Ellis BJ, Lujan TJ, Dalton MS, Weiss JA. Medial collatera lligament insertion site and contact forces in the ACL-deficient knee. J. Orthop. Res. 2006;24(4):800–810. doi: 10.1002/jor.20102. [DOI] [PubMed] [Google Scholar]
- Gardiner JC, Weiss JA. Subject-specific finite element analysis of the human medial collateral ligament during valgus knee loading. J. Orthop. Res. 2003;21(6):1098–1106. doi: 10.1016/S0736-0266(03)00113-X. [DOI] [PubMed] [Google Scholar]
- Guccione JM, McCulloch AD. Mechanics of active contraction in cardiac muscle: Part I – Constitutive relations for fiber stress that describe deactivation. J. Biomech. Eng. 1993a;115(1):72–81. doi: 10.1115/1.2895473. [DOI] [PubMed] [Google Scholar]
- Guccione JM, McCulloch AD. Mechanics of active contraction in cardiac muscle: Part II – Cylindrical models of the systolic left ventricle. J. Biomech. Eng. 1993b;115:82–90. doi: 10.1115/1.2895474. [DOI] [PubMed] [Google Scholar]
- Helm P, Beg MF, Miller MI, Winslow RL. Measuring and mapping cardiac fiber and laminar architecture using diffusion tensor MR imaging. Ann. NY Acad. Sci. 2005;1047:296–307. doi: 10.1196/annals.1341.026. [DOI] [PubMed] [Google Scholar]
- Helm PA, Tseng HJ, Younes L, McVeigh ER, Winslow RL. Ex vivo 3D diffusion tensor imaging and quantification of cardiac laminar structure. Magn. Reson. Med. 2005;54(4):850–859. doi: 10.1002/mrm.20622. [DOI] [PMC free article] [PubMed] [Google Scholar]
- Maker BN, Ferencz RM, Hallquist JO. NIKE3D: A Nonlinear, Implicit, Three-dimensional Finite Element Code for Solid and Structural Mechanics. Lawrence Livermore National Laboratory; 1990. (Technical Report, UCRL-MA #105268). [Google Scholar]
- McVeigh ER, Zerhouni EA. Noninvasive measurement of transmural gradients in myocardial strain with MR imaging. Radiology. 1991;180(3):677–683. doi: 10.1148/radiology.180.3.1871278. [DOI] [PMC free article] [PubMed] [Google Scholar]
- Moore CC, O'Dell WG, McVeigh ER, Zerhouni EA. Calculation of three-dimensional left ventricular strains from biplanar tagged MR images. J. Magn. Reson. Imaging. 1992;2(2):165–175. doi: 10.1002/jmri.1880020209. [DOI] [PMC free article] [PubMed] [Google Scholar]
- Osman NF, Prince JL. Visualizing myocardial function using HARP MRI. Phys. Med. Biol. 2000;45(6):1665–1682. doi: 10.1088/0031-9155/45/6/318. [DOI] [PubMed] [Google Scholar]
- Pai VM, Axel L. Advances in MRI tagging techniques for determining regional myocardial strain. Curr. Cardiol. Rep. 2006;8(1):53–58. doi: 10.1007/s11886-006-0011-4. [DOI] [PubMed] [Google Scholar]
- Petitjean C, Rougon N, Cluzel P, Preteux F, Grenier P. Quantification of myocardial function using tagged MR and cine MR images. Int. J. Cardiovasc. Imaging. 2004;20(6):497–508. doi: 10.1007/s10554-004-1098-6. [DOI] [PubMed] [Google Scholar]
- Phatak NS, Sun Q, Kim SE, Parker DL, Sanders RK, Veress AI, Ellis BJ, Weiss JA. Noninvasive determination of ligament strain with deformable image registration. Ann. Biomed. Eng. 2007;35(7):1175–1187. doi: 10.1007/s10439-007-9287-9. [DOI] [PubMed] [Google Scholar]
- Plein S, Smith WH, Ridgway JP, Kassner A, Beacock DJ, Bloomer TN, Sivananthan MU. Qualitative and quantitative analysis of regional left ventricular wall dynamics using real-time magnetic resonance imaging: comparison with conventional breath-hold gradient echo acquisition in volunteers and patients. J. Mag. Reson. Imaging. 2001;14(1):23–30. doi: 10.1002/jmri.1146. [DOI] [PubMed] [Google Scholar]
- Rabbitt RD, Weiss JA, Christensen GE, Miller MI. Mapping of hyperelastic deformable templates using the finite element method. SPIE. 1995;2573:252–265. [Google Scholar]
- Rougon N, Petitjean C, Preteux F, Cluzel P, Grenier P. A non-rigid registration approach for quantifying myocardial contraction in tagged MRI using generalized information measures. Med. Image Anal. 2005;9(4):353–375. doi: 10.1016/j.media.2005.01.005. [DOI] [PubMed] [Google Scholar]
- Spencer A. Continuum Mechanics. Longman; New York: 1980. [Google Scholar]
- Takeuchi M, Nakai H, Kokumai M, Nishikage T, Otani S, Lang RM. Age-related changes in left ventricular twist assessed by two-dimensional speckle-tracking imaging. J. Am. Soc. Echocardiogr. 2006;19(9):1077–1084. doi: 10.1016/j.echo.2006.04.011. [DOI] [PubMed] [Google Scholar]
- Tseng WYI, Reese TG, Weisskoff RM, Brady TJ, Dinsmore RE, Wedeen VJ. Mapping myocardial fiber and sheet function in humans by magnetic resonance imaging (MRI) Circulation. 1997;96(8):1096. [Google Scholar]
- Tseng WY, Reese TG, Weisskoff RM, Brady TJ, Wedeen VJ. Myocardial fiber shortening in humans: initial results of MR imaging. Radiology. 2000;216(1):128–139. doi: 10.1148/radiology.216.1.r00jn39128. [DOI] [PubMed] [Google Scholar]
- Tseng WY, Wedeen VJ, Reese TG, Smith RN, Halpern EF. Diffusion tensor MRI of myocardial fibers and sheets: correspondence with visible cut-face texture. J. Mag. Reson. Imaging. 2003;17(1):31–42. doi: 10.1002/jmri.10223. [DOI] [PubMed] [Google Scholar]
- Ubbink SW, Bovendeerd PH, Delhaas T, Arts T, van de Vosse FN. Towards model-based analysis of cardiac MR tagging data: relation between left ventricular shear strain and myofiber orientation. Med. Image Anal. 2006;10(4):632–641. doi: 10.1016/j.media.2006.04.001. [DOI] [PubMed] [Google Scholar]
- Usyk TP, Mazhari R, McCulloch AD. Effect of laminar orthotropic myofiber architecture on regional stress and strain in the canine left ventricle. J. Elast. 2000;61:143–164. [Google Scholar]
- Veress AI, Weiss JA, Rabbitt RD, Lee JN, Gullberg GT. Comput. Cardiol. IEEE, Rotterdam; The Netherlands: 2001. Measurement of 3D left ventricular strains during diastole using image warping and untagged MRI images. [Google Scholar]
- Veress AI, Weiss JA, Klein GJ, Gullberg GT. Quantification of 3D left ventricular deformation using Hyperelastic Warping: comparisons between MRI and PET imaging. Proc. Comput. Cardiol. 2002:709–712. [Google Scholar]
- Veress AI, Weiss JA, Gullberg GT, Vince DG, Rabbitt RD. Strain measurement in coronary arteries using intravascular ultrasound and deformable images. J. Biomech. Eng. 2002;124(6):734–741. doi: 10.1115/1.1519279. [DOI] [PubMed] [Google Scholar]
- Veress AI, Gullberg GT, Weiss JA. Measurement of strain in the left ventricle during diastole with cine-MRI and deformable image registration. J. Biomech. Eng. 2005a;127(7):1195–1207. doi: 10.1115/1.2073677. [DOI] [PubMed] [Google Scholar]
- Veress AI, Phatak N, Weiss JA. Deformable image registration with Hyperelastic Warping handbook of biomedical image analysis. In: Suri JS, Wilson D, Laxminarayan S, editors. Registration Models (Part A) Vol. 3. Marcel Dekker Inc.; New York: 2005b. [Google Scholar]
- Veress AI, Segars WP, Weiss JA, Tsui BM, Gullberg GT. Normal and pathological NCAT image and phantom data based on physiologically realistic left ventricle finite-element models. IEEE Trans. Med. Imaging. 2006;25(12):1604–1616. doi: 10.1109/tmi.2006.884213. [DOI] [PubMed] [Google Scholar]
- Veress AI, Weiss JA, Huesman RH, Reutter BW, Taylor SE, Sitek S, Feng B, Yang Y, Gullberg GT. Measuring regional changes in the diastolic deformation of the left ventricle of SHR rats using microPET technology and hyperelastic warping. Ann. Biomed. Eng. 2008;36(7):1104–1117. doi: 10.1007/s10439-008-9497-9. [DOI] [PMC free article] [PubMed] [Google Scholar]
- Weidemann F, Kowalski M, D'Hooge J, Bijnens B, Sutherland GR. Doppler myocardial imaging. A new tool to assess regional inhomogeneity in cardiac function. Basic Res. Cardiol. 2001;96(6):595–605. doi: 10.1007/s003950170011. [DOI] [PubMed] [Google Scholar]
- Weiss J, Maker B, Govindjee S. Finite element implementation of incompressible transversely isotropic hyperelasticity. Comput. Meth. Applicat. Mech. Eng. 1996;135:107–128. [Google Scholar]
- Weiss JA, Rabbitt RD, Bowden AE. Incorporation of medical image data in finite element models to track strain in soft tissues. SPIE. 1998;3254:477–484. [Google Scholar]
- Zerhouni EA, Parish DM, Rogers WJ, Yang A, Shapiro EP. Human heart: tagging with MR imaging – a method for noninvasive assessment of myocardial motion. Radiology. 1988;169(1):59–63. doi: 10.1148/radiology.169.1.3420283. [DOI] [PubMed] [Google Scholar]


