

Abstract
Clinically relevant biomarkers exist in blood and body fluids in extremely low concentrations, are masked by high abundance high molecular weight proteins, and often undergo degradation during collection and transport due to endogenous and exogenous proteinases. Nanoparticles composed of a N-isopropylacrylamide hydrogel core shell functionalized with internal affinity baits are a new technology that can address all of these critical analytical challenges for disease biomarker discovery and measurement. Core-shell, bait containing, nanoparticles can perform four functions in one step, in solution, in complex biologic fluids (e.g. blood or urine): a) molecular size sieving, b) complete exclusion of high abundance unwanted proteins, c) target analyte affinity sequestration, and d) complete protection of captured analytes from degradation. Targeted classes of protein analytes sequestered by the particles can be concentrated in small volumes to effectively amplify (up to 100 fold or greater depending on the starting sample volume) the sensitivity of mass spectrometry, western blotting, and immunoassays. The materials utilized for the manufacture of the particles are economical, stable overtime, and remain fully soluble in body fluids to achieve virtually 100 percent capture of all solution phase target proteins within a few minutes.
Keywords: biomarkers, stability, serum, urine, hydrogel, nanoparticles, stabilization, immunoassay
INTRODUCTION
There is an urgent need to discover novel biomarkers that provide sensitive and specific detection of early stage disease when it is highly treatable. The low abundance and low molecular weight proteins and metabolites present in the blood provide a wealth of potential information and have great promise as a source of new biomarkers [1–3]. Unfortunately they comprise less than 1 percent of the blood molecules, and in many cases exist in attomolar concentrations. The remainder of the proteins and peptides comprising the complex circulatory proteome range from 10−12 mg/mL to 10−3 mg/mL, spanning ten orders of magnitude, with a few high molecular weight proteins such as albumin and immunoglobulins accounting for 90% of total protein content [4]. Conventional protein detection methods, such as two dimensional gel electrophoresis (2-DGE), do not have the sensitivity and resolution to detect and quantify low abundance, low molecular weight proteins and metabolites. In spite of the moderately high detection sensitivity of modern mass spectrometers (attomolar concentration), the input volume is only a few microliters, and the sensitivity and resolution is influenced by the complexity of the protein mixture. The usual sample preparation steps for mass spectrometry (MS) experiments begin with depletion of high abundant proteins using commercially available immunoaffinity depletion columns. After depletion, fractionation is performed by means of size exclusion chromatography, ion exchange chromatography, and/or isoelectric focusing. However, removal of abundant native high molecular weight proteins can significantly reduce the yield of candidate biomarkers because it has been recently shown that the vast majority of low abundance biomarkers are non-covalently and endogenously associated with the carrier proteins that are being removed [5–8]. Methods, such as size exclusion ultra filtration under denaturing conditions [9], continuous elution denaturing electrophoresis [10], or fractionation of serum by means of nanoporous substrates [11] have been proposed to solve this problem, but these methods are very time consuming, reduce the yield, and add sources of variability to the sample processing. In the past there has been no routine method for purifying and enriching low molecular mass peptides and metabolites from complex protein mixtures and biologic fluids in solution.
In addition to the difficulties associated with the harvest and enrichment of candidate biomarkers from complex natural protein mixtures (such as blood), the stability of these potential biomarkers poses a challenge. Immediately following blood procurement (e.g., by venipuncture) proteins in the serum become susceptible to degradation by endogenous proteases or exogenous environmental proteases, such as proteases associated with the blood clotting process, enzymes shed from blood cells, or associated with bacterial contaminants [12–15]. Therefore, candidate diagnostic biomarkers in the blood may be subjected to degradation during transportation and storage. This becomes an even more important issue for the fidelity of biomarkers within large repositories of serum and body fluids that are collected from a variety of institutions and locations where samples may be shipped without freezing.
The fundamental and serious physiologic barriers thwarting biomarker discovery and measurement can be summarized as follows:
The extremely low abundance (concentration) of candidate markers in blood and urine, are below the detection limits of mass spectrometry and conventional immunoassays. In its early stage, the diseased tissue constitutes a small proportion of the patient’s tissue volume, thus generating a low amount of biomarkers.
Masking by resident proteins: Resident proteins such as albumin and immunoglobulins, accounting for greater than 90% of circulating plasma proteins, confound and mask the isolation of rare biomarkers. The majority of low abundance biomarkers are non-covalently and endogenously associated with the resident proteins such as albumin, which exist in a billion fold excess compared to the rare biomarker.
Biomarker lability: Low abundance biomarkers are rapidly degraded by endogenous and exogenous proteinases immediately after the blood or urine is drawn from the patient. Degradation of candidate biomarkers occurs also during transportation and storage of blood, leading to serious false positive and false negative results [14].
Core shell, affinity bait hydrogel nanoparticles have been recently proposed in order to address these fundamental roadblocks to biomarker purification and preservation [16, 17]. The nanoparticles contain a bait that targets classes of analytes (e.g., basic proteins, acidic proteins, post translational modified proteins). When mixed with a body fluid such as blood or urine, the nanoparticles simultaneously conduct molecular sieve chromatography and affinity chromatography, in one step, in solution [16, 17]. The nanoparticles sequester all target molecules away from albumin association and completely exclude albumin [16, 17]. The molecules captured and bound within the affinity matrix of the particles are protected from degradation by exogenous or endogenous proteases, even when the proteolytic enzyme penetrates the particle, most likely due to the fact that the protein molecules are immobilized on the affinity bait [16, 17]. Thus in one step, in solution, over a period of minutes, “smart” nano-particles conduct enrichment and encapsulation of selected classes of proteins and peptides from complex mixtures of biomolecules, purify them away from endogenous high abundance proteins such as albumin, and protect them from degradation during subsequent sample handling. Proteins sequestered by the nanoparticles are eluted in small volumes, thus increasing their concentration, permitting analysis by a variety of techniques, such as mass spectrometry, western blotting, and immunoassays [16, 17].
AFFINITY BAITS
A menu of bait chemistries has been created to selectively bind and concentrate a diverse range of biomarkers, such as a) proteins and peptides, b) metabolites, c) lipids and fatty acids, d) nucleic acids, and e) post translationally modified peptides (e.g. glycosylated and phosphorylated). Bait chemistries include charge-based bait (acrylic acid, allylamine co-monomer), triazine loaded dye (cibacron blue), beta-cyclodextrin, or boronic acid. Example bait chemistries are depicted in Fig. (1).
Fig. (1).
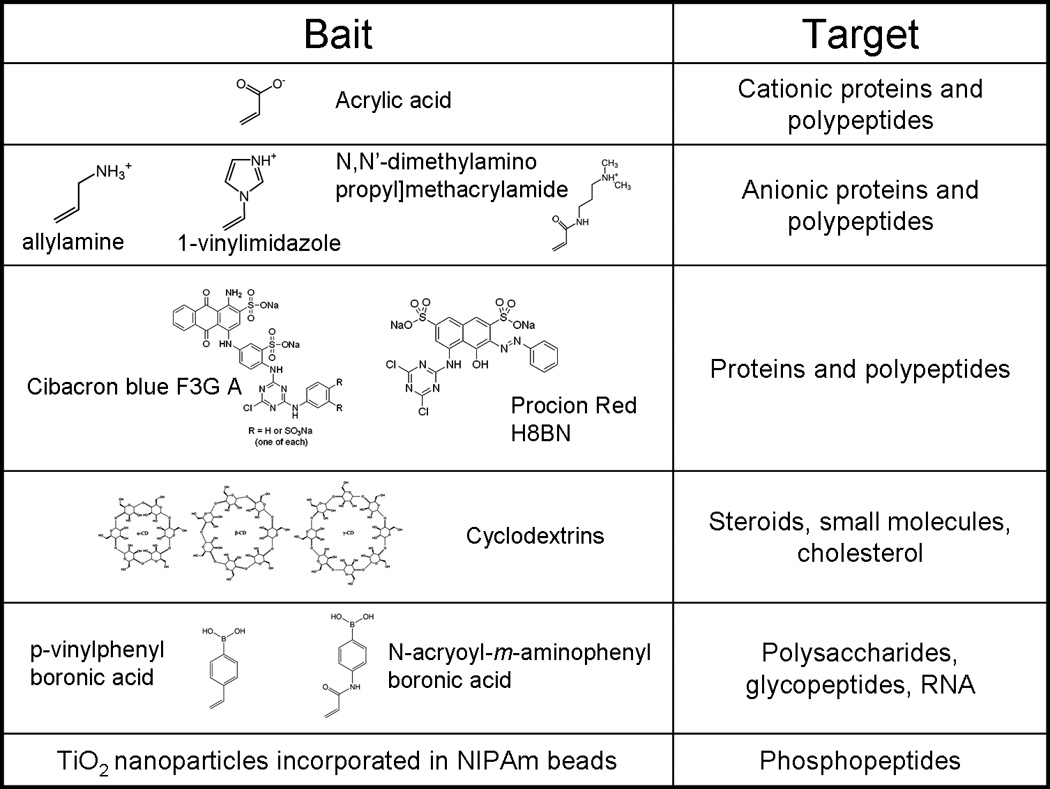
Summary of bait chemistry.
Acrylic acid acts as a bait for polypeptides and proteins that have net negative charge.
The affinity of polypeptides to charged particles has been proven to be higher than the affinity of polypeptide for carrier proteins and depends on the value of the isoelectric point of proteins and the dissociation constant of particles [16]. A further class of molecular baits is triazine derived textile dyes (Cibacron blue F3G-A, Procion red H8BN) [18]. The mechanism by which proteins bind to the blue dye is still unclear. Hypotheses include a) interaction between dinucleotide fold structural domains of proteins with the dye, which can assume a conformation that mimics the orientation and the anionic groups characteristic of NAD [19], b) clusters of apolar residues within the protein molecule interact with the aromatic rings of the dye molecule, or of positively charged group which binds the sulfonate residues [20], c) complex protein-dye interactions, probably ionic and hydrophobic [21] Dye loaded hydrogel particles are being successfully employed to uptake small proteins and hormones from serum and other body fluids, such as urine. Cyclodextrins are cyclic glucose oligosaccharides that have lipophilic inner cavities and hydrophilic outer surfaces, that are capable of interacting with hydrophobic guest molecules to form noncovalent complexes, and have been extensively used as vector for drug delivery [22]. Cyclodextrin has been shown to bind steroids [23–25], cholesterol [26], and DOPA [27]. Hydrogen bonds, Van der Waals interaction, and electrostatic interactions are thought to be the forces that attract and stabilize guest molecules that have suitable size and preferably hydrophobic character [28]. We have also designed particles that contain boronic acid groups, which are known to form complexes with thiol groups on target biomolecules. Boronate ion has been used for affinity chromatography applications involving the selective isolation of nucleotides, RNA, glycated proteins and glycoenzymes [29–34].
CORE SHELL ARCHITECTURE FOR MOLECULAR SIZE SIEVING
During fabrication of our new class of core-shell hydrogel particles we tailor the chemistry of the core bait to specifically capture clinically relevant and low abundant biomarkers. Core-shell hydrogel particles are composed of a N-isopropylacrylamide (NIPAm) shell, which can be modified to alter permeability or porosity, surrounding a N-isopropylacrylamide (NIPAm)-bait core to perform affinity binding to proteins in solutions. The porous structure of the shell excludes molecules above a sharp molecular weight cut-off size from entering the interior of the particle. The degree of porosity can be tuned by changing the percentage of cross-linker N,N’methylenebisacrylamide (BIS) with respect to the monomer. Over 99% of the particle volume is composed of water allowing polypeptides and other small molecules to penetrate the polymer matrix [35], and also permitting concentration of rare protein biomarkers. Thus, each class of particle will sequester and concentrate a class of all analytes below a molecular weight cut-off that selectively recognize the bait Fig. (2). An experimental demonstration of the molecular size sieving properties of the particles is shown in Fig. (3). All of the solution phase chemokine molecules, including those that were associated with albumin, were totally removed from solution, captured and concentrated by the particles, whereas albumin was completely excluded.
Fig. (2).

Schematic representation of particle structure and function. A. Particles are constituted by a bait containing core, surrounded by a sieving shell. Candidate biomarkers can be associated with high abundance carriers such as albumin. B. When introduced into a complex solution, such as serum, core-shell particles affinity capture all molecular species below the molecular weight cut off of the shell, strip the target biomarkers away from the excluded carrier protein by affinity competition, and preserve the captured molecules from degradation.
Fig (3).

Affinity capture and exclusion of albumin. SDS PAGE analysis of particles incubated with the following chemokines, mucosae-associated epithelial chemokine (MEC/CCL28), stromal cell-derived factor-1 beta, (SDF-1β/CXCL12b), and eotaxin-2 (CCL24), in the presence of bovine serum albumin (BSA) to which the chemokines asssociate. Solutions of the chemokines and BSA are shown in lanes 1, 4, and 7. After incubation with the particles, no chemokine was left in the supernatant (S, lane 2, 5, and 8) and all the chemokine solution phase molecules were captured by the particles (P, lanes 3, 6, and 9), while albumin was totally excluded by particles.
PROTECTION FROM DEGRADATION
Labile biomarkers, encapsulated into the particles, are protected against proteolytic degradation, because they are immobilized on the affinity bait, thereby hindering protease recognition and cleavage.
One of the major source of problems that hinders the discovery and measurement of candidate biomarkers is the degradation of biomarkers by endogenous and exogenous proteases. The same chemokines shown in Fig. (3) (MEC/CCL28, SDF-1β/CXCL12b, CCL24) were incubated with trypsin at 37 C in the presence or absence of nanoparticles and the solutions were analyzed with SDS-PAGE. As shown in Fig. (4), trypsin rapidly degraded each chemokine in the absence of the sequestration by particles (Fig. (4), lanes 2, 5, and 8). In marked contrast, chemokines incubated with trypsin and particles (Fig. (4), lane 3, 6, and 9) generated a single species band that was not fragmented, suggesting that particles successfully preserved biomarkers from proteolysis.
Fig (4).

SDS PAGE analysis of particles incubated with the following chemokines, mucosae associated epithelial chemokine (MEC/CCL28), stromal cell-derived factor-1 beta, (SDF-1β/CXCL12b), and eotaxin-2 (CCL24), in presence of high concentrations of trypsin. The starting solution of the chemokines (control) are shown in lanes 1, 4, and 7. Chemokines incubated with particles (Lane 3, 6, and 9) are protected from tryptic degradation whereas chemokines not incubated with particles (Lane 2, 5, and 8) are susceptible to proteolytic digestion.
TARGET BIOMARKER CONCENTRATION – THE CONCEPT
All the target analytes present in the bulk fluid are captured and then collected in a small volume, thereby increasing the concentration. The concentration factor depends on the starting incubation volume and the final volume in which the proteins are collected (Fig. (5)). The nanoparticles effectively amplify the concentration of low abundance biomarkers captured by hydrogel particles into a small volume that is a small fraction of the starting volume. Particles incubated with serum or urine trap the target analytes and are isolated by centrifugation. Affinity biomarkers are then released from the particles by means of elution buffers. The ratio of the volume of elution buffer to the original starting solution establishes the concentration amplification factor. This concentration step provides a means to effectively raise the concentration of rare biomarkers that become the input for a measurement system such as an immunoassay platform or mass spectrometry.
Fig. (5).

Schematic representation of the concentration effect of nanoparticles. When incubated with a given volume of blood in which the majority of proteins are high molecular weight, high abundance proteins (depicted by the letter A), the particles capture all the solution phase biomarkers (depicted by the letter B) within a few minutes. The particles are then separated from the bulk solution and the captured proteins are eluted and collected in a small final volume. The ratio between the initial incubation and the final volume provides the concentration factor.
AMPLIFICATION OF BIOMARKER CONCENTRATION AS MEASURED BY IMMUNOASSAYS
Platelet derived growth factor (PDGF) was chosen as a highly challenging model for cancer related biomarker analysis because it is present in blood in extremely low concentration (0.1– 3.0 ng/mL), with a short half life (2 minutes) [36]. The PDGFs are a family of peptide growth factors that signal through cell surface tyrosine kinase receptors and stimulate various cellular functions including growth, proliferation, and differentiation. Four different polypeptide chains (PDGF-A, -B, -C, and -D) encoded by different genes (chromosomes 4, 7, 11, 22) have been described [37, 38]. PDGF plays a role in angiogenesis and the level of tumor interstitial pressure during tumor progression [39–41]. Several new therapeutic agents designed to target PDGF and its receptor are presently in use in the oncology clinic [42–46]. Despite this known theranostic value, PDGF can not be measured routinely and accurately in the clinic because of the extreme low abundance and high instability of this low molecular weight growth factor. As shown in Fig. (6A) NIPAm/AAc core shell particles were successfully employed to sequester, concentrate and preserve native PDGF from human serum. The value of PDGF in the starting serum solution was 170.92 +/− 4.66 pg/mL whereas the concentration of PDGF recovered from the particles was 1743.43 +/− 11.06 pg/mL, yielding a concentration factor of about 10-fold (1000 percent).
Fig. (6).

A. Effective amplification of native platelet derived growth factor (PDGF) in serum. Hydrogel NIPAm/AAc particles incubated with human serum. ELISA readings on the serum, the supernatant and the particle eluate. B. Effective amplification of human growth hormone (hGH) in urine. Dose response study using recombinant hGH spiked in 10 mL of synthetic urine. Supernatants are depleted and hGH concentration in the particle eluate is linearly dependent on hGH concentration in Surine. UD means undetectable (below the detection limits of the Immulite assay).
Hydrogel nanoparticles functionalized with Cibacron Blue F3G-A (NIPAm/CB) have been applied to the measurement of disease-associated biomarkers in urine. Urine is a potential source of diagnostic biomarkers for diseases detection, and is a very attractive means of non-invasive biospecimen collection. Nonetheless, proteomic measurement in urine has been very challenging because diagnostic biomarkers exist in very low concentration (usually below the sensitivity of common immunoassays) and may be subject to rapid degradation in the acidic urine environment. NIPAm/CB particles sequestered and concentrated one of the most difficult low abundance, but medically relevant, hormones in the urine: human growth hormone (hGH). The normal range of hGH in serum is 1 to 10 ng/mL but the urine concentration is suspected to be 1000 fold less, well below the detection limit (50 picograms per milliliter) of sensitive clinical hGH immunoassays.
In Fig. (6B) nanoparticles were incubated with a solution of hGH whose concentration was below the detection limit of the assay (0.05 ng/mL). Proteins captured by the particles were released and measured using a clinical grade immunoassay analysis (Immulite, Siemens Inc.) The concentration of hGH in the particle eluate was 1.2 ng/mL. When particles were incubated with an hGH solution of 0.8 ng/mL the particle eluate yielded a value greater than 40 ng/mL, which was above the detection limit of the immunoassay, achieving a concentration factor greater than 50 times. As an additional quality check, the concentration of hGH in the particle eluate was found to be linearly dependent on the concentration of hGH in the starting solution, with coefficients of variation less than 5% (Fig. (6B)).
NIPAm/CB particles sequestered and concentrated a very rare biomarker in urine, hGH, raising the effective sensitivity from below the detection limit of a clinical immunoassay well into the linear range of the assay. A simple mathematical equation can predict the minimum concentration of hGH detectable by immunoassay following particle based concentration and elution, knowing the sensitivity of the assay, the initial volume of urine, and the output volume of the elution:
where Cmin is the minimum detectable concentration of hGH in urine, T is the lowest limit of sensitivity of the immunoassay, V is the starting volume of urine tested, v is the output volume of the eluate, c = V/v is the concentration factor given by the ratio between the initial volume of urine and the volume of the eluate. Assuming that we have 100 mL of urine and the protein analytes captured in the particles can be eluted in the volume v of 200 µL, the concentration factor c is 500 and the sensitivity of the immunoassay T is 50 pg/mL, then Cmin the minimum detectable concentration of hGH will be 0.1 pg/mL with the immunoassay used in this study and 100 mL of urine as a starting volume.
PARTICLE PREPARATION AND CHARACTERIZATION
The particles can be readily manufactured in large scale at extremely low cost, successfully stored in a lyophilized state and reconstituted immediately before use. Particles can be produced with extremely high yield and reproducibility between and within batches. Particle size is very homogeneous, as shown in Fig (7).
Fig. (7).

Examples of atomic force microscopy images of NIPAm/AAc and NIPAm/CB particles. The average diameter is 0.80 microns.
The core shell nanoparticles we have used to capture and preserve biomarkers have a size of approximately 0.8 microns and have been successfully studied and characterized by traditional flow cytometry.
USE OF HARVESTING NANOPARTICLES IN CLINICAL SETTINGS
The envisioned used of this technology is a population of harvesting particles that contains multiple subpopulations specific for individual classes of low molecular weight molecules present in whole blood and other body fluids, such as urine, cerebro-spinal fluid, sweat, saliva, nipple aspirates, and amniotic fluid. The particles can be simply stored within the collection tube (e.g. vacutainer) for the blood or body fluid (Fig. (8)). Following introduction of the blood or body fluid, the respective particle populations remove all of their target molecules, in one step, in solution, from the entire volume of the sample and concentrate the sequestered analyte inside the particle. Ongoing clinical research evaluations confirm that it’s possible to recover particles that have been incubated with whole blood by two successive centrifugations. The first centrifugation, at lower speed, will pellet the blood cellular components (red and white blood cells) and leave the particles in solution. The second centrifugation at higher speed will pellet the particles. Proteins eluted from particles are ready to be analyzed by SDS-PAGE and mass spectrometry. Analysis of the whole blood will provide a precise snapshot of the proteomic status of the patient and will not be compromised by the degradation that takes place during the variable time of sample storage, transport, and processing, currently existing in a busy clinical environment. The particle populations carrying different baits can be functionalized with a rainbow of fluorescent dyes and separated by flow cytometry for respective analysis of their harvested biomarker class.
Fig. (8).

The envisioned application of particles directly in the Vacutainer device for blood collection.
Finally we envision the extension of the biomarker harvesting particles to other collection receptacles, such as an adhesive patch for the sampling of skin transudate, exudate, and sweat. A patch configuration would take advantage of the concentration and preservation functions of the particles.
Acknowledgements
This work was partially supported by 1) George Mason University, 2) the Italian Istituto Superiore di Sanita` in the framework of the Italy/USA cooperation agreement between the U.S. Department of Health and Human Services, George Mason University, and the Italian Ministry of Public Health, 3) the U.S. Department of Energy (grant number DE-FC52-04NA25455), and 4) NIH, NCI grant 1R21CA137706-01. The technology described herein is licensed (patent pending) to the authors institutions (George Mason University, USA and Istituto Superiore di Sanita', Italy).
References
- 1.Aebersold R, Anderson L, Caprioli R, Druker B, Hartwell L, Smith R. J Proteome Res. 2005;4:1104–1109. doi: 10.1021/pr050027n. [DOI] [PubMed] [Google Scholar]
- 2.Srinivas PR, Verma M, Zhao Y, Srivastava S. Clin Chem. 2002;48:1160–1169. [PubMed] [Google Scholar]
- 3.Espina V, Mehta AI, Winters ME, Calvert V, Wulfkuhle J, Petricoin EF, 3rd, Liotta LA. Proteomics. 2003;3:2091–2100. doi: 10.1002/pmic.200300592. [DOI] [PubMed] [Google Scholar]
- 4.Anderson NL, Anderson NG. Mol Cell Proteomics. 2002;1:845–867. doi: 10.1074/mcp.r200007-mcp200. [DOI] [PubMed] [Google Scholar]
- 5.Conrads TP, Hood BL, Veenstra TD. BioTechniques. 2006;40:799–805. doi: 10.2144/000112196. [DOI] [PubMed] [Google Scholar]
- 6.Lopez MF, Mikulskis A, Kuzdzal S, Bennett DA, Kelly J, Golenko E, DiCesare J, Denoyer E, Patton WF, Ediger R, Sapp L, Ziegert T, Lynch C, Kramer S, Whiteley GR, Wall MR, Mannion DP, Della Cioppa G, Rakitan JS, Wolfe GM. Clinical chemistry. 2005;51:1946–1954. doi: 10.1373/clinchem.2005.053090. [DOI] [PubMed] [Google Scholar]
- 7.Lopez MF, Mikulskis A, Kuzdzal S, Golenko E, Petricoin EF, 3rd, Liotta LA, Patton WF, Whiteley GR, Rosenblatt K, Gurnani P, Nandi A, Neill S, Cullen S, O'Gorman M, Sarracino D, Lynch C, Johnson A, McKenzie W, Fishman D. Clinical chemistry. 2007;53:1067–1074. doi: 10.1373/clinchem.2006.080721. [DOI] [PubMed] [Google Scholar]
- 8.Lowenthal MS, Mehta AI, Frogale K, Bandle RW, Araujo RP, Hood BL, Veenstra TD, Conrads TP, Goldsmith P, Fishman D, Petricoin EF, 3rd, Liotta LA. Clin Chem. 2005;51:1933–1945. doi: 10.1373/clinchem.2005.052944. [DOI] [PubMed] [Google Scholar]
- 9.Zolotarjova N, Martosella J, Nicol G, Bailey J, Boyes BE, Barrett WC. Proteomics. 2005;5:3304–3313. doi: 10.1002/pmic.200402021. [DOI] [PubMed] [Google Scholar]
- 10.Camerini S, Polci ML, Liotta LA, Petricoin EF, Zhou W. Proteomics Clin. Appl. 2007;1:176–184. doi: 10.1002/prca.200600618. [DOI] [PubMed] [Google Scholar]
- 11.Geho D, Cheng MM, Killian K, Lowenthal M, Ross S, Frogale K, Nijdam J, Lahar N, Johann D, Herrmann P, Whiteley G, Ferrari M, Petricoin E, Liotta L. Bioconjug Chem. 2006;17:654–661. doi: 10.1021/bc0503364. [DOI] [PubMed] [Google Scholar]
- 14.Ayache S, Panelli M, Marincola FM, Stroncek DF. American journal of clinical pathology. 2006;126:174–184. doi: 10.1309/3WM7-XJ7R-D8BC-LNKX. [DOI] [PubMed] [Google Scholar]
- 15.Schrohl A-S, Wurtz S, Kohn E, Banks RE, Nielsen HJ, Sweep FCGJ, Brunner N. Mol Cell Proteomics. 2008;7:2061–2066. doi: 10.1074/mcp.R800010-MCP200. [DOI] [PMC free article] [PubMed] [Google Scholar]
- 16.Luchini A, Geho DH, Bishop B, Tran D, Xia C, Dufour RL, Jones CD, Espina V, Patanarut A, Zhou W, Ross MM, Tessitore A, Petricoin EF, 3rd, Liotta LA. Nano letters. 2008;8:350–361. doi: 10.1021/nl072174l. [DOI] [PMC free article] [PubMed] [Google Scholar]
- 17.Fredolini C, Meani F, Reeder KA, Rucker S, Patanarut A, Botterell PJ, Bishop B, Longo C, Espina V, Petricoin EFI, Liotta LA, Luchini A. Nano Research. 2008;1:502–518. doi: 10.1007/s12274-008-8054-z. [DOI] [PMC free article] [PubMed] [Google Scholar]
- 18.Denizli A, Piskin E. Journal of Biochemical and Biophysical Methods. 2001;49:391–416. doi: 10.1016/s0165-022x(01)00209-3. [DOI] [PubMed] [Google Scholar]
- 19.Thompson ST, Cass KH, Stellwagen E. Proc Natl Acad Sci U S A. 1975;72:669–672. doi: 10.1073/pnas.72.2.669. [DOI] [PMC free article] [PubMed] [Google Scholar]
- 20.Subramanian S, Kaufman BT. J Biol Chem. 1980;255:10587–10590. [PubMed] [Google Scholar]
- 21.Arnaud P, Gianazza E. FEBS Lett. 1982;137:157–161. doi: 10.1016/0014-5793(82)80337-2. [DOI] [PubMed] [Google Scholar]
- 22.Uekama K, Hirayama F, Arima H. Journal of Inclusion Phenomena and Macrocyclic Chemistry. 2006;56:3–8. [Google Scholar]
- 23.Cai W, Yao X, Shao X, Pan Z. Journal of Inclusion Phenomena and Macrocyclic Chemistry. 2005;51:41–51. [Google Scholar]
- 24.Zarzycki P, Ohta H, Saito Y, Jinno K. Analytical and Bioanalytical Chemistry. 2008;391:2793–2801. doi: 10.1007/s00216-008-2209-3. [DOI] [PubMed] [Google Scholar]
- 25.Stefánsson E, Loftsson T. Journal of Inclusion Phenomena and Macrocyclic Chemistry. 2002;44:23–27. [Google Scholar]
- 26.Jin S, Lee Y, Kang H. Archives of Dermatological Research. 300:451–454. doi: 10.1007/s00403-008-0864-z. [DOI] [PubMed] [Google Scholar]
- 27.Borst C, Holzgrabe U. J Chromatogr A. 2008;1024:191–196. doi: 10.1016/j.chroma.2008.05.052. [DOI] [PubMed] [Google Scholar]
- 29.Elmas B, Onur M, Şenel S, Tuncel A. Colloid & Polymer Science. 2002;280:1137–1146. [Google Scholar]
- 30.Kataoka K, Miyazaki H, Okano T, Sakurai Y. Macromolecules. 1994;27:1061–1062. [Google Scholar]
- 31.Lorand JP, Edwards JO. J. Org. Chem. 1959;24:769–774. [Google Scholar]
- 32.Mader HS, Wolfbeis OS. Microchimica Acta. 2008;162:1–34. [Google Scholar]
- 34.Zhang Y, Gao X, Hardcastle K, Wang B. Chemistry. 2006;12:1377–1384. doi: 10.1002/chem.200500982. [DOI] [PubMed] [Google Scholar]
- 35.Pelton R. Adv Colloid Interface Sci. 2000;85:1–33. doi: 10.1016/s0001-8686(99)00023-8. [DOI] [PubMed] [Google Scholar]
- 36.Bowen-Pope DF, Malpass TW, Foster DM, Ross R. Blood. 1984;64:458–469. [PubMed] [Google Scholar]
- 37.Li X, Ponten A, Aase K, Karlsson L, Abramsson A, Uutela M, Backstrom G, Hellstrom M, Bostrom H, Li H, Soriano P, Betsholtz C, Heldin CH, Alitalo K, Ostman A, Eriksson U. Nature cell biology. 2000;2:302–309. doi: 10.1038/35010579. [DOI] [PubMed] [Google Scholar]
- 38.Fredriksson L, Li H, Eriksson U. Cytokine & growth factor reviews. 2004;15:197–204. doi: 10.1016/j.cytogfr.2004.03.007. [DOI] [PubMed] [Google Scholar]
- 39.Heinrich MC, Corless CL, Duensing A, McGreevey L, Chen CJ, Joseph N, Singer S, Griffith DJ, Haley A, Town A, Demetri GD, Fletcher CD, Fletcher JA. Science. Vol. 299. New York, N.Y: 2003. pp. 708–710. [DOI] [PubMed] [Google Scholar]
- 40.Baxter EJ, Hochhaus A, Bolufer P, Reiter A, Fernandez JM, Senent L, Cervera J, Moscardo F, Sanz MA, Cross NC. Human molecular genetics. 2002;11:1391–1397. doi: 10.1093/hmg/11.12.1391. [DOI] [PubMed] [Google Scholar]
- 41.Yu J, Ustach C, Kim HR. Journal of biochemistry and molecular biology. 2003;36:49–59. doi: 10.5483/bmbrep.2003.36.1.049. [DOI] [PubMed] [Google Scholar]
- 42.Board R, Jayson GC. Drug resistance updates. 2005;8:75–83. doi: 10.1016/j.drup.2005.03.004. [DOI] [PubMed] [Google Scholar]
- 43.Kabbinavar F, Hurwitz HI, Fehrenbacher L, Meropol NJ, Novotny WF, Lieberman G, Griffing S, Bergsland E. Journal of clinical oncology. 2003;21:60–65. doi: 10.1200/JCO.2003.10.066. [DOI] [PubMed] [Google Scholar]
- 44.McArthur GA, Demetri GD, van Oosterom A, Heinrich MC, Debiec-Rychter M, Corless CL, Nikolova Z, Dimitrijevic S, Fletcher JA. Journal of clinical oncology. 2005;23:866–873. doi: 10.1200/JCO.2005.07.088. [DOI] [PubMed] [Google Scholar]
- 45.Mathew P, Thall PF, Jones D, Perez C, Bucana C, Troncoso P, Kim SJ, Fidler IJ, Logothetis C. Journal of clinical oncology. 2004;22:3323–3329. doi: 10.1200/JCO.2004.10.116. [DOI] [PubMed] [Google Scholar]
- 46.Kubo T, Piperdi S, Rosenblum J, Antonescu CR, Chen W, Kim HS, Huvos AG, Sowers R, Meyers PA, Healey JH, Gorlick R. Cancer. 2008;112:2119–2129. doi: 10.1002/cncr.23437. [DOI] [PubMed] [Google Scholar]