

Abstract
Objective
To identify common loci and potential genetic variants affecting body mass index (BMI, kg m−2) in study populations originating from Europe.
Design
We combined genome-wide linkage scans of six cohorts from Australia, Denmark, Finland, the Netherlands, Sweden and the United Kingdom with an ~10-cM microsatellite marker map. Variance components linkage analysis was carried out with age, sex and country of origin as covariates.
Subjects
The GenomEUtwin consortium consists of twin cohorts from eight countries (Australia, Denmark, the Netherlands, Finland, Italy, Norway, Sweden and the United Kingdom) with a total data collection of more than 500 000 monozygotic and dizygotic (DZ) twin pairs. Variance due to early-life events and the environment is reduced within twin pairs, which makes DZ pairs highly valuable for linkage studies of complex traits. This study totaled 4401 European-originated twin families (10 535 individuals) from six countries (Australia, Denmark, the Netherlands, Finland, Sweden and the United Kingdom).
Results
We found suggestive evidence for a quantitative trait locus on 3q29 and 7q36 in the combined sample of DZ twins (multipoint logarithm of odds score (MLOD) 2.6 and 2.4, respectively). Two individual cohorts showed strong evidence independently for three additional loci: 16q23 (MLOD = 3.7) and 2p24 (MLOD = 3.4) in the Dutch cohort and 20q13 (MLOD = 3.2) in the Finnish cohort.
Conclusion
Linkage analysis of the combined data in this large twin cohort study provided evidence for suggestive linkage to BMI. In addition, two cohorts independently provided significant evidence of linkage to three new loci. The results of our study suggest a smaller environmental variance between DZ twins than full siblings, with a corresponding increase in heritability for BMI as well as an increase in linkage signal in well-replicated regions. The results are consistent with the possibility of locus heterogeneity for some genomic regions, and indicate a lack of major common quantitative trait locus variants affecting BMI in European populations.
Keywords: genetic linkage, body mass index, dizygotic twins, quantitative trait locus, heritability
Introduction
Obesity (Online Mendelian Inheritance in Man (OMIM): 601665)-related traits have been a target of numerous studies in recent decades. This vast amount of information can be reviewed on the obesity gene map website (http://obesitygene.pbrc.edu/). Extremes in body mass index (BMI) distribution, that is, both excesses and very low BMI, present serious health problems. A low BMI, usually an indication of protein-energy malnutrition or the effects of wasting or a disease process, is a significant predictor of mortality.1 On the other hand, high BMI and obesity increases the risk of coronary heart disease, certain types of cancer, hypertension, osteoarthritis and type 2 diabetes mellitus. Several monogenic forms of obesity have been identified which are exemplified by mutations in the leptin and melanocortin receptors. Moreover, several syndromes have been shown to manifest obesity as one of the symptoms, such as the Prader–Willi syndrome (OMIM: 176270), the Bardet–Biedl syndrome (OMIM: 209900), Cohen’s syndrome (OMIM: 216550) and the Macrosomia, obesity, macrocephaly and ocular abnormalities syndrome (OMIM: 157980). These monogenic and syndromic forms of obesity are relatively rare and only explain a small fraction of variability in the trait. The first successful genome-wide association study (GWAS) by Frayling et al.2 showed that relatively common variants of the FTO gene affect BMI in the general population. Since then, four other GWASs have shown a number of regions; however, they only account for <1% of the variance in BMI.3-6 In recent years, a number of studies have published linkage results with obesity. The obesity gene map database shows that there is an abundance of obesity-linked loci and every chromosome has been linked to obesity, except chromosome Y. Bell et al.7 conclude in their review paper that seven of these quantitative trait loci have been subsequently replicated (2p21–p23, 3q27, 4q31–q32, 7q31–q32, 10p11–p12, 11q14–q24 and 20q11–q13). For a more extensive review of the genetics of obesity, see a paper by Bell et al.7 and a book edited by Clement and Sørensen.8 To date, most of the loci found in GWASs have been central nervous system related, suggesting that they are behavioral genes. It is possible that linkage studies will identify different loci than will GWASs. Linkage studies are more powerful to find rare variants with high impact, whereas it cannot detect the common low-impact variants that have been identified by GWASs. Our study aimed at finding loci contributing to variability in BMI in a large cohort of European-originated twins, using variance components linkage analysis. The samples were genotyped from population-based registers and were unselected for BMI or any other phenotype.
Materials and methods
The data sets and methods are described in detail by Perola et al.9 In brief, genome-wide microsatellite scan data from the following six twin cohorts were available for analysis: The Australian Twin Registry,10 the Danish Twin Registry,11 the Finnish Twin Cohort,12 the Netherlands Twin Register,13 the Swedish Twin Registry14 and the TwinsUK Adult Twin Registry.15 Although these are all twin studies, some of them have recruited additional family members included in this study. Data sets are summarized in Table 1. The combined sample set comprised 10 928 individuals from 4401 families with genotype and phenotype information. The skewness and kurtosis of BMI in the total sample were 1.14 and 2.69, respectively, and therefore a log base10 transformation was used. After normalization, the skewness and kurtosis of logBMI were 0.47 and 0.82, respectively. logBMI was used in all analyses. Sex, age and country of origin correlate significantly with BMI and they were used as covariates in the combined sex analysis. Outliers (n = 393), determined by values differing by more than 3 s.d. from the population mean, were excluded from the analyses. Marker maps from all of the cohorts were combined using Cartographer program.16 The program GRR was used to test for the validity of twin zygosity and other familial relationships.17 Genotypes were checked for Mendelian inconsistencies using the PedCheck program.18 The non-Mendelian inconsistencies (2249 of the 5 882 017 genotypes of 6919 loci were excluded) were evaluated with Merlin’s19 genotyping-error option and removed by option pedwipe.19 The analyses were performed with AUTOGSCAN20 program which uses Merlin.19 We performed variance components analysis for logBMI in the 10 535 individuals. There were a total of 3356 dizygotic (DZ) twin pairs (706 male pairs, 2040 female pairs and 610 opposite-sex pairs). The heritability estimates were calculated in Merlin along with the linkage analyses. The larger proportion of females was because of the UK sample, which was a large female-specific cohort. The linkage analysis was also carried out conditional on sex to examine whether there was a sex-specific contribution to the linkage signal at a given locus. The number of informative pairs with both genotype and phenotype data is summarized in Table 2. The analyses were carried out per country in both extended families (where available) and DZ twins only. We then combined samples across countries and analyzed the combined DZ twin sample and extended families sample, which included all the available individuals.
Table 1.
Demographics of sample sets
|
Males
|
Females
|
N0. of
families |
Average
family size |
Average
map density |
|||||||||||
|---|---|---|---|---|---|---|---|---|---|---|---|---|---|---|---|
| Mean BMI | s.d. | Min | Max | Mean age | n | Mean BMI | s.d. | Min | Max | Mean age | n | ||||
| All | 25.34 | 3.44 | 13.84 | 53.26 | 50.15 | 3667 | 24.7 | 4.48 | 13.64 | 51.64 | 48.91 | 6868 | 4401 | 2.4 | |
| Australia | 25.38 | 3.74 | 14.64 | 53.26 | 44.51 | 1214 | 24.69 | 4.64 | 13.85 | 48.27 | 44.44 | 1876 | 1287 | 2.4 | 7.7 cM |
| Denmark | 25.22 | 3.31 | 13.84 | 36.56 | 53.69 | 247 | 23.51 | 3.70 | 14.52 | 37.07 | 60.96 | 377 | 315 | 2.0 | 9.6 cM |
| Finland | 25.49 | 3.70 | 16.47 | 46.00 | 52.07 | 518 | 24.72 | 5.22 | 13.64 | 45.70 | 60.43 | 339 | 387 | 2.2 | 9.3 cM |
| The Netherlands |
25.21 | 3.26 | 14.87 | 39.64 | 45.12 | 1160 | 24.46 | 4.13 | 14.68 | 47.48 | 43.55 | 1535 | 757 | 3.6 | 9.2 cM |
| Sweden | 25.47 | 2.72 | 19.57 | 35.80 | 74.62 | 528 | 25.17 | 3.68 | 16.53 | 41.88 | 74.99 | 525 | 544 | 2.0 | 4.2 cM |
| United Kingdom |
NA | NA | NA | NA | NA | NA | 25.08 | 4.68 | 15.21 | 51.64 | 47.26 | 2216 | 1111 | 2.0 | 4.7 cM |
Abbreviations: BMI, body mass index; NA, not available.
Table 2.
Number of informative pairs with both phenotype and genotype information
| Relative pair | Pairs |
|---|---|
| Sib pairs | 5837 |
| Half-sibs | 27 |
| Cousins | 24 |
| Parent–child | 3078 |
| Grandparent–grandchild | 14 |
| Avuncular | 119 |
Results
The covariate-adjusted heritability of BMI was 54% in the extended families sample and 73% in the DZ twin sample. Sex-stratified analyses were carried out in the extended family sample and in the DZ sample, but not in the country-specific samples. Figures 1 and 2 show all of the linkage results per chromosome in the extended family sample, DZ twins-only sample and sex-stratified analyses. The DZ twin data provided evidence for more loci than did the extended family sample. The DZ linkage loci of multipoint logarithm of odds score (MLOD)>1 are summarized in Table 3 with corresponding MLOD scores from both sample sets. The country-specific linkage peaks of MLOD>2 are summarized in the Table 4.
Figure 1.
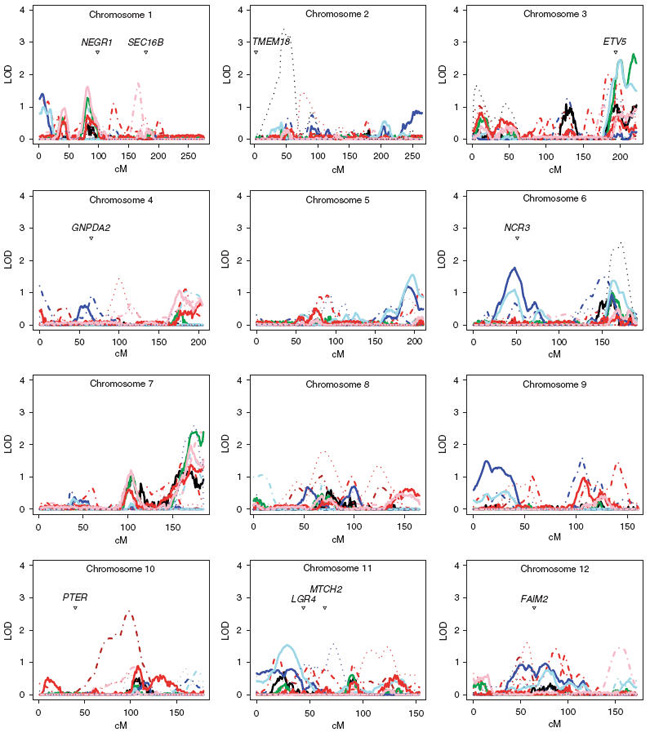
The multipoint variance components linkage results for chromosomes 1–12 and published genome-wide association loci.
Figure 2.
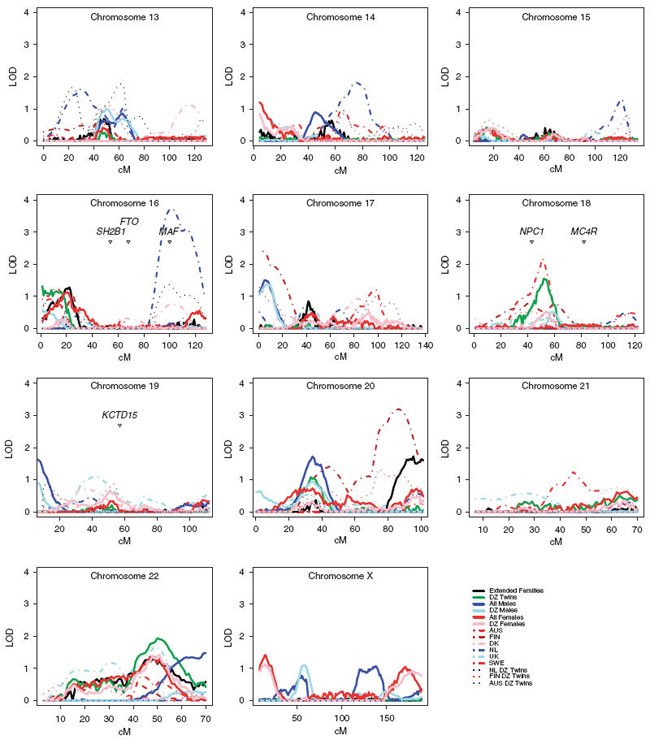
The multipoint variance components linkage results for chromosomes 13–X and published genome-wide association loci.
Table 3.
Linkage peaks with MLOD>1 in either DZ twins or in extended families
| Position | DZ twins | Extended families |
|---|---|---|
| 1p32.2 | 1.3 | 0.3 |
| 3q27.3 | 2.5 | 0.7 |
| 3q29 | 2.6 | 0.9 |
| 7q36.3 | 2.4 | 1.0 |
| 16p13.2 | 0.4 | 1.3 |
| 16p13.3 | 1.3 | 0.3 |
| 18q12.1 | 1.6 | 0.0 |
| 20p12.2 | 1.1 | 0.3 |
| 20q13.32 | 0.1 | 1.7 |
| 22q13.2 | 1.9 | 1.1 |
Abbreviations: DZ, dizygotic; MLOD, multipoint logarithm of odds score.
Table 4.
The cohort-specific linkage results of MLOD>2 both in DZ twins and extended families
| Position | MLOD | Sample set |
|---|---|---|
| 2p24.1 | 3.4 | Dutch DZ sample |
| 3q26.32 | 2 | Australian extended families |
| 6q26 | 2.56 | Dutch DZ sample |
| 7q36.2 | 2.6 | Australian DZ sample |
| 7q36.3 | 2.4 | Danish DZ sample |
| 10q22.3 | 2.6 | Finnish extended families |
| 16q23.2 | 3.73 | Dutch extended families |
| 17p13.3 | 2.28 | Finnish extended families |
| 18q12.1 | 2.2 | Swedish DZ sample |
| 20q13.2 | 3.2 | Finnish extended families |
Abbreviations: DZ, dizygotic; MLOD, multipoint logarithm of odds score.
Discussion
Body mass index has been an extensively studied trait because of the health effects of obesity. The need for more effective clinical strategies has become evident with the increasing prevalence of obesity in recent years. This highlights the importance of finding variants responsible for differences between individuals in how they respond to factors resulting in an imbalance between energy expenditure and energy intake. Yet, the causes of the increase in obesity are more complex than suggested by the energy imbalance equation. Thus, Keith et al.21 have shown other putative contributors to the increase in obesity prevalence. They found at least 10 factors which correlated with the increased prevalence of obesity in the United States during the recent decades, for example, increased sleep deprivation, reduction in variability in ambient temperature, decreased smoking, pharmaceutical iatrogenesis (weight gain due to medication) and increasing gravida age. However, the causal role of these temporally correlated factors needs to be established. Hypothetically, genes correlated with obesity may be genes acting on these putative risk factors rather than directly on obesity-related metabolic factors. Within populations, numerous family and twin studies have documented a consistent major role of genetic effects on BMI.22,23 The linkage and candidate gene studies have been summarized by the human obesity gene map.24
In this study, we aimed at finding common major loci affecting BMI in European populations. The DZ twins in this study originate from six twin cohorts of European origin. The aims of this multicenter analysis were to replicate previous findings and to use the greater statistical power to identify novel loci. DZ twins are of the same age, have shared the same prenatal and family rearing environment and school experiences more closely than had full siblings from families. As BMI changes with age, and the genetic determinants of weight change are largely uncorrelated with BMI level in adulthood, matching on age is an important advantage of the current data set.25,26 As the biggest individual cohort comprised 2216 individuals, power was substantially increased by combining the cohorts which totaled 10 535 individuals. On the other hand, the combined sample would be unable to find population-specific loci.
We showed suggestive linkage in two regions, namely 3q29 and 7q36 (MLOD = 2.6 and MLOD = 2.4, respectively) that were extensively replicated in other studies, thus providing further evidence that these regions harbor genes that affect BMI.
A summary of earlier relevant findings in relation to the current results in shown in Table 5. The linkage to chromosome 3q29 region is exemplified by findings from Kissebah et al.28 with numerous metabolic syndrome component traits, including BMI, waist, hip, insulin, insulin:glucose in Caucasian families (MLOD = 2.4–3.5, 2209 individuals from 507 families). Luke et al.29 showed linkage with BMI in an African-American population (MLOD = 4.3, 1163 individuals from 329 families), and Wu et al.32 showed linkage with BMI in a combined sample of European, African and Mexican Americans (MLOD = 3.4, in 4021 sib pairs). The key finding of the chromosome 7q36 region include the following: the study by Feitosa et al.,34 who have shown linkage to BMI in an European–American sample (MLOD = 4.9, 3407 individuals from 536 families), and the study by Sammalisto et al.,33 who reported linkage to BMI in a combined African-American and European–American sample (female-specific analysis MLOD = 2.9, of 5788 females from 3032 families). Interestingly, the linkage signal in chromosome 7q36 area of our study is female driven which is consistent with the study by Sammalisto et al., suggesting a female-specific effect for this locus. There was no sex-specific effect in the chromosome 3q29 linkage signal. There are some interesting candidate genes right under the best linkage peaks of the combined sample. For example, in the 3q29 region, there is APOD (OMIM: 107740), which has not yet been associated with human obesity but has a role in fat metabolism. The linkage peak in 7q36 is near the leptin gene (7q27), but more interestingly under the linkage peak resides the INSIG1 (OMIM: 602055) gene. It has been shown to regulate cholesterol concentrations in cells and would be an excellent candidate gene for further studies along with APOD. Individual cohorts provided evidence of linkage in regions, which have also been previously linked to obesity-related traits: the 2p2437-40 area (MLOD = 3.4) in the Dutch cohort and the 20q1341-44 area (MLOD = 3.2) in the Finnish cohort. In addition, the Dutch cohort showed significant linkage to the chromosome 16q23 area (MLOD = 3.7), which has been linked to resting energy expenditure.45 The linkage studies from individual cohorts with partially overlapping samples have been published before. The linkage study in UK twins did not reveal any significant loci on its own.46 The previously published studies in both Dutch twins47 and Finnish twins48 were considerably smaller than the sample used in this study, and they did not provide significant evidence of linkage. The previously published linkage study in Australian twin families49 was slightly smaller (933 families) than the sample used in this study (1153 families), and the results between our Australian sample and previously published data were similar. The linkage studies in Danish and Swedish twins have not been published before. More detailed research on these regions should be conducted within the populations in which they were identified. They might contain some rare alleles that are enriched within these populations but are very rare in other parts of Europe. The strongest evidence for linkage in the combined study came from the DZ twin analysis without the additional family members corroborating that our sampling strategy was successful. Although the possibility of sampling error cannot be excluded, the reason for stronger signal in DZ twin sample was probably the reduction in environmental variance allowing us to show linkage in previously well-replicated regions exemplified by Table 3. Although these regions show evidence of linkage, GWA scans have not yet been able to show evidence of association in all of these regions; GWASs identify only common variants, and current chips do not cover all the existing variations. Therefore, we still need to find ways to combine the linkage and GWASs to finally find the variants responsible for the linkage signals, which may be caused by genetic markers other than common single-nucleotide polymorphisms.
Table 5.
Studies that show linkage in chromosome 3q29 and 7q36 regions
| Chromosome | Study group |
Number of
families |
Number of
individuals |
Trait | Population | LOD |
|---|---|---|---|---|---|---|
| 3q29 | Francke et al.27 | 99 | 535 | Categorized coronary heart disease and myocardial infarction |
North Indian origin | 2.1 |
| 3q29 | Kissebah et al.28 | 507 | 2209 | Metabolic syndrome component traits | Caucasian | 2.4–3.5 |
| 3q29 | Luke et al.29 | 329 | 1163 | BMI | African American | 4.3 |
| 3q29 | Vionnet et al.30 | 143 | 637 | Early onset type 2 diabetes | French | 4.6a |
| 3q29 | Walder et al.31 | 239 | 770 | BMI | Pima Indians | 1.4 |
| 3q29 | Wu et al.32 | 4021 | 8042 | BMI | Mixed European American, African American and Mexican American |
3.4 |
| 7q36 | Sammalisto et al.33 | 3032 | 5788 | BMI | Mixed European American and African American |
2.9b |
| 7q36 | Feitosa et al.34 | 536 | 3407 | BMI | European American | 4.9 |
| 7q36 | Hsueh et al.35 | 28 | 672 | BMI adjusted leptin levels | Amish | 1.8 |
| 7q36 | Pérusse et al.36 | 156 | 521 | Abdominal subcutaneous fat | Caucasian | 2 |
Abbreviation: BMI, body mass index.
Maximum binomial likelihood
Female-specific signal.
The contribution of the FTO gene to obesity was initially discovered through type 2 diabetes and not by BMI as such. Later studies such as the study by Kring et al.50 have shown that genetic variants in the FTO gene do contribute to fat mass, but the mechanism still remains unclear. Interestingly, this region shows no evidence of linkage thus suggesting that the region does not harbor variants detectable for linkage. It must be realized that the linkage analysis approach detects different variants than does association mapping.51 The MC4R gene has been shown to harbor rare variants which are associated with severe non-syndromic obesity and is the largest known source of contribution in monogenic obesity.52,53 There is a linkage peak in the DZ twin sample (MLOD = 1.5) which is 20 cM away from the gene. We plotted all of the GWA findings to our linkage data in Figure 1. One of the closest genes reported in the GWAS in the associated region is marking the position of the association. Interestingly, 4 of the 13 reported GWA loci show linkage >1 in the combined sample including NPC1, LGR4, ETV5 and NCR3. This would suggest that these regions also harbor rare variants with strong effects. The findings of this study provide further evidence in several regions in the genome. There are obesity genes to be identified under established linkage peaks, which might explain more of the still largely unexplained variance in human BMI.
Acknowledgements
This project is supported by the European Commission under the program ‘Quality of Life and Management of the Living Resources’ of 5th Framework Programme (no. QLG2CT-2002-01254), Genome-Wide Analyses of European Twin and Population Cohorts (EU/QLRT-2001-01254), NIH/NHLBI: STAMPEED (Genetics of cardiovascular risk factors in large founder population birth cohorts, 1-R01-HL08767901), by the Finnish Heart Association, the Sigrid Juselius Foundation and the Academy of Finland Centre of Excellence in Complex Disease Genetics. TwinsUK is supported by the Wellcome Trust, the BBSRC and an NHS NIHR Biomedical research centre Grant to KCL and Guys and St Thomas’ foundation hospitals trust. The Swedish twin registry was supported by Swedish Research Council (no. M-2005-1112) and the Swedish Foundation for Strategic Research. The Australian Twin Registry was supported in part by Grants from NIAAA (USA): AA007535, AA013320, AA013326, AA014041, AA07728, AA10249, AA11998, and NHMRC (Australia): 941177, 951023, 950998, 981339, 241916 and 941944. The Netherlands Twin Register was supported by the Netherlands Heart Foundation (86.083, 88.042, 90.313), the Netherlands Organisation for Scientific Research (904-61-090; SPI 56-464-14192; 480-04-004), Center Medical Systems Biology (NWO Genomics), Genome Scan for Neuroticism (National Institute of Mental Health Grant no. R01 MH059160). Samples were genotyped by the Mammalian Genotyping Service in Marshfield and the Molecular Epidemiology Section, Leiden University Medical Centre. The Danish Twin Registry has been supported by the Danish Medical Research Council, The Danish Diabetes Foundation, the Danish Heart Foundation and the Novo Nordisk Foundation.
Footnotes
Conflict of interest
The authors declare no conflict of interest.
References
- 1.Landi F, Onder G, Gambassi G, Pedone C, Carbonin P, Bernabei R. Body mass index and mortality among hospitalized patients. Arch Intern Med. 2000;160:2641–2644. doi: 10.1001/archinte.160.17.2641. [DOI] [PubMed] [Google Scholar]
- 2.Frayling TM, Timpson NJ, Weedon MN, Zeggini E, Freathy RM, Lindgren CM, et al. A common variant in the FTO gene is associated with body mass index and predisposes to childhood and adult obesity. Science (New York, NY) 2007;316:889–894. doi: 10.1126/science.1141634. [DOI] [PMC free article] [PubMed] [Google Scholar]
- 3.Willer CJ, Speliotes EK, Loos RJ, Li S, Lindgren CM, Heid IM, et al. Six new loci associated with body mass index highlight a neuronal influence on body weight regulation. Nat Genet. 2009;41:25–34. doi: 10.1038/ng.287. [DOI] [PMC free article] [PubMed] [Google Scholar]
- 4.Thorleifsson G, Walters GB, Gudbjartsson DF, Steinthorsdottir V, Sulem P, Helgadottir A, et al. Genome-wide association yields new sequence variants at seven loci that associate with measures of obesity. Nat Genet. 2009;41:18–24. doi: 10.1038/ng.274. [DOI] [PubMed] [Google Scholar]
- 5.Loos RJ, Lindgren CM, Li S, Wheeler E, Zhao JH, Prokopenko I, et al. Common variants near MC4R are associated with fat mass, weight and risk of obesity. Nat Genet. 2008;40:768–775. doi: 10.1038/ng.140. [DOI] [PMC free article] [PubMed] [Google Scholar]
- 6.Meyre D, Delplanque J, Chevre JC, Lecoeur C, Lobbens S, Gallina S, et al. Genome-wide association study for early-onset and morbid adult obesity identifies three new risk loci in European populations. Nat Genet. 2009;41:157–159. doi: 10.1038/ng.301. [DOI] [PubMed] [Google Scholar]
- 7.Bell CG, Walley AJ, Froguel P. The genetics of human obesity. Nat Rev. 2005;6:221–234. doi: 10.1038/nrg1556. [DOI] [PubMed] [Google Scholar]
- 8.Clement K, Sørensen TIA. Obesity: Genomics and Postgenomics. Informa Healthcare; New York, USA: 2007. [Google Scholar]
- 9.Perola M, Sammalisto S, Hiekkalinna T, Martin NG, Visscher PM, Montgomery GW, et al. Combined genome scans for body stature in 6,602 European twins: evidence for common Caucasian loci. PLoS Genet. 2007;3:e97. doi: 10.1371/journal.pgen.0030097. [DOI] [PMC free article] [PubMed] [Google Scholar]
- 10.Hopper JL. The Australian Twin Registry. Twin Res. 2002;5:329–336. doi: 10.1375/136905202320906048. [DOI] [PubMed] [Google Scholar]
- 11.Skytthe A, Kyvik K, Holm NV, Vaupel JW, Christensen K. The Danish Twin Registry: 127 birth cohorts of twins. Twin Res. 2002;5:352–357. doi: 10.1375/136905202320906084. [DOI] [PubMed] [Google Scholar]
- 12.Kaprio J, Koskenvuo M. Genetic and environmental factors in complex diseases: the older Finnish Twin Cohort. Twin Res. 2002;5:358–365. doi: 10.1375/136905202320906093. [DOI] [PubMed] [Google Scholar]
- 13.Boomsma DI, Vink JM, van Beijsterveldt TC, de Geus EJ, Beem AL, Mulder EJ, et al. Netherlands Twin Register: a focus on longitudinal research. Twin Res. 2002;5:401–406. doi: 10.1375/136905202320906174. [DOI] [PubMed] [Google Scholar]
- 14.Pedersen NL, Lichtenstein P, Svedberg P. The Swedish Twin Registry in the third millennium. Twin Res. 2002;5:427–432. doi: 10.1375/136905202320906219. [DOI] [PubMed] [Google Scholar]
- 15.Spector TD, MacGregor AJ. The St. Thomas’ UK Adult Twin Registry. Twin Res. 2002;5:440–443. doi: 10.1375/136905202320906246. [DOI] [PubMed] [Google Scholar]
- 16.Sammalisto S, Hiekkalinna T, Suviolahti E, Sood K, Metzidis A, Pajukanta P, et al. A male-specific quantitative trait locus on 1p21 controlling human stature. J Med Genet. 2005;42:932–939. doi: 10.1136/jmg.2005.031278. [DOI] [PMC free article] [PubMed] [Google Scholar]
- 17.Abecasis GR, Cherny SS, Cookson WO, Cardon LR. GRR: graphical representation of relationship errors. Bioinformatics (Oxford, England) 2001;17:742–743. doi: 10.1093/bioinformatics/17.8.742. [DOI] [PubMed] [Google Scholar]
- 18.O’Connell JR, Weeks DE. PedCheck: a program for identification of genotype incompatibilities in linkage analysis. Am J Hum Genet. 1998;63:259–266. doi: 10.1086/301904. [DOI] [PMC free article] [PubMed] [Google Scholar]
- 19.Abecasis GR, Cherny SS, Cookson WO, Cardon LR. Merlin—rapid analysis of dense genetic maps using sparse gene flow trees. Nat Genet. 2002;30:97–101. doi: 10.1038/ng786. [DOI] [PubMed] [Google Scholar]
- 20.Hiekkalinna T, Terwilliger JD, Sammalisto S, Peltonen L, Perola M. AUTOGSCAN: powerful tools for automated genome-wide linkage and linkage disequilibrium analysis. Twin Res Hum Genet. 2005;8:16–21. doi: 10.1375/1832427053435382. [DOI] [PubMed] [Google Scholar]
- 21.Keith SW, Redden DT, Katzmarzyk PT, Boggiano MM, Hanlon EC, Benca RM, et al. Putative contributors to the secular increase in obesity: exploring the roads less traveled. Int J Obes (2005) 2006;30:1585–1594. doi: 10.1038/sj.ijo.0803326. [DOI] [PubMed] [Google Scholar]
- 22.Maes HH, Neale MC, Eaves LJ. Genetic and environmental factors in relative body weight and human adiposity. Behav Genet. 1997;27:325–351. doi: 10.1023/a:1025635913927. [DOI] [PubMed] [Google Scholar]
- 23.Schousboe K, Willemsen G, Kyvik KO, Mortensen J, Boomsma DI, Cornes BK, et al. Sex differences in heritability of BMI: a comparative study of results from twin studies in eight countries. Twin Res. 2003;6:409–421. doi: 10.1375/136905203770326411. [DOI] [PubMed] [Google Scholar]
- 24.Rankinen T, Zuberi A, Chagnon YC, Weisnagel SJ, Argyropoulos G, Walts B, et al. The human obesity gene map: the 2005 update. Obesity (Silver Spring, MD) 2006;14:529–644. doi: 10.1038/oby.2006.71. [DOI] [PubMed] [Google Scholar]
- 25.Hjelmborg JB, Fagnani C, Silventoinen K, McGue M, Korkeila M, Christensen K, et al. Genetic influences on growth traits of BMI: a longitudinal study of adult twins. Obesity (Silver Spring, MD) 2008;16:847–852. doi: 10.1038/oby.2007.135. [DOI] [PubMed] [Google Scholar]
- 26.Ortega-Alonso A, Sipila S, Kujala UM, Kaprio J, Rantanen T. Genetic influences on change in BMI from middle to old age: a 29-year follow-up study of twin sisters. Behav Genet. 2008;39:154–164. doi: 10.1007/s10519-008-9245-9. [DOI] [PubMed] [Google Scholar]
- 27.Francke S, Manraj M, Lacquemant C, Lecoeur C, Lepretre F, Passa P, et al. A genome-wide scan for coronary heart disease suggests in Indo-Mauritians a susceptibility locus on chromosome 16p13 and replicates linkage with the metabolic syndrome on 3q27. Hum Mol Genet. 2001;10:2751–2765. doi: 10.1093/hmg/10.24.2751. [DOI] [PubMed] [Google Scholar]
- 28.Kissebah AH, Sonnenberg GE, Myklebust J, Goldstein M, Broman K, James RG, et al. Quantitative trait loci on chromosomes 3 and 17 influence phenotypes of the metabolic syndrome. Proc Natl Acad Sci USA. 2000;97:14478–14483. doi: 10.1073/pnas.97.26.14478. [DOI] [PMC free article] [PubMed] [Google Scholar]
- 29.Luke A, Wu X, Zhu X, Kan D, Su Y, Cooper R. Linkage for BMI at 3q27 region confirmed in an African-American population. Diabetes. 2003;52:1284–1287. doi: 10.2337/diabetes.52.5.1284. [DOI] [PubMed] [Google Scholar]
- 30.Vionnet N, Hani EH, Dupont S, Gallina S, Francke S, Dotte S, et al. Genomewide search for type 2 diabetes-susceptibility genes in French whites: evidence for a novel susceptibility locus for early-onset diabetes on chromosome 3q27-qter and independent replication of a type 2-diabetes locus on chromosome 1q21-q24. Am J Hum Genet. 2000;67:1470–1480. doi: 10.1086/316887. [DOI] [PMC free article] [PubMed] [Google Scholar]
- 31.Walder K, Hanson RL, Kobes S, Knowler WC, Ravussin E. An autosomal genomic scan for loci linked to plasma leptin concentration in Pima Indians. Int J Obes Relat Metab Disord. 2000;24:559–565. doi: 10.1038/sj.ijo.0801197. [DOI] [PubMed] [Google Scholar]
- 32.Wu X, Cooper RS, Borecki I, Hanis C, Bray M, Lewis CE, et al. A combined analysis of genomewide linkage scans for body mass index from the National Heart, Lung, and Blood Institute Family Blood Pressure Program. Am J Hum Genet. 2002;70:1247–1256. doi: 10.1086/340362. [DOI] [PMC free article] [PubMed] [Google Scholar]
- 33.Sammalisto S, Hiekkalinna T, Schwander K, Kardia S, Weder AB, Rodriguez BL, et al. Genome-wide linkage screen for stature and body mass index in 3.032 families: evidence for sex- and population-specific genetic effects. Eur J Hum Genet. 2009;17:258–266. doi: 10.1038/ejhg.2008.152. [DOI] [PMC free article] [PubMed] [Google Scholar]
- 34.Feitosa MF, Borecki IB, Rich SS, Arnett DK, Sholinsky P, Myers RH, et al. Quantitative-trait loci influencing body-mass index reside on chromosomes 7 and 13: the National Heart, Lung, and Blood Institute Family Heart Study. Am J Hum Genet. 2002;70:72–82. doi: 10.1086/338144. [DOI] [PMC free article] [PubMed] [Google Scholar]
- 35.Hsueh WC, Mitchell BD, Schneider JL, St Jean PL, Pollin TI, Ehm MG, et al. Genome-wide scan of obesity in the Old Order Amish. J Clin Endocrinol Metab. 2001;86:1199–1205. doi: 10.1210/jcem.86.3.7358. [DOI] [PubMed] [Google Scholar]
- 36.Pérusse L, Rice T, Chagnon YC, Despres JP, Lemieux S, Roy S, et al. A genome-wide scan for abdominal fat assessed by computed tomography in the Quebec Family Study. Diabetes. 2001;50:614–621. doi: 10.2337/diabetes.50.3.614. [DOI] [PubMed] [Google Scholar]
- 37.Comuzzie AG, Hixson JE, Almasy L, Mitchell BD, Mahaney MC, Dyer TD, et al. A major quantitative trait locus determining serum leptin levels and fat mass is located on human chromosome 2. Nat Genet. 1997;15:273–276. doi: 10.1038/ng0397-273. [DOI] [PubMed] [Google Scholar]
- 38.Hager J, Dina C, Francke S, Dubois S, Houari M, Vatin V, et al. A genome-wide scan for human obesity genes reveals a major susceptibility locus on chromosome 10. Nat Genet. 1998;20:304–308. doi: 10.1038/3123. [DOI] [PubMed] [Google Scholar]
- 39.Mitchell BD, Cole SA, Comuzzie AG, Almasy L, Blangero J, MacCluer JW, et al. A quantitative trait locus influencing BMI maps to the region of the beta-3 adrenergic receptor. Diabetes. 1999;48:1863–1867. doi: 10.2337/diabetes.48.9.1863. [DOI] [PubMed] [Google Scholar]
- 40.Palmer LJ, Buxbaum SG, Larkin E, Patel SR, Elston RC, Tishler PV, et al. A whole-genome scan for obstructive sleep apnea and obesity. Am J Hum Genet. 2003;72:340–350. doi: 10.1086/346064. [DOI] [PMC free article] [PubMed] [Google Scholar]
- 41.Norman RA, Tataranni PA, Pratley R, Thompson DB, Hanson RL, Prochazka M, et al. Autosomal genomic scan for loci linked to obesity and energy metabolism in Pima Indians. Am J Hum Genet. 1998;62:659–668. doi: 10.1086/301758. [DOI] [PMC free article] [PubMed] [Google Scholar]
- 42.Dong C, Wang S, Li WD, Li D, Zhao H, Price RA. Interacting genetic loci on chromosomes 20 and 10 influence extreme human obesity. Am J Hum Genet. 2003;72:115–124. doi: 10.1086/345648. [DOI] [PMC free article] [PubMed] [Google Scholar]
- 43.Hunt SC, Abkevich V, Hensel CH, Gutin A, Neff CD, Russell DL, et al. Linkage of body mass index to chromosome 20 in Utah pedigrees. Hum Genet. 2001;109:279–285. doi: 10.1007/s004390100581. [DOI] [PubMed] [Google Scholar]
- 44.Lee JH, Reed DR, Li WD, Xu W, Joo EJ, Kilker RL, et al. Genome scan for human obesity and linkage to markers in 20q13. Am J Hum Genet. 1999;64:196–209. doi: 10.1086/302195. [DOI] [PMC free article] [PubMed] [Google Scholar]
- 45.Wu X, Luke A, Cooper RS, Zhu X, Kan D, Tayo BO, et al. A genome scan among Nigerians linking resting energy expenditure to chromosome 16. Obes Res. 2004;12:577–581. doi: 10.1038/oby.2004.66. [DOI] [PubMed] [Google Scholar]
- 46.Wilson SG, Adam G, Langdown M, Reneland R, Braun A, Andrew T, et al. Linkage and potential association of obesity-related phenotypes with two genes on chromosome 12q24 in a female dizygous twin cohort. Eur J Hum Genet. 2006;14:340–348. doi: 10.1038/sj.ejhg.5201551. [DOI] [PubMed] [Google Scholar]
- 47.Heijmans BT, Beem AL, Willemsen G, Posthuma D, Slagboom PE, Boomsma D. Further evidence for a QTL influencing body mass index on chromosome 7p from a genome-wide scan in Dutch families. Twin Res. 2004;7:192–196. doi: 10.1375/136905204323016177. [DOI] [PubMed] [Google Scholar]
- 48.Perola M, Ohman M, Hiekkalinna T, Leppavuori J, Pajukanta P, Wessman M, et al. Quantitative-trait-locus analysis of body-mass index and of stature, by combined analysis of genome scans of five Finnish study groups. Am J Hum Genet. 2001;69:117–123. doi: 10.1086/321286. [DOI] [PMC free article] [PubMed] [Google Scholar]
- 49.Cornes BK, Medland SE, Ferreira MA, Morley KI, Duffy DL, Heijmans BT, et al. Sex-limited genome-wide linkage scan for body mass index in an unselected sample of 933 Australian twin families. Twin Res Hum Genet. 2005;8:616–632. [PubMed] [Google Scholar]
- 50.Kring SI, Holst C, Zimmermann E, Jess T, Berentzen T, Toubro S, et al. FTO gene associated fatness in relation to body fat distribution and metabolic traits throughout a broad range of fatness. PLoS ONE. 2008;3:e2958. doi: 10.1371/journal.pone.0002958. [DOI] [PMC free article] [PubMed] [Google Scholar]
- 51.Bodmer W, Bonilla C. Common and rare variants in multifactorial susceptibility to common diseases. Nat Genet. 2008;40:695–701. doi: 10.1038/ng.f.136. [DOI] [PMC free article] [PubMed] [Google Scholar]
- 52.Farooqi IS, Keogh JM, Yeo GS, Lank EJ, Cheetham T, O’Rahilly S. Clinical spectrum of obesity and mutations in the melanocortin 4 receptor gene. N Engl J Med. 2003;348:1085–1095. doi: 10.1056/NEJMoa022050. [DOI] [PubMed] [Google Scholar]
- 53.Vaisse C, Clement K, Durand E, Hercberg S, Guy-Grand B, Froguel P. Melanocortin-4 receptor mutations are a frequent and heterogeneous cause of morbid obesity. J Clin Invest. 2000;106:253–262. doi: 10.1172/JCI9238. [DOI] [PMC free article] [PubMed] [Google Scholar]