

Abstract
The mechanisms by which androgens regulate fat mass are poorly understood. Although testosterone has been reported to increase lipolysis and inhibit lipid uptake, androgen effects on proliferation and differentiation of human mesenchymal stem cells (hMSCs) and preadipocytes have not been studied. Here, we investigated whether dihydrotestosterone (DHT) regulates proliferation, differentiation, or functional maturation of hMSCs and human preadipocytes from different fat depots. DHT (0–30 nM) dose-dependently inhibited lipid accumulation in adipocytes differentiated from hMSCs and downregu-lated expression of aP2, PPARγ, leptin, and C/EBPα. Bicalutamide attenuated DHT's inhibitory effects on adipogenic differentiation of hMSCs. Adipocytes differentiated in presence of DHT accumulated smaller oil droplets suggesting reduced extent of maturation. DHT decreased the incorporation of labeled fatty acid into triglyceride, and downregulated acetyl CoA carboxylase and DGAT2 expression in adipocytes derived from hMSCs. DHT also inhibited lipid accumulation and downregulated aP2 and C/EBPα in human subcutaneous, mesenteric and omental preadipocytes. DHT stimulated forskolin-stimulated lipolysis in subcutaneous and mesenteric preadipocytes and inhibited incorporation of fatty acid into triglyceride in adipocytes differentiated from preadipocytes from all fat depots.
Conclusions
DHT inhibits adipogenic differentiation of hMSCs and human preadipocytes through an AR-mediated pathway, but it does not affect the proliferation of either hMSCs or preadipocytes. Androgen effects on fat mass represent the combined effect of decreased differentiation of fat cell precursors, increased lipolysis, and reduced lipid accumulation.
Keywords: Androgen, hMSC, Preadipocyte, Differentiation, Proliferation, Testosterone
1. Introduction
Adipose tissue mass and distribution are important contributors to the pathophysiology of insulin resistance, atherosclerosis, diabetes mellitus and metabolic syndrome (Despres et al., 1992; Smith et al., 2001). There is now sizeable evidence suggesting an important role of sex steroid hormones in regulating the localization of fat accumulation (Cartwright et al., 2007; Bjorntorp, 1996). In epidemiological surveys, serum testosterone levels are inversely associated with whole body and regional fat mass (Seidell et al., 1990; Khaw and Barrett-Connor, 1992; Derby et al., 2006; Haffner et al., 1993). However, the effects of testosterone administration on fat mass and distribution in men have been inconsistent across trials (Snyder et al., 2000; Wang et al., 2000; Katznelson et al., 1996); although many trials in middle-aged and older men have reported a reduction in whole body fat mass during testosterone administration (Isidori et al., 2005; Bhasin et al., 2006a,b), very few studies have found preferential reduction in visceral fat mass (Page et al., 2004; Snyder et al., 1999; Marin et al., 1992a,b; Woodhouse et al., 2004; Bhasin et al., 2007). Similarly, the results of the few studies that have examined the effects of androgen administration in animal models have been conflicting (Moverare-Skrtic et al., 2006; McInnes et al., 2006; Nantermet et al., 2008), possibly because of differences in the gender, species, and strain of the animals, and the type of androgen (aromatizable vs. non-aromatizable) used.
The mechanisms by which testosterone regulates fat mass are also poorly understood. Development and distribution of white adipose tissue in different anatomical regions is a complex process which depends not only on the ability of mature adipocytes to alter storage capacity, but also on the change in the number of adipocytes as a result of proliferation and differentiation of adipogenic precursor cells into mature adipocytes (Ginsberg-Fellner, 1981; Gurr et al., 1982; Auwerx et al., 1996; Gregoire, 2001; Rangwala and Lazar, 2000; Sjostrom et al., 1972). Recently, it has become apparent that in addition to the preadipocytes that are resident in fat tissue, the differentiation of mesenchymal progenitors also contributes to the accumulation of fat in adipose and non-adipose tissues (Cartwright et al., 2007; Auwerx et al., 1996). Human preadipocytes from different fat depots exhibit differences in their metabolic and gene expression profiles (Dieudonne et al., 2000; Anderson et al., 2001; Tchkonia et al., 2002, 2005, 2006, 2007). Marin et al. have reported that different fat depots differ in their responsiveness to testosterone (Marin et al., 1992a,b, 1996). Testosterone and dihydrotestosterone (DHT) have been shown to inhibit adipogenic differentiation of 3T3 and C3H10T1/2 cell lines (Singh et al., 2003, 2006); however, the ability of androgens to regulate fat accumulation and distribution through their effects on differentiation and proliferation of human mesenchymal stem cells (hMSCs) and human preadipocytes has not been studied. We hypothesized that DHT, a non-aromatizable androgen, decreases fat mass by regulating the differentiation of adipocyte progenitors, preadipocytes and hMSCs. In addition, since fat accumulation depends on the functional capacity of adipocytes, we determined the effects of dihydrotestosterone on lipolysis and fatty acid incorporation into triglyceride in adipocytes differentiated from hMSCs and preadipocytes.
Testosterone is converted into 17-beta estradiol by CYP19. Because the effects of estradiol and androgen on adipogenic differentiation might differ (Moverare-Skrtic et al., 2006; McInnes et al., 2006), we used dihydrotestosterone (DHT), a non-aromatizable androgen in these studies. To prevent confounding due to gender differences in response to androgens, we only used hMSCs and preadipocytes derived from men.
2. Materials and methods
2.1. Human mesenchymal stem cells cultures and differentiation
hMSCs from male donors, 25–36 years old, were obtained from Cambrex Bio-Science Co. (Walkersville, USA) and cultivated in supplemented mesenchymal stem cell growth medium (MSCGM) until the cells reached confluence (Guo et al., 2008). Two days post-confluence, cells were differentiated (DM), as described (Guo et al., 2008). Briefly, the cells were incubated in adipogenesis-inducing medium (AIM) (DMEM, 4.5 g/L glucose, 1 μM dexamethasone, 0.2 mM indomethacin, 1.7 μM insulin, 0.5 mM 3-isobutyl-1-methylxanthine, 10% FBS, 0.05 U/mL penicillin and 0.05 μg/mL strepomycin) for 3 days, followed by incubation in adipogenic maintenance medium (AMM) (DMEM, 4.5 g/L glucose, 1.7 μM insulin, 10% FBS, 0.05 U/mL penicillin and 0.05 μg/mL strepotomycin). hMSCs differentiated to form adipocytes in the absence of DHT were used as control.
2.2. Preadipocyte isolation and cultures
Human preadipocytes from abdominal subcutaneous, omental, and mesenchymal fat depots were obtained from the Adipocyte Core of Boston Obesity and Nutrition Research Center and differentiated as described (Tchkonia et al., 2002, 2006, 2007; Caserta et al., 2001). All subjects had fasted at least 10 h. Average age of subjects (n = 4) was 44 ± 3.5 years and mean body mass index 69 ± 9.2 kg/m2. We excluded men who had any malignancy or who were taking thiazolidinediones, glucocorticoids, or androgens. Fat tissue was minced and digested at 37 °C in Hank's balanced salt solution (HBSS) containing 1 mg/mL collagenase. Digests were filtered, centrifuged at 800 × g for 10 min, and treated with an erythrocyte lysis buffer. The cells were plated using a low-serum plating medium [1:1 Dulbecco's modified Eagle's medium (DMEM)-Ham's F-12 containing 0.5% bovine serum albumin and antibiotics]. After 12 h, the adherent preadipocytes were washed, trypsinized, and replated at a density of 4 × 10⁴ cells/cm2 in plating medium. Linearity of recovery and purity of preadipocyte preparations have been described (Tchkonia et al., 2005). Plating medium was changed every 2 days until confluence. Preadipocytes were differentiated using standard protocols, as described (Guo et al., 2008).
2.3. Quantitative assessment of lipid accumulation
Lipid accumulation was estimated in living cells by phase contrast microscopy and fixed cells by oil red O staining (Guo et al., 2008). For oil red O staining, cells were fixed in 10% formalin, stained with 0.5% oil red O in 60% isopropanol (Sigma Chemical Co., Saint Louis, MO) for 10 min. Additionally, lipid content was quantified using AdipoRed assay (Cambrex BioScience, Walkersville, MD) (Guo et al., 2008). Briefly, cells were differentiated in the presence of 0–30 nM DHT for 2–3 weeks, washed with PBS (pH 7.4), and 5 μL AdipoRed reagent was added to each well. After 10 min, fluorescence was measured at excitation wavelength of 485 nm and emission wavelength of 572 nm. The AdipoRed assay has an intra-assay CV of ±8%.
The proportion of living cells at different stages of lipid accumulation was estimated by using phase contrast microscopy (Guo et al., 2008; Wang et al., 1989; Karagiannides et al., 2006). Cells were staged as follows; stage I: elongated fibroblast-like cells without microscopically detectable lipid droplets; II: flattened cells without detectable lipid droplets; III: multiple small lipid droplets (<6 per cell) visible only under high magnification (250×); IV: multiple lipid droplets (>6 per cell) visible under lower magnification (100×); V: few (3–6 per cell) large coalescent lipid droplets that are readily detectable at low magnification (40×); VI: single or two very large lipid droplet(s) that occupy the majority space in the cytosol. This approach gives results that correlate well with triglyceride content determined biochemically and with glycerol-3-phosphate dehydrogenase activity (Wang et al., 1989; Karagiannides et al., 2006).
2.4. Western blot analysis of marker proteins
Cell lysates (50–100 μg) were electrophoresed on 4–15% gradient gels (34) and expression of androgen receptor (AR), C/EBP-α, PPAR-γ, proliferating cell nuclear antigen (PCNA), aP2, and β-tubulin were analyzed by western blotting using anti-AR (Cell Signaling, Danvers, MA), anti C/EBP-α, anti-PPAR-γ, anti-PCNA, anti-β-tubulin (Santa Cruz Biotechnology, CA), and anti-aP2 (Biovision, CA) antibodies, respectively, as described previously (Singh et al., 2003, 2006; Guo et al., 2008).
2.5. Quantitative mRNA expression
Total RNA was extracted using SV Total RNA isolation system (Promega, WI). 500 ng total RNA was reverse transcribed using Superscript II (Invitrogen). All real-time qPCR measurements were performed on an ABI7500 PCR system (Applied Biosystems) using standard temperature cycling protocol (Singh et al., 2003, 2006; Guo et al., 2008). Each measurement was run in triplicate with at least three independent samples. Human aP2, C/EBPα, ACC-1alpha probes (Taqman) were purchased from Applied Biosystems (Branchburg, NJ) and mRNA expression was detected using Taqman Universal master mix. Primers for diacylglycerol acyl transferase 2 (DGAT2) were designed using a web-based software (www.Roche.com) and custom synthesized (Invitrogen, San Diego, CA). mRNA was quantified using SYBR green detection system from Applied Biosystems (Branchburg, NJ). The relative expression of target genes was measured using the comparative critical threshold (Ct) method, and the amount of target gene was normalized to the endogenous control gene (18S ribosomal RNA or HPRT). The results were then normalized to DM control.
2.6. MTT growth assay and cell cycle analysis
MTT growth assay is a colorimetric assay based upon the reduction of tetrazolium salt, MTT [3-(4, 5-dimethylthiazol-2-yl)-2,5-diphenyltetrazolium bromide] to formazan, and has an intra-assay CV of ±14%. Cell suspensions (2000 cells/well) were plated in growth medium alone or medium containing DHT for 3–7 days. After 4-h incubation in 30 μl MTT (5 mg/mL in PBS) at 37 °C, formazan was dissolved in 150 μl dimethylsulfoxide and absorbance was measured at 550 nm with reference wave length of 630 nm.
For cell cycle analyses, adherent cells were detached with PBS/EDTA, fixed in 95% ethanol, and treated with propidium iodide (10 μg/mL) and ribonuclease A (0.25 mg/mL). The distribution of cells in different phases of cell cycle was analyzed by fluorescence-activated cell sorting (FACS) on a Becton Dickinson Flow Cytometer (Mosmann, 1983).
2.7. Immunocytochemical analysis
Cells were fixed in 70% alcohol at 4 °C for 20 min, and cell proliferation was measured by PCNA staining using biotinylated anti-PCNA monoclonal antibody (clone PC10), streptavidin-peroxidase, and diaminobenzidine (Zymed, CA). Slides were counterstained with hematoxylin.
2.8. Incorporation of BODIPY-labeled free fatty acid into triglyceride
The incorporation of BODIPY-labeled fluorescent free fatty acid into intracellular lipids was measured by using the QBT assay which is based upon emission of bright green light once the BODIPY-labeled fatty acid is taken up into the cell; the emission from the extracellular fatty acid is suppressed by using a quencher. This assay has an intra-assay CV of ±12%. hMSCs differentiated in the presence of 0–30 nM DHT were incubated with serum free medium for 1 h followed by incubation with BODIPY-dodecanoic acid fluorescent fatty acid (QBT assay reagent, Molecular Devices, Sunnyvale, CA) for 2 h. The amount of BODIPY incorporated into triglyceride was quantified at emission wavelength of 510 nm and excitation wavelength of 480 nm on Tecan Safire plate reader (Tecan, Austria).
2.9. Lipolysis
hMSCs and preadipocytes were differentiated in the absence or presence of DHT. After 3 weeks, cells were washed and incubated with KRB in the presence and absence of 1 μM forskolin for 3 h. Glycerol concentration in the medium was measured as an index of lipolysis by using a glycerol detection kit (Sigma–Aldrich, USA).
2.10. Effects of testosterone supplementation on whole body and regional fat mass in orchidectomized mice
Twenty-week old, male C57BL/6 mice (Jackson Laboratory, Bar Harbor, Maine) housed in AAALAC-approved facility with 12 h light and dark cycles were given free access to water and standard rodent chow. Bilateral orchidectomy was performed under ketamine-xylazine anesthesia (Carey et al., 2004). Mice were randomly assigned to receive for 2 weeks either empty silastic implant (orchidectomized, n = 6) or 1 cm silastic implant containing testosterone (orchidectomized-T, n = 5). After 2 weeks of treatment, body composition was assessed by NMR and fat distribution by weighing of individual fat depots. The mice were euthanized and regional fat depots were excised and weighed. For histomorphometric studies, fat tissues were fixed in 4% phosphate buffered formalin, embedded in paraffin, and 5 μm thick sections were stained with hematoxylin and eosin by the Dana Farber Rodent Histopathology Core Laboratory. All slides were reviewed by the Core Pathologist. The cell size distribution was measured using Metamorph Imaging software (Molecular Devices, Toronto, Canada).
Body composition (total lean and fat mass, and percent fat mass) was assessed by placing unanesthetized animals in a restraining tube into the nuclear magnetic resonance (NMR) machine (EchoMRI, EchoMedical Systems, Houston, TX). The NMR spectra were analyzed by quantifying the integrated area under the curve for lipid and water peaks, and taking the body weight into account (Taicher et al., 2003; Tinsley et al., 2004). Body composition assessment by NMR has been shown previously to have excellent precision (CVs less than 1%) and correlate very well with chemical estimates of body composition (Taicher et al., 2003; Tinsley et al., 2004). NMR has also been shown to track changes in lean and fat mass accurately (Taicher et al., 2003; Tinsley et al., 2004).
2.11. Statistical analyses
Data are shown as mean ± S.E.M. The data were analyzed by using an ANOVA model (for multiple groups) or Students' t-test (for two independent samples). If ANOVA revealed an overall effect, then inter-group differences were analyzed by using the Newman–Keuls test. Statistical significance was set a priori at 0.05.
3. Results
3.1. Testosterone supplementation in orchidectomized mice decreases fat mass, especially in the epididymal fat depot
We evaluated the effect of testosterone supplementation on body composition in adult, orchidectomized mice, using NMR and by weighing individual fat depots. As expected, testosterone-replaced orchidectomized mice had significantly higher levator ani weight (112.7 ± 3.4 mg) in comparison to orchidectomized controls (50.5 ± 2.5 mg, P < 0.01). Testosterone-treated orchidectomized mice had significantly lower whole body fat mass than control orchidectomized mice (Fig. 1A). Testosterone treatment had a greater effect on epididymal fat pad than on subcutaneous or perirenal fat pads (Fig. 1B).
Fig. 1.

Effects of testosterone administration on whole body and regional fat mass in adult, orchidectomized mice. (A) Effect of testosterone treatment on percent body fat in adult, orchidectomized mice. C57BL/6 mice were orchidectomized and assigned to one of two groups. Group A: orchidectomized (n = 6); group B: orchidectomized-T, treated with silastic implants containing testosterone (n = 5). Treatment duration was 2 weeks. Fat mass was determined using NMR. *P vs. orchidectomized controls <0.05. (B) Subcutaneous, perirenal, and epididymal fat depot weights in orchidectomized controls (clear bars) and testosterone-treated (shaded bars) orchidectomized mice. The magnitude of difference between the controls and testosterone-treated orchidectomized mice was greater in epididymal fat than in subcutaneous (SC) and perirenal fat. SC, subcutaneous; *P vs. orchidectomized controls <0.05.
3.2. DHT inhibits differentiation of hMSCs into mature adipocytes
To determine the effects of DHT on hMSC differentiation, hMSCs were differentiated into adipocytes in a differentiation medium containing 0–30 nM DHT. DHT dose-dependently diminished total lipid accumulation assessed by oil red O staining (Fig. 2A) or by monitoring adipored fluorescence (Fig. 2B). DHT-treated cultures had a higher fraction of cells at a lower stage of differentiation containing smaller lipid droplets (stage III, P = 0.03 vs medium control) and a lower fraction of cells at higher stages of differentiation (stage IV and V, P < 0.05 for comparison of percent of cells in stage V in 30 nM DHT vs. medium control) than cells treated with medium alone (Fig. 2C).
Fig. 2.
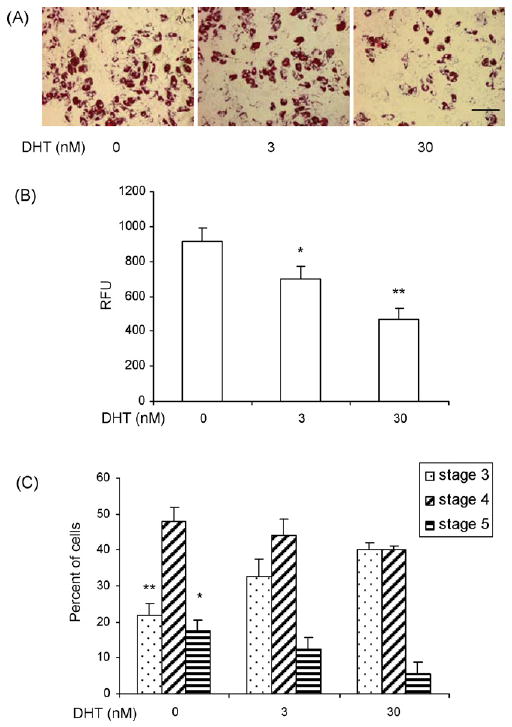
DHT inhibits lipid accumulation in adipocytes differentiated from hMSCs. (A) DHT inhibits lipid accumulation in adipocytes differentiated from hMSCs as assessed by oil red O staining. hMSCs were cultured in differentiation medium (DM) with or without DHT (0–30 nM). The cells were fixed in 2% paraformaldehyde and stained with 0.5% oil red O. Representative photomicrographs of hMSCs differentiated into adipocytes in the presence of 0–30 nM DHT are shown. Bar = 100 μm. (B) For quantitative assessment of inhibition of lipid accumulation by DHT, hMSCs were cultured in DM in the presence of 0–30 nM DHT and intracellular triglyceride content was measured quantitatively using AdipoRed assay (Cambrex). Data are mean ± S.E.M. of n = 8. *P vs. control <0.05; **P vs. control <0.01; RFU, relative fluorescence units. (C) DHT shifts the spectrum of adipogenic cells towards lipid-poor adipogenic cells. hMSCs were differentiated in the presence of 0–30 nM DHT for 3 weeks and stage of lipid accumulation was estimated in individual cells by phase contrast microscopy in five fields per treatment (see Section 2).
In comparison to hMSCs maintained in basal medium, cells treated with differentiation medium had higher mRNA expression levels of adipogenic differentiation markers, aP2, leptin, and PPARγ (Fig. 3A). DHT (0–30 nM) downregulated the expression of aP2, leptin, and PPARγ mRNAs in a dose-dependent manner (Fig. 3A). Western blot analysis of protein extracts of hMSCs differentiated in the presence of DHT revealed downregulation of C/EBPα, PPARγ, and aP2 proteins (Fig. 3B).
Fig. 3.
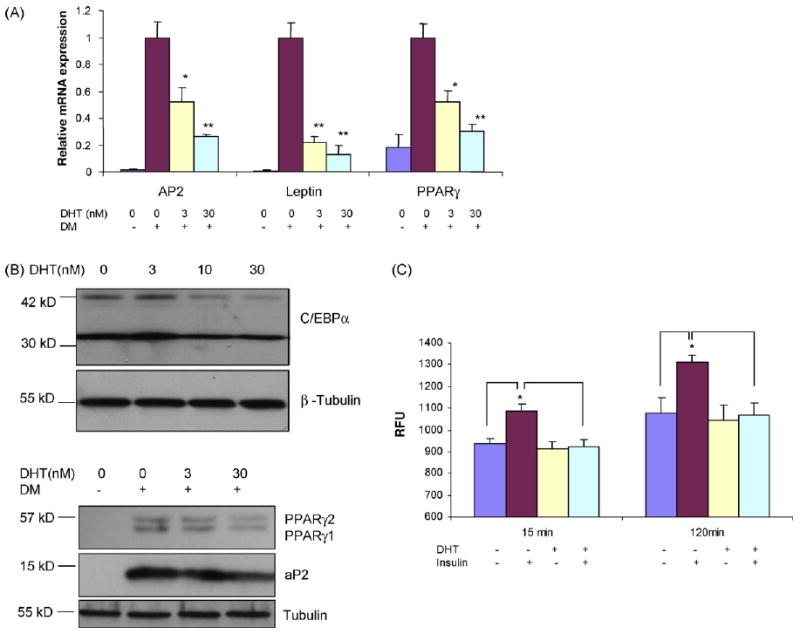
DHT downregulates expression of adipogenic differentiation markers in hMSCs. (A) DHT downregulates the mRNA expression of aP2, leptin and PPARγ. hMSCs were cultured in differentiation medium (DM) in the presence of 0–30 nM DHT. Relative mRNA expression of adipogenic markers was assessed by RT and quantitative PCR using S18 as an internal control. *P vs. control <0.05; **P vs. control <0.01. (B) DHT decreases the protein expression of adipogenic differentiation markers in hMSCs. hMSCs' were differentiated in the presence of 0–30 nM DHT. Total protein was extracted and analyzed by western blot analysis using anti C/EBP-(antibody (upper panel), PPARγ and aP2 (lower panel). β-Tubulin served as loading control. (C) DHT inhibits insulin-stimulated incorporation of BODIPY-labeled fatty acid into triglycerides in adiopcytes derived from hMSCs. hMSCs were differentiated in the presence of 0–30 nM DHT. The cells were then incubated with BODIPY-labeled fatty acid in the absence and presence of 0.3 μM insulin. The incorporation of labeled fatty acid was measured for 2 h. Data are mean ± S.E.M. (n = 5). *P vs. cells treated with insulin <0.05; RFU, relative fluorescence units.
The cells differentiated in presence of DHT had significantly lower rate of insulin-stimulated lipid synthesis, assessed by the incorporation of a BODIPY-labeled fatty acid into triglycerides (Fig. 3C). In association with reduced lipid synthesis, DHT down-regulated the expression of diacylglycerol acyltransferase (DGAT2) (measured by real-time quantitative PCR), a key enzyme in triglyceride synthesis and acetyl co-A carboxylase (ACCalpha) (not shown). Neither basal nor forskolin-induced glycerol release was significantly different in hMSCs differentiated in the absence and presence of DHT (not shown).
3.3. DHT effects on adipogenesis are exercised through an AR-mediated pathway
hMSCs maintained in basal medium had low levels of AR protein expression (Fig. 4A). DHT upregulated AR protein expression in hMSCs under adipogenic differentiation conditions. To determine whether the inhibitory effects of DHT on adipogenic differentiation are mediated through AR-dependent signaling, hMSCs were differentiated in the presence of 30 nM DHT with or without 10-fold molar excess of an AR antagonist, bicalutamide. As expected, the wells treated with DHT had fewer oil red O-stained cells than control wells (Fig. 4B). This inhibitory effect of DHT on lipid accumulation was blocked by co-incubation with bicalutamide. DHT-induced down regulation of adipogenic marker, aP2, also was blocked by bicalutamide (Fig. 4C).
Fig. 4.
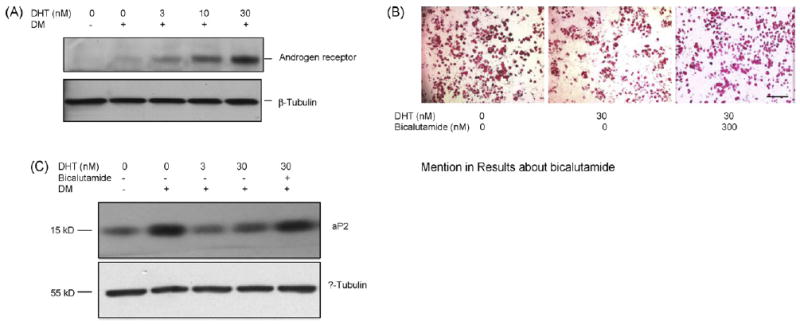
DHT-mediated inhibition of adipogenesis in hMSCs is blocked by AR antagonist, bicalutamide. (A) Effect of DHT on AR protein expression. hMSCs were treated with 0–30 nM DHT under adipogenic differentiation conditions. AR protein expression was assessed by Western blot analysis using anti-AR antibody. The blot was reprobed for β-tubulin to monitor protein loading. (B) Bicalutamide, an AR antagonist, reduces DHT-mediated inhibition of lipid accumulation in adipocytes differentiated from hMSCs. Representative photomicrographs of hMSCs differentiated into adipocytes in the presence of 30 nM DHT or 30 nM DHT ± 300 nM bicalutamide are shown. The cells were fixed in 2% paraformaldehyde and stained with 0.5% oil red O. Bar = 500 μm. (C) Bicalutamide abrogates DHT-mediated downregulation of aP2 protein expression in differentiating hMSCs. hMSCs were differentiated in the presence of 0–30 nM DHT with or without 300 nM bicalutamide, as shown. Expression of aP2 was detected by western blot analysis using anti-aP2 antibody. The membrane was stripped and reprobed with anti-β tubulin antibody.
3.4. DHT does not affect the growth of hMSCs
To determine the effects of DHT on hMSC growth, hMSCs maintained in growth conditions were treated with 0–30 nM DHT for 3–6 days and conversion of yellow MTT to purple formazan was measured at the end of treatment. As shown in Fig. 5A, DHT had no significant effect on the growth of hMSCs as assessed by formazan formation. DHT treatment did not significantly affect the distribution of cells in different phases of cell cycle (not shown). Also, DHT had no substantial effect on PCNA protein, as assessed by western blot analysis (Fig. 5B) and immunohistochemical staining (Fig. 5C). Consistent with the cell cycle data, DHT did not affect the expression of p21, E2F1 and Rb proteins (not shown), which regulate G1 to S phase transition. Collectively, these data demonstrate that DHT does not affect hMSCs proliferation.
Fig. 5.

DHT does not significantly affect the proliferation of human mesenchymal stem cells. (A) DHT does not effect hMSC growth as assessed by MTT growth assay. hMSCs in 96-well plates were treated with 0–30 nM DHT and cell growth was determined after 3 days by the MTT assay. Data are mean ± S.E.M., n = 8. (B) DHT does not affect PCNA protein expression in hMSC. hMSC were cultured in the presence of 0–30 nM DHT. After 48 or 72 h of treatment, total protein was extracted and separated on 4–15% gel followed by western analysis using an anti-PCNA antibody. β-Tubulin served as loading control. (C) hMSC were cultured for 48 h in the presence of 0–30 nM DHT in chamber slides after which cells were immunostained for PCNA and counterstained with hematoxylin. Bar = 100 μm.
3.5. DHT inhibits differentiation of human preadipocytes into mature adipocytes
Preadipocytes obtained from the abdominal subcutaneous, mesenteric and omental regions of men expressed low levels of AR protein under basal conditions; DHT upregulated AR expression in a dose dependent manner in all depots (Fig. 6A).
Fig. 6.
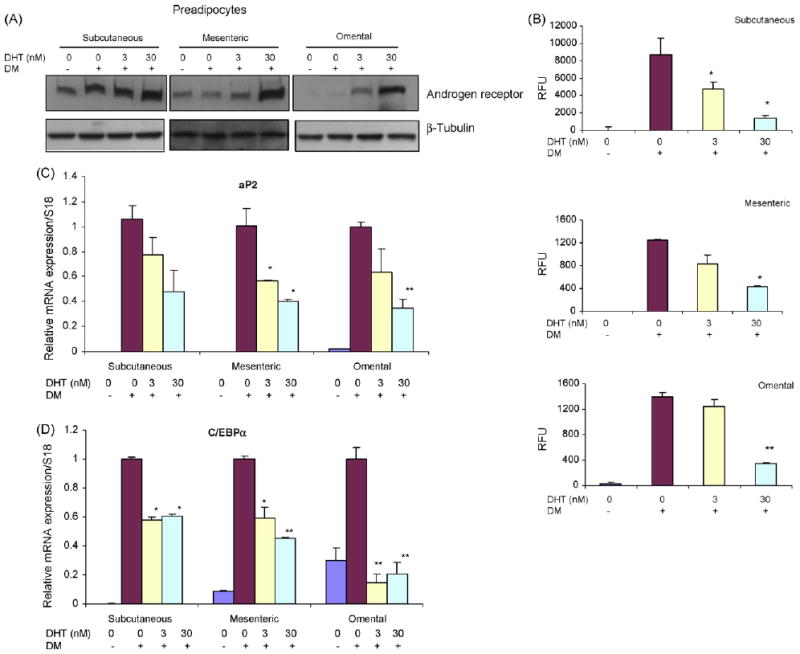
DHT inhibits adipogenic differentiation of human preadipocytes derived from subcutaneous, mesenteric, and omental fat depots. (A) DHT upregulates the expression of AR protein in differentiating preadiopocytes. Preadipocytes were treated with 0–30 nM DHT under differentiating conditions. AR protein expression was assessed by western blot analysis using anti-AR antibody. β-Tubulin serves as protein loading control. (B) DHT inhibits lipid accumulation as assessed by monitoring adipored fluorescence in differentiated human preadipocytes. Following differentiation of preadipocytes derived from subcutaneous (upper panel), mesenteric (middle panel), or omental (lower panel) depot in the presence of 0–30 nM DHT, intracellular triglyceride content was measured by using AdipoRed assay. Data are mean ± S.E.M., n = 6. *P vs. DM control <0.05; **P vs. DM control <0.01. DM, differentiation medium; RFU, relative fluorescence units. (C) DHT downregulates expression of adipogenic differentiation markers. Human preadipocytes derived from subcutaneous, mesenteric, or omental depots were differentiated in the presence of 0–30 nM DHT for 2 weeks. Values are mean mRNA expression levels of adipogenic markers, aP2 (upper panel) and C/EBPα (lower panel) as assessed by RT and real-time PCR using 18S rRNA as an internal control; *P vs. DM control <0.05; **P vs. DM control <0.01.
DHT inhibited lipid accumulation, assessed by monitoring adipored fluorescence, in adipocytes differentiated from preadipocytes from all three depots—subcutaneous, mesenteric, and omental (Fig. 6B). DHT downregulated the expression of adipogenic markers, aP2 and C/EBPα, in a dose-dependent manner in all three depots (Fig. 6D).
DHT had no significant effect on the growth of preadipocytes, as assessed by MTT growth assay, cell cycle analysis, and PCNA expression (not shown).
3.6. DHT modulates lipolysis and fatty acid incorporation into triglyceride in adipocytes differentiated from preadipocytes
Preadipocytes derived from subcutaneous, mesenteric and omental fat depots were differentiated in the presence of 0–30 nM DHT and glycerol release was measured as a marker of lipolysis. Although DHT had no substantial effect on basal lipolysis in any depot, it significantly increased forskolin-induced lipolysis in subcutaneous and mesenteric preadipocytes. The omental preadipocytes differentiated very slowly, as reported previously (Singh et al., 2003), and exhibited little or no lipolytic response to DHT (Fig. 7A). Dihydrotestosterone (0–30 nM) decreased the incorporation of labeled-fatty acid into adipocytes differentiated from preadipocytes in all three depots (Fig. 7B). Consistent with its effect on fatty acid incorporation into triglyceride, DHT downregulated the expression of DGAT2 and ACCalpha (Fig. 7C).
Fig. 7.
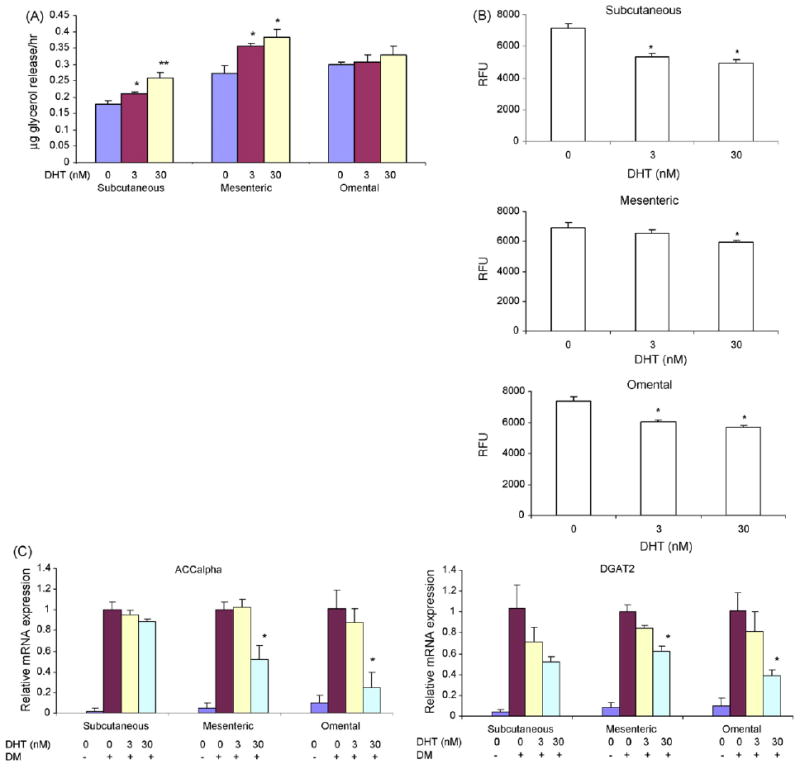
Effects of DHT on lipolysis and fatty acid incorporation into triglycerides in adipocytes differentiated from subcutaneous and mesenteric, and omental preadipocytes. (A) Preadipocytes from subcutaneous (upper panel), mesenteric (middle panel) and omental (lower panel) depots were differentiated in the presence of 0–30 nM DHT. At the end of 2 weeks of differentiation, glycerol release after induction by forskolin was measured in the medium. FSK, forskolin. Data are mean ± S.E.M., n = 4; *P vs. control <0.05; **P vs. control <0.01. (B) DHT inhibits incorporation of BODIPY-labeled fatty acid into triglycerides in adiopcytes derived from hMSCs. hMSCs were differentiated in the presence of 0–30 nM DHT. The cells were then incubated with BODIPY-labeled fatty acid. The incorporation of labeled fatty acid was measured for 2 h. Data are mean ± S.E.M. (n = 5). *P vs. cells treated with insulin <0.05; RFU, relative fluorescence units. (C) DHT downregulates the expression of ACCalpha and DGAT2 mRNA, assessed by qRT-PCR assay, in adipocytes differentiated from human subcutaneous, mesenteric, and omental preadipocytes. Values are mean mRNA expression levels/group as assessed by RT and real-time PCR using HPRT as an internal control; *P vs. medium control <0.05.
4. Discussion
In a comprehensive investigation of the effects of androgens on the proliferation, differentiation, and function of hMSCs and human preadipocytes, we found that DHT inhibits the differentiation of hMSCs into adipocytes as well as the differentiation of preadipocytes from all three depots into mature adipocytes. The net effect is a reduced number of fully differentiated adipocytes. Adipocytes differentiated from hMSCs in the presence of DHT are smaller and accumulate less lipid. A greater fraction of DHT-treated cells are in earlier stages of maturation than control cells. However, DHT did not affect the proliferation of either hMSCs or preadipcoytes from any depot. DHT also inhibited incorporation of fatty acid into triglyceride. The stimulation of lipolysis in adipocytes differentiated from hMSCs and preadipocytes by DHT was depot specific. Thus, our data suggest that the effects of DHT on fat mass represent the net of its effects on adipogenic differentiation and lipid metabolism in hMSCs as well as preadipocytes.
Using several complementary methods, including cell cycle analysis, MTT assay, and PCNA staining, we did not find substantial effects of DHT on hMSC or preadipocyte proliferation. Previous reports have also suggested that estrogen, but not non-aromatizable androgen, DHT, modulates the proliferation of preadipocytes (Dieudonne et al., 2000; Anderson et al., 2001).
Marin et al. (1992a,b, 1996) reported that testosterone administration to middle-aged men with abdominal obesity was associated with a significant reduction in visceral fat mass. Similar data showing inhibition of fat mass by DHT administration have been reported in monkeys (Nantermet et al., 2008). Some studies (Moverare-Skrtic et al., 2006; McInnes et al., 2006), including one in aromatase null, ovariectomized mice (McInnes et al., 2006), have reported conflicting data on the effects of androgen administration on fat mass. Some of these discrepancies in the effects of androgen on fat mass among studies may reflect gender differences in response to androgens (Liao et al., 2005). Using NMR and magnetic resonance imaging, we have shown that androgen administration reduces whole body fat mass in adult, male orchidectomized mice. The inhibition of fat mass by testosterone supplementation is depot specific. The epididymal fat mass in mice is substantially more responsive to androgen administration than subcutaneous or perirenal fat. Taken together, these data are consistent with the hypothesis that androgens regulate fat mass in a depot-specific manner.
We show here that in contrast to human preadipocytes derived from subcutaneous and mesenteric fat depots, omental preadipocytes differentiate very slowly and display little or no lipolytic response to DHT. It is possible that differences in the expression or sensitivity of hormone-sensitive lipase and beta(2)-adrenoceptors in different fat depots account for the observed differences in lipolytic response to DHT among fat depots (Jasuja et al., 2005; Taicher et al., 2003; Tinsley et al., 2004; Ding et al., 2006; Arner, 2005). However, it is possible that the reduced lipolytic response of DHT-treated omental preadipocytes is the result of DHT-induced inhibition of adipogenic differentiation rather than a direct effect of DHT on lipolysis.
Our data show significant inhibition by DHT of insulin-stimulated triglyceride synthesis in adipocytes differentiated from hMSCs. Consistent with this finding, DHT also downregulated the expression of ACC alpha and DGAT2, key enzymes involved in triacylglycerol synthesis. Similar downregulation of DGAT2 was observed in microarray analysis of tissues from DHT-treated female monkeys (Nantermet et al., 2008). The mechanisms by which DHT blocks insulin-mediated stimulation of lipid synthesis need further investigation.
We used human preadipcoytes and human mesenchymal stem cells, which render these data more relevant to human physiology than previous data generated in murine cell lines. However, we recognize that no in vitro model can replicate the complexity of the whole organism. The composition of the culture medium and the conditions under which the cells are isolated can affect the responsiveness of the cell systems. The genetic differences among individuals from whom the cells were derived can affect their responsiveness. In particular, the preadipocytes were derived from fat tissue obtained from obese individuals; obese and non-obese individuals might differ significantly in their genetic background. The DHT concentrations used in these in vitro experiments (0–30 nM) ranged from physiologic to slightly supra-physiologic. Similarly, testosterone doses used in orchidectomized mice restored levator ani mass, and have been shown previously to raise serum testosterone concentrations into the high normal range for male mice (Page et al., 2004).
Testosterone supplementation in vivo increases skeletal muscle mass. It is possible that increased muscularity might affect fat mass and metabolism through increased secretion of myokines (Giudicelli et al., 1993).
Our data show that the inhibitory effects of DHT on adipogenic differentiation of hMSCs are mediated through an AR-mediated pathway. hMSCs express AR protein and bicalutamide, an AR antagonist, blocks the inhibitory effects of DHT on adipogenic differentiation. We cannot exclude the possibility that DHT might exert additional effects through non-genomic pathways or through non-AR-mediated signaling mechanisms. There is some evidence that DHT and its metabolite 5α-androstan-3β, 17β-diol can exert some effects by acting through estrogen receptor β (Monjo et al., 2003); we did not examine this pathway. The data presented in this manuscript demonstrate collectively that androgens regulate fat mass and distribution by their combined effects on adipogenic differentiation of MSCs as well as preadipocytes, and lipolysis and lipogenesis; the precise molecular mechanisms that mediate the inhibitory effects of DHT at each stage need further investigation.
Acknowledgments
Grant support: This research was supported by NIH grants U54HD41748, DK70534, DK49296, AG14369, DK56891 (JLK), and DK59261 (WG).
References
- Anderson LA, McTernan PG, Barnett AH, Kumar S. The effects of androgens and estrogens on preadipocyte proliferation in human adipose tissue: influence of gender and site. J Clin Endocrinol Metab. 2001;86:5045–5051. doi: 10.1210/jcem.86.10.7955. [DOI] [PubMed] [Google Scholar]
- Arner P. Effects of testosterone on fat cell lipolysis. Species differences and possible role in polycystic ovarian syndrome. Biochimie. 2005;87:39–43. doi: 10.1016/j.biochi.2004.11.012. [DOI] [PubMed] [Google Scholar]
- Auwerx J, Martin G, Guerre-Millo M, Staels B. Transcription, adipocyte differentiation, and obesity. J Mol Med. 1996;74:347–352. doi: 10.1007/BF00210629. [DOI] [PubMed] [Google Scholar]
- Bhasin S, Calof O, Storer TW, et al. Drug insights: anabolic applications of testosterone and selective androgen receptor modulators in aging and chronic illness. Nature CPEM. 2006a;2:133–140. doi: 10.1038/ncpendmet0120. [DOI] [PMC free article] [PubMed] [Google Scholar]
- Bhasin S, Cunningham GR, Hayes FJ, Matsumoto AM, Snyder PJ, Swerdloff RS, Montori VM. Testosterone therapy in adult men with androgen deficiency syndromes: an endocrine society clinical practice guideline. J Clin Endocrinol Metab. 2006b;91:1995–2010. doi: 10.1210/jc.2005-2847. [DOI] [PubMed] [Google Scholar]
- Bhasin S, Parker RA, Sattler F, Haubrich R, Alston B, Umbleja T, Shikuma CM. Effects of testosterone supplementation on whole body and regional fat mass and distribution in human immunodeficiency virus-infected men with abdominal obesity. J Clin Endocrinol Metab. 2007;92:1049–1057. doi: 10.1210/jc.2006-2060. [DOI] [PubMed] [Google Scholar]
- Bjorntorp P. The regulation of adipose tissue distribution in humans. Int J Obes Relat Metab Disord. 1996;20:291–302. [PubMed] [Google Scholar]
- Carey JL, Sasur LM, Kawakubo H, Gupta V, Christian B, Bailey PM, Maheswaran S. Mutually antagonistic effects of androgen and activin in the regulation of prostate cancer cell growth. Mol Endocrinol. 2004;18:696–707. doi: 10.1210/me.2003-0360. [DOI] [PubMed] [Google Scholar]
- Cartwright MJ, Tchkonia T, Kirkland JL. Aging in adipocytes: potential impact of inherent, depot-specific mechanisms. Exp Gerontol. 2007;42:463–471. doi: 10.1016/j.exger.2007.03.003. [DOI] [PMC free article] [PubMed] [Google Scholar]
- Caserta F, Tchkonia T, Civelek VN, Prentki M, Brown NF, McGarry JD, Forse RA, Corkey BE, Hamilton JA, Kirkland JL. Fat depot origin affects fatty acid handling in cultured rat and human preadipocytes. Am J Physiol Endocrinol Metab. 2001;280:E238–E247. doi: 10.1152/ajpendo.2001.280.2.E238. [DOI] [PubMed] [Google Scholar]
- Derby CA, Zilber S, Brambilla D, Morales KH, McKinlay JB. Body mass index, waist circumference and waist to hip ratio and change in sex steroid hormones: the Massachusetts Male Ageing Study. Clin Endocrinol (Oxf) 2006;65:125–131. doi: 10.1111/j.1365-2265.2006.02560.x. [DOI] [PubMed] [Google Scholar]
- Despres JP, Moorjani S, Lupien PJ, Tremblay A, Nadeau A, Bouchard C. Genetic aspects of susceptibility to obesity and related dyslipidemias. Mol Cell Biochem. 1992;113:151–169. doi: 10.1007/BF00231535. [DOI] [PubMed] [Google Scholar]
- Dieudonne MN, Pecquery R, Leneveu MC, Giudicelli Y. Opposite effects of androgens and estrogens on adipogenesis in rat preadipocytes: evidence for sex and site-related specificities and possible involvement of insulin-like growth factor 1 receptor and peroxisome proliferator-activated receptor gamma 2. Endocrinology. 2000;141:649–656. doi: 10.1210/endo.141.2.7293. [DOI] [PubMed] [Google Scholar]
- Ding EL, Song Y, Malik VS, Liu S. Sex differences of endogenous sex hormones and risk of type 2 diabetes: a systematic review and meta-analysis. JAMA. 2006;295:1288–1299. doi: 10.1001/jama.295.11.1288. [DOI] [PubMed] [Google Scholar]
- Ginsberg-Fellner F. Growth of adipose tissue in infants, children and adolescents: variations in growth disorders. Int J Obes. 1981;5:605–611. [PubMed] [Google Scholar]
- Giudicelli Y, Dieudonne MN, Lacasa D, Pasquier YN, Pecquery R. Modulation by sex hormones of the membranous transducing system regulating fatty acid mobilization in adipose tissue. Prostaglandins Leukot Essent Fatty Acids. 1993;48:91–100. doi: 10.1016/0952-3278(93)90015-o. [DOI] [PubMed] [Google Scholar]
- Gregoire FM. Adipocyte differentiation: from fibroblast to endocrine cell. Exp Biol Med (Maywood) 2001;226:997–1002. doi: 10.1177/153537020122601106. [DOI] [PubMed] [Google Scholar]
- Guo W, Flanagan J, Jasuja R, Kirkland JL, Jiang L, Bhasin S. The effects of myostatin on adipogenic differentiation of human bone marrow-derived mesenchymal stem cells are mediated through cross-communication between smad3 and WNT/beta-catenin signaling pathways. J Biol Chem. 2008 doi: 10.1074/jbc.M708968200. [DOI] [PMC free article] [PubMed] [Google Scholar]
- Gurr MI, Jung RT, Robinson MP, James WP. Adipose tissue cellularity in man: the relationship between fat cell size and number, the mass and distribution of body fat and the history of weight gain and loss. Int J Obes. 1982;6:419–436. [PubMed] [Google Scholar]
- Haffner SM, Valdez RA, Stern MP, Katz MS. Obesity, body fat distribution and sex hormones in men. Int J Obes Relat Metab Disord. 1993;17:643–649. [PubMed] [Google Scholar]
- Isidori AM, Giannetta E, Greco EA, Gianfrilli D, Bonifacio V, Isidori A, Lenzi A, Fabbri A. Effects of testosterone on body composition, bone metabolism and serum lipid profile in middle-aged men: a meta-analysis. Clin Endocrinol (Oxf) 2005;63:280–293. doi: 10.1111/j.1365-2265.2005.02339.x. [DOI] [PubMed] [Google Scholar]
- Jasuja R, Catlin DH, Miller A, Chang YC, Herbst KL, Starcevic B, Artaza JN, Singh R, Datta G, Sarkissian A, Chandsawangbhuwana C, Baker M, Bhasin S. Tetrahydrogestrinone is an androgenic steroid that stimulates androgen receptor-mediated, myogenic differentiation in C3H10T1/2 multipotent mesenchymal cells and promotes muscle accretion in orchidectomized male rats. Endocrinology. 2005;146:4472–4478. doi: 10.1210/en.2005-0448. [DOI] [PubMed] [Google Scholar]
- Karagiannides I, Thomou T, Tchkonia T, Pirtskhalava T, Kypreos KE, Cartwright A, Dalagiorgou G, Lash TL, Farmer SR, Timchenko NA, Kirkland JL. Increased CUG triplet repeat-binding protein-1 predisposes to impaired adipogenesis with aging. J Biol Chem. 2006;281:23025–23033. doi: 10.1074/jbc.M513187200. [DOI] [PubMed] [Google Scholar]
- Katznelson L, Finkelstein JS, Schoenfeld DA, Rosenthal DI, Anderson EJ, Klibanski A. Increase in bone density and lean body mass during testosterone administration in men with acquired hypogonadism. J Clin Endocrinol Metab. 1996;81:4358–4365. doi: 10.1210/jcem.81.12.8954042. [DOI] [PubMed] [Google Scholar]
- Khaw KT, Barrett-Connor E. Lower endogenous androgens predict central adiposity in men. Ann Epidemiol. 1992;2:675–682. doi: 10.1016/1047-2797(92)90012-f. [DOI] [PubMed] [Google Scholar]
- Liao J, Sportsman R, harris J, Stahl A. Real-time quantification of fatty acid uptake using a novel fluorescence assay. J Lipid Res. 2005;46:597–602. doi: 10.1194/jlr.D400023-JLR200. [DOI] [PubMed] [Google Scholar]
- Marin P, Holmang S, Jonsson L, Sjostrom L, Kvist H, Holm G, Lindstedt G, Bjorntorp P. The effects of testosterone treatment on body composition and metabolism in middle-aged obese men. Int J Obes Relat Metab Disord. 1992a;16:991–997. [PubMed] [Google Scholar]
- Marin P, Krotkiewski M, Bjorntorp P. Androgen treatment of middle-aged, obese men: effects on metabolism, muscle and adipose tissues. Eur J Med. 1992b;1:329–336. [PubMed] [Google Scholar]
- Marin P, Lonn L, Andersson B, Oden B, Olbe L, Bengtsson BA, Bjorntorp P. Assimilation of triglycerides in subcutaneous and intraabdominal adipose tissues in vivo in men: effects of testosterone. J Clin Endocrinol Metab. 1996;81:1018–1022. doi: 10.1210/jcem.81.3.8772568. [DOI] [PubMed] [Google Scholar]
- McInnes KJ, Corbould A, Simpson ER, Jones ME. Regulation of adenosine 5′, monophosphate-activated protein kinase and lipogenesis by androgens contributes to visceral obesity in an estrogen-deficient state. Endocrinology. 2006;147:5907–5913. doi: 10.1210/en.2006-0879. [DOI] [PubMed] [Google Scholar]
- Monjo M, Rodriguez AM, Palou A, Roca P. Direct effects of testosterone, 17 beta-estradiol, and progesterone on adrenergic regulation in cultured brown adipocytes: potential mechanism for gender-dependent thermogenesis. Endocrinology. 2003;144:4923–4930. doi: 10.1210/en.2003-0537. [DOI] [PubMed] [Google Scholar]
- Mosmann T. Rapid colorimetric assay for cellular growth and survival. Application to proliferation assays. J Immunol Methods. 1983;65:55–63. doi: 10.1016/0022-1759(83)90303-4. [DOI] [PubMed] [Google Scholar]
- Moverare-Skrtic S, Venken K, Andersson N, Lindberg MK, Svensson J, Swanson C, Vanderschueren D, Oscarsson J, Gustafsson JA, Ohlsson C. Dihydrotestosterone treatment results in obesity and altered lipid metabolism in orchidectomized mice. Obesity (Silver Spring) 2006;14:662–672. doi: 10.1038/oby.2006.75. [DOI] [PubMed] [Google Scholar]
- Nantermet P, Harada SI, Liu Y, Cheng S, Johnson C, Yu Y, Kimmel D, Holder D, Hodor P, Phillips R, Ray WJ. Gene expression analyses in cynomolgus monkeys provides mechanistic insight into high density lipoprotein-cholesterol reduction by androgens in primates. Endocrinology. 2008 doi: 10.1210/en.2007-1151. [DOI] [PubMed] [Google Scholar]
- Page ST, Amory JK, Bowman FD, Anawalt BD, Matsumoto AM, Bremner WJ, Tenover JL. Exogenous testosterone (T) alone or with finasteride increases physical performance, grip strength, and lean body mass in older men with low serum T. J Clin Endocrinol Metab. 2004 doi: 10.1210/jc.2004-1933. [DOI] [PubMed] [Google Scholar]
- Rangwala SM, Lazar MA. Transcriptional control of adipogenesis. Annu Rev Nutr. 2000;20:535–559. doi: 10.1146/annurev.nutr.20.1.535. [DOI] [PubMed] [Google Scholar]
- Seidell JC, Bjorntorp P, Sjostrom L, Kvist H, Sannerstedt R. Visceral fat accumulation in men is positively associated with insulin, glucose, and C-peptide levels, but negatively with testosterone levels. Metabolism. 1990;39:897–901. doi: 10.1016/0026-0495(90)90297-p. [DOI] [PubMed] [Google Scholar]
- Singh R, Artaza JN, Taylor WE, Gonzalez-Cadavid NF, Bhasin S. Androgens stimulate myogenic differentiation and inhibit adipogenesis in C3H 10T1/2 pluripotent cells through an androgen receptor-mediated pathway. Endocrinology. 2003;144:5081–5088. doi: 10.1210/en.2003-0741. [DOI] [PubMed] [Google Scholar]
- Singh R, Artaza JN, Taylor WE, Braga M, Yuan X, Gonzalez-Cadavid NF, Bhasin S. Testosterone inhibits adipogenic differentiation in 3T3-L1 cells: nuclear translocation of androgen receptor complex with beta-catenin and T-cell factor 4 may bypass canonical Wnt signaling to down-regulate adipogenic transcription factors. Endocrinology. 2006;147:141–154. doi: 10.1210/en.2004-1649. [DOI] [PMC free article] [PubMed] [Google Scholar]
- Sjostrom L, Smith U, Krotkiewski M, Bjorntorp P. Cellularity in different regions of adipose tissue in young men and women. Metabolism. 1972;21:1143–1153. doi: 10.1016/0026-0495(72)90109-6. [DOI] [PubMed] [Google Scholar]
- Smith SR, Lovejoy JC, Greenway F, Ryan D, deJonge L, de la Bretonne J, Volafova J, Bray GA. Contributions of total body fat, abdominal subcutaneous adipose tissue compartments, and visceral adipose tissue to the metabolic complications of obesity. Metabolism. 2001;50:425–435. doi: 10.1053/meta.2001.21693. [DOI] [PubMed] [Google Scholar]
- Snyder PJ, Peachey H, Hannoush P, Berlin JA, Loh L, Lenrow DA, Holmes JH, Dlewati A, Santanna J, Rosen CJ, Strom BL. Effect of testosterone treatment on body composition and muscle strength in men over 65 years of age. J Clin Endocrinol Metab. 1999;84:2647–2653. doi: 10.1210/jcem.84.8.5885. [DOI] [PubMed] [Google Scholar]
- Snyder PJ, Peachey H, Berlin JA, Hannoush P, Haddad G, Dlewati A, Santanna J, Loh L, Lenrow DA, Holmes JH, Kapoor SC, Atkinson LE, Strom BL. Effects of testosterone replacement in hypogonadal men. J Clin Endocrinol Metab. 2000;85:2670–2677. doi: 10.1210/jcem.85.8.6731. [DOI] [PubMed] [Google Scholar]
- Taicher GZ, Tinsley FC, Reiderman A, Heiman ML. Quantitative magnetic resonance method for bone and whole body composition analysis. Anal Bioanal Chem. 2003;377:990–1002. doi: 10.1007/s00216-003-2224-3. [DOI] [PubMed] [Google Scholar]
- Tchkonia T, Giorgadze N, Pirtskhalava T, Tchoukalova Y, Karagiannides I, Forse RA, DePonte M, Stevenson M, Guo W, Han J, Waloga G, Lash TL, Jensen MD, Kirkland JL. Fat depot origin affects adipogenesis in primary cultured and cloned human preadipocytes. Am J Physiol Regul Integr Comp Physiol. 2002;282:R1286–R1296. doi: 10.1152/ajpregu.00653.2001. [DOI] [PubMed] [Google Scholar]
- Tchkonia T, Tchoukalova YD, Giorgadze N, Pirtskhalava T, Karagiannides I, Forse RA, Koo A, Stevenson M, Chinnappan D, Cartwright A, Jensen MD, Kirkland JL. Abundance of two human preadipocyte subtypes with distinct capacities for replication, adipogenesis, and apoptosis varies among fat depots. Am J Physiol Endocrinol Metab. 2005;288:E267–E277. doi: 10.1152/ajpendo.00265.2004. [DOI] [PubMed] [Google Scholar]
- Tchkonia T, Giorgadze N, Pirtskhalava T, Thomou T, DePonte M, Koo A, Forse RA, Chinnappan D, Martin-Ruiz C, von Zglinicki T, Kirkland JL. Fat depot-specific characteristics are retained in strains derived from single human preadipocytes. Diabetes. 2006;55:2571–2578. doi: 10.2337/db06-0540. [DOI] [PubMed] [Google Scholar]
- Tchkonia T, Lenburg M, Thomou T, Giorgadze N, Frampton G, Pirtskhalava T, Cartwright A, Cartwright M, Flanagan J, Karagiannides I, Gerry N, Forse RA, Tchoukalova Y, Jensen MD, Pothoulakis C, Kirkland JL. Identification of depot-specific human fat cell progenitors through distinct expression profiles and developmental gene patterns. Am J Physiol Endocrinol Metab. 2007;292:E298–E307. doi: 10.1152/ajpendo.00202.2006. [DOI] [PubMed] [Google Scholar]
- Tinsley FC, Taicher GZ, Heiman ML. Evaluation of a quantitative magnetic resonance method for mouse whole body composition analysis. Obes Res. 2004;12:150–160. doi: 10.1038/oby.2004.20. [DOI] [PubMed] [Google Scholar]
- Wang H, Kirkland JL, Hollenberg CH. Varying capacities for replication of rat adipocyte precursor clones and adipose tissue growth. J Clin Invest. 1989;83:1741–1746. doi: 10.1172/JCI114075. [DOI] [PMC free article] [PubMed] [Google Scholar]
- Wang C, Swedloff RS, Iranmanesh A, Dobs A, Snyder PJ, Cunningham G, Matsumoto AM, Weber T, Berman N. Transdermal testosterone gel improves sexual function, mood, muscle strength, and body composition parameters in hypogonadal men. Testosterone Gel Study Group. J Clin Endocrinol Metab. 2000;85:2839–2853. doi: 10.1210/jcem.85.8.6747. [DOI] [PubMed] [Google Scholar]
- Woodhouse LJ, Gupta N, Bhasin M, Singh AB, Ross R, Phillips J, Bhasin S. Dose-dependent effects of testosterone on regional adipose tissue distribution in healthy young men. J Clin Endocrinol Metab. 2004;89:718–726. doi: 10.1210/jc.2003-031492. [DOI] [PubMed] [Google Scholar]