Abstract
A novel hard transmission X-ray microscope (TXM) at the Stanford Synchrotron Radiation Light-source operating from 5 to 15 keV X-ray energy with 14 to 30 µm2 field of view has been used for high-resolution (30–40 nm) imaging and density quantification of mineralized tissue. TXM is uniquely suited for imaging of internal cellular structures and networks in mammalian mineralized tissues using relatively thick (50 µm), untreated samples that preserve tissue micro- and nanostructure. To test this method we performed Zernike phase contrast and absorption contrast imaging of mouse cancellous bone prepared under different conditions of in vivo loading, fixation, and contrast agents. In addition, the three-dimensional structure was examined using tomography. Individual osteocytic lacunae were observed embedded within trabeculae in cancellous bone. Extensive canalicular networks were evident and included processes with diameters near the 30–40 nm instrument resolution that have not been reported previously. Trabecular density was quantified relative to rod-like crystalline apatite, and rod-like trabecular struts were found to have 51–54% of pure crystal density and plate-like areas had 44–53% of crystal density. The nanometer resolution of TXM enables future studies for visualization and quantification of ultrastructural changes in bone tissue resulting from osteoporosis, dental disease, and other pathologies.
Keywords: X-ray microscopy, imaging, bone ultrastructure, bone mineral density, trabeculae, lacuna, osteocyte
Introduction
The vertebrate skeleton provides structural support, allows locomotion, and protects vital organs, in addition to serving as a mineral reservoir. These functions are accomplished through bone tissue, the hard mineralized material that comprises the skeleton (Constantz et al., 1995). Bone is formed by osteoblasts secreting an organic matrix consisting primarily of type I collagen. This soft organic substance serves as the substrate for subsequent mineral deposition in situ, producing lamellae of polymer-ceramic composite tissue. After forming the matrix, the osteoblastic cells become embedded in lacunae within their own matrix and transform into osteocytic cells characterized by lower metabolic activity and prolific cellular processes within mineralized canaliculi. As a result, mature bone tissue is characterized by an extensive lacunar-canalicular network (Wang et al., 2005; Anderson & Knothe, 2007; Hirose et al., 2007) that enables bone to function as an adaptive material. Considered from the bulk to the nanoscale, the structures of interest in bone tissue span multiple length scales: 50–150 µm thick trabecule to 20 µm long cell lacunae to the finer canals containing the cell processes (Weiner & Traub, 1992). Mechanisms to sense physical stimuli and transduce signals by bone cells are of great interest not only for normal skeletal growth and adaptation but also for diseases such as osteoporosis (Han et al., 2004; Feng et al., 2006; Tatsumi et al., 2007). Hypothesized mechanotransduction mechanisms include osteocytes, cell processes, fluid flow, and matrix deformation (e.g., Duncan & Turner, 1995; Burger & Klein-Nulend, 1999; Khosla et al., 2008), so an enhanced ability to examine bone at the nanoscale will enable understanding and differentiating these mechanisms.
Characterization of bone microstructure has historically required penetrating or sectioning the hard mineralized matrix, whereby thin (2–5 µm) sections were prepared and observed by light microscopy. The density of the mineral phase limits optical penetration to ~100 µm. One- or two-dimensional (2D) parameters measured from these sections were then extrapolated to characterize the three-dimensional (3D) microstructure of the tissue (Parfitt et al., 1987; Hildebrand & Ruegsegger, 1997). Recently, newer imaging techniques such as laser scanning confocal microscopy (Kamioka et al., 2001; Jones et al., 2005) and fluorescence microscopy techniques (Biteen et al., 2008; Huang et al., 2008; Schmidt et al., 2008) have improved resolution further. Fluorescence labeling with photoactivated EYFP (enhanced yellow fluorescent protein) can detect proteins localized to within 30 nm (Biteen et al., 2008) and 3D STORM (stochastic optical reconstruction microscopy) can map membrane proteins within 20–70 nm on mitochondria (Huang et al., 2008). In isoSTED (stimulated emission depletion) microscopy, spherical focal spots are generated to significantly decrease the width of the point spread function to provide a resolution of 40–45 nm (Schmidt et al., 2008). However, these fluorescence methods require labeling that is often protein-specific and map the location of the targeted proteins rather than the physical matrix structure.
Better resolution in the low nm range can be achieved with electron microscopy (Ren et al., 2005; Suvorova et al., 2007; Shen et al., 2009), but limitations include poor penetration of the sample and the necessity for very thin (60–100 nm) sectioning. Obtaining thin sections of this hard tissue is both technically challenging and destructive. Similarly, atomic force microscopy can view step heights smaller than 1 nm in the layered crystal structure of calcite (Vavouraki et al., 2008) and observe nanometer-sized structures in hydroxyapatite (Tong et al., 2003) and mineralites in bovine bone (Kwon et al., 2009), but only images the surface topology. In addition, the complexity of the 3D microstructure can be lost by these 2D approaches.
Microcomputed tomography (microCT) (Kuhn et al., 1990; Hildebrand & Ruegsegger, 1997; Muller et al., 1998) has elucidated the complexity of the 3D structure of bone tissue of thicker (up to 1 cm penetration) bulk samples without destructive sectioning. Lacunae were initially observed at ~10 µm resolution by laboratory (benchtop) microCT (Feldkamp, 1989), and canalicular detail is evident when higher resolution is obtained through synchrotron-based microCT (Luo et al., 1999; Nuzzo et al., 2002; Fritton et al., 2005). An additional advantage of this approach is the quantitative attenuation data obtained that can be converted to volumetric density determination. Mineral density of cortical and cancellous tissue has been determined by microCT (Weiner & Traub, 1992) and synchrotron micro-focus X-ray imaging (Wenk & Heidelbach, 1999). Despite these significant advances, the resolution of these CT methods still does not allow visualization of details in lacunae and canaliculae or determination of mineral density in individual trabeculae and lamellae.
Even higher resolution has been achieved with synchrotron-based soft and hard X-ray microscopy. Soft X-ray microscopy in the water window (284–543 eV, between the absorption edges of carbon and oxygen) has been used to study detailed 3D cellular structures, insect attachment devices, and spider silk at resolutions as fine as 30 nm (Glisovic et al., 2007; Eimuller et al., 2008; Parkinson et al., 2008). However, sample thickness was limited to ~5 µm. Recently, ultrahigh voltage electron microscopy has been used to acquire 3D tomography of osteocytes from thicker samples (3 µm) (Kamioka et al., 2009).
The use of hard X-ray transmission microscopy (in the 4 to 14 keV range) has the advantage of excellent spatial resolution (as high as 30 nm) with good sample penetration and depth of focus (~40 µm at 8 keV). Sample preparation for the transmission X-ray microscope (TXM) does not require staining or extremely thin sectioning, allowing for the study of intact bulk tissue structures. In addition, chemical information at high resolution can be obtained by imaging above and below the absorption edge of an element, and a fluorescence detector can be used for trace element identification at micron resolution. In this work we demonstrate that hard X-ray microscopy, specifically the TXM at the Stanford Synchrotron Radiation Lightsource (SSRL), can be used to provide detailed information (30–40 nm resolution) on mineralized tissue structure and density. Our goal is to demonstrate the capabilities of the instrument to facilitate future scientific investigations with this technique.
Materials and Methods
Beamline and Microscope Arrangement
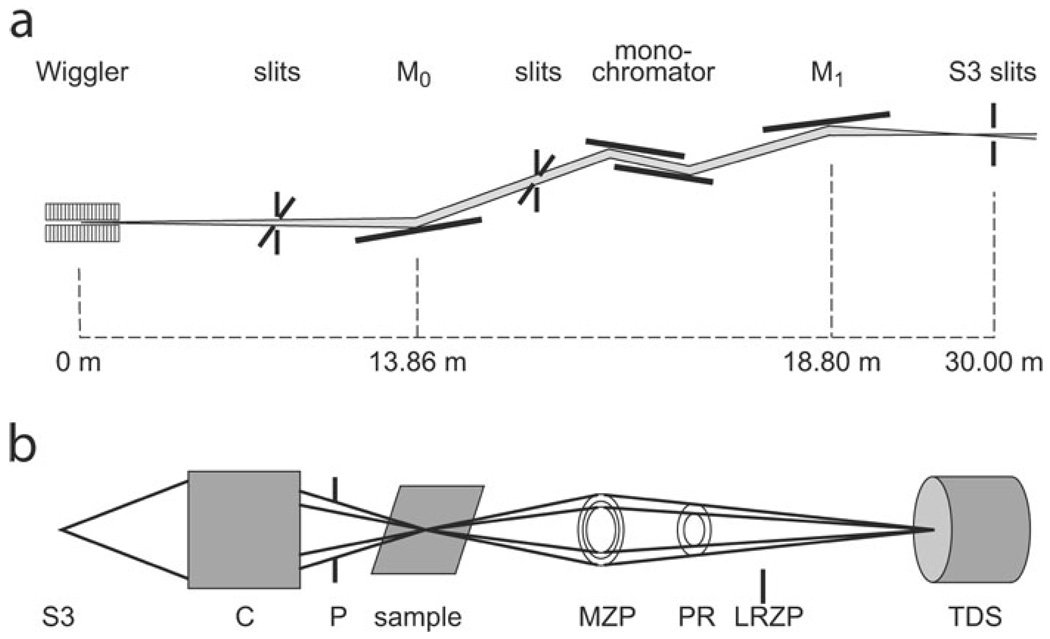
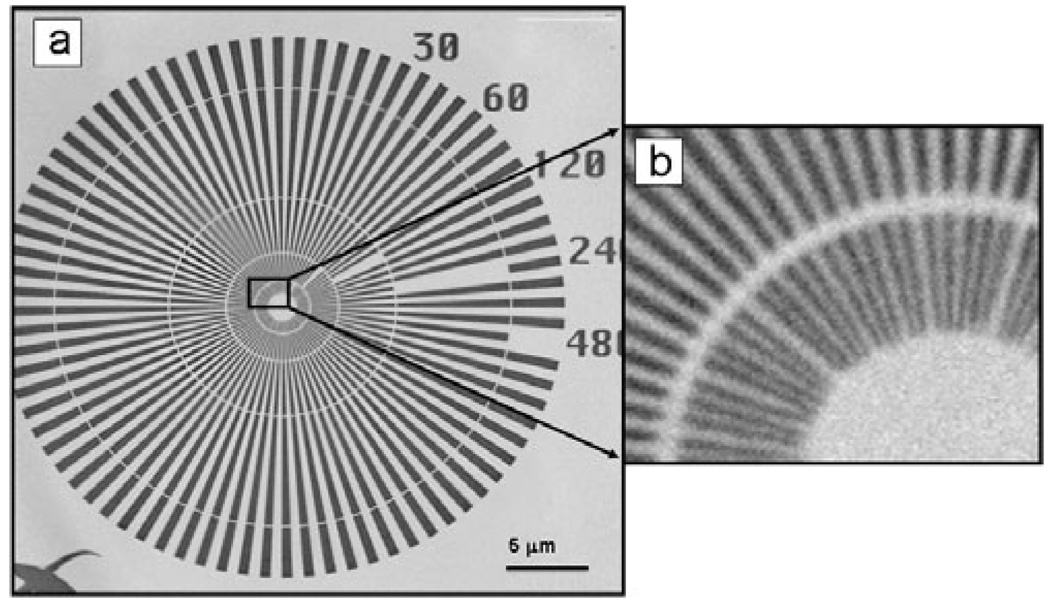
The hard X-ray TXM system on beamline 6-2 at SSRL (Fig. 1) was designed, manufactured, and installed by Xradia Inc. (Concord, CA, USA) based on a design for a microscope for use with a laboratory X-ray source (Tkachuk et al., 2007). This system is configured analogous to an optical microscope or transmission electron microscope. In the TXM, an elliptical capillary condenser, C, focuses the monochromatic X-ray radiation provided by the synchrotron beamline onto the sample. The condenser provides a hollow cone illumination of the sample over the field of view (FOV), and an objective lens, consisting of a micro-zone plate (MZP; Chu et al., 2008), images the transmitted X-rays onto a transmission detector system (TDS), consisting of a scintillator optically coupled via a 10× or 20× objective to a 1024 × 1024 pixel Peltier-cooled charge-coupled device (CCD) detector yielding a ~30 µm2 FOV with 10× objective and ~14 µm2 FOV with 20× objective. The recent addition of a condenser scanner and 2K × 2K CCD has increased the FOV to 30 µm at 8 keV. Several condensers and zone plates are utilized to cover the full 4–14 keV energy range. Analysis of images of a Siemens star for calibration (Andrews et al., 2009b) imaged using a zone plate with 45 nm outermost width confirmed a resolution of 40 nm using a modulation transfer analysis. Figure 2a and blowup in Fig. 2b show the same Siemens star at 5.4 keV made using the recent addition of a zone plate with 30 nm outermost width. The central features of the star with 30 nm spacing are clearly distinguishable, indicating ≤30 nm resolution.
Figure 1.
Schematic of transmission X-ray microscope at SSRL. a: Vertically collimating mirror (M0), monochromator and toroidal mirror (M1) focus beam on the slit (S3) at the virtual source. b: Microscope optics consist of a capillary condenser (C), x-y-z-θ sample stage; pinhole (P); MZP and TDS. A phase ring (PR) provides Zernike phase contrast at 8 keV and 5 keV. A LRZP is used to align the phase ring and is removed for imaging. Diagrams are not to scale.
Figure 2.
(a) Image of Siemens calibration standard with 30 nm minimum features taken at 5.4 keV using zone plate with 30 nm outermost width and (b) blowup of the central star region.
Zernike phase contrast allows effective imaging of samples with low absorption contrast such as organic materials imaged by hard X-rays. Phase contrast is essential for imaging biological samples or other weakly absorbing samples with hard X-rays. Phase contrast in the Zernike mode is achieved at 8 keV by using a 2.5 µm thick gold phase ring positioned in the back focal plane of the zone plate. The phase ring shifts the X-rays not diffracted by the sample by 3π/2 (negative Zernike phase contrast). Similarly, a 3.0 µm thick phase ring is used at 5.4 keV, made of nickel to reduce attenuation of the X-ray beam at this lower energy. The phase shifted X-rays interfere with the X-rays diffracted by the sample on the detector, which transfers phase shift differences in the sample into intensity changes on the detector. This imaging mode especially enhances any sharp discontinuities or edges within the sample. Alignment of the phase ring is achieved by inserting a low-resolution zone plate (LRZP) into the optical path.
Due to the relatively small FOV, regions of interest within samples must be predefined. To do so, a prealignment optical microscope was used to position features of interest within the sample accurately within the FOV of the TXM. The optical coordinates were synchronized between the TXM and prealignment microscope using a tungsten tip with one micrometer tip radius of the type commonly used in scanning tunneling microscopy. To image samples larger than a single FOV, a mosaic of several single images can be obtained by raster scanning. The mosaic widens the FOV, but each individual image still retains full resolution.
Tomographic analysis and angle-resolved TXM require 2D imaging of samples at different angles, which is accomplished by rotation of the sample stage. The stage is calibrated to ensure that the object of interest remains in the FOV during rotation. To form the 3D image, the series of 2D images taken at different angles (typically −90° to 90° in 1° steps) were reconstructed by a computer algorithm using filtered back projection, which resulted in a 3D volume dataset that could be viewed as a series of 2D “slices.”
In absorption contrast imaging, no phase ring is used, and the image of the sample represents the local sample transmission, allowing for quantitative analysis. This mode is also referred to as “bright field” because the X-rays illuminating the sample (direct beam) are collected by the objective lens (MZP) and no other optical elements (i.e., phase ring) are inserted into the optical path. Absorption contrast takes advantage of the unique absorption of each element at a given X-ray energy. In addition, X-ray fluorescence analysis of trace elements can be acquired using narrowed slits (3 µm beam size).
Mineral Density Determination
To determine mineral density, absorption contrast images of samples were compared with a calibration plot constructed from absorbance versus thickness of crystalline apatite, all at 5.4 keV X-ray energy. For microCT, mineral calibration standards have been constructed as a combination of air, saline, and standard materials (Weiner & Traub, 1992), or by hydroxyapatite (HA) diluted with lithium tetraborate (Schweizer et al., 2007). In this work, mineral densities were determined relative to rod-like crystalline chlorapatite (3.18 g/cm3) (O’Donnell et al., 2009). This approach assumes that the absorption of X-rays by trabecula at 5.4 keV is mainly due to attenuation by the apatite in the sample. This assumption was verified by imaging of an ethylenediaminetetraacetic acid (EDTA)-treated sample to remove all mineral and comparing pre- and post-treatment absorption data. The absorption of the EDTA-treated sample was <5% of the mineralized values, confirming the removal of mineral. To further confirm that the attenuation seen in the images was due to the mineral phase, the organic material was partially removed by mild Clorox treatment (5.25% sodium hypochlorite, 1 h treatment). This mild treatment did not deteriorate the bulk sample.
Calibration was determined using the Beer-Lambert Law
where I is the attenuated intensity, Io is incident intensity, α is the attenuation coefficient (1/cm), and X is the thickness (cm) (Buzug, 2008). To measure thickness, the 3D geometry was determined by imaging every 1° from −90° to 90° for the small crystal (HA06) that fit within a single FOV. No crystal anisotropy was observed, so isotropy was assumed. Thickness was measured in the orthogonal direction from which the absorption was determined; for example, the thickness for the absorption measured at 0° was taken from the 90° image. For the larger crystal (HA03), a mosaic of the sample was imaged in orthogonal pairs at 0 and 90°, 45° and −45°, and −22.5° and 67.5° to obtain absorption and thickness. To obtain thickness of the bone, a mosaic image was obtained every 58 from −90° to 90°.
Absorption, thickness, and density of the crystalline apatite and bone were determined both manually and from images plotted with a constant intensity scale (MATLAB, The Mathworks, Natick, MA, USA). In the manual method, attenuated intensity was measured at several points vertically along the crystalline apatite specimens (N = 2) by sampling thin rectangular areas spanning the crystal width (ImageJ version 1.41). Bone density was calculated relative to the apatite standard because the attenuation coefficient is proportional to the mass density (ρ; g/cm3); that is, they both respond to differences in thickness (Buzug, 2008). Linear regression was performed (Y = αX + b) between ln(Io/I) (absorption) versus crystalline thickness. In the MATLAB method, first the images (both the single FOV for crystal HA06 and mosaic images for crystal HA03) were reconstructed using filtered back projection. A thickness map was constructed by calculating thicknesses from the reconstructed slices. The ratio of absorption to thickness yielded the attenuation map, which was constant for the crystalline apatite, as expected. Both the manual and MATLAB points were plotted for the crystalline apatite to obtain the equation with slope α = 0.06833 µm−1 (p < 0.0001) and intercept b = −0.0049 (p = <0.0001) for the crystalline apatite. The attenuation for the trabecula sample was determined by dividing the absorption by the thickness from the reconstructed slices, in areas without lacunae. The ratio of attenuation for the sample versus the crystalline apatite yielded the relative density.
Preparation of Mineralized Samples
To examine mineralized samples, crystalline standards were examined first, followed by intact bone tissue. Crystalline chlorapatite was obtained from Dr. Adele Boskey at the Weill Cornell Medical College. Cancellous bone tissue samples were examined following in vivo mechanical loading, a treatment known to alter bone mass and tissue density. Two weeks of in vivo cyclic loading was used to stimulate bone formation in the tibiae of 10 week old C57Bl/6 mice (Fritton et al., 2005). Upon completion of the experiment, tibiae were fixed in 10% neutral buffered formalin. Because we are imaging the attenuation of X-rays from the mineralized phase of the tissue, not labeling proteins, any protein cross-linking due to formalin should not affect the results. For imaging, trabecular samples were removed from the proximal tibia by cutting away cortical bone using disposable microtome blades followed by gentle washing with a saline jet to remove marrow. Dry samples were attached to steel cannula tips using 5 min epoxy. Because the mouse trabeculae were less than 50 µm thick, the approximate depth of focus of the TXM, no additional dissection was performed. Heavy element staining was done with 1% uranyl acetate for 12 h. Phase and absorption contrast imaging were performed.
Results
Zernike Phase Contrast Imaging
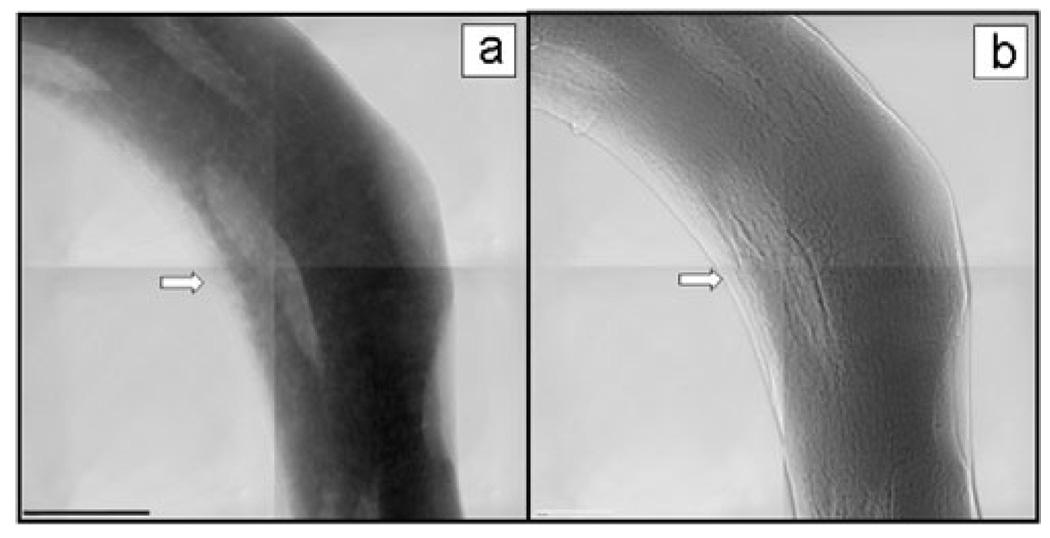
Exquisite cellular and structural detail was revealed by Zernike phase contrast imaging of mouse cancellous bone of the proximal tibia, with relatively large slices that preserve tissue microstructure; a combination unavailable with other methods (Fig. 3). Trabecular samples imaged at 5.4 keV both in absorption contrast (Fig. 3a) and Zernike phase contrast (Fig. 3b) demonstrate notable differences. The non-mineralized tissue edge was more evident in the phase contrast image, whereas the lacunae were more clearly evident in the absorption contrast image due to their decreased X-ray attenuation.
Figure 3.
TXM mosaic images at 5.4 keV of trabecula from mouse cancellous bone of the proximal tibia (a) in absorption contrast and (b) in Zernike phase contrast. Arrow points to the edge of nonmineralized tissue, which is more apparent in the phase contrast image. The FOV of each individual image is (30 µm)2 and scale bar = 15 µm. All images in this article show reference corrected images, in which the raw image is divided by the image without sample. Both brightness and contrast are adjusted, but no further processing was performed.
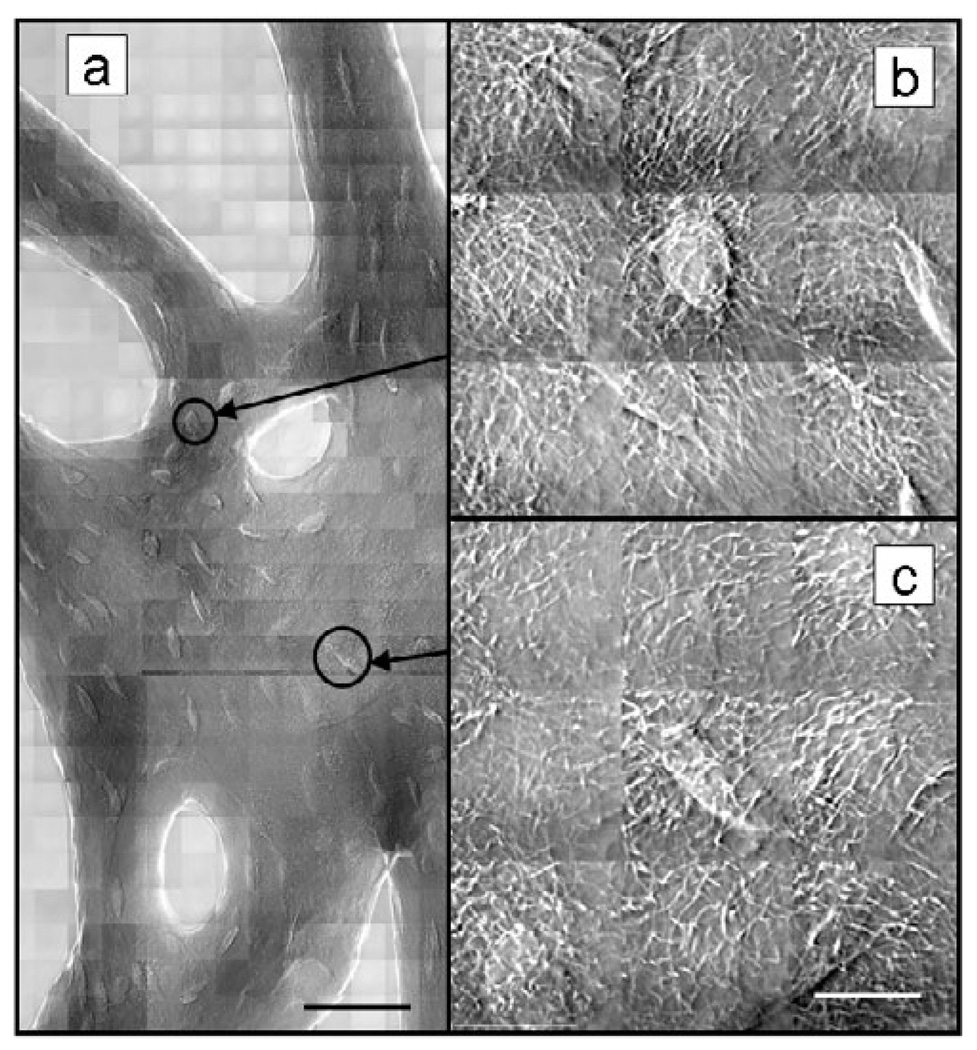
Expanded regions of phase contrast mosaic images of a loaded mouse tibia trabecula (Fig. 4b,c) show individual lacunae at the full resolution (40 nm) of the TXM with the 45 nm zone plate. Both spherical and elongated cells were observed, presumably representing incompletely mineralized or surface osteocytes and fully embedded cells in lacunae. Prolific cell processes that measured <50 nm in width were evident in the full resolution images. Visualization of these structures in intact, unlabeled trabeculae, evident in all bone samples imaged, is unique to this method and cannot be resolved by optical microscopy or microCT.
Figure 4.
Zernike phase contrast images at 8 keV of cancellous bone from mouse tibia after in vivo loading. FOV = (15 µm)2. Mosaic in panel a shows wider region (scale bar = 45 µm) and 3 × 3 mosaics b and c show detail of processes (scale bar = 10 µm). All images were reference corrected and both brightness and contrast adjusted without additional data processing.
Angle-Resolved TXM and 3D Tomography
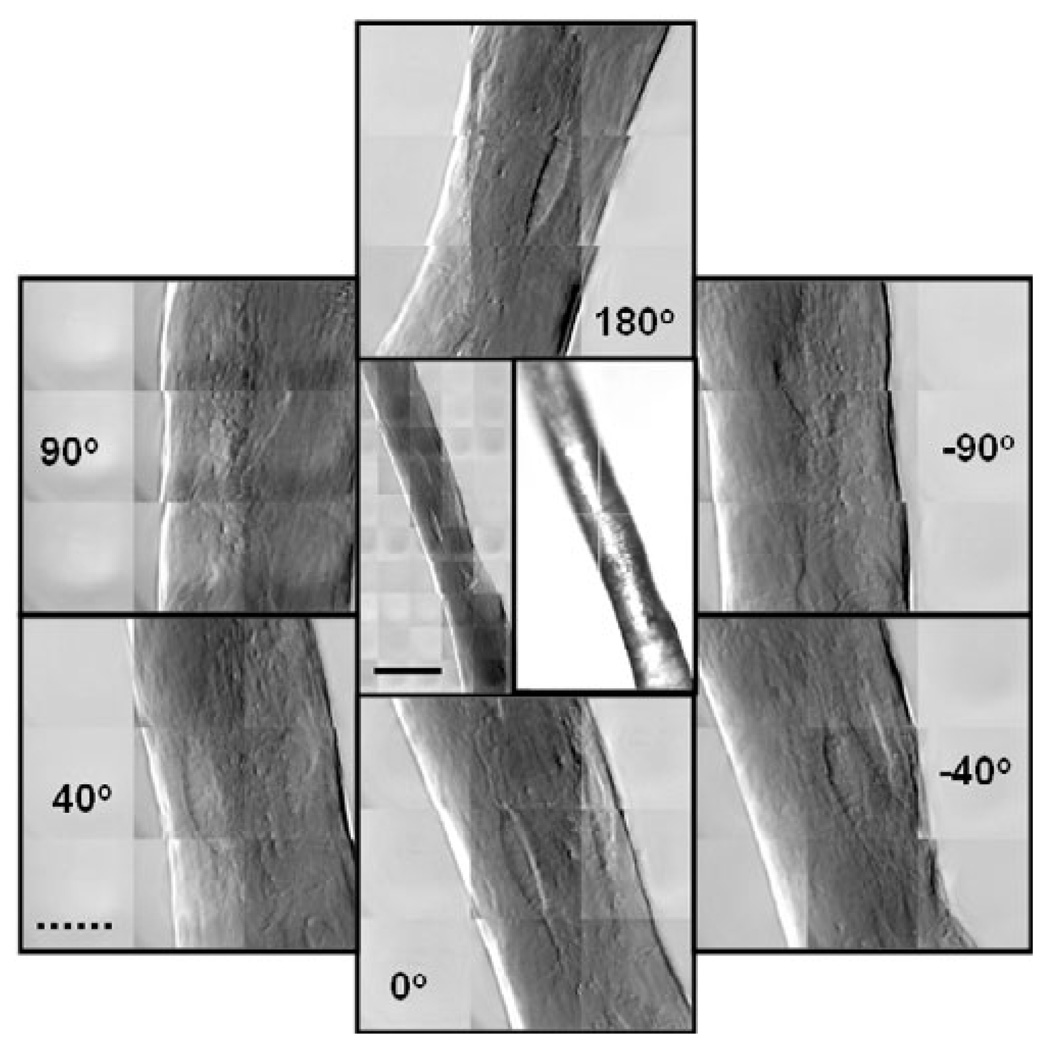
A series of angle-resolved TXM images of a single trabecula provided an example of the X-ray transmission through the full thickness of the sample, as well as insight into the shape of the lacunae and effect of orientation (Fig. 5). The lacuna visible in the center of the image at 0° (bottom) could also be observed when the sample was rotated by 180° (top), demonstrating transmission of the X-rays through the sample. The same lacuna was also visible at +40° and −40° (lower left and lower right, respectively), but was close to the edge and less visible at +90° and −90° (upper left and upper right, respectively). This phenomenon would need to be taken into account, for example, when quantifying cells on trabecular struts. Viewing the sample at different angles also allowed determination of its geometry, which was required for quantification of mineral density.
Figure 5.
Center TXM and optical images show a small trabecular strut from a control (not loaded) mouse tibia. Center left image is a 5 × 10 mosaic taken in phase contrast at 8 keV. FOV = (15 µm)2. The right image is from the optical prealignment microscope. The surrounding images are 3 × 3 mosaics at full resolution taken at the indicated angles. The same lacuna can be seen in all the images demonstrating X-ray penetration of the entire sample. Solid scale bar is 30 µm, and broken scale bar is 10 µm.
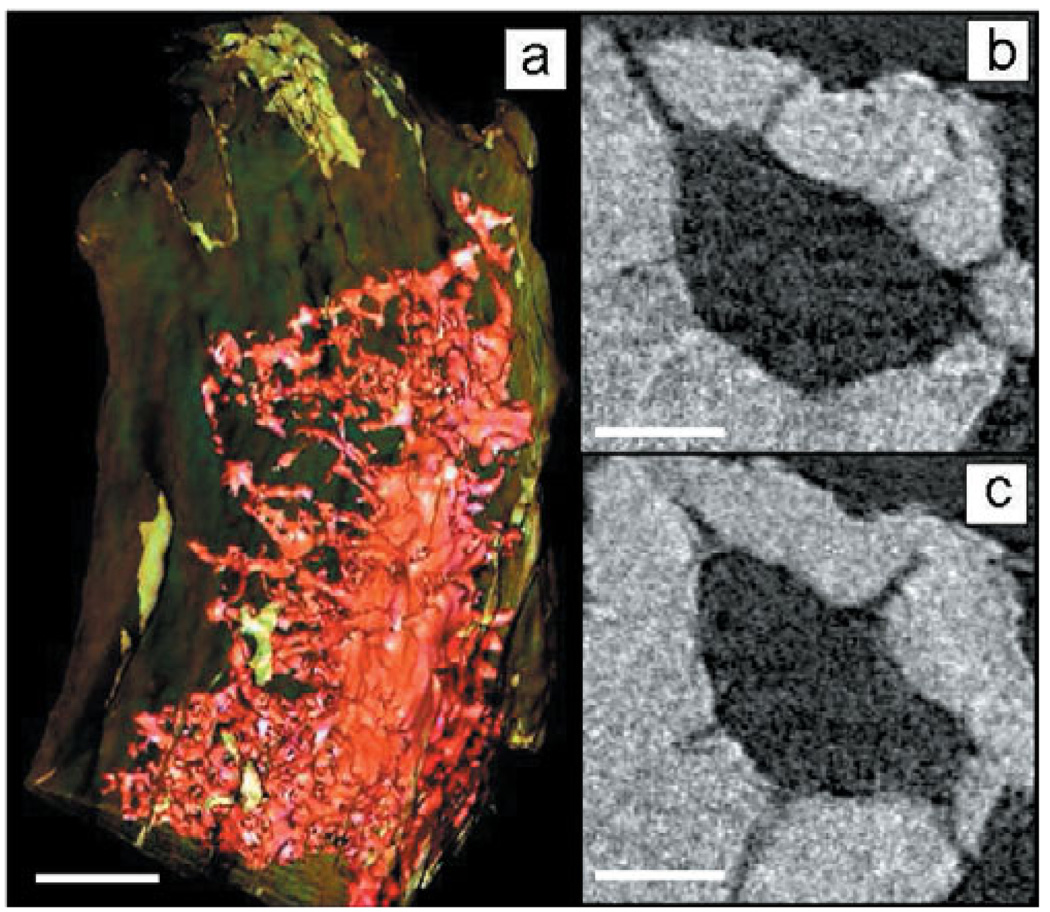
Tomography revealed 3D features of lacunar detail. Three-dimensional tomography of a single lacuna found within a trabecula (Fig. 6a) revealed its shape, geometry, and surrounding canalicular network. In the two reconstructed slices (Fig. 6b,c), the inner structure and larger processes extending from the lacunae are evident. The tomographic dataset is shown in Supplemental Movie 1.
Figure 6.
(a) Three-dimensional tomographic reconstruction of lacuna from mouse tibia trabecula and slices (b,c) show processes extending from the lacuna. Images were taken every degree from −90° to 90°, reconstructed using filtered back projection and rendered using visualization software (Aviso, Visualization Sciences Group). Scale bar is 5 µm in panel a and 2 µm in panels b and c.
Imaging of Chemically Treated Samples
Chemical treatments of the trabeculae were used to help determine what aspects of the tissue contribute to the X-ray attenuation. Typically, higher-Z elements including Ca in mineralized tissue absorb more hard X-rays compared with lower-Z elements (such as C in soft biological tissue), and samples with significant clusters of high-absorbing material can be imaged without phase contrast at lower energies (e.g., 5.4 keV) closer to the Ca and P absorption edges, as shown earlier (Fig. 3b).
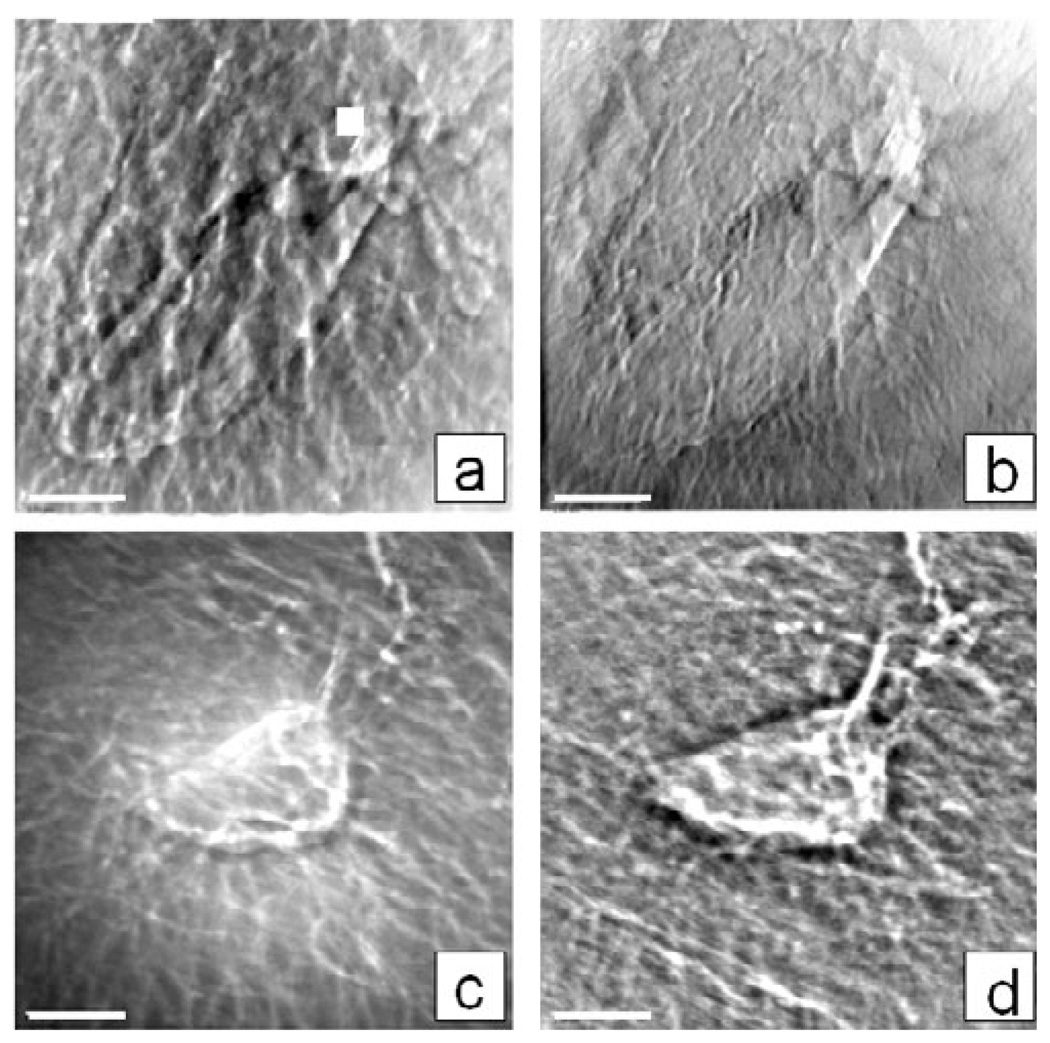
Heavy element staining (e.g., using uranyl acetate), however, can help to render fine features in lower-Z tissue easier to see in absorption contrast at 8 keV (Fig. 7b). In a phase contrast image of the same lacuna, the lower-Z tissue appears thicker in comparison (Fig. 7a) due to “halo” effects, because higher frequency information is left out. However, in some U-stained tissue, shrunken cells were visible within lacunae (not shown), indicating that the staining may be changing the biological nature of the sample or highlighting other features.
Figure 7.
TXM images at 8 keV of lacunae from mouse tibia trabecula showing differences in the sample preparation and imaging modalities; for example, (a) phase and (b) absorption contrast images of a control (not loaded) uranyl acetate treated sample (1% in water, overnight), and phase contrast images of lacuna (c) before and (d) after Clorox treatment to remove organic material. Images are a single FOV (15 µm) and scale bar is 2.5 µm.
In phase contrast images of the same sample region pre- and post-treatment with 5.25% sodium hypochlorite to remove organic tissue such as cell membranes, less filament structure was apparent in the hypochlorite treated sample (Fig. 7d) than in the same sample before treatment (Fig. 7c), confirming that the signal was due to mineralized, not organic, material and that organic material contributes to cellular processes. However, more edge enhancement of mineralized canaliculi was present with the organic fraction removed (Fig. 7d).
Quantification of Mineral Density
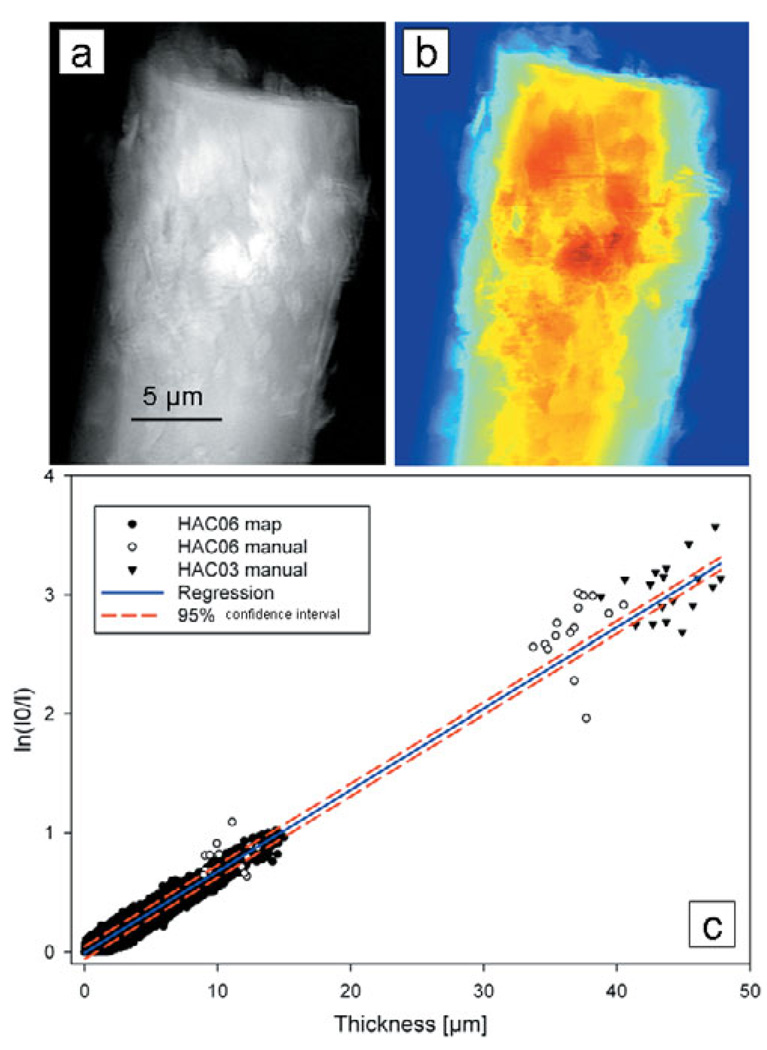
Mineral density was quantified in mouse trabeculae using TXM at the ultrastructure level, using crystalline chlorapatite as the calibration standard. Values from an absorption image (ln(I 0/I)) of pure rod-like crystalline apatite (Fig. 8a) and thickness map (Fig. 8b) made with data from the reconstructed slices were plotted as absorption versus thickness (Fig. 8c). Using data for two separate crystals, an attenuation coefficient of 683 cm−1 was obtained for pure crystalline apatite.
Figure 8.
(a) Absorption (ln(I 0/I)) image of rod-like crystalline chlorapatite sample HA06 and (b) thickness map from reconstructed slices. (c) Plot of absorption versus thickness for two crystalline standards includes points determined manually and using MATLAB. Linear regression yielded an attenuation coefficient of 683 cm−1.
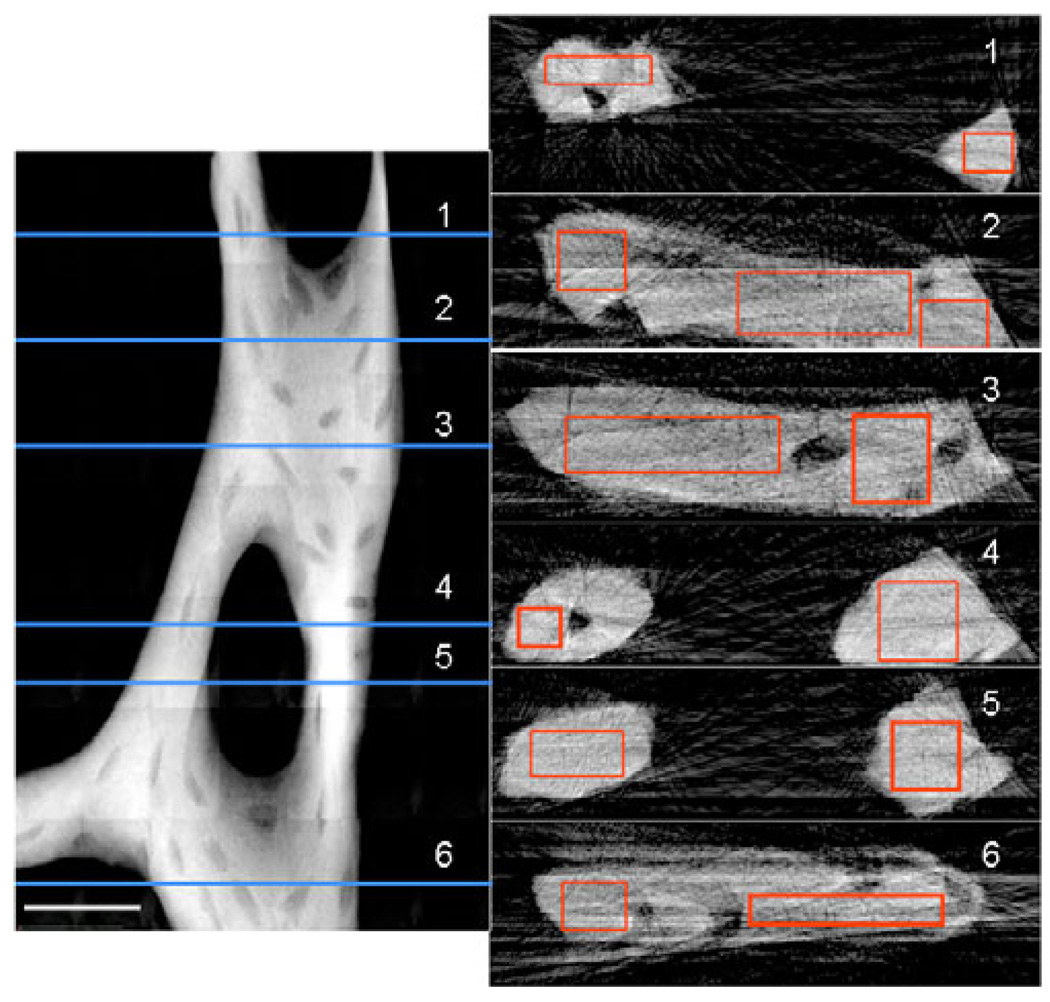
The calibration data were used to determine mineral density in a trabeculum from a normally ambulating mouse (an unloaded control). At each numbered horizontal line in the TXM mosaic image of the bone (Fig. 9 left), thickness and attenuation coefficients were determined from reconstructed slices (Fig. 9 right). The mean attenuation values in the rectangular regions of the slices ranged from 300– 365 cm−1 for the plate-like regions of the trabecula and 345–370 cm−1 for the rod-like regions, or 44–53% and 51–54% of the density of rod-like crystalline apatite, respectively. This measured variation confirms that structurally different regions in the trabecular network have different mineral composition and properties.
Figure 9.
Mosaic absorption (ln(I0/I)) image of trabecula from mouse tibia at 5.4 keV (left side). Trabecula was imaged every 58 from −90° to 90° to determine 3D geometry. Scale bar is 25 µm. Numbered slices reconstructed at horizontal lines on the left are depicted on the right. Average attenuation values determined for the rectangular regions on the slices were 300–365 cm−1 in plate-like regions and 345–370 cm−1 in rod-like trabecular regions, or 44–53% and 51–54% of rod-like crystalline chlorapatite, respectively.
Discussion
Using synchrotron-based transmission X-ray microscopy, we have imaged mineralized cancellous bone tissue and demonstrated osteocytic cellular structure, with excellent resolution. This TXM approach routinely provides 40 nm resolution (and more recently ≤30 nm) with deep sample penetration of tens of micrometers in 2D and 3D, with minimal or no sample preparation, without fixation or staining and associated artifacts.
With TXM we observed a vast cell-cell network of numerous osteocytic canaliculi through the thickness of single trabeculae, with visualization of the smaller processes unique to this method to date. Three-dimensional tomography of 3 µm thick silver-stained osteocytes has been obtained using UHVEM (Kamioka et al., 2009), but ultimately resolution was dependent on the size of the Ag particles that were 2–3 pixels in dimension, resulting in approximately 30–50 nm resolution. In addition, visualization was limited to structures where Ag had accumulated. Imaging of other osteocyte/canalicular morphology has also been performed with scanning and transmission electron microscopes, but because of limited electron penetration of mineralized tissue only the surface of thinly sectioned tissue is imaged, and a 3D structure can be difficult to see. Larger-scale canalicular networks were evident in mouse cortical bone using microCT at 700 nm resolution (Schneider et al., 2007), but we have resolved canalicular structure on a much smaller scale in mouse trabeculae. Using a combination of confocal laser scanning and differential interference contrast microscopies, canaliculi surrounding osteocytes were studied in chick calvariae (Kamioka et al., 2001), but with a maximum resolution greater than 100 nm, the same level of detail would not be possible as seen with TXM. The osteocytic lacunar canalicular system was also imaged in mice (Hirose et al., 2007), but with only 300 nm resolution, requiring sectioning and extensive chemical treatment to enhance contrast.
High-resolution fluorescence methods (Biteen et al., 2008; Huang et al., 2008; Schmidt et al., 2008) have not yet been applied to bone and mineralized tissue. These fluorescence methods rely on labeling of proteins to identify structures, but in contrast TXM is an optical method with an absorption mode based on the attenuation of X-rays by mineral and tissue structure, and a Zernike phase contrast mode that portrays information directly from interfaces within biological structures. With the level of detail available using TXM, in a future study one could directly compare cellular and structural detail and mineral density in bone tissue from specimens subjected to different treatments that affect density of the mineralized tissue to obtain information on the changes in tissue and cellular ultrastructure associated with these conditions. This information would be particularly useful in the study of the etiology of skeletal diseases and to understand the mechanisms of treatment.
The 3D data capabilities of TXM, made possible due to the hard X-ray penetration and depth of focus of ~40 µm, greatly enhance biological imaging and reveal the relative arrangement of structures that is not easily determined from 2D imaging. For example, in 2D optical microscopy interpreting a complex structure from a surface view is difficult, and in EM reconstructing the environment around a very thin 2D slice is challenging.
The determination of trabecular mineral density using hard X-ray TXM provides localized nanoscale bone mineral density quantification, in contrast with the average mineral density provided by microCT. The density values we found are lower than that for pure crystalline apatite. This finding is to be expected because of voids such as canaliculi and the composite nature of bone tissue. In addition, we found lower density values for the plate-like regions than the rod-like regions. For the region containing the trabecula depicted in Fig. 9, we determined an average mineral density of 0.480 g/cm3 with microCT. As expected, this value is lower than the TXM results because TXM determines density of small tissue volumes within individual trabeculae omitting voids such as lacunae. In the future the local density values can be correlated more precisely with details of morphological features such as rod- or plate-like trabeculae, lacunar density, shape and orientation, number of processes, etc. as a function of loading or other skeletal treatments that may alter tissue density or cellular characteristics. Current bone mineral quantification methodology can be improved by extending the range of calibration standards to also include single-crystalline calibration standards of varying densities and attenuation coefficients.
Absorption contrast of specific features in biological tissue can be enhanced using quantum dots (Alivisatos et al., 2005; Zhu et al., 2009) or other nanoparticles (Schneider et al., 2002) for immunolabeling of cells and structures or tracer studies of cellular compartment and specific molecules associated with the higher-Z nanoparticles.
Several limitations exist to the current TXM setup that are technically addressable. One limitation of TXM imaging methods in general includes the small FOV (15–30 µm). Thoughtful sample preparation is essential to create samples that fit within a single FOV, although larger fields can be examined by automatically acquiring tiled images, as demonstrated in Figures 4, 5, and 9. We are also working on the creation of user-friendly software to standardize the reconstruction of mosaic tomography for samples that do not fit within a single FOV. This reconstruction is currently accomplished with in-house MATLAB methods (e.g., as used for mineral density quantification).
Another limitation of TXM is the possible introduction of artifacts from radiation damage. Because of the multiple images taken, tomography in particular exposes the sample to more radiation than when imaging a single FOV. This additional radiation exposure does not appear to be damaging the mineralized tissue we have worked with, because the images have remained constant before and after tomography and extensive imaging. However, hydrated nonmineralized biological tissue would be particularly susceptible to free radical formation created by the interaction of X-rays with water (Marchesini et al., 2003). The addition of a cryogenic stage is expected to overcome some of the limitations related to radiation exposure and will likely improve imaging of hydrated cells and tissue by reducing indirect radiation damage. Alternatively, samples prepared by freeze-drying or critical point drying, particularly those with cells walls such as plant cells and yeast, have also proven to be stable samples for TXM imaging without a cryostat (Andrews et al., 2009a).
Conclusions
In conclusion, the TXM imaging of biological samples we report here represents an important advance in the ability to image at high resolution in the tens of nanometer range, in minimally processed thick 3D samples. In intact mouse cancellous bone trabeculae, we have observed features that have not been reported previously. The ability to image networks of lacunae and canaliculi and to measure local tissue changes at high resolutions will have significant impact on understanding mechanisms of bone adaptation and disease. This approach is already providing a novel understanding of the nanostructure and properties of complex mineralized biological specimens and holds the promise of being greatly informative about the nanostructure of materials and the nanoscale complexity of life.
Supplementary Material
Reconstructed tomography dataset from mouse bone trabecula shows the canalicular network including processes extending from the lacuna. Supplementary Movie 1 is available online at journals.cambridge.org/jid_MAM.
ACKNOWLEDGMENTS
This work has been supported by the National Institutes of Health (NIH)/National Institute of Biomedical Imaging and Bioengineering grant number R01-EB004321. Mouse loading experiments were supported by NIH grant number R01-AG028664 (to M.C.H.M.) and E.A. is supported by National Aeronautics and Space Administration Grant number RAD2004-0000-0110. SSRL is supported by the Department of Energy, Office of Basic Energy Sciences.
REFERENCES
- Alivisatos AP, Gu W, Larabell C. Quantum dots as cellular probes. Annu Rev Biomed Eng. 2005;7:55–76. doi: 10.1146/annurev.bioeng.7.060804.100432. [DOI] [PubMed] [Google Scholar]
- Anderson EJ, Knothe ML. Design of tissue engineering scaffolds as delivery devices for mechanical and mechanically modulated signals. Tissue Eng. 2007;13:2525–2538. doi: 10.1089/ten.2006.0443. [DOI] [PubMed] [Google Scholar]
- Andrews JC, Brennan S, Liu Y, Pianetta P, Almeida EA, van der Meulen MCH, Wu Z, Mester Z, Ouerdane L, Gelb J, Feser M, Rudati J, Tkachuk A, Yun W. Full field transmission X-ray microscopy for bioimaging. J Phys Conf Series. 2009a;186 doi: 10.1088/1742-6596/186/1/012081. 012002. [DOI] [PMC free article] [PubMed] [Google Scholar]
- Andrews JC, Brennan S, Pianetta P, Ishii H, Gelb J, Feser M, Rudati J, Tkachuk A, Yun WB. Full-field transmission X-ray microscopy at SSRL. J Phys Conf Series. 2009b;186 doi: 10.1088/1742-6596/186/1/012081. 012081. [DOI] [PMC free article] [PubMed] [Google Scholar]
- Biteen JS, Thompson MA, Tselentis NK, Bowman GR, Shapiro L, Moerner WE. Super-resolution imaging in live Caulobacter crescentus cells using photoswitchable EYFP. Nat Methods. 2008;5:947–949. doi: 10.1038/NMETH.1258. [DOI] [PMC free article] [PubMed] [Google Scholar]
- Burger EH, Klein-Nulend J. Mechanotransduction in bone—Role of the lacuno-canalicular network. FASEB J. 1999;13:S101–S112. [PubMed] [Google Scholar]
- Buzug TM. Computed tomography from photon statistics to modern cone-beam CT. Berlin, Heidelberg: Springer-Verlag; 2008. [Google Scholar]
- Chu YS, Yi JM, DeCarlo F, Shen Q, Lee W-K, Wun HJ, Wang CL, Wang JY, Liu CJ, Wang CH, Wu SR, Chien CC, Hwu Y, Tkachuk A, Yun W, Feser M, Liang KS, Yang CS, Je JH, Margaritondo G. Hard X-ray microscopy with Fresnel zone plates reaches 40 nm Rayleigh resolution. Appl Phys Lett. 2008;92 103119-1-103119-3. [Google Scholar]
- Constantz BR, Ison IC, Fulmer MT, Poser RD, Smith ST, VanWagoner M, Ross J, Goldstein SA, Jupiter JB, Rosenthal DI. Skeletal repair by in situ formation of the mineral phase of bone. Science. 1995;267:1796–1799. doi: 10.1126/science.7892603. [DOI] [PubMed] [Google Scholar]
- Duncan RL, Turner CH. Mechanotransduction and the functional response of bone to mechanical strain. Calcif Tissue Int. 1995;57:344–358. doi: 10.1007/BF00302070. [DOI] [PubMed] [Google Scholar]
- Eimuller T, Guttmann P, Gorb SN. Terminal contact elements of insect attachment devices studied by transmission X-ray microscopy. J Exper Biol. 2008;211:1958–1963. doi: 10.1242/jeb.014308. [DOI] [PubMed] [Google Scholar]
- Feldkamp LA. The direct examination of three-dimensional bone architecture in vitro by computed tomography. J Bone Miner Res. 1989;4:3–11. doi: 10.1002/jbmr.5650040103. [DOI] [PubMed] [Google Scholar]
- Feng JW, Ward LM, Liu S, Lu Y, Xie Y, Yuan B, Yu X, Rauch F, Davis SI, Zhang S, Rios H, Drezner MK, Quarles LD, Bonewald LF, White KE. Loss of DMP1 causes rickets and osteomalacia and identifies a role for osteocytes in mineral metabolism. Nat Genet. 2006;38:1310–1315. doi: 10.1038/ng1905. [DOI] [PMC free article] [PubMed] [Google Scholar]
- Fritton JC, Myers ER, Wright TM, van der Meulen MCH. Loading induces site-specific increases in mineral content assessed by microcomputed tomography of the mouse tibia. Bone. 2005;36:1030–1038. doi: 10.1016/j.bone.2005.02.013. [DOI] [PubMed] [Google Scholar]
- Glisovic A, Thieme J, Guttmann P, Salditt T. Transmission X-ray microscopy of spider dragline silk. Int J Biol Macromolec. 2007;40:87–95. doi: 10.1016/j.ijbiomac.2006.06.015. [DOI] [PubMed] [Google Scholar]
- Han Y, Cowin SC, Schaffler MB, Weinbaum S. Mechanotransduction and strain amplification in osteocyte cell processes. Proc Natl Acad Sci USA. 2004;101:16689–16694. doi: 10.1073/pnas.0407429101. [DOI] [PMC free article] [PubMed] [Google Scholar]
- Hildebrand T, Ruegsegger P. A new method for the model-independent assessment of thickness in three-dimensional images. J Microsc. 1997;185:67–75. [Google Scholar]
- Hirose S, Li M, Kojima T, Henrique P, deFreitas L, Ubaidus S, Oda K, Saito C, Amizuka N. A histological assessment on the distribution of the osteocytic lacunar canalicular system using silver staining. J Bone Miner Metab. 2007;25:374–382. doi: 10.1007/s00774-007-0764-x. [DOI] [PubMed] [Google Scholar]
- Huang B, Jones SA, Brandenburg B, Zhuang X. Whole-cell 3D STORM reveals interactions between cellular structures with nanometer-scale resolution. Nat Methods. 2008;5:1047–1052. doi: 10.1038/nmeth.1274. [DOI] [PMC free article] [PubMed] [Google Scholar]
- Jones CW, Smolinkski D, Keogh A, Kirk TB, Zheng MH. Confocal laser scanning microscopy in orthopaedic research. Progr Histochem Cytochem. 2005;40:1–71. doi: 10.1016/j.proghi.2005.02.001. [DOI] [PubMed] [Google Scholar]
- Kamioka H, Honjo T, Takano-Yamamoto T. A three-dimensional distribution of osteocytes processes revealed by the combination of confocal laser scanning microscopy and differential interference contrast microscopy. Bone. 2001;28:145–149. doi: 10.1016/s8756-3282(00)00421-x. [DOI] [PubMed] [Google Scholar]
- Kamioka H, Murshid SA, Ishihara Y, Kajimura N, Hasegawa T, Ando R, Sugawara Y, Yamashiro T, Takaoka A, Takano-Yamamoto T. A method for observing silver-stained osteocytes in situ in 3-µm sections using ultrahigh voltage electron microscopy tomography. Microsc Microanal. 2009;15:377–383. doi: 10.1017/S1431927609990420. [DOI] [PubMed] [Google Scholar]
- Khosla S, Westendorf JJ, Oursler MJ. Building bone to reverse osteoporosis and repair fractures. J Clin Invest. 2008;118:421–428. doi: 10.1172/JCI33612. [DOI] [PMC free article] [PubMed] [Google Scholar]
- Kuhn JL, Goldstein SA, Feldkamp LA, Goulet RW, Jesion G. Evaluation of a microcomputed tomography system to study trabecular bone structure. J Orthop Res. 1990;8:833–842. doi: 10.1002/jor.1100080608. [DOI] [PubMed] [Google Scholar]
- Kwon KY, Wang E, Chung A, Chang N, Lee SW. Effect of salinity on hydroxyapatite dissolution studies by atomic force microscopy. J Phys Chem C. 2009;113:3369–3372. [Google Scholar]
- Luo G, Kinney JH, Kaufman JJ, Haupt D, Chiabrera A, Siffert RS. Relationship between plain radiographic patterns and three-dimensional trabecular architecture in human calcaneus. Osteoporosis Int. 1999;9:339–345. doi: 10.1007/s001980050156. [DOI] [PubMed] [Google Scholar]
- Marchesini S, Chapmann HN, Hau-Riege SP, London RA, Szoke A, He H, Howells MR, Padmore H, Rosen R, Spence JCH, Weierstall U. Coherent X-ray diffractive imaging: Applications and limitations. Opt Express. 2003;11:2344–2353. doi: 10.1364/oe.11.002344. [DOI] [PubMed] [Google Scholar]
- Muller R, vanCampenhout H, vanDamme B, van der Perre G, Dequeker J, Hildebrand T, Ruegsegger P. Morphometric analysis of human bone biopsies: A quantitative structural comparison of histological sections and micro-computed tomography. Bone. 1998;23:59–66. doi: 10.1016/s8756-3282(98)00068-4. [DOI] [PubMed] [Google Scholar]
- Nuzzo S, Peyrin F, Cloetens P, Baruchel J. Quantification of the degree of mineralization of bone in three dimensions using synchrotron radiation microtomography. Med Phys. 2002;29:2672–2681. doi: 10.1118/1.1513161. [DOI] [PubMed] [Google Scholar]
- O’Donnell MD, Hill RG, Fong SK. Neutron Diffraction of chlorine substituted fluorapatite. Mater Lett. 2009;63:1347–1349. [Google Scholar]
- Parfitt AM, Drezner MK, Glorieux FG, Kanis JA, Malluche H, Meunier PJ, Ott SM, Recker RR. Bone histomorphometry: Standardization of nomenclature, symbols, and units. Report of the ASBMR Histomorphometry Nomenclature Committee. J Bone Miner Res. 1987;2:595–610. doi: 10.1002/jbmr.5650020617. [DOI] [PubMed] [Google Scholar]
- Parkinson DY, McDermott G, Etkin LD, LeGros MA, Larabell CA. Quantitative 3-D imaging of eukaryotic cells using soft X-ray tomography. J Struct Biol. 2008;162:380–386. doi: 10.1016/j.jsb.2008.02.003. [DOI] [PMC free article] [PubMed] [Google Scholar]
- Ren S, Takano H, Abe K. Two types of bone resorption lacunae in the mouse parietal bones as revealed by scanning electron microscopy and histochemistry. Arch Histol Cytol. 2005;2:103–113. doi: 10.1679/aohc.68.103. [DOI] [PubMed] [Google Scholar]
- Schmidt R, Wurm CA, Jakobs S, Engelhardt J, Egner A, Hell SW. Spherical nanosized focal spot unravels the interior of cells. Nat Methods. 2008;5:539–544. doi: 10.1038/nmeth.1214. [DOI] [PubMed] [Google Scholar]
- Schneider G, Anderson E, Vogt S, Knochel C, Weiss D, Legros M, Larabell C. Computed tomography of cryogenic cells. Surf Rev Lett. 2002;9:177–183. [Google Scholar]
- Schneider P, Stauber M, Voide R, Stampanoni M, Donahue LR, Muller R. Ultrastructural properties in cortical bone vary greatly in two inbred strains of mice as assessed by synchrotron light based micro- and nano-CT. J Bone Miner Res. 2007;22:1557–1570. doi: 10.1359/jbmr.070703. [DOI] [PubMed] [Google Scholar]
- Schweizer S, Hattendorf B, Schneider P, Aeschlimann B, Gauckler L, Muller R, Gunther D. Preparation and characterization of calibration standards for bone density determination by micro-computed tomography. Analyst. 2007;137:1040–1045. doi: 10.1039/b703220j. [DOI] [PubMed] [Google Scholar]
- Shen Y, Zhang ZM, Jiang S-D, Jiang L-S, Dai L-Y. Postmenopausal women with osteoarthritis and osteoporosis show different ultrastructural characteristics of trabecular bone of the femoral head. BMC Musculoskelet Dis. 2009;10:35. doi: 10.1186/1471-2474-10-35. [DOI] [PMC free article] [PubMed] [Google Scholar]
- Suvorova EI, Petrenko PP, Buffat PA. Scanning and transmission electron microscopy for evaluation of order/disorder in bone structure. Scanning. 2007;29:162–170. doi: 10.1002/sca.20058. [DOI] [PubMed] [Google Scholar]
- Tatsumi S, Ishii K, Amizuka N, Li M, Kobayashi T, Kohno K, Ito M, Takeshita S, Ikeda K. Targeted ablation of osteocytes induces osteoporosis with defective mechanotransduction. Cell Metab. 2007;5:464–475. doi: 10.1016/j.cmet.2007.05.001. [DOI] [PubMed] [Google Scholar]
- Tkachuk A, Duewer F, Cui H, Feser M, Wang S, Yun W. X-ray computed tomography in Zernike phase contrast mode at 8 keV with 50-nm resolution using Cu rotating anode X-ray source. Z Kristallogr. 2007;222:650–655. [Google Scholar]
- Tong W, Glimche MJ, Kat JL, Kuhn L, Eppell SJ. Size and shape of mineralites in young bovine bone measured by atomic force microscopy. Calcif Tissue Int. 2003;72:592–598. doi: 10.1007/s00223-002-1077-7. [DOI] [PubMed] [Google Scholar]
- Vavouraki AI, Putnis CV, Putni A, Koutsoukos PG. An atomic force microscopy study of the growth of calcite in the presence of sodium sulfate. Chem Geol. 2008;253:243–251. [Google Scholar]
- Wang LY, Wang YL, Han YF, Henderson SC, Majeska RJ, Weinbaum S, Schaffler MB. In situ measurement of solute transport in the bone lacunar-canalicular system. Proc Nat Acad Sci. 2005;102:11911–11916. doi: 10.1073/pnas.0505193102. [DOI] [PMC free article] [PubMed] [Google Scholar]
- Weiner S, Traub W. Bone structure: From angstroms to microns. FASEB. 1992;6:879–885. [PubMed] [Google Scholar]
- Wenk H-R, Heidelbach F. Crystal alignment of carbonated apatite in bone and calcified tendon: Results from quantitative texture analysis. Bone. 1999;24:361–369. doi: 10.1016/s8756-3282(98)00192-6. [DOI] [PubMed] [Google Scholar]
- Zhu P, Xu J, Morris M, Ramamoorthy A, Sahar N, Kohn D. Quantum dots as mineral- and matrix-specific strain gages for bone biomechanical studies. Proc. SPIE. 2009;7166 71660F-1-71660F-7. [Google Scholar]
Associated Data
This section collects any data citations, data availability statements, or supplementary materials included in this article.
Supplementary Materials
Reconstructed tomography dataset from mouse bone trabecula shows the canalicular network including processes extending from the lacuna. Supplementary Movie 1 is available online at journals.cambridge.org/jid_MAM.


