Abstract
We introduce the use of nanostructured surfaces for lensfree on-chip microscopy. In this incoherent on-chip imaging modality, the object of interest is directly positioned onto a nanostructured thin metallic film, where the emitted light from the object plane, after being modulated by the nanostructures, diffracts over a short distance to be sampled by a detector-array without the use of any lenses. The detected far-field diffraction pattern then permits rapid reconstruction of the object distribution on the chip at the subpixel level using a compressive sampling algorithm. This imaging modality based on nanostructured substrates could especially be useful to create lensfree fluorescent microscopes on a compact chip.
Lensfree imaging has been recently gaining more emphasis to create modalities that can potentially eliminate bulky optical components to perform microscopy on a chip.1, 2, 3, 4, 5, 6, 7, 8 Such on-chip microscope designs would especially benefit microfluidic systems to create powerful capabilities especially for medical diagnostics and cytometry applications. Being light-weight and compact, lensfree imaging can also potentially create an important alternative to conventional lens-based microscopy especially for telemedicine applications.
For lensfree on-chip imaging, a major avenue that is quite rich to explore is digital holography.1, 2, 3, 4, 6, 7 Recent results confirmed the promising potential of lensfree in-line holography especially for high-throughput cytometry applications.6 Quite recently, lensfree on-chip imaging has also been extended to fluorescence microscopy to achieve an ultrawide imaging field-of-view (FOV) of >8 cm2 without the use of any lenses or mechanical scanning.8 Despite its limited resolution, such a wide-field fluorescent on-chip imaging modality, when combined with in-line digital holography could especially be significant for high-throughput diagnostic applications using large area microfluidic devices.
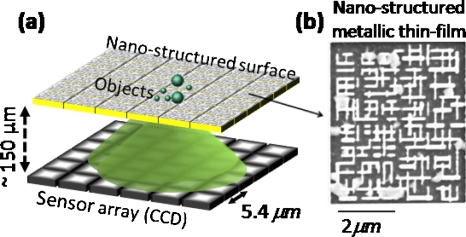
To provide another dimension to lensfree imaging, here we demonstrate the proof-of-concept of an incoherent on-chip microscopy platform that uses nanostructured surfaces together with a compressive sampling algorithm9, 10, 11 to perform digital microscopy of samples without the use of any lenses, mechanical scanning or other bulky optical∕mechanical components. In this lensfree imaging modality (see Fig. 1), the emitted incoherent light from the sample plane is spatially modulated by a nanostructured surface (e.g., a thin metallic film that is patterned) which is placed right underneath the sample plane. This modulated light pattern then diffracts over a distance of Δz∼0.1–0.2 mm to be sampled by an optoelectronic sensor array such as a charge coupled device (CCD) or a CMOS chip. The main function of the nanostructured surface is to encode the spatial resolution information into far-field diffraction patterns that are recorded in a lensfree configuration as shown in Fig. 1. This spatial encoding process is calibrated after the fabrication of the nanostructured surface, by scanning a tightly focused beam on the surface of the chip. For each position of the calibration spot on the patterned chip, the diffraction pattern in the far-field is measured as shown in Figs. 12. For spatially incoherent imaging (e.g., for fluorescent objects on the chip) these calibration frames provide a basis which permits spatial expansion of any object distribution as a linear combination of these calibration images. Fortunately, calibration of a given structured chip has to be done only once, and any arbitrary incoherent object can be imaged thereafter using the same set of calibration images. Through a compressive sampling algorithm that is based on l1-regularized least square optimization,9 we decode this embedded spatial resolution information and demonstrate decomposition of a lensfree diffraction pattern into microscopic image of an incoherent object located on the chip.
Figure 1.
(a) Schematic of lensfree on-chip imaging using a nanostructured surface is illustrated. (b) SEM image of a structured chip is shown.
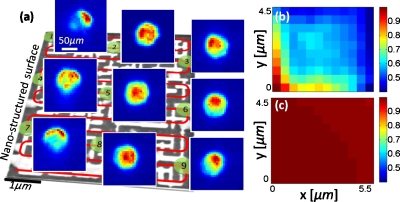
Figure 2.
(a) Calibration process of a nanostructured transmission surface is outlined. Several far-field calibration images of the patterned chip shown in Fig. 1b are also provided. (b) Cross-correlation coefficients of the first calibration frame against all the other calibration images of the same chip are illustrated. (c) Same as part (b), except this time it is measured for a bare glass substrate without the nanopattern. Significantly higher cross-correlation observed in (c) for closely spaced points is the reason for limited spatial resolution of conventional lensfree incoherent imaging without the nanopattern. Nanostructured surfaces break this correlation as shown in (b) to achieve a significantly better resolution.
To present a more detailed description of our system, let us assume that a metallic thin-film, deposited on e.g., a glass substrate, is structured at the nanoscale (see Fig. 1). Let us also assume that the transmission of this structured thin-film slab is denoted with t(ra,rb,λ), where λ refers to wavelength of light; and ra and rb refer to the x-y coordinates at the top and bottom surfaces of the structured thin-film, respectively. Accordingly, for a point source (i.e., the calibration spot) located at r=ra, the detected signal at the mth pixel of the sensor-array can be written as the following:
| (1) |
where h(r′,λ,Δz) denotes the coherent point-spread function of free-space diffraction over a distance of Δz (which refers to the distance between the detector surface and the bottom plane of the structured slab); A represents the effective area of pixel #m; S(λ) is the power spectrum of the calibration point source; q(λ) is a spectral function that includes other sources of wavelength dependency in the detection process such as the quantum efficiency of the detector-array; and ⊗ denotes the two-dimensional (2D) spatial convolution operation. Essentially Eq. 1 describes the formation of the calibration images (see Fig. 2), where a complex field, t(ra,rb,λ), generated by a point source at r=ra propagates coherently over a distance of Δz to be sampled by the detector array.
For an arbitrary 2D incoherent object distribution on the structured substrate, we can in general write the object function as o(ra,λ)=S′(λ)∑ncnδ(ra−rn), where cn values represent the object emission strength at ra=rn, and S′(λ) is the object power spectrum. Following a similar derivation as in Eq. 1, one can show that the detected object signal at the mth pixel of the sensor-array can be written as the following:
| (2) |
For the derivation of Eq. 2 we have assumed S′(λ)=S(λ), which is straight-forward to achieve by appropriately controlling the calibration process.
The above equations indicate that for an arbitrary incoherent object distribution on the structured chip, each pixel value at the detector-array (Om) is actually a linear super-position of the calibration values of the same pixel (#m) acquired for N different point source positions, each of which corresponds to an object location on the chip. Simultaneous solution of this linear set of equations for M different pixels should enable the recovery of cn, which is equivalent to imaging of the 2D intensity distribution of the incoherent object on the chip. If M>N there are more equations than the number of unknowns, and it becomes an over-sampled imaging system. However, if N>M, then it becomes an under-sampled imaging system. In this work, we examined the imaging performance of our lensfree system for both under-sampled and over-sampled conditions, within the context of compressive sampling theory,10, 11 which will be further discussed in the experimental results.
It is important to note that Eq. 2 also holds for a nonstructured transparent substrate. However, such a bare substrate, without the nanopatterning on it, would be of “limited use” in lensfree incoherent imaging. For a bare substrate, the calibration images at the detector, Im(rn), become highly correlated, especially for closely spaced rn. This unfortunately makes the solution of Eq. 2 for spatially close cn values almost impossible, limiting the spatial resolution that can be achieved. Therefore, the function of the nanostructured substrate in our technique is that it breaks this correlation among Im(rn) for even closely spaced rn values through creation of unique t(rn,rb,λ) functions at the nanoscale. As a result of this, numerical solution of Eq. 2 now becomes feasible to improve the resolution of the lensless system, which will now be limited by the calibration spot size or the grid size in rn.
To experimentally validate the above predictions, we used a structured metallic thin-film slab, composed of an array of nanoislands (see Fig. 1). These nanostructures were fabricated using focused ion-beam milling (FIB-NOVA 600) on borosilicate cover slips (150 μm thick) that were previously coated with 200 nm gold using electron beam metal deposition (CHA Mark 40). The design of the nanostructures was made using finite-difference time-domain (FDTD) simulations (Fullwave from RSOFT) with the aim of reducing the spatial correlation among Im(rn) for closely spaced points on the chip. For this end, at each design step of the chip, 2D spatial cross-correlation between Im(rn1) and Im(rn2) was calculated for all n1 and n2 combinations on the chip surface. Visualization of such correlation maps enables to spot potentially problematic parts of the chip, which were accordingly modified until the cross-correlation between all Im(rn1) and Im(rn2) combinations was significantly reduced. Figure 2b illustrates the experimental 2D correlation map of our final chip design, which plots the cross-correlation coefficients between Im(r1) and Im(rn) for n=1:N, where N=10×12=120. For comparison purposes, Fig. 2c also shows the same cross-correlation map this time for a bare glass substrate without the nanopattern, demonstrating the strong correlation among Im(rn), which limits the achievable resolution in conventional lensfree incoherent imaging. This limited resolution, however, can be significantly improved by breaking the correlation among Im(rn) [see Fig. 2b] through the use of nanostructured surfaces as will be demonstrated in Figs. 34.
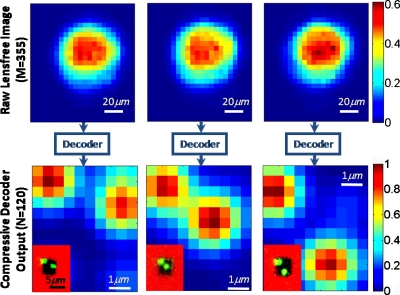
Figure 3.
Experimental proof-of-concept of lensfree on-chip imaging using the nano-structured surface of Fig. 1b is demonstrated. Top row shows the lensfree diffraction images of the objects sampled at the CCD for three different incoherent objects. Each diffraction image contains M=355 pixels. Bottom row shows the compressive decoding results of these raw diffraction images to resolve subpixel objects on the chip. For comparison, the inset images in the bottom row show regular reflection microscope images of the objects, which very well agree with the reconstruction results. Note that the red colored regions of the inset images refer to the gold coated area with no transmission, and therefore the reconstructions only focus to the dark regions of the chip (at the center of the inset images) that are nanopatterned.
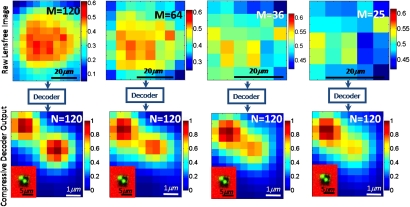
Figure 4.
Same as the middle column of Fig. 3, except for different M values. This figure indicates that compressive decoding of a sparse object can be achieved from its diffraction pattern at the far-field even for an under-sampled imaging condition where N>M.
To calibrate the nanostructured chip of Fig. 1b, we measured Im(rn) using a fiber-coupled light emitting diode (at 530 nm with a bandwidth of ∼30 nm) focused to a spot size of <2 μm (FWHM) on the top surface of the chip. In these calibration experiments, the detector-array (Kodak, KAF 8300, Pixel Size: 5.4 μm) was scanned using a piezostage controlled by a LABVIEW code. Using a step size of ∼0.5 μm in both x and y directions, we acquired a total of N=120 calibration frames over 6×5 μm2 area of the structured surface. Figure 2 illustrates a diagram of this scanning procedure and presents samples of lensfree calibration images acquired at the CCD. These calibration frames are then digitally stored for use in image decoding process. To demonstrate the proof-of-concept and the resolving power of this lensfree imaging modality, we illuminated the calibrated nanostructured chip with two closely spaced incoherent spots as shown in Fig. 3. In these experiments, the center-to-center distance of the object spots was varied between ∼2 and 4 μm, which were all subpixel since the pixel size at the CCD was already 5.4 μm. As illustrated in Fig. 3, the diffraction images of these subpixel objects (after a propagation distance of Δz=150 μm corresponding to a Fresnel number of <1) showed a single large spot at the CCD. To the bare eye, such a lensfree diffraction image in the far-field obviously does not contain any useful information to predict the subpixel object distribution. However, the nanostructuring on the chip surface enabled imaging of the objects at the subpixel level using a compressive sampling algorithm.9 This decoding algorithm is based on truncated Newton interior-point method and it provides a sparse solution for Eq. 2 using a non-negativity constraint, which in general is satisfied for incoherent imaging. The 2D sparse output of the decoder is then convolved with the calibration spot to create the image of the object. As an example, using M=355 pixels of the CCD image, we reconstructed N=120 coefficients on the structured chip, resolving subpixel objects as demonstrated in Fig. 3. Our decoding results match quite well to regular reflection microscope images of the objects as shown in the inset images of Fig. 3. The computation times of these decoded images were all between 0.8 and 1.2 s using a dual-core processor (AMD Opteron 8218) at 2.6 GHz.
In the image reconstruction∕decoding process shown in Fig. 3, since M>N the solution of Eq. 2 was an over-sampled problem. Surely there is no “compression” here. However, the strength of our approach is that we can actually achieve almost the same recovery performance using an under-sampled imaging condition, where N>M. To validate this, in Fig. 4 we used many fewer pixels of the diffraction images at the CCD to reconstruct the same N=120 pixels at the object plane. As evident in the decoding results of Fig. 4, we can still resolve a subpixel sparse object even for M<N. For example, when compared to M=355 case of Fig. 3, the decoding results of M=36 case utilize N=120 calibration images each with M=36 pixels, and a single diffraction image of the object with again M=36 pixels, saving a total of 121×(355−36)=38599 pixels from the computation load, as a result of which the decoding time of these images is reduced by approximately tenfold achieving ∼0.1 sec.
After this proof-of-concept demonstration, as for the next steps we envision extending our FOV by tiling several of these nanopatterns on the same chip to cover a much larger imaging area. Further, the presented nanostructured chip may also be used to increase the resolution of regular lens-based microscopes or recently emerging relevant imaging modalities,12 especially by extending the space-bandwidth product of conventional microscopes through calibrated nanopatterns.
Acknowledgments
The authors acknowledge the support of AFOSR (under Project No. 08NE255), NSF BISH program (under Award No. 0754880), and NIH (under Grant No. 1R21EB009222-01).
References
- Haddad W., Cullen D., Solem H., Longworth J., McPherson A., Boyer K., and Rhodes C., Appl. Opt. 31, 4973 (1992). 10.1364/AO.31.004973 [DOI] [PubMed] [Google Scholar]
- Xu W., Jericho M., Meinertzhagen I., and Kreuzer H., Proc. Natl. Acad. Sci. U.S.A. 98, 11301 (2001). 10.1073/pnas.191361398 [DOI] [PMC free article] [PubMed] [Google Scholar]
- Pedrini G. and Tiziani H., Appl. Opt. 41, 4489 (2002). 10.1364/AO.41.004489 [DOI] [PubMed] [Google Scholar]
- Repetto L., Piano E., and Pontiggia C., Opt. Lett. 29, 1132 (2004). 10.1364/OL.29.001132 [DOI] [PubMed] [Google Scholar]
- Cui X., Lee L. M., Heng X., Zhong W., Sternberg P. W., Psaltis D., and Yang C., Proc. Natl. Acad. Sci. U.S.A. 105, 10670 (2008). 10.1073/pnas.0804612105 [DOI] [PMC free article] [PubMed] [Google Scholar]
- Seo S., Su T. W., Tseng D. K., Erlinger A., and Ozcan A., Lab Chip 9, 777 (2009). 10.1039/b813943a [DOI] [PMC free article] [PubMed] [Google Scholar]
- Oh C., Isikman S. O., Khademhosseinieh B., and Ozcan A., Opt. Express 18, 4717 (2010). 10.1364/OE.18.004717 [DOI] [PMC free article] [PubMed] [Google Scholar]
- Coskun A. F., Su T., and Ozcan A., Lab Chip 10, 824 (2010). 10.1039/b926561a [DOI] [PMC free article] [PubMed] [Google Scholar]
- Kim S. -J., Koh K., Lustig M., Boyd S., and Gorinevsky D., IEEE J. Sel. Top. Signal Process. 1, 606 (2007). 10.1109/JSTSP.2007.910971 [DOI] [Google Scholar]
- Candes E. J. and Tao T., IEEE Trans. Inf. Theory 52, 5406 (2006). 10.1109/TIT.2006.885507 [DOI] [Google Scholar]
- Donoho D. L., IEEE Trans. Inf. Theory 52, 1289 (2006). 10.1109/TIT.2006.871582 [DOI] [Google Scholar]
- Zeylikovich I., Tamargo M. C., and Alfano R. R., J. Phys. B 40, S373 (2007). 10.1088/0953-4075/40/11/S10 [DOI] [Google Scholar]


