Abstract
Dermally implanted luminescent sensors have been proposed for monitoring of tissue biochemistry, which has the potential to improve treatments for conditions such as diabetes and kidney failure. Effective in vivo monitoring via noninvasive transdermal measurement of emission from injected microparticles requires a matched optoelectronic system for excitation and collection of luminescence. We applied Monte Carlo modeling to predict the characteristics of output luminescence from microparticles in skin to facilitate hardware design. Three-dimensional, multiwavelength Monte Carlo simulations were used to determine the spatial and spectral distribution of the escaping luminescence for different implantation depths, excitation light source properties, particle characteristics, and particle packing density. Results indicate that the ratio of output emission to input excitation power ranged 10−3 to 10−6 for sensors at the upper and lower dermal boundaries, respectively, and 95% of the escaping emission photons induced by a 10-mm-diam excitation beam were confined within an 18-mm circle. Tightly packed sensor configurations yielded higher output intensity with fewer particles, even after luminophore concentration effects were removed. Most importantly, for the visible wavelengths studied, the ability to measure spectral changes in emission due to glucose changes was not significantly affected by absorption and scattering of tissue, which supports the potential to accurately track changes in luminescence of sensor implants that respond to the biochemistry of the skin.
Keywords: Monte Carlo, biosensors, luminescence, glucose sensing, microparticles, tissue optics
Introduction
The development of a noninvasive glucose sensor to facilitate patient monitoring of blood sugar levels is being pursued by hundreds of research groups worldwide. Various minimally invasive biosensors, particularly those based on fiber-optic probes, have shown great potential using the highly sensitive luminescence approach.1, 2, 3, 4, 5, 6, 7, 8 These devices generally employ a probe consisting of a luminescence chemical assay immobilized within a selectively permeable membrane at the tip of an optical fiber. However, these optodes are still invasive during measurements and have not been proven to meet the stability or reliability requirements for long-term in vivo functionality.9 Dermally implanted luminescence-based microparticle biosensors are attractive alternatives, as the detachment of sensing chemistry from the fiber tip enables completely noninvasive monitoring in vivo.10, 11, 12, 13, 14
We have previously reported several different luminescent chemo-optical transducer platforms that may meet the needs of such implantable biosensors; these include examples of glucose sensors based on self-assembled hybrid microparticles and microcapsules.15, 16, 17, 18, 19 One of these systems relies on the enzymatic oxidation of glucose catalyze by the glucose oxidase enzyme, which consumes oxygen as a cosubstrate, immobilized within the particles. Under the proper conditions, which the particles have been engineered to provide, the oxygen inside each particle is depleted in proportion to glucose concentration, a property that can be monitored optically using long-lifetime phosphors that are strongly quenched by oxygen. Thus far, reaction-diffusion modeling and in vitro results suggest that these sensor systems can achieve adequate sensitivity, reliability, and longevity for long-term monitoring in vivo.19, 20, 21, 22, 23
To deploy and interrogate luminescence-based dermally implanted sensors in vivo for on-demand monitoring, a number of key technical hurdles must be overcome. The particles must be engineered to be biocompatible and stable and to produce signals strong enough for transdermal measurements. Assuming that this can be accomplished, it is also necessary to design a matched optoelectronic system for efficient delivery of excitation, collection, and analysis of luminescence response. This latter task is the subject of this report.
To assess the sensor performance in an implantation environment and to optimize the sensor configurations, it is necessary to evaluate how various tissue, particle, and particle distribution characteristics affect the measurement performance. These aspects include the size and tissue concentration of microparticle sensors, particle implantation depth, and scattering and absorption of light by tissue. Intuitively, one would expect implantation depth to influence the measurability of luminescence, because optical signal attenuation is proportional to the path length of photon propagation. One might also anticipate that tissue scattering and absorption will result in distortion of spectral information from implants, due to the wavelength-dependent nature of tissue optical properties. The size of implants will affect the luminescent intensity, due to changing probability of excitation, whereas the particle concentration may result in different spectral distortions from tissue due to different spacing between particles. Last, for the design of an efficient system for collection of escaping luminescence, it is also critical to determine the spatial distribution of escaping luminescence.
Simulations can be of immense value in modeling this situation, allowing insight into the key parameters affecting escaping luminescence and guiding the design process. Monte Carlo modeling has been applied to simulate light propagation in tissues for nearly two decades.24 As a computational modeling tool, Monte Carlo can facilitate understanding of light distribution in tissues, as well as validation of analytical models of light transport.25 A large number of studies have employed Monte Carlo simulations to assess the effect of excitation and emission geometries, sample dimensions, and absorption and scattering coefficients of sample luminescence.26, 27, 28, 29, 30, 31, 32, 33, 34 Monte Carlo has also been employed to investigate the relationship between the luminescence originating from different layers within the tissue and the observed bulk-tissue luminescence spectrum.35, 36, 37, 38 In a previous study, we introduced the use of Monte Carlo to model the transport of light through human skin and interaction with a subcutaneous (e.g., implanted) luminescent sensing layer; in this work, a sensitivity study was performed to elucidate the effects of changing of optical properties and tissue and sensing layer characteristics on the escaping luminescence.9 While these previous studies have given insight into the key parameters affecting the observation of light produced by luminescent implants, two issues with these previous studies limit their broad applicability: (1) the restriction to flat (slab), uniform (homogeneous in x-y plane) geometries, and (2) a single pair of excitation and emission wavelengths. These studies fall short of describing real microparticle-based systems with broadband emission relevant for sensing, and the information obtained is therefore insufficient for the design of an optical system to be employed for in vivo measurement. Instead, the interaction between light and skin as well as implanted microparticle sensors is more accurately modeled with 3-D, multiwavelength Monte Carlo simulations. Reference 39 analyzed the consequences of assumption of a homogeneous model. The authors concluded that the homogeneous model tended to be attenuated more than the discrete absorber models, which intensified the necessity of using 3-D modeling. OptiCAD, a recently released commercial package allowing Monte Carlo ray tracing, has enabled this 3-D modeling work.
In this work, Monte Carlo ray tracing was applied to predict the characteristics of luminescence escaping from tissue containing implanted microparticle sensors. The properties of the implanted particles (depth, size, spacing, spectral features) and the light source diameter were varied to determine the effects of these parameters on emitted light. The relative output power, spectral information, and the spatial distribution of escaping luminescent emission were estimated and compared. The findings from these modeling studies support the potential of in vivo measurement using implanted microspheres and have facilitated the design of hardware that is now being implemented for in vivo experiments.
Materials and Methods
All simulations were performed using OptiCAD v10.033Q and v10.033T (OptiCAD Corp., Santa Fe, New Mexico), which performs statistical ray-tracing based on Monte Carlo. The program is able to simulate wavelength-dependent scattering, absorption, and luminescence with a maximum of six wavelengths each for excitation and emission spectra. The OptiCAD environment enables 3-D realistic simulation of light propagation in models of tissue with integrated microparticles.
Description of Simulation System
Description of skin models
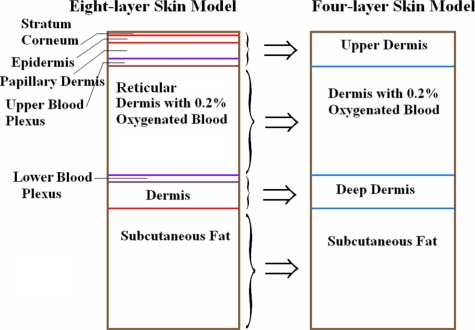
A four-layer skin model (Fig. 1) was generated from an eight-layer model used by Zeng et al.37 to mimic the anatomical structure and optical properties of skin. The eight-layer model was simplified into a four-layer model comprising one layer above the reticular dermis, a reticular dermis layer, a layer below the reticular dermis, and a subcutaneous fat layer. Our interest lies in the reticular dermis (270 μm to 1770 μm), where the microparticle sensors are intended to be introduced and retained in the tissue much like cosmetic dermal-filling agents or tattoos.40 We assumed that all of the skin layers above or below the reticular dermis were homogeneous. The four-layer model was designed as a disk of 4-mm height and 30-mm diameter; this radial (lateral) extent of each layer was sufficient to be considered infinitely large compared to the size of the excitation light source and sensor models. The wavelength-dependent absorption and scattering coefficients, scattering anisotropy, and refractive index were extracted from multiple sources based on a review of the literature on tissue optical properties.37, 41, 42 The optical parameters of the four-layer model were calculated as a weighted average by adding the products of the optical parameters of the eight-layer model and the corresponding volume factors according to their volume contributions to each layer of the four-layer model.37, 43 For example, the calculation for the optical parameters of deep dermis in the four-layer model can be expressed as in Eq. 1:
| (1) |
The calculated average optical properties for each layer in the four-layer skin model at the seven wavelengths of interest used in the simulation are given in Table 1.
Figure 1.
Eight-layer model and four-layer model. Stratum corneum (SC, 10 μm), epidermis (ED, 80 μm), papillary dermis (PD, 100 μm), reticular dermis (RD, 1500 μm), and dermis (160 μm) all have the same optical properties in the model. Upper blood plexus (UBP, 80 μm); lower blood plexus (LBP, 70 μm); subcutaneous fat (2 mm) had only refractive index (1.46) in these two models. SC+EP+PD+UBP=upper dermis (270 μm); RD=dermis (1500 μm); LBP+dermis=deep dermis (230 μm).
Table 1.
The optical properties for each layer of the four-layer skin model at each of the seven wavelengths used in simulation.
| Wavelength (nm) | n | μa (mm−1) | μs (mm−1) | g | |
|---|---|---|---|---|---|
| SC+EP+Derm+UBP | 540 | 1.40 | 2.53 | 47.30 | 0.77 |
| 570 | 1.40 | 2.41 | 45.76 | 0.77 | |
| 585 | 1.40 | 1.80 | 44.73 | 0.77 | |
| 620 | 1.40 | 1.35 | 42.70 | 0.77 | |
| 635 | 1.40 | 1.35 | 42.31 | 0.77 | |
| 645 | 1.40 | 1.36 | 42.02 | 0.77 | |
| 665 | 1.40 | 1.39 | 41.78 | 0.77 | |
| Wavelength (nm) | n | μa (mm−1) | μs (mm−1) | g | |
| Derm with 0.2% blood | 540 | 1.40 | 0.55 | 46.01 | 0.77 |
| 570 | 1.40 | 0.54 | 44.51 | 0.77 | |
| 585 | 1.40 | 0.48 | 43.01 | 0.77 | |
| 620 | 1.40 | 0.44 | 40.42 | 0.77 | |
| 635 | 1.40 | 0.43 | 40.27 | 0.77 | |
| 645 | 1.40 | 0.42 | 40.17 | 0.77 | |
| 665 | 1.40 | 0.41 | 40.02 | 0.77 | |
| Wavelength (nm) | n | μa (mm−1) | μs (mm−1) | g | |
| LBP+Derm | 540 | 1.38 | 9.12 | 47.10 | 0.83 |
| 570 | 1.38 | 8.57 | 46.01 | 0.83 | |
| 585 | 1.38 | 3.48 | 44.92 | 0.83 | |
| 620 | 1.38 | 0.42 | 43.03 | 0.83 | |
| 635 | 1.38 | 0.40 | 42.92 | 0.83 | |
| 645 | 1.38 | 0.39 | 42.85 | 0.83 | |
| 665 | 1.38 | 0.37 | 42.74 | 0.83 | |
| Subcutaneous fat | 540–665 | 1.46 | — | — | — |
Description of microsphere sensor models
The sensors were assumed to follow our previous work on microparticle sensor engineering, where the spheres contain platinum octaethylporphine (PtOEP) and rhodamine isothiocyanate (RITC) as indicator and reference dyes, respectively.19, 22 Briefly, glucose oxidase and PtOEP were immobilized inside of porous microparticles, which were then coated with diffusion-limited nanofilms tagged with RITC. Using a green LED for excitation and a fiber-optic spectrometer with a bifurcated fiber bundle, the emission of microparticles attached to a microscope slide within a flow-through channel was measured during exposure to phosphate buffers containing different glucose concentrations (flow rate: 4 mL∕min; oxygen concentration: 277 μM). Spectra collected at 0, 50, 100, 150, and 250 mg∕dL were recorded for use in this theoretical study.
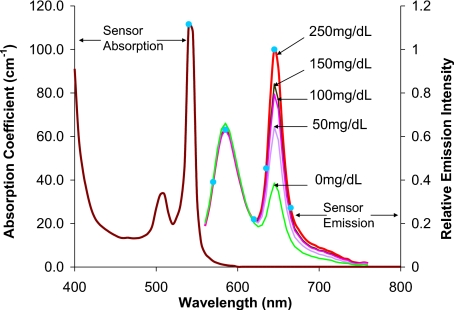
The luminescence properties of the microsphere sensors are shown in Fig. 2. The absorption coefficient (11.16 mm−1) was calculated from the molar extinction coefficient of PtOEP at 540 nm, assuming a uniform concentration of 10 nM inside the particles (determined experimentally), while scattering internal to the spheres was neglected.20 A refractive index of 1.5 was assumed for the particles, based on their silicate nature. As the size of the particles is an experimentally controllable variable that affects sensor response as well as host response, this parameter was also varied in the simulations to reveal the effects of particle size on emission properties.
Figure 2.
Excitation and emission spectra of sensor particles, as well as spectral properties of a model light source (green filter). For the absorption spectrum shown, [PtOEP] is 10 nM. Blue circles and numbers indicate the wavelengths selected for the simulation. (Color online only.)
In this study, the implanted sensors are modeled as “patches” comprising uniform microspheres positioned within the “dermis” of the four-layer model; the microspheres were assumed to be hexagonally packed into a cylindrical slab. Since the particles can be engineered to have different size, and the in vivo packing density can be varied to a degree by controlling the injection concentration, the diameters of microspheres and center-to-center spacing for adjacent spheres (Table 2) were varied from 20 μm to 100 μm to observe the influence of these parameters on escaping emission signal. We note that, in reality, one has very little control over the final particle distribution in tissue; however, our studies were aimed at identifying the potential negative consequences of uneven or inconsistent distribution on collection of emission.
Table 2.
Geometric parameters of the six microsphere sensor models used in simulations. The sensor names in the simulations are D100S100, D60S100, D20S100, D60S60, D20S60, and D20S20, where the values following the D and S correspond to the diameter and the center-to-center spacing between two adjacent spheres for each case given below, respectively.
| D (μm) | S (μm) | Packing efficiency |
|---|---|---|
| 100 | 100 | 74.05% |
| 60 | 100 | 15.99% |
| 20 | 100 | 0.59% |
| 60 | 60 | 74.05% |
| 20 | 60 | 2.74% |
| 20 | 20 | 74.05% |
Description of Monte Carlo 3-D modeling system
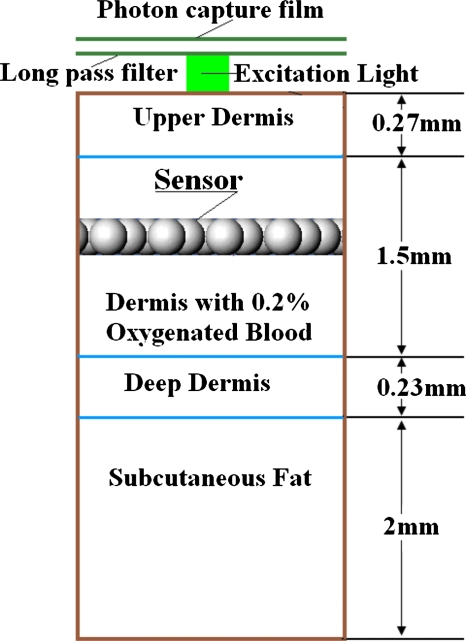
An example of the entire total simulation system is illustrated in Fig. 3, including the geometric layout and the excitation source at normal incidence relative to the skin surface. The CAD models the sensor spheres embedded within the skin model; thus, the optical properties of the tissue surrounding and between the spheres were the same as those of the skin model. Each sphere was modeled as an independent object embedded in the skin model, and the set of spheres was arranged into a cylindrical array with different packing efficiency.
Figure 3.
Scheme of simulation system, indicating relative position of excitation light source, implanted luminescent sensing microparticles, and photon capture film. The long-pass filter below the photon capture film is to block scattered excitation light. The distance between the photon capture film and the surface of skin model is 10 μm, and that between the long-pass filter and the surface of skin model is 9.8 μm. Although not shown here, the lateral extent of the skin model and the photon capture film (30 mm) was much larger than the sensor patch size in all cases (1.2 to 6 mm).
To simulate luminescence emission escaping from the surface of the skin, one excitation wavelength (540 nm) and six discrete emission wavelengths (570, 585, 620, 635, 645, and 665 nm) were selected from the excitation and emission spectra of sensors to capture the key features (Fig. 3). In the simulations, excitation light undergoes absorption and scattering while traveling through the superficial tissue before striking a sphere. Once the excitation photons enter a sphere, luminescence occurs with isotropic directionality. The luminescence inside a sphere is generated along each excitation ray according to a randomized distance, sampled from a uniform distribution with an average step size between luminescence events that was specified as the radius of the sphere. The total luminescent illumination at each step for each excitation and each emission wavelength is calculated using Eq. 2:
| (2) |
where E0 is the excitation energy at the previous step, exn is the excitation factor that is the quantum yield at excitation wavelength n; emm is the emission factor for emission wavelength m that is normalized from emission spectrum; μan is the absorption coefficient of the sphere for excitation wavelength n; and path is the random step size inside the sphere. The optical properties of skin models and sensor models at each of the emission wavelengths (570 nm, 585 nm, 620 nm, 635 nm, 645 nm, and 665 nm) were specified (Table 1) to track the emitted luminescent photons.
The luminescent light emitted by a sphere, once it escapes the sphere, will undergo further absorption and scattering in the skin model. When rays are incident upon an interface between tissue and surface of another sphere, reflection occurs. Since the absorption coefficient of spheres is high, the luminescence emission from a sphere tends to emit more from the surface than that from the inner space. Moreover, since the excitation light comes from the top of the skin model, the emission tends to be more from the sphere surfaces closest to the skin surface. The luminescent emission rays propagating through the skin model and finally escaping from the surface of the skin model were collected by a photon capture film detector, which recorded the energy and location information of every escaping ray hitting the film. Below the photon capture film, an ideal long-pass filter was attached to remove all excitation light from the captured rays. The collimated excitation light source was perpendicular to the surface of the skin model and was placed directly below the long-pass filter. The photon capture film and the long-pass filter were placed above the surface of the skin model. The distance between the photon capture film and the surface of the skin model was small enough to ensure that the film would capture all the escaping rays. Thus, the photon distribution on the film is an accurate representation of the predicted escaping photon distribution on the surface of the skin model.
Although our microsphere models were not really homogeneous, they were uniformly packed; moreover, the diffusion area of the unit excitation light in the dermis layer was much larger than the cross-sectional area of a unit sphere. Therefore, the output from a narrow incident beam was considered as the impulse response, and convolution was performed to obtain the output response from larger light sources. This approach was validated by comparison of the convolution results and the direct simulation results. The output intensity–spatial distribution of convolution (unit light=10,000 rays) results and simulation (12,738 rays∕mm2) results have no significant difference (p-value=0.9094, paired t-test). In OptiCAD, the light source size could not be defined as a pencil beam with infinitely small size, so we used 2-D convolution rather than 1-D convolution. The unit light source was defined as a 100 μm×100 μm square, and then the corresponding simulation output was convolved with a larger light source profile. For this work, the light source was considered to be a flat circular incident beam (top-hat) centered at the origin. It contained 10,000 to 4 million rays with varying light source sizes to achieve acceptable variances.
Simulation Methods
Assessment of excitation fluence
In some simulations, we assumed that the skin model and the sensor model are infinitely large compared to the unit light source (100 μm×100 μm square). To justify this, as well as to determine a reasonable dimension for each 3-D model, the depth-dependent spatial distribution of excitation fluence in the skin model was investigated. The problem was broken into two parts: (1) determining the irradiance distribution of a unit excitation light for different depths in tissue; and (2) determining the circular areas that confine different fractions of unit excitation radiant power at different depths in skin model. To extract this information, the skin model was broken up into a series of sections with increasing thickness, and a photon capture film was positioned at the bottom of every skin model section to capture all the exiting excitation light after undergoing absorption and scattering. (The backscattering light reaching each depth from the deeper depth was ignored in these models.) In this situation, the refractive index of the skin model and that of ambient were matched to eliminate the total internal reflection. Thirty simulations were performed in triplicate for each of 30 different depths in the skin model, starting at 30 μm (close to the upper boundary of upper dermis) and moving to 2 mm (close to the lower boundary of deep dermis). In each simulation run, 90,000 rays were used.
Effects of varying implantation depths
To implement in vivo measurement, it is possible that the implantation depth will be difficult to control with high precision; it is likely that particles will be distributed over different depths in the tissue. Thus, an assessment of measurability versus implantation depth is essential to understand the potential quantitative impact of this practical issue on emission. For these simulations, a single layer of tight-packed sensors 100 μm in diameter with 100 μm center-to-center spacing (D100S100) was used. According to the assessment of spatial distribution of excitation fluence in the skin model, the sensor patch was set to be 6 mm in diameter (3260 spheres) to ensure that the sensor patch size is much larger than that of the unit input light source (100μm×100 μm square). This was verified, as described in Sec. 3A. The absorption coefficient at 540 nm of microparticle sensors was kept at 11.16 mm−1, assuming a uniform concentration of PtOEP (10 nM). The depth of the sensor patch was varied from 400 to 1700 μm, values representative of typical values for the upper and lower boundaries of the dermis layer. Fourteen simulations were performed for each of 14 depths over this range, and each simulation was repeated three times.
Spatial distribution of escaping luminescence
To design a highly efficient matched optical system for excitation delivery and emission collection, it is necessary to investigate the spatial distribution of the output signal. Using the simulation results for depth-dependent simulations with the 100 μm×100 μm unit light source in the previous section, 2-D convolutions were performed to estimate responses to a large flat circular light source with the diameter ranging from 1 mm to 10 mm. Convolution was performed with MATLAB.
Investigation of absolute luminescence response versus different sensor models
To maximize the luminescence output and minimize the number of microparticles and amount of dye for in vivo implantation, it is critical to assess the luminescent output for different sensor configurations and dye distributions. This task can be broken into three steps:
-
1.
Investigating the impact of changes in sphere packing efficiency.
-
2.
Assessing the impact on output due to the changes of dye concentration per sphere and effective dye concentration, given the same total quantity of dye.
-
3.
Assessing the effects of having more particles in a stacked (layered) structure.
The simulation details are summarized in Table 3.
Table 3.
Overview of simulations used to investigate sensor size∕spacing∕layer∕effects.
| Step 1 | Step 2 | Step 3 | ||||||||||
|---|---|---|---|---|---|---|---|---|---|---|---|---|
| Sensor model | D20S100 | D20S60 | D20S20 | D100S100 | D60S100 | D20S100 | D60S60 | D20S60 | D20S20 | D100S100 | D60S100 | D20S100 |
| Sphere diameter (D) (μm) | 20 | 20 | 20 | 100 | 60 | 20 | 60 | 20 | 20 | 100 | 60 | 20 |
| Sphere packing efficiency | 0.59% | 2.74% | 74.05% | 74.05% | 15.99% | 0.59% | 74.05% | 2.74% | 74.05% | 74.05% | 15.99% | 0.59% |
| Center-to-center spacing (S) (μm) | 100 | 60 | 20 | 100 | 100 | 100 | 60 | 60 | 20 | 100 | 100 | 100 |
| Number of spheres∕layer | 151 | 367 | 3259 | 151 | 151 | 151 | 367 | 367 | 3259 | 1459 | 1459 | 1459 |
| Light source | 2.4-mm diameter circular | 2.4-mm diameter circular | 100 μm×100 μm square | |||||||||
| Irradiance: 1 mW∕mm2 | Irradiance: 1 mW∕mm2 | Irradiance: 1 mW∕mm2 | ||||||||||
| Sensor model diameter (mm) | 1.2 | 1.2 | 4 | |||||||||
| Number of sensor model layers | 1 | 1 | 1 | |||||||||
| 2 | ||||||||||||
| 3 | ||||||||||||
| Absorption coefficient@540 nm (mm−1) | 11.16 | 11.16 | 11.16 | 1.93 | 8.92 | 240.86 | 3.67 | 99.10 | 11.16 | 11.16 | 51.67 | 1395.00 |
| Dye concentration per sphere (nM) | 10.00 | 10.00 | 10.00 | 1.73 | 7.99 | 215.83 | 3.29 | 88.80 | 10.00 | 10.00 | 46.30 | 1250.00 |
| Effective dye concentration (nM) | 0.06 | 0.27 | 7.40 | 1.28 | 1.28 | 1.28 | 2.44 | 2.44 | 7.40 | 7.40 | 7.40 | 7.40 |
| Total amount of dye (mol) | 6.33E−18 | 1.54E−17 | 1.37E−16 | 1.37E−16 | 1.37E−16 | 1.37E−16 | 1.37E−16 | 1.37E−16 | 1.37E−16 | 7.64E−15 | 7.64E−15 | 7.64E−15 |
| 1.53E−14 | 1.53E−14 | 1.53E−14 | ||||||||||
| 2.29E−14 | 2.29E−14 | 2.29E−14 | ||||||||||
| Number of rays | 4.0E+06 | 2.1E+0.6 | 2.3E+05 | 2.3E+05 | 6.4E+05 | 4.0E+06 | 2.3E+05 | 2.1E+06 | 2.3E+05 | 1.0E+04 | 1.0E+04 | 1.6E+05 |
| Repetitions | 3 | 3 | 3 | |||||||||
Note: All of the sensor models in this series of simulations were located at the same depth (700 μm).
For step 1, the impact of sphere packing efficiency was investigated by varying center-to-center spacing with a constant sphere size. Simulations were completed for three different one-layer sensor models with a sphere size of 20-μm diameter, where center-to-center spacing was varied from 20 μm to 100 μm (D20S100, D20S60, and D20S20). In these simulations, the absorption coefficient of microparticle sensor models was fixed at 11.16 mm−1; thus, the effective dye concentration [the product of dye concentration per sphere and sphere packing efficiency (Table 2)] decreased with decreasing sphere packing efficiency (increasing spacing). The maximum diameter of the sensor patches was 1.2 mm, and the light source was a 2.4-mm-diam uniform flat circular incident beam, ensuring that all the sensor particles could be excited by excitation light.
For step 2, the impact of dye concentration was assessed with all six sensor models (D100S100, D60S100, D20S100, D60S60, D20S60, and D20S20). The size of sensor patch models and the light source size were the same as those used in step 1. The absorption coefficients of microparticle sensor models were scaled according to the volume of each sphere and particle numbers so as to make the product of the absorption coefficients, the volume per sphere, and the particle number constant. Thus, each sensor model had the same quantity of dye, and the sensor models with the same center-to-center spacing have the same effective dye concentration.
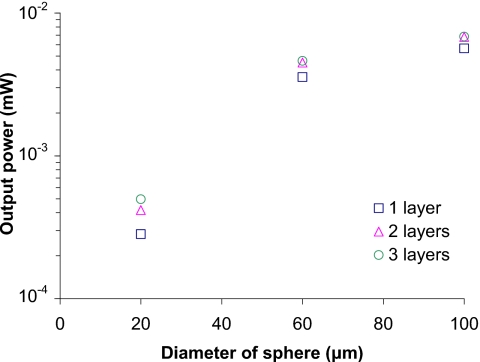
For step 3, the effects of having more particles in a stacked (layered) structure were assessed with three different multilayer sensor models (D100S100, D60S100, and D20S100). In these simulations, all of the sensor patch models were 4 mm in diameter, and a unit input light source (100 μm×100 μm square) was used. The number of stacked layers of sensors was varied from one to three, and the absorption coefficients of microparticle sensor models were again scaled according to the volume per sphere. Thus, the product of absorption coefficients and sphere volume was constant, and the effective dye concentration in the tissue was constant for different sensor models.
Simulation for sensor performance after implantation
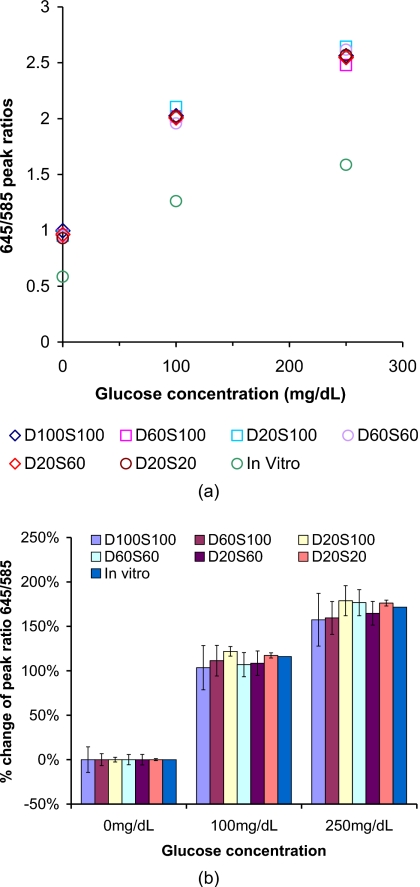
To investigate the potential to accurately measure changes in sensor implant spectral properties, we investigated the impact of the absorption and scattering of tissue, as well as the microparticle size distribution and concentration for different sensor models with different environmental glucose concentrations. Unless otherwise specified, the absorption coefficient was kept at 11.16 mm−1 (at 540 nm) for all models. We used emission spectra recorded from in vitro analysis of sensors at environmental glucose concentrations of 0, 100, and 250 mg∕mL. Simulations were performed as before, with the six output wavelengths now weighted by the relative emission for different glucose concentrations. The ratio of emission power of 645 nm to that of 585 nm was calculated from the output spectrum of each sensor emission spectrum corresponding to each glucose concentration using Eq. 3:
| (3) |
where I645 and I585 are the simulated emission intensity at 645 nm and 585 nm.
The percent change in 645 nm∕585 nm emission peak ratios versus glucose concentration was calculated using Eq. 4:
| (4) |
When glucose concentration was 0 mg∕mL, the 645 nm∕585 nm emission peak ratio was defined as the baseline value.
The percent changes of peak ratios were plotted as a sensor response curve. Response curves for six different sensor models were compared. The diameter of the spheres was set to 100, 60, and 20 μm, and the center-to-center spacing was set to 100, 60, and 20 μm. The packing configuration of the sensor patch model was maintained at hexagonal packing, and the total number of spheres was constant, as this would best represent the situation of injecting a fixed number of particles with different final distributions. All the sensor models used in this phase were one-layer versions, fixed at an implantation depth of 700 μm. The light source was the 100 μm×100 μm square. The simulation details are given in Table 4.
Table 4.
Models used in assessing effects of sensor configuration on tracking changes in emission.
| Sensor model name | Sphere diameter (D) (μm) | Spacing (S) (μm) | Sphere number per layer | Sensor model diameter (mm) | Number of sensor layers | Absorption coefficient @540 nm (mm−1) | Light source | Number of rays | Repetitions |
|---|---|---|---|---|---|---|---|---|---|
| D100S100 | 100 | 100 | 1459 | 4 | 1 | 11.16 | 100 μm×100 μm square | 1.0E+04 | 5 |
| D60S100 | 60 | 100 | 1459 | 4 | 1.0E+04 | 5 | |||
| D20S100 | 20 | 100 | 1459 | 4 | 1.6E+05 | 5 | |||
| D60S60 | 60 | 60 | 1459 | 2.4 | 1.0E+04 | 5 | |||
| D20S60 | 20 | 60 | 1460 | 2.4 | 9.0E+04 | 3 | |||
| D20S20 | 20 | 20 | 1462 | 0.8 | 4.0E+04 | 3 |
Results and Discussion
Spatial Distribution of Excitation Fluence in Skin Model
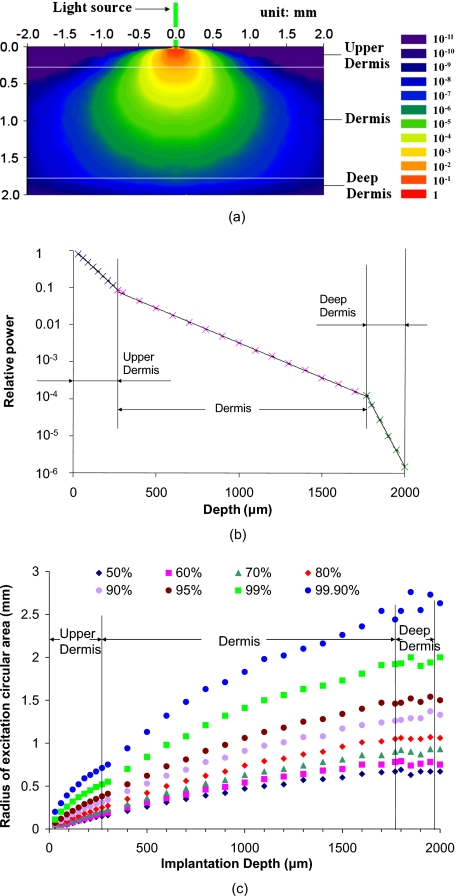
Figure 4a contains a plot of the predicted 2-D spatial distribution of the relative fluence of excitation light (relative fluence of excitation light normalized with incident light) in the skin model. The lateral diameter of the skin model is 30 mm, and the diameter of the excitation light source is 100 μm. The key point from this graph is that the beam spreads to cover a maximum cross section of a few millimeters, such that the sensor patch with 6-mm diameter is sufficient to ensure that the excitation beam does not exceed the path dimensions. As the light penetrates the tissue, the excitation intensity decreases from 10−2 to 10−8 from the upper boundary to the lower boundary of dermis layer, with an exponential decay following the expected profile. This is more clearly revealed in Fig. 4b, which is a plot of relative power of excitation light versus depth. In each layer of the skin model, the relative power plotted in log-scale decreased linearly with depth.
Figure 4.
(a) Spatial distribution of relative irradiance (intensity) of excitation light in skin model. The color bar indicates the relative intensity from 1 to 10−11. The green line at the origin indicates the green color of the light source. The light source is a uniform-intensity circle with diameter of 100 μm. The thickness values for upper dermis, dermis, and deep dermis were 270 μm, 1500 μm, and 230 μm, respectively (see Fig. 1). (b) Simulation output for relative power of excitation light versus depth. Error bars (three runs @ 10,000 rays) were too small to be observed on a plot. (c) Radius of excitation areas with different fraction of total excitation power versus depth. The light source considered in these cases was a circle with diameter of 100 μm. (Color online only.)
Figure 4c is a plot of the radii for different fractions of total power at different depths, which is useful in understanding the lateral spreading of the light relative to the incident beam and sensor implant. The 99.9% beam radii range from 0.71 to 2.44 mm at the upper boundary and lower boundary of dermis, respectively, indicating that cylindrical models centered at the origin with diameter greater than 4.88 mm can be considered as infinitely large compared with the size of unit light source. To ensure that the skin model and sensor models are infinitely large, a 30-mm-diam skin model and a 6-mm-diam sensor patch are sufficient for light source size of 100 μm.
Implant Depth Effects
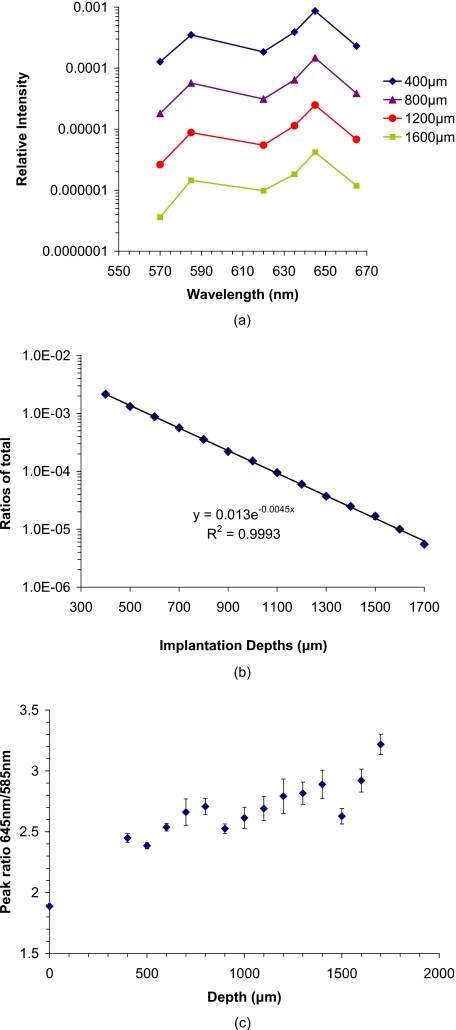
The predicted emission spectrum from implanted sensors versus the implantation depths is given in Fig. 5a. As shown in this graph, the relative intensity decreases as the implants are located deeper in tissue. The ratio of total escaping luminescence power to that of the total excitation power is also shown in Fig. 5b,21 from which it can be observed that the ratio of output power (luminescence emission light escaping from the skin surface) to the input excitation power ranges from 10−3 to 10−6 for sensors at the upper and lower boundaries of the dermis (400 μm and 1700 μm from the skin surface, respectively). Therefore, the efficiency of luminescence ranges from approximately one photon per 1000 input photons to one photon per 1,000,000 input photons. On a practical level, this means that for a 1-mW excitation light source with 1 mW∕mm2 input intensity, the expected minimal output intensity is 1 nW. Thus, the output should be detectable using common detectors such as avalanche photodiodes or photomultiplier tubes, regardless of implant depth. It is noteworthy that the maximum permissible exposure (MPE) for human skin is given as 2 mW∕mm2 (Ref. 44), and therefore, these numbers are realistically achievable. The peak ratios values for the emission (645∕585 nm) versus implantation depth are given in Fig. 5c. In this graph, the peak ratios increase as the sensor goes deeper; this is mainly because the shorter wavelength is absorbed more than the longer wavelength, since 585 nm is close to one of the absorption peaks of hemoglobin. This observation has two important implications for our work. First, the peak ratio is not very strongly dependent on depth. Although the ratio relative to the value at 400 μm depth increases 30% at 1700 μm, it is only 3% and 7% higher at 900 and 1500 μm, respectively. Second, the peak ratio does significantly increase relative to the value expected without tissue, indicating that the measurements could be susceptible to fluctuations in optical properties of tissue superficial to and in between sensor particles. For example, changes in hemoglobin saturation will alter the absorption of light emitted by sensors at 585 nm, which would subsequently change the corresponding measured intensity ratio. It is worth mentioning that these sensors could monitored with luminescence lifetime analysis, which would rely on the emission from the longer-wavelength oxygen-sensitive porphyrin (645 nm for PtOEP, or 700 nm if the palladium version of the same molecule is used); in this case, varying attenuation due to tissue would have even less influence on measured signals due to the longer wavelength and the inherently robust nature of lifetime analysis. Thorough consideration of factors such as skin color, dynamic chromophore concentration changes, oxygenation shifts, and scattering increases due to formation of a fibrous collagen capsule around the implants will be given in future studies; however, the focus of this work is on studying the effects of sensor configurations, implant depths, and excitation beam characteristics on the spatial and spectral distribution of escaping light.
Figure 5.
(a) Spectrum of escaping luminescence relative input light at different sensor implantation depth. The log-scale intensity axis highlights the exponential depth dependence. The sensor configuration was a single layer of tight-packed particles 100 μm in diameter with 100-μm center-to-center spacing (D100S100). (b) Ratio of total escaping luminescence power to the total input excitation power versus depth. Inset is log-scale plot. The environmental glucose concentration used for emission spectra was 250 mg∕dL. (The spectra obtained from prototype sensors exposed to 250 mg∕dL in vitro were used.) The absorption coefficient (@540 nm) was kept at 11.16 mm−1. (c) Peak ratios of emission at 645 nm to that at 585 nm versus implantation depths.
Spatial Distribution of Escaping Photons
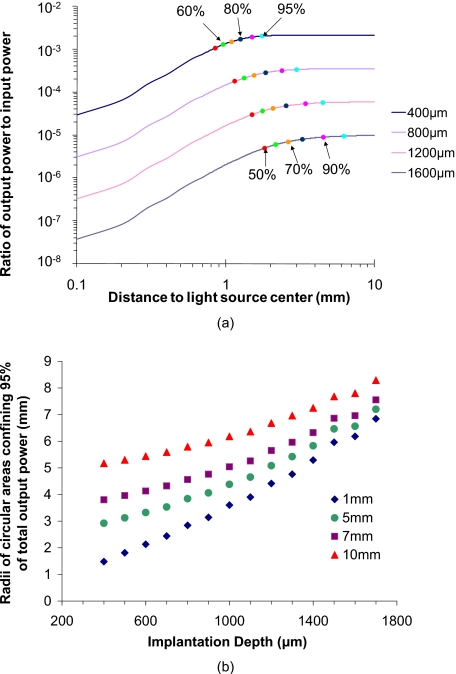
Figure 6a is a plot of the spatial distribution of relative integrated escaping power versus distance from the center of the light source. As shown, the increasing rate of relative integrated output power decreases with distance, which illustrates that the emission output intensity drops rapidly with distance from the light source center (origin). However, for the 1-mm-radius light source, the scattering of light in the tissue results in continuing increases in emission beyond the edges of the input beam. The escaping photons become more broadly distributed as the implantation depth increases. In all cases, at least 50% of the total integrated output power is confined within a circular area with 2-mm radius. When the goal is to capture 90% of the output light, the required capture radius increases to 1.5 to 5.0 mm, depending on the implant depth. Similarly, a capture radius of 1.75 to 6.9 mm will be required to confine 95% of total signal power.
Figure 6.
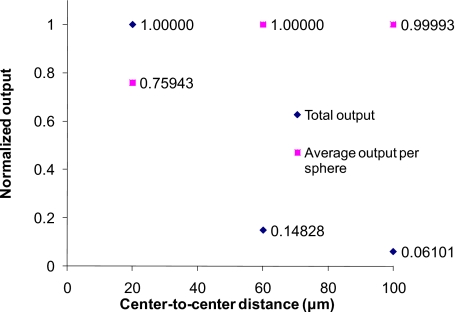
(a) Spatial distribution of integrated power versus implantation depths. (Excitation light source size=2 mm in diameter.) The discrete color data points of different colors represent different fractions of total escaping luminescent power when the sensor was positioned at certain depths. (b) Radii of circular area confining different fraction of total escaping luminescence power versus implantation depths and size of excitation light source. (c) Output powers of D20S20, D20S60, and D20S100. The input excitation light intensity is 1 mW∕mm2, and the size is 2.4 mm in diameter. All the sensor models were 1 layer and 1.2 mm in diameter. The particle number of these three models were 3259, 367, and 151, respectively. The total output and average output per sphere were normalized. (Color online only.)
Figure 6b contains a plot representing the radius for a circular area that confines 95% of the total escaping luminescence power collected on the photon capture film. The radii were computed for different implant depths as well as different light source diameters. It can be seen that, even for a light source with 10-mm diameter and sensors implanted close to the lower boundary of dermis (1700 μm), a circular area with a radius of 9 mm was able to confine 95% of the total output power. Thus, in general, deeper implants require a larger field of view for collection optics to avoid throwing away photons, but efficient collection of output for dermal implants can still be achieved with relatively small-area optics—a standard 1-in optical system will be sufficient.
Since the angle of escape and numerical aperture of the optics involved will also determine the efficiency of collection, we also investigated the angular distribution of escaping luminescence versus different implantation depths (data not shown). The angle of escape was found to decrease linearly with cos(θ) (matches Lambert’s cosine law), and therefore, high-numerical aperture optics are desirable for capturing emission. There was no significant effect of implant depth on angular distribution (p-value=1.0, α=0.05, paired t-test). Thus, the spatial distribution of escaping luminescence is the most critical factor of optical system design.
Effects of Sensor Size and Packing on Absolute Output
Figure 7 contains a plot representing the results of step 1 simulations used to investigate the impact of sphere packing efficiency of sensor models (see Table 3). In these simulations, the dye concentration per sphere was kept constant (bold numbers in the step 1 column in Table 3), meaning that the effective concentration of dye in the tissue decreased with lower packing efficiency. Intuitively, one would expect that the luminescence output per sphere would be reduced by less sphere packing efficiency because of relatively more absorption induced by tissue; however, it is evident from these results that the output per sphere for the D20S20 sensor model is smaller than those of D20S60 and D20S100, even though the total output of D20S20 is the largest. This is attributed to a higher probability of interaction between laterally scattered excitation light and particles in loosely packed (center-to-center distance=60 or 100 μm) sensor models or the lower probability of reabsorption by loosely packed spheres. Accordingly, we can estimate that the D20S60 and D20S100 sensor models will have more output than that of D20S20, if the three sensor models have the same number of spheres and the light source is large enough to ensure that all the spheres are uniformly excited. Thus, if a large enough light source is used to uniformly excite all the particles regardless of the particle spatial distribution, a lower sphere packing efficiency will not reduce the total luminescence output.
Figure 7.
Normalized output for sensor models with different packing efficiency, including total output from each sensor-patch model, and average emission per sphere in each sensor-patch model.
In reality, implementation of in vivo injections will result in difficulty of controlling the implantation area with high precision; it is also likely that particles will be distributed with different projection areas in the tissue; thus, a sufficiently large light source with constant irradiance is preferred to avoid reducing luminescence output due to the unpredicted projection area change of injected sensors in tissue.
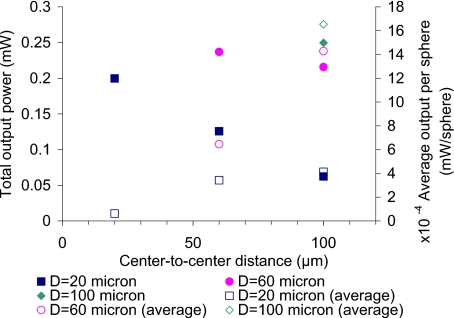
Figure 8 contains the results of step 2 (Table 3), where six different sensor models were used to assess how different dye concentration per sphere and effective tissue dye concentration affect the escaping luminescence, given the same quantity of dye (see bold numbers in the step 1 column in Table 3). As shown in this graph, although every sensor model had the same total amount of dye in the entire patch of particles, the output is dramatically different. The output from tightly packed models (D100S100, D60S60, and D20S20) was higher than that from loosely packed versions. The D20S100 has the smallest output, although the dye concentration per sphere of D100S100 is the smallest and that of D20S100 is the highest. According to the simulation results, the tightly packed sensors produce stronger signals than loosely packing sensors, even when the amount of dye in the sensor patch remains constant. The average output per sphere of loosely packed spheres (empty symbols) was higher than that of tightly packed models, which again proved that the loosely packed sphere models have a lower inner filter effect than the tighter-packed versions. Since these sensor models had the same amount of dye, the ones having the same effective dye concentration should produce the same amount of luminescence emission as if the sensor was a homogeneous model. Although the effective dye concentrations of D100S100, D60S100, and D20S100 were all 1.28 nM, the estimates for total output power of these models were not the same. Neither were the outputs of D60S60 and D20S60, which also had the same concentration. This highlights the inadequacy of a homogeneous model, a fact that was previously discussed in the context of discrete absorbers for accurate representations.39
Figure 8.
Relative output for different sensor models. All the sensor patches were 1.2 mm in diameter, and the uniform light source was 2.4 mm in diameter with intensity of 1 mW∕mm2. The absorption coefficients of D100S100, D60S100, D20S100, D60S60, D20S60, and D20S20 were 1.93 mm−1, 8.92 mm−1, 240.86−1, 3.67 mm−1, 99.10 mm−1, and 11.16 mm−1, respectively.
Figure 9 contains the results of simulations for step 3 (Table 3), designed to assess the effects of multiple layers of microparticles (see Table 2). One to three layers of D100S100, D20S100, and D20S100 sensor models were used, and all the sensor models have the same effective dye concentration (Table 3). As shown in Fig. 9, the outputs of D100S100 are the largest among those of sensor models. The outputs of two-layer D100S100 and three-layer D100S100 are 20.3% and 20.9% higher than that of one-layer D100S100, respectively. The outputs of two-layer D20S100 and three-layer D20S100 are 47.5% and 75.5% higher than that of one-layer D20S100. Interestingly, while adding more layers to tightly packed sensor models does not increase luminescence output as much as loose-packing sensor models, the output of just one layer of tight-packed particles is still higher than that of several layers of loosely packed sensors. Thus, the tighter the particles are packed, the less sensitive to changing number of layers and the higher the output power.
Figure 9.
Output for different sensor models with different numbers of layers. Light source is 100 μm×100 μm square with intensity 1 mW∕mm2. The absorption coefficients of D100S100, D60S100, and D20S100 were 11.16 mm−1, 51.67 mm−1, and 1395 mm−1, respectively. Models with the same number of layers had the same number of particles.
In summary of this phase of the work, the simulation results corroborate our experimental efforts in highlighting that tight packing is preferred for maximal signals. That is, when the total quantity of dye is limited, if concentration per sphere is already maximized and given a fixed light source size, the sensors with high packing efficiency is always preferred, because sensors with high packing efficiency can yield higher output with fewer particles compared with sensors with smaller packing efficiency.
Implanted Sensor Performance Predictions
Figure 10a is a plot of the peak intensity ratio (645∕585 nm) versus glucose concentration for spectra measured from sensors in a flow-through system, as well as simulations. The predicted peak ratio values are significantly higher than the in vitro measured values, due to spectral distortion introduced from absorption and scattering of tissue and sensors—specifically, the shorter wavelengths are attenuated more than the longer wavelengths. However, when we consider the need to measure changes in emission and correlate those with biochemical changes in the sensor environment, it is the percentage change in the peak ratio with analyte concentration that is most relevant.
Figure 10.
(a) Peak intensity ratio for emission (645∕585 nm) versus glucose concentrations. All the absorption coefficients at 540 nm are 11.16 mm−1. (b) Statistical analysis of percentage change data, where percentage change in peak ratio (645∕585 nm) was calculated as the relative change from the baseline value (0 mg∕dL) for different glucose concentrations. In each case, the escaping emission spectrum for 0 mg∕dL glucose predicted for that specific sensor configuration was used as the baseline. The error bars indicate the 95% confidence intervals.
The percentage change of peak ratios was calculated and plotted in Fig. 10b, from which it is clear that all the data fall around the same in vitro data. In Fig. 10b, each of the 95% confidence intervals include the corresponding calibration curve (in vitro curve) value, with the single exception of the small spheres with small spacing (tight packing, D20S20) at 250 mg∕dL. This proves that the changes in emission will be essentially identical to those observed in vitro, enabling direct application of in vitro calibration with single-point correction, without additional significant effects from apparently strong spectral distortions. The single case of statistically different output indicates that the spectral distortion introduced by the tissue will require a new calibration model to be established for in vivo analysis.
Conclusions
Three-dimensional, multiwavelength simulations of light interaction with tissue and luminescent materials have enabled us to gain insight into the expected behavior of implantable biosensors. The simulations described here reveal key factors influencing the generation and collection of luminescence from sensors implanted in the dermis at different depths and concentrations, which provides critical information for future work in instrument design. The simulation results show that the depths of implantation strongly influence the measurability of signal. The deeper the sensor is located, the more the signal is attenuated. With strong scattering and absorption of both excitation and emission light due to overlying tissue, the predicted ratio of output to input power ranges from 10−3 to 10−6; this efficiency is actually very good, and the signals generated from implants should be detectable at all depths within the dermis using sensitive detectors. Our assessment of the spatial distribution of escaping luminescence also provides useful information; it was found that 95% of the total signal (escaping luminescence), even when excited with a 10-mm-diam light source, can be confined within a circular area on skin surface with diameter smaller than 18 mm, which facilitates design of a matched optoelectronic system for efficient delivery of excitation, collection, and analysis of luminescence response. Analysis of luminescence output of different sensor configurations also indicates that the tightly packed sensors are preferred because they yield higher luminescence output with fewer particles. Thus, it is preferred to implant particles in a single site with high concentration. If the light source size can be varied with constant irradiance, a large light source is preferred to overcome the influence of unpredicted projection area change of implanted sensors in tissue. Last, the results of simulations to predict sensor in vivo performance show that the spectral distortion resulting from the absorption and scattering of the skin, particle size, or particle concentrations has minimal influence over the predicted ratiometric measurements. The focus of this work was to determine the effects of sensor configurations, implant depths, and excitation beam characteristics on the intensity and spatial and spectral distribution of escaping light. In all, this simulation work supports the potential to accurately measure the output of luminescent implants and will facilitate the design of a simple optical hardware system to communicate with dermally implanted sensors. However, it is acknowledged that many practical questions regarding other factors that may also perturb the optical signals must also be answered before monitoring can be considered realistic. These include, for example, investigation of the influence of changes in blood volume, hemoglobin concentration and saturation, oxygenation shifts, and scattering increases due to formation of a fibrous collagen capsule around the implants, which are the subject of ongoing studies.
Acknowledgments
The authors acknowledge NIH (R01 EB000739), Texas Engineering Experiment Station (TEES), and Texas A&M University for financial support. Technical support with software from Mr. Edward Sklar (OptiCAD) is appreciated.
References
- Schultz J. S. and Sims G., “Affinity sensors for individual metabolites,” Biotechnol. Bioeng. Symp. 9, 65–71 (1979). [PubMed] [Google Scholar]
- Trettnak W., Leiner M. J. P., and Wolfbeis O. S., “Fiber-optic glucose sensor with a pH optrode as the transducer,” Biosensors 4(1), 15–26 (1989). 10.1016/0265-928X(89)80031-8 [DOI] [Google Scholar]
- Moreno-Bondi M. C., Wolfbeis O. S., Leiner M. J., and Schaffar B. P., “Oxygen optrode for use in a fiber-optic glucose biosensor,” Anal. Chem. 62(21), 2377–2380 (1990). 10.1021/ac00220a021 [DOI] [PubMed] [Google Scholar]
- Wolfbeis O. S., “Fiber optic biosensing based on molecular recognition,” Sens. Actuators B 5(1–4), 1–6 (1991). 10.1016/0925-4005(91)80212-3 [DOI] [Google Scholar]
- Lakowicz J. R. and Szmacinski H., “Fluorescence lifetime-based sensing of pH, Ca2+, K+, and glucose,” Sens. Actuators B 11(1–3), 133–143 (1993). 10.1016/0925-4005(93)85248-9 [DOI] [PMC free article] [PubMed] [Google Scholar]
- Lakowicz J. R., Szmacinski H., and Thompson R. B., “Fluorescence-lifetime-based sensing: applications to clinical chemistry and cellular imaging,” Proc. SPIE 1895, 2–17 (1993). 10.1117/12.146718 [DOI] [Google Scholar]
- Lakowicz J. R., Gryczynski I., Gryczynski Z., Dattelbaum J. D., Tolosa L., and Rao G., “Novel methods for fluorescence sensing,” Proc. SPIE 3602, 234–243 (1999). 10.1117/12.347525 [DOI] [Google Scholar]
- Ballerstadt R. and Schultz J. S., “A fluorescence affinity hollow fiber sensor for continuous transdermal glucose monitoring,” Anal. Chem. 72(17), 4185–4192 (2000). 10.1021/ac000215r [DOI] [PubMed] [Google Scholar]
- McShane M. J., Rastegar S., Pishko M., and Cote G. L., “Monte Carlo modeling for implantable fluorescent analyte sensors,” IEEE Trans. Biomed. Eng. 47(5), 624–632 (2000). 10.1109/10.841334 [DOI] [PubMed] [Google Scholar]
- Russell R. J., Pishko M. V., Gefrides C. C., McShane M. J., and Cote G. L., “A fluorescence-based glucose biosensor using concanavalin A and dextran encapsulated in a poly(ethylene glycol) hydrogel,” Anal. Chem. 71(15), 3126–3132 (1999). 10.1021/ac990060r [DOI] [PubMed] [Google Scholar]
- McShane M. J., O’Neal D. P., Russell R. J., Pishko M. V., and Cote G. L., “Progress toward implantable fluorescence-based sensors for monitoring glucose levels in interstitial fluid,” Proc. SPIE 3923, 78–87 (2000). 10.1117/12.387127 [DOI] [Google Scholar]
- Cote G. L., “Noninvasive and minimally invasive optical monitoring technologies,” J. Nutr. 131(5), 1596S–1604S (2001). [DOI] [PubMed] [Google Scholar]
- McShane M. J., “Potential for glucose monitoring with nanoengineered fluorescent biosensors,” Diabetes Technol. Ther. 4(4), 533–538 (2002). 10.1089/152091502760306625 [DOI] [PubMed] [Google Scholar]
- Ballerstadt R., Gowda A., and McNichols R., “Fluorescence resonance energy transfer-based near-infrared fluorescence sensor for glucose monitoring,” Diabetes Technol. Ther. 6(2), 191–200 (2004). 10.1089/152091504773731375 [DOI] [PubMed] [Google Scholar]
- Grant P. S. and McShane M. J., “Development of multilayer fluorescent thin film chemical sensors using electrostatic self-assembly,” IEEE Sens. J. 3(2), 139–146 (2003). 10.1109/JSEN.2002.807484 [DOI] [Google Scholar]
- Chinnayelka S. and McShane M. J., “Glucose-sensitive nanoassemblies comprising affinity-binding complexes trapped in fuzzy microshells,” J. Fluoresc. 14(5), 585–595 (2004). 10.1023/B:JOFL.0000039345.57924.f3 [DOI] [PMC free article] [PubMed] [Google Scholar]
- Chinnayelka S. and McShane M. J., “Microcapsule biosensors using competitive binding resonance energy transfer assays based on apoenzymes,” Anal. Chem. 77(17), 5501–5511 (2005). 10.1021/ac050755u [DOI] [PubMed] [Google Scholar]
- McShane M. J., Topics in Fluorescence, Lakowicz J. R. and Geddes C. D., Eds., Springer Science, New York: (2006). [Google Scholar]
- Stein E. W., Grant P. S., Zhu H. G., and McShane M. J., “Microscale enzymatic optical biosensors using mass transport limiting nanofilms. 1. Fabrication and characterization using glucose as a model analyte,” Anal. Chem. 79(4), 1339–1348 (2007). 10.1021/ac061414z [DOI] [PMC free article] [PubMed] [Google Scholar]
- Long R. and McShane M. J., “Modeling of selective photon capture for collection of fluorescence emitted from dermally implanted microparticle sensors,” in Conf. Proc. of the IEEE Engineering in Medicine and Biology Society, pp. 2972–2975 (2007). [DOI] [PubMed]
- Long R., Singh S., and McShane M., “Stability of response and in vivo potential of microparticle glucose sensors,” Proc. SPIE 6863, 686307 (2008). 10.1117/12.773315 [DOI] [Google Scholar]
- Stein E. W., Singh S., and McShane M. J., “Microscale enzymatic optical biosensors using mass transport limiting nanofilms. 2. Response modulation by varying analyte transport properties,” Anal. Chem. 80(5), 1408–1417 (2008). 10.1021/ac701738e [DOI] [PubMed] [Google Scholar]
- Singh S. and McShane M., “Enhancing the longevity of microparticle-based glucose sensors toward 1 month continuous operation,” Biosens. Bioelectron. 25(5), 1075–1081 (2009). 10.1016/j.bios.2009.09.026 [DOI] [PMC free article] [PubMed] [Google Scholar]
- Wilson B. C. and Adam G., “A Monte Carlo model for the absorption and flux distributions of light in tissue,” Med. Phys. 10(6), 824–830 (1983). 10.1118/1.595361 [DOI] [PubMed] [Google Scholar]
- Liu Q., Zhu C. F., and Ramanujam N., “Experimental validation of Monte Carlo modeling of fluorescence in tissues in the UV-visible spectrum,” J. Biomed. Opt. 8(2), 223–236 (2003). 10.1117/1.1559057 [DOI] [PubMed] [Google Scholar]
- Qu J. N. Y., Huang Z. J., and Hua J. W., “Excitation-and-collection geometry insensitive fluorescence imaging of tissue-simulating turbid media,” Appl. Opt. 39(19), 3344–3356 (2000). 10.1364/AO.39.003344 [DOI] [PubMed] [Google Scholar]
- Pogue B. W. and Burke G., “Fiber-optic bundle design for quantitative fluorescence measurement from tissue,” Appl. Opt. 37(31), 7429–7436 (1998). 10.1364/AO.37.007429 [DOI] [PubMed] [Google Scholar]
- Keijzer M., Richardskortum R. R., Jacques S. L., and Feld M. S., “Fluorescence spectroscopy of turbid media—autofluorescence of the human aorta,” Appl. Opt. 28(20), 4286–4292 (1989). 10.1364/AO.28.004286 [DOI] [PubMed] [Google Scholar]
- Pogue B. W. and Hasan T., “Fluorophore quantitation in tissue-simulating media with confocal detection,” IEEE J. Sel. Top. Quantum Electron. 2(4), 959–964 (1996). 10.1109/2944.577322 [DOI] [Google Scholar]
- Avrillier S., Tinet E., Ettori D., Tualle J. M., and Gelebart B., “Influence of the emission-reception geometry in laser-induced fluorescence spectra from turbid media,” Appl. Opt. 37(13), 2781–2787 (1998). 10.1364/AO.37.002781 [DOI] [PubMed] [Google Scholar]
- Qu J. N., Macaulay C., Lam S., and Palcic B., “Laser-induced fluorescence spectroscopy at endoscopy—tissue optics, Monte Carlo modeling, and in vivo measurements,” Opt. Eng. 34(11), 3334–3343 (1995). 10.1117/12.212917 [DOI] [Google Scholar]
- Pfefer T. J., Schomacker K. T., Ediger M. N., and Nishioka N. S., “Light propagation in tissue during fluorescence spectroscopy with single-fiber probes,” IEEE J. Sel. Top. Quantum Electron. 7(6), 1004–1012 (2001). 10.1109/2944.983306 [DOI] [Google Scholar]
- Welch A. J., Gardner C., Richards-Kortum R., Chan E., Criswell G., Pfefer J., and Warren S., “Propagation of fluorescent light,” Lasers Surg. Med. 21(2), 166–178 (1997). [DOI] [PubMed] [Google Scholar]
- Liu Q. and Ramanujam N., “Relationship between depth of a target in a turbid medium and fluorescence measured by a variable-aperture method,” Opt. Lett. 27(2), 104–106 (2002). 10.1364/OL.27.000104 [DOI] [PubMed] [Google Scholar]
- Zheng W., Huang Z., and Xie S., “Autofluorescence spectrum of human bronchial tissue by Monte Carlo modeling,” Acta-Photonica-Sinica 30, 669–674 (2001). [Google Scholar]
- Zonios G. I., Cothren R. M., Arendt J. T., Wu J., VanDam J., Crawford J. M., Manoharan R., and Feld M. S., “Morphological model of human colon tissue fluorescence,” IEEE Trans. Biomed. Eng. 43(2), 113–122 (1996). 10.1109/10.481980 [DOI] [PubMed] [Google Scholar]
- Zeng H., MacAulay C., McLean D. I., and Palcic B., “Reconstruction of in vivo skin autofluorescence spectrum from microscopic properties by Monte Carlo simulation,” J. Photochem. Photobiol., B 38(2–3), 234–240 (1997). 10.1016/S1011-1344(96)00008-5 [DOI] [PubMed] [Google Scholar]
- Drezek R., Sokolov K., Utzinger U., Boiko I., Malpica A., Follen M., and Richards-Kortum R., “Understanding the contributions of NADH and collagen to cervical tissue fluorescence spectra: modeling, measurements, and implications,” J. Biomed. Opt. 6(4), 385–396 (2001). 10.1117/1.1413209 [DOI] [PubMed] [Google Scholar]
- Verkruysse W., Lucassen G. W., de Boer J. F., Smithies D. J., Nelson J. S., and van Gemert M. J. C., “Modeling light distributions of homogeneous versus discrete absorbers in light irradiated turbid media,” Phys. Med. Biol. 42(1), 51–65 (1997). 10.1088/0031-9155/42/1/003 [DOI] [PubMed] [Google Scholar]
- “Tattoo,” http://en.wikipedia.org/wiki/Tattoo, (Apr. 7, 2010).
- Jacques S. L. and Keijzer M., “Dosimetry for lasers and light in dermatology: Monte Carlo simulations of 577-nm pulsed laser penetration into cutaneous vessels,” Proc. SPIE 1422, 2–13 (1991). 10.1117/12.43934 [DOI] [Google Scholar]
- Van Gemert M. J. C., Jacques S. L., Sterenborg H. J. C. M., and Star W. M., “Skin optics,” IEEE Trans. Biomed. Eng. 36(12), 1146–1154 (1989). 10.1109/10.42108 [DOI] [PubMed] [Google Scholar]
- Jacques S. L., Rastegar S., Motamedi M., Thomsen S. L., Schwartz J. A., Torres J. H., and Mannonen I., “Liver photocoagulation with diode laser (805 nm) versus Nd:YAG (1064 nm),” Proc. SPIE 1646, 107–117 (1992). 10.1117/12.137451 [DOI] [Google Scholar]
- ANSI Z136.1, “Safe use of lasers, ” Laser Institute of America, New York (1993).


