

Abstract
Background
We characterized temporal trends in HAART initiation (1996–2008) among treatment eligible persons in a community-based cohort of current and former injection drug users (IDUs) in Baltimore.
Methods
The AIDS Linked to the IntraVenous Experience (ALIVE) cohort has been following HIV positive IDUs since 1988. HAART eligibility was defined as the first visit after January 1, 1996 where CD4 was <350 cells/µl. Temporal trends and predictors of HAART initiation were examined using chi-square tests for trend and lognormal survival models.
Results
The median age of 582 HAART-eligible IDUs was 41; 75% were male, 97% African American and 60% active injectors. 345 initiated HAART over 1803 person-years (19.2 per 100 person-years, 95% CI, 17.2–21.3); there was no significant temporal trend in HAART initiation. Independent predictors of delayed initiation included heavy injection and higher CD4 count; prior AIDS diagnosis, usual source of care and health insurance were predictors of more rapid initiation. The delay between eligibility and initiation decreased among those becoming eligible most recently (2003–07) compared with those in earlier calendar periods (1996–2003); however, a substantial number initiated HAART in recent calendar years either after substantial delay or not at all.
Conclusions
We failed to observe substantial improvement in HAART initiation among current and former IDUs over 12 years; heavy drug injection remains the major barrier to HAART initiation and consistent HIV care. The fact that many IDUs initiate HAART after significant delay or not at all raises concern that disparities in HIV care for IDUs remain at a time of simplified antiretroviral regimens and increasing adoption of earlier treatment.
Keywords: HIV/AIDS, injection drug users, highly active antiretroviral therapy, temporal trends
INTRODUCTION
Highly active antiretroviral therapy (HAART) has been associated with dramatic reductions in morbidity and mortality among all risk groups including injection drug users (IDUs) [1–3]. The benefits of initiating HAART early and at higher CD4 have been well documented [4]. Recent analyses have further confirmed the efficacy of early treatment at an individual level [5,6] and potential effectiveness in reducing transmission at a population level, reviving discussions of ‘when to start’ [7] and prompting new treatment guidelines [8]. For example, an analysis of >17,000 HIV-infected patients in North America demonstrated benefits of initiating ART at CD4 cell counts >350 cells/mm3 and even >500 cells/mm3, thresholds not previously indicated for treatment [6]. Deferral of treatment to lower CD4 cell counts where treatment was recommended was associated with substantially increased mortality. These data are reinforced by a population-level simulation analysis suggesting that early diagnosis and universal treatment of HIV can eradicate the epidemic by 2016 [9].
While these studies are compelling, other evidence reinforces that much work remains. Reports have suggested that even in countries with established ART programs, the majority continue to initiate HAART at CD4 cell counts well below 200 cells/mm3,[10,11]. IDUs stand to benefit as much if not more than other groups from earlier treatment given high rates of mortality from non-AIDS causes [12] and high prevalence of coinfections including hepatitis C virus (HCV) [13]. However, IDUs have historically initiated HAART later [14,15], with diminished responses [16,17] and poorer survival [18]. If goals of universal testing and treatment are to be achieved, special efforts need to target IDUs who have historically lagged behind.
We characterized temporal trends and predictors of time to HAART initiation among treatment eligible current and former IDUs over 12 years (January 1996–June 2008). Understanding trends and barriers to HAART initiation in this population will inform large-scale efforts to globally improve earlier initiation of antiretroviral therapy.
METHODS
Study population
Between 1988 and 1989, 2946 IDUs in Baltimore, MD were enrolled into a cohort study of the natural history of HIV-1 (AIDS Linked to the IntraVenous Experience [ALIVE]) study) and followed semi-annually [19]. Participants were ≥18 years of age, free of AIDS at entry and acknowledged injection drug use within the prior 11 years. Additional recruitment was in 1994–95 and 1998 and 2000; in these recruitments, there was a requirement of injection in the prior one year. Overall, 1206 HIV positive participants were recruited; 737 (61%) were in follow-up after July 1996 when HAART became available. 582 HIV positive participants with at least two follow-up visits after July 1996 became eligible for HAART. Eligibility was defined as the first visit after July 1996 where CD4 dropped below 350 cells/mm3. Throughout the study period, HIV treatment guidelines suggested that asymptomatic HIV-infected adult patients with CD4<350 cells/mm3 should have been either considered or recommended to initiate HAART [20–22]. Although treatment guidelines in earlier time-periods recommended HAART initiation at CD4<500 cells/mm3 [20,21], our selection of a lower CD4 threshold would only attenuate estimates of treatment delay during earlier periods. Compared to those who became eligible, those who did not were younger, more often female, less often African-American and had significantly shorter time in study (median 2 years vs. 3 years, p=0.02). The study was approved by the Johns Hopkins Bloomberg School of Public Health Institutional Review Board and all participants provided written informed consent.
Measurements
Semi-annual data collection included standardized interviews with some components interview-administered and others collected via audio computer-assisted self-interview (ACASI). Questions about reported HIV medications prescribed and taken, medical history and health care utilization were interview-administered whereas sensitive questions regarding drug use and other risk behaviors were administered via ACASI. All questions reflected the prior six months. HAART was defined as one of the following combinations, 1) protease inhibitor (PI) + 2 nucleoside reverse transcriptase inhibitors (NRTIs); 2) non-nucleoside reverse transcriptase inhibitor (NNRTI) + 2 NRTIs; 3) abacavir in combination with lamivudine and zidovudine or stavudine (3 NRTI); and 4) PI + NNRTI + NRTI [16].
All participants underwent blood draw and physical examination. HIV-1 antibodies were measured using a commercially available enzyme-linked immunosorbent assay (Genetic Systems, Seattle, Washington) and confirmed with Western Blot (Dupont, Wilmington, Delaware) using manufacturer’s instructions. T-cell subpopulations were measured using whole-blood staining methods and flow-cytometry. Plasma HIV-1 RNA levels were quantified using RT-PCR (Roche Molecular Systems, Branchburg, NJ) according to manufacturer’s specifications. The dynamic range of the assay was approximately 4 logs (on a base 10 scale) and the minimal detectable HIV-1 RNA level was 400 copies/ml. During the physical exam, participants received client-centered counseling which included information regarding CD4 cell count, viral load and their interpretation as well as tailored risk reduction. While there was no active referral system, participants were provided with information on HIV care locations; additional referrals were provided upon request.
Statistical Analysis
Annual HAART initiation rates per 100 person-years of eligibility were calculated by dividing the number of persons who initiated HAART in a calendar year by the total person-years of eligibility within that calendar year. Date of HAART initiation was set as the visit date of the first HAART report. Chi-square tests for trend were used to examine temporal trends in HAART initiation. Because of limited numbers in 1996 and 2008, data from these years were collapsed with 1996 and 2008, respectively. We tested for trends in treatment delay and CD4 cell count at the time of initiation using linear regression models with calendar year as an ordinal variable.
Survival analysis methods were used to identify predictors of shorter/longer time to initiation of HAART. The time origin was date of HAART eligibility and individuals contributed time to the analysis up to 1) HAART initiation date; or 2) the last follow-up visit for those censored. Parametric survival models were used assuming a log-normal distribution (accelerated failure time). These models assume the hazard function takes on a log-normal shape. The effects of covariates are expressed as time ratios (TR) as either accelerating (shortening) or decelerating (lengthening) time to HAART initiation. The overall model fit was assessed using Cox-Snell residuals. Variables considered in multivariate analysis included all those deemed a priori to be important predictors as well as those associated with the outcome at a p<0.10 level. Analyses were performed using SAS version 9.12 (SAS Institute, Cary, North Carolina).
RESULTS
The median age of 582 HAART eligible participants at eligibility was 41 years (inter-quartile range [IQR], 36–45), 97% were African-American and 75% male (Table 1). Fourteen percent reported heavy alcohol use, 33% daily injection drug use and 13% were in methadone substitution at the time of eligibility. 62% reported prior antiretroviral therapy, 8% had a prior AIDS diagnosis and median CD4 cell count was 235 (IQR, 140 – 297).
Table 1.
Characteristics of study population (n=582) at the time of HAART eligibility, ALIVE cohort, 1996–2007*
| Characteristic | N (%) |
|---|---|
| Median age (interquartile range) | 41 (36–45) |
| African-American Race | 565 (97%) |
| Female gender | 147 (25%) |
| ≥ High school education | 224 (39%) |
| Annual income <$5000† | 442 (79%) |
| Employed† | 110 (19%) |
| Recent homelessness† | 97 (17%) |
| Recent incarceration† | 113 (20%) |
| Alcohol use† | |
| None | 221 (39%) |
| < daily | 273 (48%) |
| ≥daily | 78 (14%) |
| Injection drug use† | |
| None | 230 (40%) |
| < daily | 151 (27%) |
| ≥ daily | 188 (33%) |
| Type of drug injected† | |
| None | 232 (40%) |
| Cocaine alone | 27 (5%) |
| Heroin alone | 31 (5%) |
| Cocaine and Heroin | 279 (49%) |
| Any non-injection drug use† | 234 (41%) |
| Any cocaine use | 345 (60%) |
| Any crack use | 123 (21%) |
| Methadone maintenance† | 73 (13%) |
| Median CD4 at eligibility | 235 (140 – 297) |
| Median log10HIV RNA at eligibility | 4.42 (3.81 – 4.82) |
| Prior AIDS diagnosis | 49 (8%) |
| Prior antiretroviral therapy | 359 (62%) |
| Usual source of care† | 397 (69%) |
| Recent outpatient visit† | 302 (53%) |
| Health insurance† | 378 (66%) |
| Calendar period of 1st eligibility | |
| 1996 – 1998 | 487 (84%) |
| 1999 – 2002 | 63 (11%) |
| 2003 – 2007 | 32 (5%) |
Characteristics are presented as n(%) except where otherwise specified
Reflect characteristics/behaviors in the prior six months
Temporal trends in HAART initiation
Over 1802.9 person-years of follow-up, 345 participants initiated HAART (initiation rate, 19.2 per 100 person years; 95% confidence interval [CI], 17.2–21.3). Among 237 participants who did not initiate HAART, 148 (62 %) died a median of 3.0 years (IQR, 1.5 – 5.3) after becoming eligible. The majority of those who died (n=129) became eligible immediately in 1996 and died in 1996 or 1997. Mortality among those becoming eligible in later calendar years was less (7 of those who became eligible in 1999–2002 and 2 of those who became eligible in 2003–2007). 50 (21%) were lost to follow-up after being followed for a median of 2.6 years (IQR, 1.7 – 5.0) after becoming eligible and 39 (17 %) have been followed in the study for a median of 7.9 years (IQR, 4.7 – 10.1) after eligibility. There was no statistically significant trend in HAART initiation over time (p>0.05, test for trend). However, there was suggestion of an increase between 1996 and 1999, followed by a decline in 2002 with some signs of increase in 2007–08 (Figure 1).
Figure 1. Temporal trends in HAART initiation in the ALIVE cohort, 1996–2008.
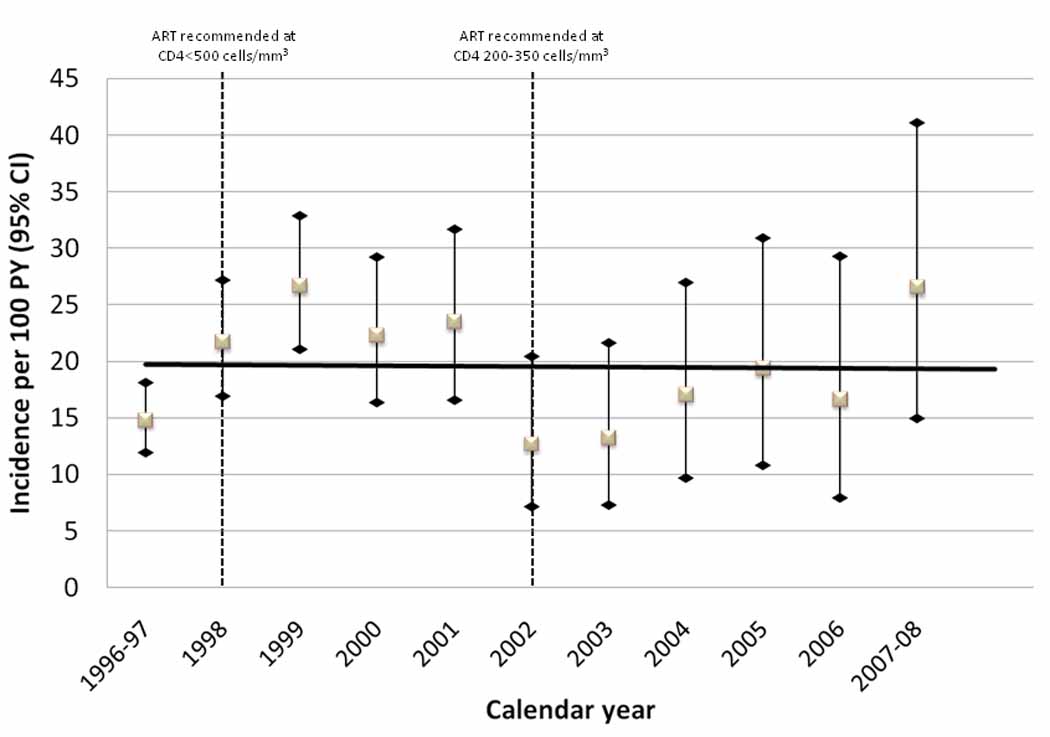
Incidence rates per 100 person years (PY) and 95% confidence intervals (CI) among treatment eligible IDUs (n=582) by calendar year are shown. There was no statistically significant linear trend (solid line). Dashed lines in 1998 and 2002 reflect changes in guidelines for antiretroviral therapy [20–22].
Over time, there was a shift in the types of initial HAART regimens prescribed (Figure 2). In 1996–1997, 94% of participants were initiated on a PI-based regimen. Over time, the proportion of PI-based regimens declined to 46% in 2007–08. The proportion of NNRTI-based regimens increased from 8.6% in 1998 to 43.6% in 2000 and remained relatively stable thereafter. Triple nucleoside-based regimens increased from 7.7% in 2000 to a peak of 30.8% in 2003, but declined to none in 2005. Of note, 3 IDUs initiating HAART in 2007–08 were prescribed triple nucleoside-based regimens.
Figure 2. Temporal trends in initial HAART regimen among 345 HAART initiators in the ALIVE cohort, 1996–2008.
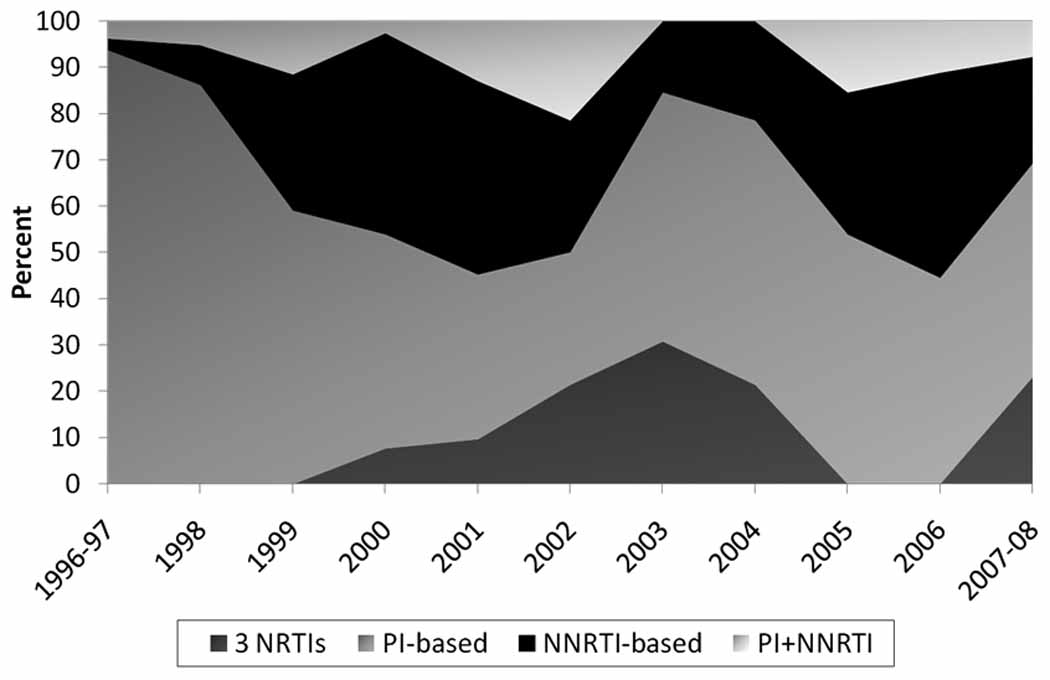
Percents are calculated as the number of persons on a particular type of regimen in a calendar year divided by the number of HAART initiators in that calendar year.
Trends in treatment delay and CD4 count at HAART initiation
We further characterized temporal differences in HAART initiation by calendar period of eligibility; in particular, we were interested in trends in the delay between eligibility and initiating treatment and degree of immune suppression at initiation (Figure 3). In general, there was no statistically significant trend towards improvement in CD4 cell count over time (p>0.05 for all groups). Among those who became eligible prior to 2003, we observed substantially longer treatment delays over time. For example, among those who became eligible in 1996–1998, the median time from eligibility to initiation increased from 12.0 months to 133.7 months in 2007–2008. By contrast, among participants who became HAART eligible in 2003–2007, the median time from eligibility to initiation remained stable at 15.1 months in 2004 and 15.7 months in 2007–2008. A non-trivial proportion of eligible individuals still in follow-up had not yet initiated HAART, including 22% of those who became eligible in 1999–2002 and 34% of those who became eligible in 2003–2007. Trends in HAART initiation did not differ between HIV seroconvertors diagnosed within 6 months of acquisition and persons with longer or unknown periods between HIV infection and diagnosis (data not shown).
Figure 3. Temporal trends in treatment initiation in the ALIVE cohort, 1996–2008.
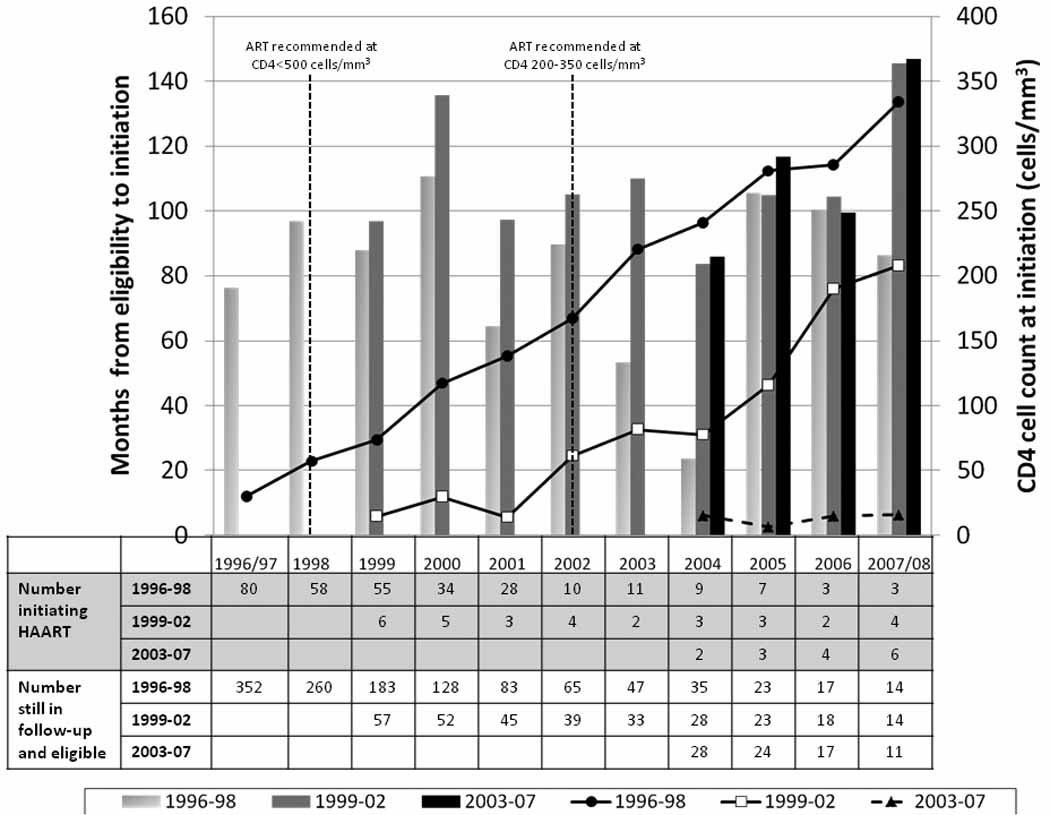
This figure presents data on trends by calendar year of HAART initiation (x axis) and calendar period of eligibility. Calendar period of eligibility is defined as 1996–98, 1999– 02, 2003–07. Lines represent the median months between eligibility for treatment and initiation for each of the three periods of eligibility. Bars represent the median CD4 cell count at the time of initiation for each of the three periods of eligibility. Listed at the bottom of the figure are (1) the numbers of individuals who initiated HAART in each year according to the calendar period of when they became eligible; and (2) the numbers of individuals who were still under study follow-up but had not yet initiated HAART by that calendar year according to the calendar period of when they became eligible.
Predictors of time to HAART initiation
In univariate analysis, compared with persons who became eligible for HAART in 1996–1998, those who became eligible in 1999–2002 had a significantly longer time to HAART initiation (TR, 1.18; 95% CI, 1.04–1.32) but no difference was observed among those who became eligible in 2003–2007. In multivariate analysis, calendar period of eligibility was no longer significantly associated with a longer time to HAART initiation (TR for 1999–2002 vs. 1996–1998, 1.08; 95% CI, 0.95–1.24; TR for 2003–2006; 0.97; 95% CI, 0.71–1.31). Daily drug injection (TR, 1.29; 95% CI, 1.02–1.62) remained associated with longer time to initiation but those who injected less frequently were no different than those not injecting with respect to time to HAART initiation. The time to HAART initiation tended to be shorter for those who were sicker and had better access to health care. Specifically, lower CD4 cell count at the prior visit (TR per 100 cell decrease, 0.94; 95% CI, 0.88–0.99, having a prior AIDS diagnosis (TR, 0.75; 95% CI, 0.56–1.0), having a usual source of care (TR, 0.74; 95% CI, 0.58–0.96) and health insurance (TR, 0.80; 95% CI, 0.66–0.97) remained associated with shorter time to HAART initiation. Results were the same after adjustment for time–varying HIV RNA level (data not shown). HIV RNA level was not included in the final model because it was not available on a substantial number of individuals.
DISCUSSION
In this large cohort of current and former IDUs, we did not observe improvement in HAART initiation over a decade, which appears at least in part due to a subset of refractory IDUs who have not initiated treatment despite being eligible for several years. There were modest, though non-statistically significant, suggestions that HIV-infected participants who became eligible for and initiated HAART in recent calendar years did so after less treatment delay than those who became eligible in earlier periods. Despite this, it remains concerning that many persons initiate therapy after lengthy delays with advanced immunosuppression and that nearly one-third of individuals recently becoming treatment-eligible still have not initiated therapy.
In order to appropriately initiate HAART, HIV-infected persons must be diagnosed early, promptly access care, and convince providers of their ability to adhere to therapy; illicit drug use may impede each of these steps. Many strategies have focused on early detection of HIV including expanded voluntary counseling and testing (VCT) and opt-out testing [23] and targeted HIV testing has been suggested to improve HAART uptake among some IDUs [24]. However, our data suggest that early diagnosis alone may be inadequate. All participants in our study received biannual counseling and passive referrals for care. Despite this, a large number either initiated HAART after substantial delay or not at all. These findings suggest that efforts to “test and treat” need to also incorporate methods to refer and retain in care. Our data are consistent with data from the past 16 years from the Johns Hopkins HIV Clinic in Baltimore where among persons with a history of injection there has been an increase in the severity of immunosuppression at the time of presentation for HIV care [25]. Moreover, whereas other risk groups had shorter times between diagnosis and presentation for care in later calendar years, persons with a history of injection had significantly increased time from a median of 378 days in 1990–1994 to 630 days in 2003–06.
Treatment delay in this population was likely due to both provider reticence and participant behavior, but it is difficult to disentangle the relative contributions. Importantly, the trends parallel changes in guidelines for HAART initiation suggesting that physicians do follow guidelines. Not surprisingly, heavy injection drug use was strongly associated with longer time to HAART initiation consistent with prior analyses confirming its role in delayed HAART initiation from 1996–98 [15], impaired response to HAART [16], consistent HAART use [26] and survival in this cohort [16]. After accounting for active heavy injection in this analysis, no other markers of stability including homelessness, incarceration and methadone maintenance remained independently associated with HAART initiation, suggesting that these stability factors which have been previously shown to impact HIV outcomes [27] are all tied to ongoing drug injection. Interestingly, moderate frequency of drug injection was not associated with longer time to HAART initiation. Some of this may reflect IDUs ‘aging out’ of drug use prior to HIV disease progression and treatment eligibility. In total, these findings suggest that there is a functional group of active injectors who can successfully initiate, maintain and respond to HAART, reinforcing that active injection should not be an automatic exclusion. Different strategies to promote HAART uptake may be needed depending on the intensity of use, but all should be targeted for interventions to promote early initiation. Future studies are also needed to better understand provider willingness to prescribe antiretrovirals to injectors with different intensities of use.
It is somewhat optimistic that persons who recently became eligible initiated HAART on average within 6 months. However, after accounting for heavy injection drug use, we did not observe any significant difference in time to initiation between calendar periods of when persons became eligible. Further, one-third of the most recently eligible group has still not initiated therapy. Our data also suggest that a substantial proportion of ‘early initiators’ in recent years were being prescribed inferior triple nucleoside regimens. Inferences are limited due to small sample size in recent years but understanding provider views on the selection of regimens for persons with a history of injection remains important.
We were limited in this analysis because most persons became eligible in 1996 – 1998 and many had CD4 cell counts that dropped below 350 cells/mm3 before HAART was available. The lack of improvement in HAART initiation over time may at least in part reflect a group of persons intransigent to HAART initiation. Similarly, this group appears to represent the majority of the subset with extremely prolonged delay in treatment. Further qualitative and translational research will be needed to develop novel intervention strategies to engage these individuals in care and treatment for drug dependence and HIV. We were further limited by the six-month visit structure of the ALIVE study which hinders precision of our estimates of HAART eligibility and initiation. We did not have information on physician prescribing behaviors so cannot comment on whether trends reflect patient or physician decisions. Definitions of HAART eligibility changed over the course of the study period from treating early in 1998 (CD4<500 cells/mm3)[20,21] to treating later (200 to 350 cells/mm3) in 2002 [22]; for this analysis, we conservatively used a single criteria of CD4<350 cells/mm3, which if anything would bias the results towards higher initiation rates in later periods because the criteria in the early years were less stringent [20,21]. Finally, generalizability of these findings may be limited because our cohort was predominantly urban, male, African American and a large proportion were ART-experienced.
In conclusion, we failed to observe improved HAART initiation over time among treatment eligible persons with a history of drug injection, despite repeated counseling and referrals. Although there is suggestion of diminished treatment delay among newly eligible participants, there remain many who failed to initiate or only recently initiated HAART after lengthy delays with advanced immune suppression. Heavy drug injection continues to be the major barrier to ART initiation and consistent HIV care. Interventions to address ongoing substance abuse, including programs which emphasize reductions in injecting intensity, may improve ART uptake in this population.
Table 2.
Predictors of time to HAART initiation among 582 HAART eligible IDUs in the ALIVE cohort, 1996–2007.*
| Unadjusted | Adjusted | |||
|---|---|---|---|---|
| Characteristic | TR | 95% CI | TR | 95% CI |
| Calendar year of HAART eligibility | ||||
| 1996–1998 | 1 | 1 | ||
| 1999–2002 | 1.18 | 1.04 – 1.32 | 1.08 | 0.95 – 1.24 |
| 2003–2007 | 1.02 | 0.79 – 1.31 | 0.97 | 0.71 – 1.31 |
| Age (per 10 years) | 0.82 | 0.62 – 1.08 | ||
| Female gender | 1.01 | 0.90 – 1.14 | ||
| African American | 0.98 | 0.73 – 1.31 | ||
| ≥High school education | 0.94 | 0.86 – 1.04 | ||
| Annual income <$5000† | 1.16 | 0.99 – 1.34 | ||
| Employed† | 1.00 | 0.87 – 1.16 | ||
| Homeless† | 1.19 | 1.01 – 1.41 | ||
| Incarcerated† | 1.23 | 1.04 – 1.45 | ||
| Any alcohol use† | 1.17 | 0.98 – 1.38 | ||
| Injection drug use† | ||||
| None | 1 | 1 | ||
| <Daily | 1.15 | 0.94 – 1.40 | 1.04 | 0.95–1.15 |
| ≥ Daily | 1.61 | 1.01 – 2.55 | 1.29 | 1.02–1.62 |
| Any non-injection drug use† | 1.20 | 0.99 – 1.46 | ||
| Type of drug injected† | 1 | |||
| None | 1.29 | 0.99 – 1.67 | ||
| Cocaine alone | 1.05 | 0.82 – 1.35 | ||
| Heroin alone | 1.26 | 1.02 – 1.57 | ||
| Cocaine and Heroin | ||||
| Any cocaine use† | 1.21 | 1.02 – 1.45 | ||
| Crack use† | 1.09 | 0.94 – 1.27 | ||
| Methadone maintenance† | 0.77 | 0.60 – 0.98 | ||
| ≥ 2 HIV-related symptoms‡ | 0.79 | 0.65 – 0.96 | ||
| CD4 cell count (per 100 cell decrease)‡ | 0.93 | 0.87 – 0.98 | 0.94 | 0.88 – 0.99 |
| Prior AIDS diagnosis | 0.62 | 0.41 – 0.94 | 0.75 | 0.56 – 0.96 |
| Prior ART | 0.84 | 0.75 – 0.94 | ||
| Usual source of care† | 0.60 | 0.40 – 0.89 | 0.74 | 0.58 – 0.96 |
| Health insurance† | 0.68 | 0.53 – 0.88 | 0.80 | 0.66 – 0.97 |
| Recruitment cohort | ||||
| 1988–89 | 1 | |||
| 1994–95 | 1.16 | 0.97 – 1.38 | ||
| 1998 | 0.90 | 0.71 – 1.13 | ||
Estimates are from lognormal survival models and reflect relative increases (TR >1.0) or decreases (TR <1.0) in time to HAART initiation; TR, time ratio; CI, confidence interval
Reflects characteristics/behaviors in the prior six months
CD4 cell count was lagged one visit
Acknowledgements
Supported by Public Health Service Grants from the National Institute on Drug Abuse: R01 DA12568, R01 DA04334. We acknowledge Lisa McCall for project management and the ALIVE study project staff and study participants without whom this would not have been possible.
Footnotes
All authors: no conflicts
References
- 1.Mocroft A, Vella S, Benfield TL, et al. EuroSIDA Study Group. Changing patterns of mortality across Europe in patients infected with HIV-1. Lancet. 1998;352:1725–1730. doi: 10.1016/s0140-6736(98)03201-2. [DOI] [PubMed] [Google Scholar]
- 2.Palella FJ, Jr., Delaney KM, Moorman AC, et al. Declining morbidity and mortality among patients with advanced human immunodeficiency virus infection. HIV Outpatient Study Investigators. N Engl J Med. 1998;338:853–860. doi: 10.1056/NEJM199803263381301. [DOI] [PubMed] [Google Scholar]
- 3.Vlahov D, Galai N, Safaeian M, et al. Effectiveness of highly active antiretroviral therapy among injection drug users with late-stage human immunodeficiency virus infection. Am J Epidemiol. 2005;161:999–1012. doi: 10.1093/aje/kwi133. [DOI] [PMC free article] [PubMed] [Google Scholar]
- 4.Walensky RP, Paltiel AD, Losina E, et al. The survival benefits of AIDS treatment in the United States. J Infect Dis. 2006;194:11–19. doi: 10.1086/505147. [DOI] [PubMed] [Google Scholar]
- 5.Mocroft A, Phillips AN, Gatell J, et al. Normalisation of CD4 counts in patients with HIV-1 infection and maximum virological suppression who are taking combination antiretroviral therapy: an observational cohort study. Lancet. 2007;370:407–413. doi: 10.1016/S0140-6736(07)60948-9. [DOI] [PubMed] [Google Scholar]
- 6.Kitahata MM, Gange SJ, Abraham AG, et al. Effect of early versus deferred antiretroviral therapy for HIV on survival. N Engl J Med. 2009;360:1815–1826. doi: 10.1056/NEJMoa0807252. [DOI] [PMC free article] [PubMed] [Google Scholar]
- 7.Timing of initiation of antiretroviral therapy in AIDS-free HIV-1-infected patients: a collaborative analysis of 18 HIV cohort studies. Lancet. 2009;373:1352–1363. doi: 10.1016/S0140-6736(09)60612-7. [DOI] [PMC free article] [PubMed] [Google Scholar]
- 8.Panel on Antiretroviral Guidelines for Adults and Adolescents. Guidelines for the use of antiretroviral agents among HIV-1 infected adults and adolescents. Department of Health and Human Services. 20 A.D. December 12; Available:Dec 18 9 A.D. [Google Scholar]
- 9.Granich RM, Gilks CF, Dye C, De Cock KM, Williams BG. Universal voluntary HIV testing with immediate antiretroviral therapy as a strategy for elimination of HIV transmission: a mathematical model. Lancet. 2009;373:48–57. doi: 10.1016/S0140-6736(08)61697-9. [DOI] [PubMed] [Google Scholar]
- 10.Keiser O, Anastos K, Schechter M, et al. Antiretroviral therapy in resource-limited settings 1996 to 2006: patient characteristics, treatment regimens and monitoring in sub-Saharan Africa, Asia and Latin America. Trop Med Int Health. 2008;13:870–879. doi: 10.1111/j.1365-3156.2008.02078.x. [DOI] [PMC free article] [PubMed] [Google Scholar]
- 11.Egger M. Outcomes of antiretroviral treatment in resource limited and industrialized countries [Abstract 62]. 14th Conference on Retroviruses and Opportunistic Infections; Los Angeles, CA. 2007. [Google Scholar]
- 12.Wang C, Vlahov D, Galai N, et al. Mortality in HIV-seropositive versus - seronegative persons in the era of highly active antiretroviral therapy: implications for when to initiate therapy. J Infect Dis. 2004;190:1046–1054. doi: 10.1086/422848. [DOI] [PubMed] [Google Scholar]
- 13.Sulkowski MS, Hepatitis C. Virus Infection in HIV-infected Patients. Curr Infect Dis Rep. 2001;3:469–476. [PubMed] [Google Scholar]
- 14.Rodriguez-Arenas MA, Jarrin I, del AJ, et al. Delay in the initiation of HAART, poorer virological response, and higher mortality among HIV-infected injecting drug users in Spain. AIDS Res Hum Retroviruses. 2006;22:715–723. doi: 10.1089/aid.2006.22.715. [DOI] [PubMed] [Google Scholar]
- 15.Celentano DD, Galai N, Sethi AK, et al. Time to initiating highly active antiretroviral therapy among HIV-infected injection drug users. AIDS. 2001;15:1707–1715. doi: 10.1097/00002030-200109070-00015. [DOI] [PubMed] [Google Scholar]
- 16.Mehta SH, Lucas G, Astemborski J, Kirk GD, Vlahov D, Galai N. Early immunologic and virologic responses to highly active antiretroviral therapy and subsequent disease progression among HIV-infected injection drug users. AIDS Care. 2007;19:637–645. doi: 10.1080/09540120701235644. [DOI] [PubMed] [Google Scholar]
- 17.Lucas GM, Cheever LW, Chaisson RE, Moore RD. Detrimental effects of continued illicit drug use on the treatment of HIV-1 infection. J Acquir Immune Defic Syndr. 2001;27:251–259. doi: 10.1097/00126334-200107010-00006. [DOI] [PubMed] [Google Scholar]
- 18.Mocroft A, Madge S, Johnson AM, et al. A comparison of exposure groups in the EuroSIDA study: starting highly active antiretroviral therapy (HAART), response to HAART, and survival. J Acquir Immune Defic Syndr. 1999;22:369–378. doi: 10.1097/00126334-199912010-00008. [DOI] [PubMed] [Google Scholar]
- 19.Vlahov D, Anthony JC, Munoz A, et al. The ALIVE study, a longitudinal study of HIV-1 infection in intravenous drug users: description of methods and characteristics of participants. NIDA Res Monogr. 1991;109:75–100. [PubMed] [Google Scholar]
- 20.Carpenter CC, Fischl MA, Hammer SM, et al. Antiretroviral therapy for HIV infection in 1998: updated recommendations of the International AIDS Society-USA Panel. JAMA. 1998;280:78–86. doi: 10.1001/jama.280.1.78. [DOI] [PubMed] [Google Scholar]
- 21.Guidelines for the use of antiretroviral agents in HIV-infected adults and adolescents. Department of Health and Human Services and Henry J. Kaiser Family Foundation. MMWR Recomm Rep. 1998;47:43–82. [PubMed] [Google Scholar]
- 22.Dybul M, Fauci AS, Bartlett JG, Kaplan JE, Pau AK. Guidelines for using antiretroviral agents among HIV-infected adults and adolescents. Recommendations of the Panel on Clinical Practices for Treatment of HIV. MMWR Recomm Rep. 2002;51:1–55. [PubMed] [Google Scholar]
- 23.Branson BM, Handsfield HH, Lampe MA, et al. Revised recommendations for HIV testing of adults, adolescents, and pregnant women in health-care settings. MMWR Recomm Rep. 2006;55:1–17. [PubMed] [Google Scholar]
- 24.Wood E, Kerr T, Hogg RS, et al. Impact of HIV testing on uptake of HIV therapy among antiretroviral naive HIV-infected injection drug users. Drug Alcohol Rev. 2006;25:451–454. doi: 10.1080/09595230600883313. [DOI] [PubMed] [Google Scholar]
- 25.Keruly JC, Moore RD. Immune status at presentation to care did not improve among antiretroviral-naive persons from 1990 to 2006. Clin Infect Dis. 2007;45:1369–1374. doi: 10.1086/522759. [DOI] [PubMed] [Google Scholar]
- 26.Kavasery R, Galai N, Astemborski J, et al. Nonstructured treatment interruptions among injection drug users in Baltimore, MD. J Acquir Immune Defic Syndr. 2009;50:360–366. doi: 10.1097/QAI.0b013e318198a800. [DOI] [PMC free article] [PubMed] [Google Scholar]
- 27.Wood E, Hogg RS, Kerr T, Palepu A, Zhang R, Montaner JS. Impact of accessing methadone on the time to initiating HIV treatment among antiretroviral-naive HIV-infected injection drug users. AIDS. 2005;19:837–839. doi: 10.1097/01.aids.0000168982.20456.eb. [DOI] [PubMed] [Google Scholar]