Abstract
Ex-vivo identification of donor specific unresponsiveness in organ transplant recipients is important for immunosuppression (IS) minimization. We tested three groups of stable living-related-donor-kidney transplant patients upto 11 years post-operatively, i.e., 20 haploidenticals with donor bone marrow cell (DBMC) infusions, 8 non-infused haploidentical controls (haplo-controls) and 11 HLA-identical controls (HLA-Id), using multiple ex vivo immune assays. None developed donor specific antibodies. The majority showed donor specific CTL unresponsiveness from year one onwards. 13/20 DBMC recipients became specifically donor MLR non-reactive. Depletion of donor cells in DBMC recipients still MLR reactive increased donor specific reactivity by 75±36% (p=0.04). Adding them back in low concentration caused antigen specific inhibition. The frequencies of ELISPOT granzyme-B and interferon-γ producing cells somewhat paralleled the CTL and MLR responses. In the transvivo-DTH, 14/19 DBMC recipients demonstrated donor specific unresponsiveness and 16/19 showed “linked suppression”, vs 0/8 and 1/8 haplo-controls and vs. 6/10 and 1/10 HLA-ids respectively. Most importantly, when all 6 assays were performed simultaneously, 10/18 DBMC, 5/10 HLA-id but no haplo-controls were specifically donor unresponsive long-term.
We propose that a cluster-analysis combining these assays will reveal tolerant recipients in whom IS minimization may safely be tested. This appears to have occurred in many DBMC infused recipients.
Keywords: kidney transplant patients, donor bone marrow infusion, immune assessments, donor specific unresponsiveness
INTRODUCTION
Introduction of improved immunosuppressive drugs (IS) has increased early allograft survival, but with continued susceptibility to infections, cancer, metabolic and degenerative diseases (reviewed in [1]). Therefore, there has been a renewed search for IS reducing or immunoregulatory protocols. Recently, donor bone marrow cell (DBMC) infusions have been associated with “operational” renal transplantation tolerance [2, 3] based on the pre-clinical observations in mammals including primates [4–7]. Microchimerism of bone marrow derived cells seen in several transplant recipients who had stopped IS for several years with functioning grafts [8, 9] added impetus to these protocols.
Our own studies since 1994 involved over 350 liver (or liver/intestinal), 111 kidney, 25 kidney/pancreas, and 5 kidney/islet transplants accompanied by DBMC [10–16]. In deceased donor (dd) kidney transplant recipients higher graft survival occurred compared to (non-randomized) non-infused controls [14, 17]. DBMC was also tested in 47 living-related-donor (LRD) haploidentical kidney transplant recipients, compared with non-infused demographically similar controls (n=39) [12, 15, 18, 19]. Functionally, purified recipient derived donor (RdD) chimeric cells from the LRD-DBMC recipient bone marrow and peripheral blood were found to specifically inhibit recipient anti-donor MLR and CML responses supporting the notion that DBMC played a positive role in transplant hyporesponsiveness postoperatively [19, 20].
Ex vivo methods to identify donor specific immune unresponsiveness is essential for meaningful clinical trials of IS minimization or withdrawal. Although numerous assays have been proposed, none have been exclusively reflective of this, possibly due to the complexity of the immune system with multiple genomic/polymorphic and environmental determinants affecting both recipients and donors. We reasoned that an array of assays might be more globally predictive of such “tolerant” profiles and questioned whether this would occur in DBMC infused LRD kidney transplant recipients vs the non-infused haploidentical group, both compared with HLA identical (HLA-id) sibling recipients serving as negative controls.
MATERIAL AND METHODS
Patients, immunosuppression and clinical parameters
Of forty-seven LRD-haploidentical recipients infused four days postoperatively with 1.8×10⁸±1.9×10⁸ whole DBMC /kg body weight ±S.D [15], twenty were followed serially with an array of ex vivo assays. They were compared with 8 haploidentical and 11 HLA-identical (HLA-id) non-infused demographically similar recipients between 49–134 months post-transplantation. Even though we had initiated these studies in 28/47 of the DBMC infused recipients with the only criterion that they attend our clinic post-operatively, we were able to complete this extensive study in 20 patients as the others were unwilling to participate long-term. Thus, selection was based exclusively on clinical attendance and willingness to be study participants. Their clinical profile is shown in supplementary data-Table 1. OKT3, daclizumab or simulect were used for induction therapy, with maintenance tacrolimus, MMF, and methylprednisolone IS. Long-term serum creatinine concentrations (Cr) were serially followed with a nadir at 1–2 months postoperatively considered as the baseline level and any subsequent increase (i.e. > 0.3 mg/dl) requiring documented explanation. Rejection was biopsy confirmed. Infections and other significant adverse events requiring hospitalization were also recorded. All had signed Institutional Review Board approved informed consents consistent with HIPPA regulations.
Mixed Lymphocyte Reaction (MLR)
Briefly, 1×10⁵ recipient PBMC were stimulated with 1×10⁵ irradiated (3000 rads) PBMC from the donor or third party not having common recipient or donor HLA [20]. The assays were performed in 96-well flat bottom plates at a total volume of 0.2 ml/well culture medium (NAB-CM; RPMI-1640 supplemented with 15% normal AB serum, 2 mM L-glutamine, 10 mM HEPES and 1X antibiotic-antimycotic solution; all from Gibco-BRL, Gaithersburg, MD) in triplicate at 37°C in 5% CO2. On day 7, 1 mCi 3H-thymidine was added to each well. After 18 hrs, the cultures were harvested using a Tomtec cell harvester (Hamden, CT). Radioactive incorporation was measured using a PerkinElmer Beta counter (Shelton, CT). The stimulation indices (S.I.) were calculated as:
Assessment of recipient MLR Regulation by chimeric cells in DBMC infused recipients
Fresh recipient and donor peripheral blood and recipient and donor iliac crest bone marrow cells were obtained yearly between 1–3 years after renal transplantation. Cells of donor phenotype from the recipient, denoted as Recipient derived Donor (RdD) cells, were isolated and characterized as previously described [20]. Briefly, Ficoll-Hypaque separated PBMC and iliac crest marrow cells were either depleted of or purified for donor chimeric cells using monoclonal antibodies specific to one of the mismatched class I MHC donor alloantigens and streptavidin-microbeads (Miltenyi Biotech Inc., Auburn, CA). After the depletion no cells of donor phenotype could be observed by flow cytometric analysis (using a monoclonal antibody to a second mismatched donor antigen not used for the depletion). Also, as has been published previously [20], the RdD cells purified from recipient marrow were of multiple phenotypes, mainly CD3+ cells subdivided into CD4+ (32.5 ± 19.3%) and CD8+ (20.8 ± 6.9%), CD19+ (5.1 ± 0.9%) and CD34+ (5.4 ± 4.1%) with very few CD14+, CD33+, CD80+, CD86+ or NK-B1+ cells (n=4). These RdD cells were tested as modulator cells in MLR assays as described [20]. Briefly, 1×10⁵ PBMC from renal transplant recipients depleted of donor chimeric cells were stimulated with 1×10⁵ irradiated PBMC from the living related donors (specific) or third Party (non-specific) in presence of the indicated number of donor modulator cells and standard 3H-thymidine incorporation assays were performed on day 7. Data were calculated as percentage inhibition using the formula:
Cell Mediated Lympholysis (CML)
Initially conventional CML assays [21] and later, micro-CML assays [22] were performed. Briefly, in the micro-CML, 5×10⁴ recipient responder PBMC were stimulated with 5×10⁴ donor or third party irradiated PBMC in replicates of 10 in 96-well U-bottom plates at 0.2 ml/well. On the 8th day, 5×10³ 51Chromium labeled stimulator target cells were added. Four hours later, supernatants were harvested and the released radioactivity was measured using a gamma counter (PerkinElmer). Cultures with stimulator cells plus medium (i.e., no responder cells) were negative controls (NC). Spontaneous and maximum release (MR) were determined by adding target cells to wells containing NAB-CM or 1% Triton X-100 respectively. The data were expressed:
Limiting Dilution Analysis (LDA)
To quantify Cytotoxic T Lymphocyte precursor (CTLp) frequencies, LDA were performed as described elsewhere [23] with minor modifications. Briefly, recipient non-adherent responding cells were separated using nylon-wool. These were > 95% T-cells by flow. Twenty replicate cultures for each T-cell dose in eight serial dilutions ranging from 0 – 20,000 cells/well were prepared in 96-well U-bottom plates with 1×10⁵ donor or third party irradiated stimulator cells and 5×10⁴ autologous irradiated non-T feeder cells in 0.2 ml culture medium containing MLR supernatant (50% w/v) and 10 U/ml recombinant IL-2. On day 8, 5×10³ 51Cr-labeled PHA blast target cells from the corresponding stimulator were added and 4-hr chromium release assays performed. Means of 20 wells containing labeled target cells, stimulators and feeder cells were calculated and three standard deviations were added to the means to arrive at positive values. Data were plotted as log fraction non-responding cultures vs. T-cell dose. CTLp frequencies were calculated using Poisson distribution statistics [24].
Enzyme-Linked ImmunoSpot (ELISPOT) Assay
ELISPOT assays were performed as described by Heeger, et. al. [25, 26] with a few modifications. Briefly, ELISPOT plates were coated with capture antibodies for interferon-gamma (IFN-γ) or Granzyme-B (Gr-B) (BD Sciences, San Diego, CA) and blocked with NAB-CM (above). Two serial dilutions of recipient responder PBMC (3×10⁵ & 3×10⁴ per well) were stimulated with 3×10⁵ T-cell depleted donor or third party stimulator cells per well. Negative control wells contained responder cells or stimulators plus medium alone. Unlike the 24-hr incubation used by Heeger et. al. (estimating memory responses [26]), cultures were incubated for 36 hrs at 37°C to enumerate all reactive cells. Then, the plates were sequentially incubated at optimal dilutions with biotinylated detection antibodies for IFN-γ or Granzyme-B as appropriate, Streptavidin-HRP and 3-amino-9-ethylcarbazole (Pierce) spot development reagent with washing steps. The resulting spots were counted on a computer-assisted ImmunoSpot image analyzer (Cellular Technology Ltd). Results were depicted as mean of triplicate ELISPOT values in cultures containing responder plus donor or third party stimulator cells after subtracting the spots in cultures with responder cells or donor cells alone (normally <20 spots per 300,000 cells; hence the cut off value for a positive response was kept at 75 spots per million PBMC).
Trans-Vivo Delayed Type Hypersensitivity (T-V DTH) Assay
T-V DTH tests were performed as described [27, 28] with slight modifications. Briefly, 7×10⁶ recipient PBMC were combined with 10µg of donor sonicated PBMC (~10×106 cells) and injected into a SCID mouse footpad. Positive and negative controls consisted of recipient PBMC mixed with 10µg of Epstein-Barr virus (EBV) protein (ABI, Columbia, MD) or PBS, respectively. A fourth combination of recipient PBMC mixed with EBV protein plus donor sonicates detected specific “linked suppression”. The total inoculum volume was 50 µl. Swelling was measured by a spring-loaded caliper in units of 10−4 inches. Averages of three measurements of the negative control (usually less than 2×10⁻³ inches) were subtracted from similar measurements of the experimental and positive control combinations. Readings were taken by observers blinded to the injected material.
Panel Reactive Antibodies (PRA)
The PRA were monitored sequentially by microcytotoxicity using One Lambda Cells Trays LCT 60-ABC and LCT-3OD and Enzyme-linked Immunosorbent Assays (One Lambda kits LAT 140, 240 and 1288) as per the manufacturer’s protocol. Recently, Class-I, Class-II, antigen specific PRA and MICA measurements were performed retrospectively with frozen sera collected at biannual intervals using Luminex assays (One Lambda).
Chimerism Analysis
Donor chimerism in the recipient peripheral blood and iliac crest marrow aspirates was analyzed using the PCR-Flow assay described elsewhere [11, 29].
Statistics
Data were analyzed with graphical methods wherever applicable. All data were summarized using mean and standard deviation for continuous variables and count and frequency for categorical variables. Patients were clustered into different subsets based on responsiveness patterns within each single assay and for all six assays combined (MLR, CTL by CML, LDA and/or micro-CML, ELISPOT for IFN-γ, ELISPOT for granzyme-B, T-V DTH and anti-donor antibodies). Differences among the three treatment groups were compared using Fisher’s exact test. For all tests, a p value of < 0.05 was considered statistically significant.
RESULTS
Clinical Follow-up
The demographics and clinical recipient status are shown in supplementary data-Table 1. Because of geography, there was a significantly higher proportion of Hispanics. All study patients had functioning grafts with no recent infections requiring hospitalization, cancer or limiting cardiovascular disease (not shown). There was only one biopsy proven acute and no chronic rejection during the entire postoperative follow-up period in each of the groups (Supplementary data-Table 1). There was no significant change in recipient Cr long-term from the baseline levels. All were under long-term triple IS (see above) but with an overall tendency to dose reduction (NS).
Antibody Responses
All recipients had donor negative crossmatches before transplantation. The PRA performed semi-annually were increased across the board peaking at 2–5 years post-transplantation (Table 1) predominantly to non-donor HLA-Class I and less frequently to Class II specificities. No donor specific antibodies were observed. Antibodies to MICA occurred in some patients with no clinically observed differences between reactors and non-reactors (not shown).
Table 1.
Ex vivo immune and in vivo antibody responses in LRD-kidney transplant recipients A
| Recipient | Months Post-Tx |
MLR B to Donor |
Micro- CML B to Donor |
IFN-g ELISpot B to Donor |
Granzyme-B ELISpot B to Donor |
Transvivo -DTH to B, C | % Donor Chimerism in Recipient Marrow |
Abs. to donor antigens B |
% Class-I PRA by Luminex During |
% Class-II PRA by Luminex During |
||||||||
|---|---|---|---|---|---|---|---|---|---|---|---|---|---|---|---|---|---|---|
| Donor | EBV | EBV+ Donor |
Pre-Tx | Peak (Mo) | Last 1 Yr | Pre-Tx | Peak (Mo) | Last 1 Yr |
||||||||||
| DBMC Infused Group | 1 | AE1 | 84 | − | − | − | − | − | ++ | − | 1.41 | − | 100 | 100 | 100 | 0 | 0 | 0 |
| 2 | AV | 78 | − | − | − | − | − | ++ | + | 0.82 | − | 50 (84M) | 50 | 0 | 0 | |||
| 3 | BM | 91 | − | − | − | − | − | ++ | − | 0.83 | − | 100 | 33 (72M) | 33 | ||||
| 6 | CR | 74 | − | − | − | − | − | ++ | + | 0.81 | − | 0 | 0 | 0 | 0 | |||
| 7 | DD | 60 | − | − | − | − | − | + | − | 1.13 | − | 0 | 26 (48M) | 0 | 0 | 0 | 0 | |
| 9 | LH | 49 | − | − | − | − | − | + | − | 0.48 | − | 0 | 0 | 0 | 0 | 0 | 0 | |
| 8 | GA | 62 | − | − | − | − | − | ++ | − | 1.02 | − | 50 | 100 (48M) | 100 | 30 | 100 (48M) | 100 | |
| 16 | SC | 86 | + | − | − | − | − | +++ | + | 1.24 | − | 0 | 100 (24M) | 0 | 65 (36M) | 0 | ||
| 20 | VR | 66 | + | − | − | + | − | 1.07 | − | 0 | 5 (43M) | 0 | 0 | 0 | 0 | |||
| 14 | RJ | 52 | +++ | − | − | ++ | − | + | − | 0.94 | − | 0 | 100 (60M) | 65 (60M) | ||||
| 12 | PR | 112 | − | − | − | − | +++ | +++ | − | 0.89 | − | 33 | 100 (24M) | 0 | 0 | 0 | 0 | |
| 11 | MJ1 | 77 | + | − | − | − | ++ | ++ | + | 0.79 | − | 100 | 100 | 0 | 0 | |||
| 19 | VM | 72 | − | − | + | − | + | ++ | − | 0 | 100 (6M) | 33 | 0 | 100 (6M) | 0 | |||
| 15 | RL | 62 | + | − | + | − | − | +++ | ++ | − | ||||||||
| 10 | MA1 | 56 | − | − | + | − | + | +++ | + | 0.7 | − | 0 | 83 (48M) | 0 | 0 | 65 (24M) | 0 | |
| 17 | SS | 78 | + | − | ++ | +++ | + | +++ | − | 1.12 | − | 50 | 100 | 100 | 0 | 65 (36M) | 35 | |
| 5 | CP | 81 | ++ | − | + | +++ | − | + | ++ | 1.16 | − | 33 (6M) | ||||||
| 18 | TH | 66 | ++ | + | + | + | + | ++ | +++ | 0.95 | − | 0 | 17 (6M) | 0 | 0 | 0 | 0 | |
| Control Group | 6 | GB | 69 | + | − | − | − | + | +++ | +++ | − | − | ||||||
| 1 | DJ | 91 | ++ | − | − | − | ++ | ++ | ++ | − | − | 0 | 31 (86M) | |||||
| 5 | FR | 54 | + | + | − | − | ++ | ++ | ++ | − | − | 0 | 0 | 0 | 0 | 0 | 0 | |
| 7 | MJ2 | 60 | − | − | ++ | − | + | +++ | +++ | − | − | 0 | 0 | 0 | 0 | 0 | 0 | |
| 4 | BR | 50 | ++ | − | ++ | − | +++ | ++ | +++ | − | − | 0 | 0 | 0 | 0 | 0 | 0 | |
| 2 | MA2 | 84 | − | + | − | ++ | +++ | +++ | ++ | − | − | 33 | 84 (1M) | 65 | 0 | 0 | 0 | |
| 3 | RY | 65 | + | + | + | + | +++ | +++ | +++ | − | − | 50 | 86 (24M) | 33 | 0 | 0 | 0 | |
| 8 | CM | 79 | − | − | − | + | − | − | 0 | 0 | 0 | 0 | 0 | 0 | ||||
| HLA-Identical Group | 1 | FL | 76 | − | − | − | − | − | +++ | +++ | − | 3 | 3 (27M) | 0 | 0 | 0 | 0 | |
| 4 | WG | 70 | − | − | − | − | − | + | + | − | 0 | 0 | 0 | 0 | 0 | 0 | ||
| 7 | GM | 66 | − | − | − | − | − | + | + | − | 0 | 67 (12M) | 0 | 65 (12M) | ||||
| 8 | CA | 114 | − | − | − | − | − | 5 | 0 | 0 | 0 | 0 | 0 | |||||
| 10 | LJ2 | 61 | − | − | − | − | − | + | − | − | 18 | 22 (18m) | 0 | 0 | 0 | 0 | ||
| 9 | PE | 134 | − | − | − | − | ++ | +++ | +++ | − | 0 | 100 (36M) | 0 | 100 | 100 | |||
| 5 | LJ1 | 56 | − | − | ++ | + | − | − | + | − | 0 | 0 | 0 | 0 | 0 | 0 | ||
| 3 | CE | 61 | − | − | ++ | − | + | + | + | − | 40 | 46 (56M) | 0 | 0 | 0 | 0 | ||
| 11 | AE2 | 44 | + | − | +++ | ++ | − | 83 | 100 (36M) | 83 | 100 | 100 | 62 | |||||
| 6 | HM | 114 | − | − | − | + | + | +++ | +++ | − | ||||||||
| 2 | SJ | 75 | − | − | + | − | +++ | − | − | − | 0 | 100 (12M) | 83 | 0 | 100 (12M) | 0 | ||
In each patient the MLR, micro-CML, ELISPOT for IFN-gamma & Granzyme-B, Transvivo-DTH and antibodies to donor & PRA were assessed simultaneously on the same day at indicated months post-transplant. The Table is arranged to bunch the more hyporesponsive patients at the top in the respective groups.
−, +, ++, +++ = denotes negative, low, intermediate, or high responses respectively. Blank space = Not done; Bold symbols = Significant reactions
"Linked suppression" is indicate by reduced Transvivo-DTH responses in the EBV+Donor combination from those to EBV alone.
Mixed Lymphocyte Reactions
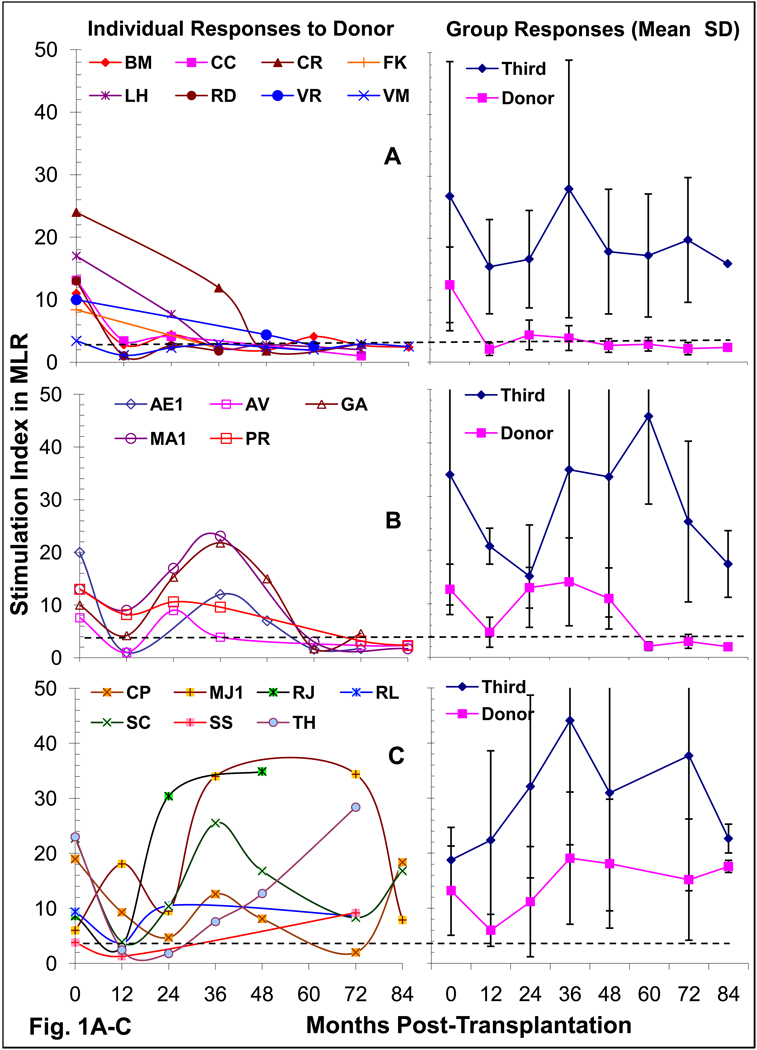
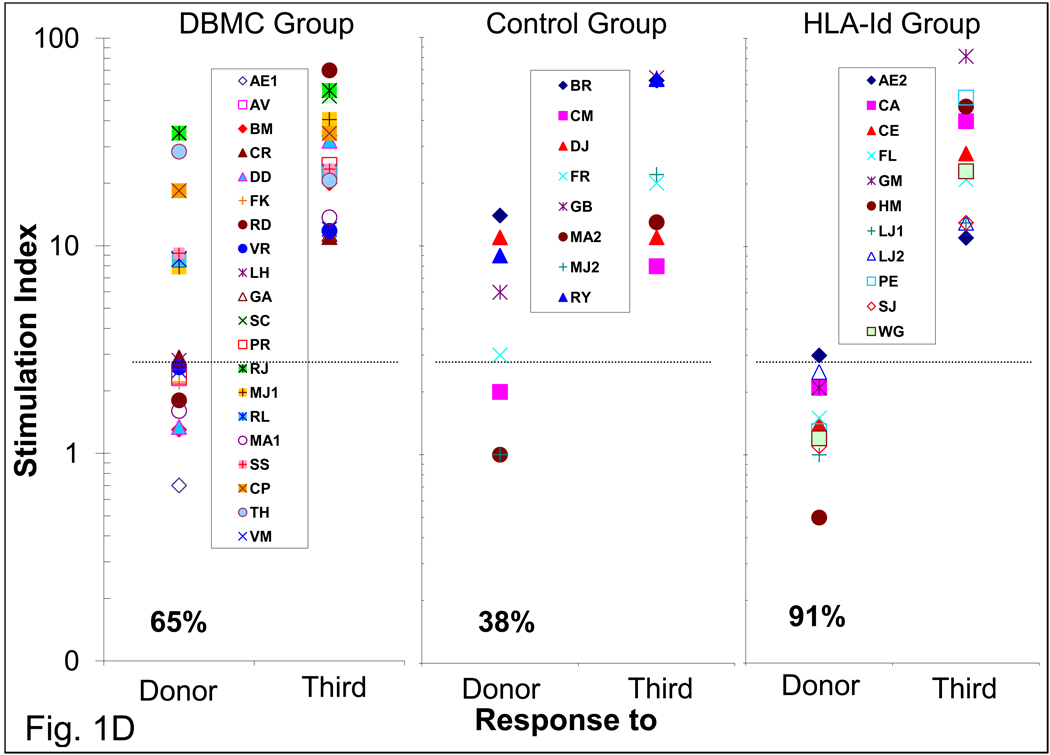
Serial post-transplant MLR in the 20 DBMC recipients showed three patterns of reactivity (Fig. 1). Eight became donor specifically unresponsive by 1–3 years with no reversion to positivity (Fig.1A). In 5 there was a transient reduction, followed by a return to reactivity which eventually reverted back to donor specific unresponsiveness long-term (Figure 1B). A total of 13/20, therefore, showed long-term donor specific unresponsiveness. However, in 7 the anti-donor reactivity gradually returned after earlier non-specific reduction (Figure 1C). All had consistently positive third party reactivity, except for transient reduction 1–2 years postoperatively (Fig.1A, B & C, right panels); therefore, longer term unresponsiveness was donor-specific. However, 3 of 8 non-infused haploidentical controls and most of the HLA-id patients also showed long-term donor specific unresponsiveness (Fig.1D) (p= 0.37, DBMC vs haplo-controls).
Figure 1. Mixed Lymphocyte Reaction (MLR) in Kidney transplant recipients.
1×10⁵ recipient responder PBMC were stimulated with 1×10⁵ donor or third party irradiated PBMC and standard 16-hr 3H-thymidine incorporation assays were performed after 7 days (peak proliferation). The stimulation indices (mean of triplicate cultures) categorized individual DBMC recipients into one of three patterns (A, B & C) of reactivity to the donor (left). On the right the mean ± SD responses to the donor and third party of the group are shown. In Fig. 1D, the SIs. of the three groups of patients are compared at 49–134 months post-transplant. SI. of 3 was considered the cut-off value for a positive response [11], represented by the dashed lines and the percentage of recipients showing unresponsiveness long-term are shown at the bottom. Please note that the data are shown in log-10 scale in Fig. 1D.
Cytotoxic Immune Responses
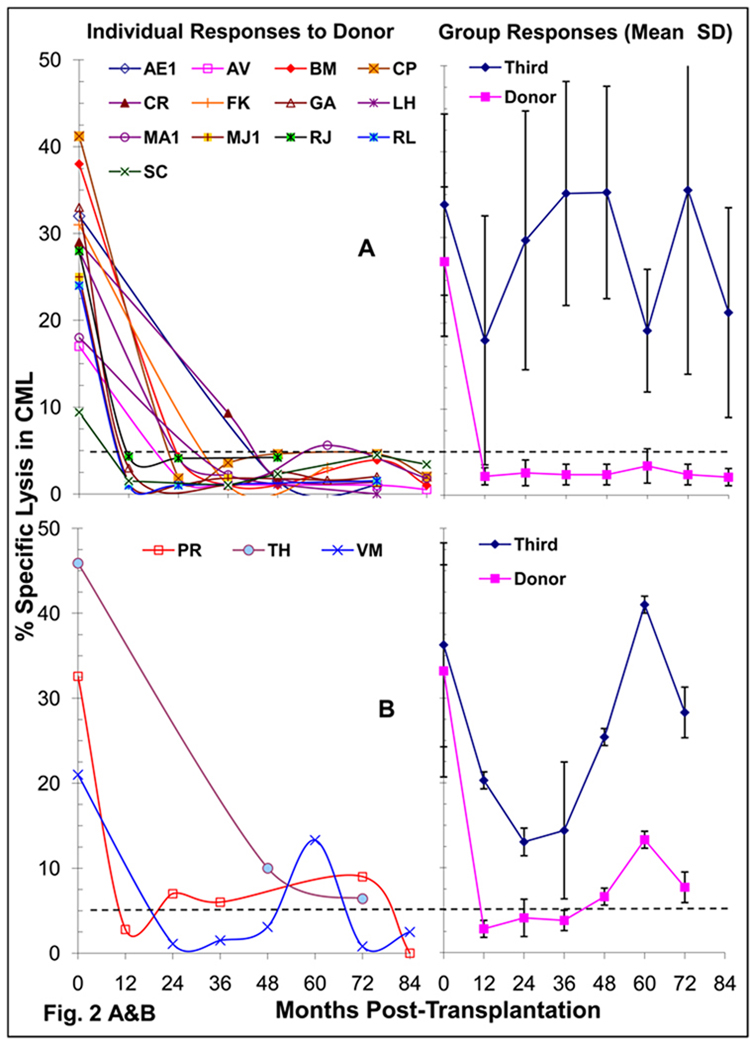
The CTL responses to the donor were serially followed at yearly or two year intervals in 16 DBMC patients some of which also by limiting dilution analysis. Thirteen patients showed donor specific CML unresponsiveness (Fig. 2A), and the three others showed borderline reactivity (Fig.2B). All reacted to third party cells.
Figure 2. Cytotoxic T Cell responses in LRD-Kidney transplant recipients.
(A & B) Cell Mediated Lympholysis (CML) in DBMC infused recipients: 4×10⁶ recipient responder PMBC were cultured with 4×10⁶ irradiated donor or third party PMBC and standard 4 hr 51Cr-release assays against the respective stimulators were performed on day 8. The data on the left are shown as percent specific lysis for E: T ratios of 50:1 in individual recipients, which segregated into two patterns of reactivity to the donor, i.e. the majority showing unresponsiveness (A) and a minority showing residual responses (B) after 1–3 years post-transplant. On the right is represented the mean ± SD responses of the two patterns A & B to the donor and third party. Percent specific lysis of 5 was considered the cut-off value for a positive response [11], represented by the dashed lines.
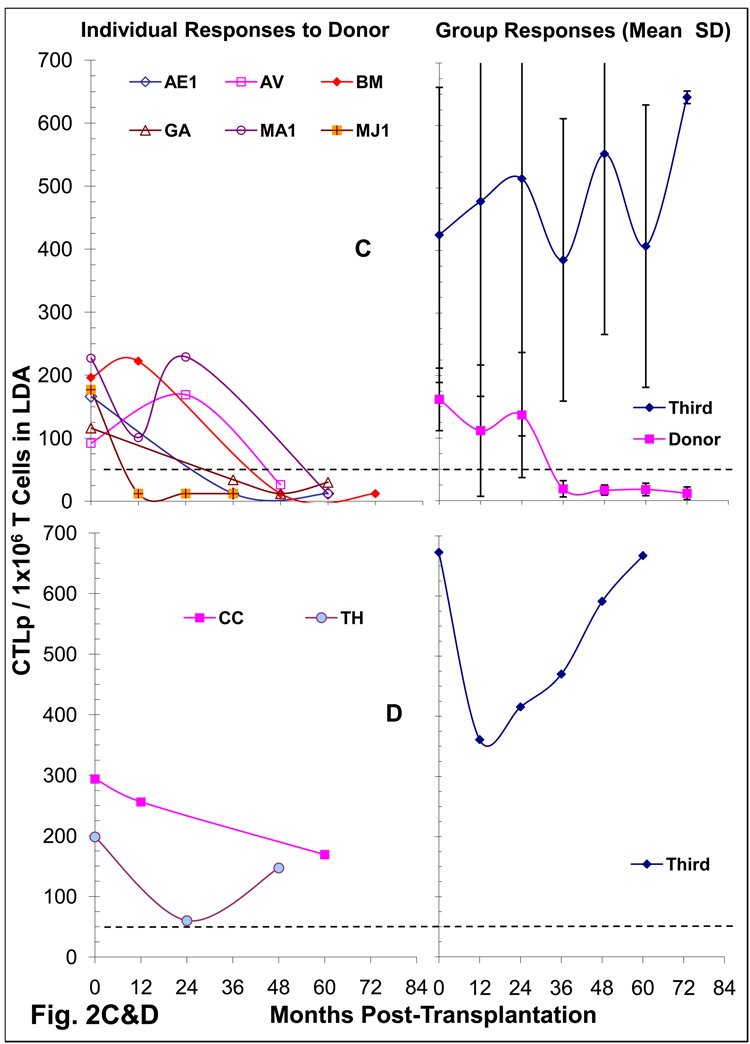
(C&D) Limiting Dilution Analysis (LDA) for the enumeration of CTL-precursors in DBMC infused Kidney transplant recipients: Serial dilutions of recipient responder T cells (0 – 20,000 cells/well) were stimulated with 1×10⁵ irradiated donor or third party PMBC in presence of 5×10⁴ autologous non-T cells. On day 8, 5×10³ 51Cr-labeled PHA blast target cells from the corresponding stimulator were added and 4-hr chromium release assays were performed. Data were plotted as log fraction non-responding cultures vs. T cell dose, the frequencies calculated and depicted here as CTLp per 1×10⁶ T cells. CTLp frequency of 50 per 1×10⁶ T cells was considered the cut-off value for a positive response, represented by the dashed lines. Two patterns of reactivity (C & D) were observed with the majority showing deletion of donor specific CTLp after 1–3 years (C). On the left are depicted the CTLp frequencies of individual recipients; and on the right are the mean ± SD frequencies of the groups (C or D).
E: Micro-CML responses in three groups of LRD-Kidney transplant recipients at 49–134 months: Micro-CML were performed as described under Materials and Methods. Percent specific lysis of 5 was considered the cut-off value shown by the dashed lines and the percentage of recipients demonstrating donor specific unresponsiveness are indicated below data symbols.
To monitor whether the CTL unresponsiveness occurred at the precursor level, 8 DBMC recipients were also serially tested in LDA (Fig. 2C & D). Six who were also unresponsive in CML also showed CTLp frequencies below detection levels after 24 months (Fig. 2C) while 2 were marginally positive (Fig. 2D). Additionally, among 14 other DBMC recipients, not serially followed by LDA but tested only once post-operatively after 24 months, 6 had borderline CTLp (50–147 per 1×10⁶ T cells), while 8 became negative to the donor (not shown). This was in contrast to “normal” CTLp levels (92 – 294 per 1×10⁶ T cells) to the donor pre-transplantation, and 101 – 1,000 CTLp per 1×10⁶ T cells to a third party at all times tested. These findings were consistent with the notion that the unresponsiveness of the DBMC recipients was at the CTL-precursor level.
We have also compared the micro-CML responses in the three groups of patients between 50 – 134 months post-transplantation (Fig.2E). All except 1/18 of the DBMC infused and all HLA-id patients showed donor specific unresponsiveness, while 3/8 control patients were reactive (p= 0.12, DBMC vs haplo-controls).
ELISPOT assays for the enumeration of IFN-γ and Granzyme-B producing cells
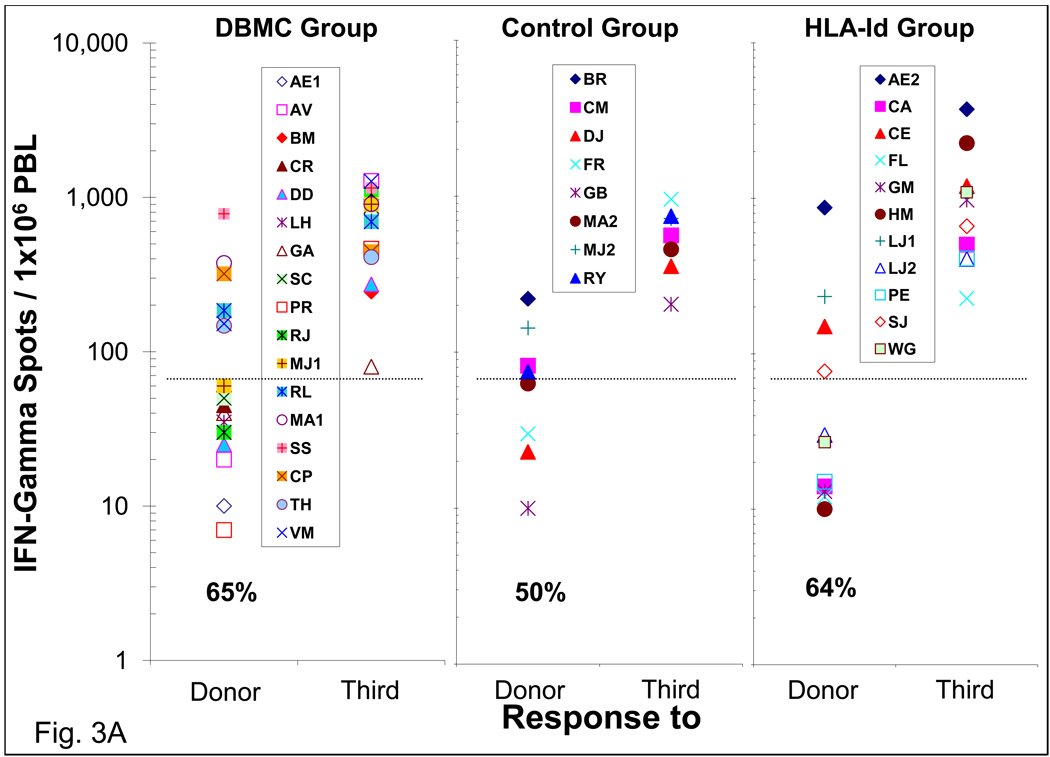
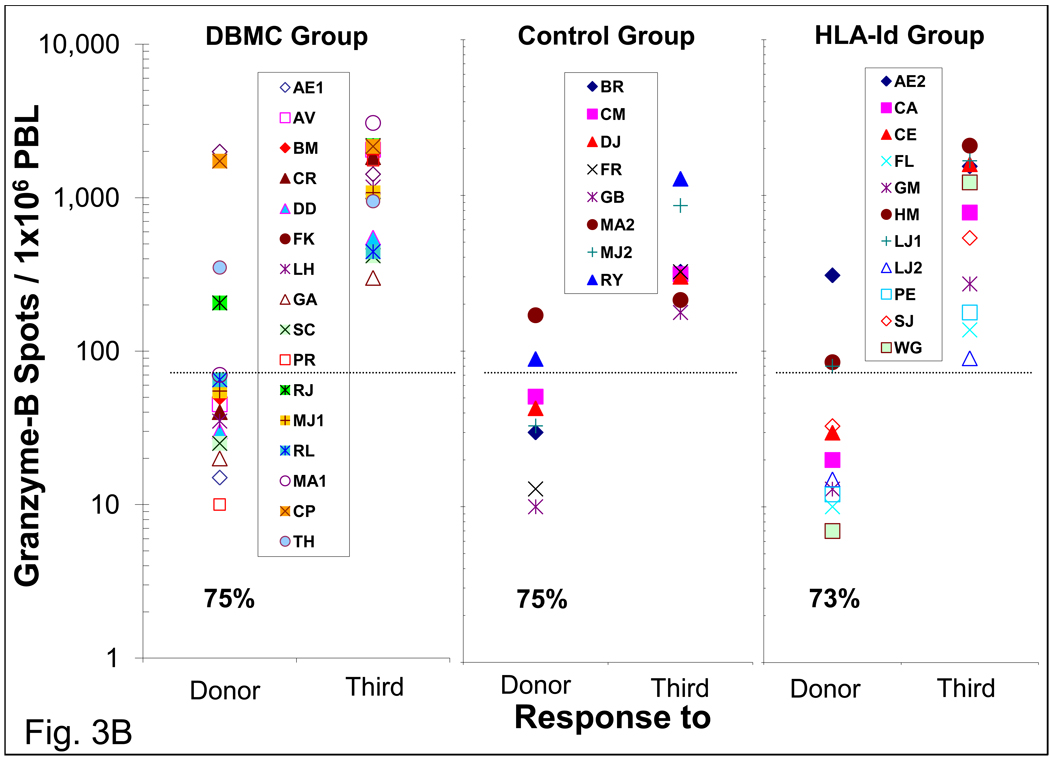
When the ELISPOT technology became available, it was performed between 48 and 134 months post-transplantation for IFN-γ and granzyme-B producing cells. As in the case of MLR and CTL assays, the majority of the DBMC infused patients did not have IFN-γ (11/17) and Granzyme-B (12/16) producing cells to the donor (Fig. 3). A similar profile was observed in the haplo-controls and HLA-id recipients. Even in the few residual responders the frequency of donor reactive cells was significantly lower than that against the third party. Pre-transplant anti-donor IFN-γ and Granzyme-B responses performed subsequently in another group of LRD-haploidentical renal transplant patients were found to be between 200–793 secreting cells per 1×10⁶ PBMC (n=15, data not shown).
Figure 3. Enzyme-Linked ImmunoSpot (ELISPOT) assay for the enumeration of interferon-gamma and granzyme-B secreting cells in LRD -Kidney transplant recipients.
Two serial dilutions of recipient PMBC responder cells (3×10⁵ & 3×10⁴ per well) were stimulated with 3×10⁵ per well T cell depleted donor or third party cells in capture antibody coated ELISPOT plates. After 36 hrs, the plates were washed and analyzed for the respective cytokines using biotinylated antibodies, followed by signal development and detection with ELISPOT reader. Each symbol represents data from individual recipients. The frequency of 75 cytokine secreting cells per million PMBC was considered the cut-off value for a positive response represented by the dashed line and the percentage of recipients demonstrating donor specific unresponsiveness are indicated below data symbols. The frequencies of IFN-γ (A) and Granzyme-B (B) secreting cells in the three groups of patients are shown.
Transvivo-DTH Assay (T-V DTH)
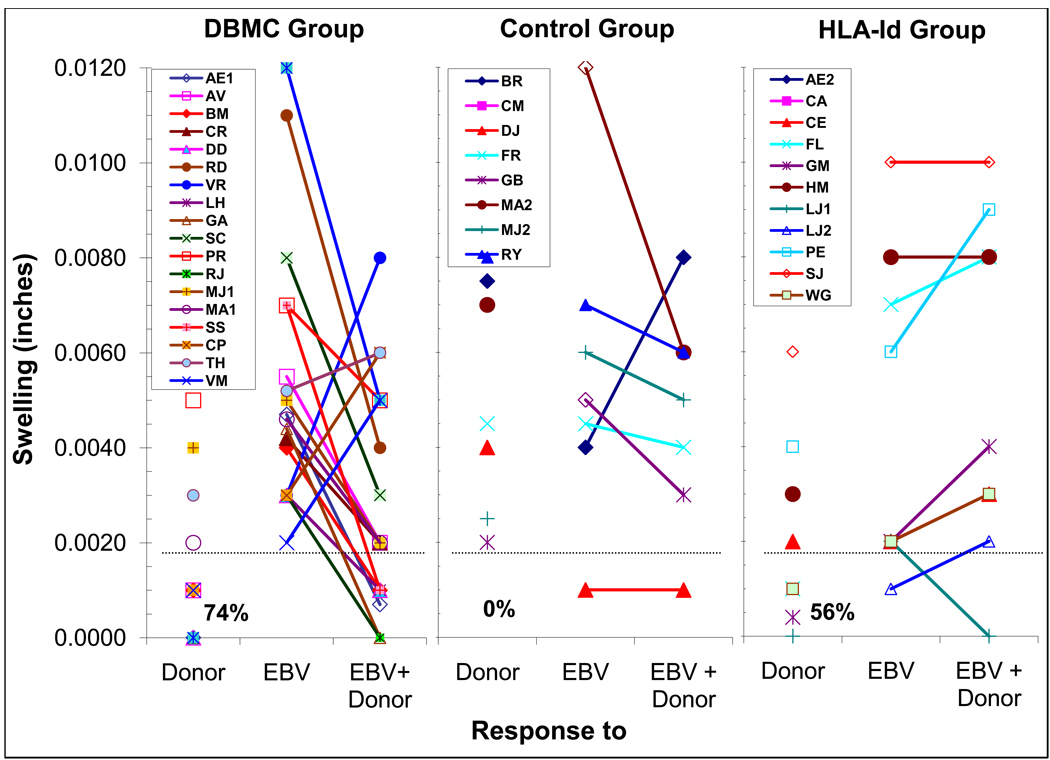
Most of the recipients were also followed one or more time(s) between 48 and 134 months postoperatively with T-V DTH when that assay became available. Fourteen of nineteen DBMC recipients had no T-V DTH responses to the donor, while 5 were reactive (Fig. 4, left). All were reactive to EBV. In 16/19 recipients donor but not third party sonicate down-regulated the EBV responses, termed “linked suppression”, indicative of regulatory cells in the recipient PBMC. In contrast none of the haplo-controls showed donor specific unresponsiveness (p<0.01) and only 1/8 had “linked suppression”. Unexpectedly, 4/9 HLA-id patients reacted to the donor and only 1 demonstrated “linked suppression”.
Figure 4. Trans-vivo Delayed-Type Hypersensitivity (T-V DTH) assay in LRD-Kidney transplant recipients and its correlation with linked suppression.
7×10⁶ responder recipient PMBC were combined with stimulator sonicated donor PMBC, Epstein-Barr virus (EBV) protein (experimental and positive controls, respectively) or a mixture of the two (for assessing “linked suppression”) and injected into a pre-measured SCID mouse footpad. Twenty-four hours later foot-pad measurements were taken again and the data are expressed as swelling after subtracting the values seen with the (negative) medium control. The experiments were performed blindly, i.e., the measuring observer was unaware of the composition of the various inocula. Each symbol represents an individual recipient. Swelling of 0.002 inch above the saline control was considered positive reactivity and represented by the dashed line, and the percentages of recipients demonstrating donor specific unresponsiveness are indicated below data symbols in each group. A decrease in 0.002 inch to the positive EBV control by the presence of donor antigen was considered indicative of “linked suppression” which is depicted as down-ward curves from the response to EBV to the responses to EBV+Donor. The patients CP, TH & VM were the only recipients in the DBMC group in whom both a positive anti-donor response and no “linked suppression” were observed (upward lines in A).
Note: since the anti-donor values in the DBMC and HLA-id groups were either 0.000 or 0.001, all the symbols were plotted overlapping one another by the graphing program, and hence are not visible.
Assessment of Regulatory functions
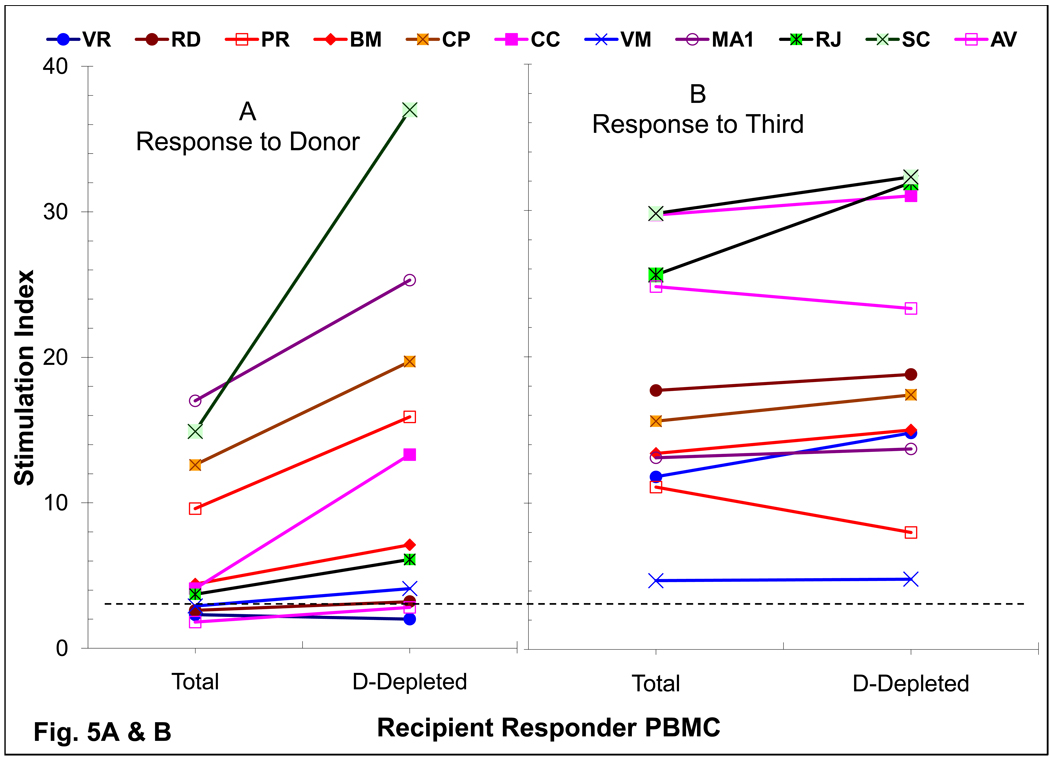
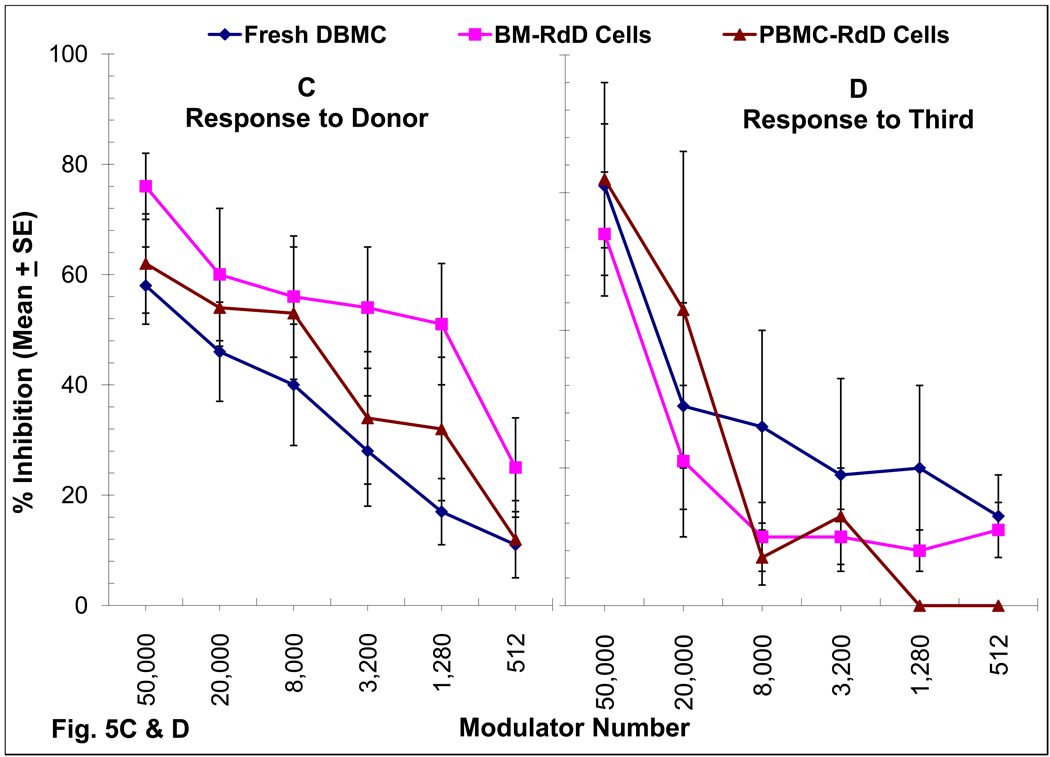
To define the role of regulatory cells of donor phenotype on the observed immune unresponsiveness, donor chimeric cells were depleted and then also added back to the recipient responder cells in MLR (Fig. 5). In DBMC patients, who were still reactive at 1–3 years post-transplant, an increase of 189±64% response (n=8; p < 0.009) was observed in the anti-donor MLR (Fig. 5A). However, among the 3 recipients who had become unresponsive to the donor, depletion of the donor chimeric cells did not bring back the responses (Fig.5A) with no (VR & RD; Fig. 1A); (2) or transient (AV; Fig. 1B) return of anti-donor MLR reactivity. There was no significant increase (106±15%; p = 0.06) in the MLR to the third party (Fig.5B).
Figure 5. Role of chimeric cells of donor phenotype present in DBMC recipients on MLR regulation.
(A & B): Recipient PMBC were used as responders in MLR either before (Total) or after the depletion of donor cells (D-Depleted) using monoclonal antibodies to mismatched HLA-Class I and Miltenyi magnetic microbeads.
(C & D): 1×10⁵ PMBC from renal transplant recipients depleted of donor chimeric cells were stimulated with 1×10⁵ irradiated PMBC from the living related donors (C) or third Party (D) in presence of the indicated number of donor modulator cells and standard 3H-thymidine incorporation assays were performed on day 7. Data are shown as percentage inhibition ± SE (n=6; i.e. patients CC, CP, MA, RD, VM & PR). Statistically significant differences were obtained in the inhibition of anti-donor MLR between fresh DBMC versus RdD cells from the bone marrow (BM-RdD; p< 0.001) and fresh DBMC versus RdD cells from the peripheral blood (PBL-RdD; p<0.01).
When purified cells of donor phenotype, termed recipient derived donor (RdD) cells, from recipient post-transplant iliac crest bone marrow (BM-RdD) or peripheral blood (PBL-RdD) were added back into the cultures, there was a dose-dependent inhibition of the MLR (Fig. 5C). This was more marked than that observed with fresh donor bone marrow obtained at the time of the follow-up (Fig. 5C), confirming our previous report [20]. Additionally, this inhibition was quasi-antigen specific in that the anti-third party MLR responses were inhibited only at higher but not at lower modulator cell numbers, whereas anti-donor responses were still significantly inhibited (Fig 5C vs. Fig 5D; p< 0.002).
Donor Microchimerism
All DBMC recipients had between 0.48% and 1.41% donor microchimerism in iliac crest bone marrow samples (Table 1), levels ~10-fold higher than those in the PBMC (data not shown; please see reference 15). However, microchimerism levels did not appear to be proportional to the degree of donor specific unresponsiveness in the various immune assays, i.e., the DBMC patients towards the top of the DBMC group in Table 1 did not have higher bone marrow chimerism than those towards the bottom of the group. The haplo-controls did not have detectable PBMC chimerism. The bone marrow of the haplo-controls and HLA-id as well as the peripheral blood of the HLA-id were not tested.
Summation of all ex vivo assays
Since the study was also to identify recipients predictive of possible IS withdrawal, each patient was tested simultaneously in MLR, micro-CML, ELISPOT assays for IFN-γ and granzyme-B, T-V DTH and for antibodies between 49–134 months post-transplantation (Table 1). The rationale for this approach was that each of these assays measures a different aspect of the immune response and that all had been previously utilized singly to assess tolerogenic profile, but with limited success. It had been suggested that a positive MLR to the donor might even be due to the proliferation of donor specific regulatory cells and thus might not be indicative of the absence of tolerance (workshops, unpublished). Therefore, if the MLR data were excluded, 9/18 DBMC patients were unresponsive to the donor in all the other assays (Table 1, top left), five responded only in one other assay and only 4 (MA1, SS, CP & TH) were reactive in more than 2 assays (Table 1 and Figs 2–5); even these did not show any adverse clinical events on IS (Supplementary Table 1). All except patients VM, CP and TH also showed linked suppression in the T-V DTH assay. With the same criteria, none of the haploidentical control patients showed across the board donor specific unresponsiveness (Table 1, middle). The HLA identical group showed similar pattern (Table 1, bottom) to the DBMC infused group, except for the absence of linked suppression in 8/9 patients. When the assays were repeated again in a majority of theses patients similar results were obtained (not shown). Therefore, using this more stringent criterion for donor specific unresponsiveness, possible tolerant individuals were observed in the DBMC infused group as was done in the HLA-identical group of patients, thus indicating the tolerogenic nature of DBMC.
DISCUSSION
We have followed-up three groups of LRD-kidney transplant patients so as to distinguish their anti-donor immune reactivities as well as to possibly identify potentially tolerant recipients, although all were still IS treated. The approach was to use a summation of the reactivities in multiple functional ex vivo immune assays. They included MLR, micro-CML (also CML and LDA for CTL), ELISPOT for the enumeration of interferon-gamma and granzyme-B secreting cells, trans-vivo DTH, and luminex/micro-cytotoxicity to detect donor and panel reactive antibodies. The rationale for this approach was that each of these assays measures a different aspect of the immune response and that all had been previously utilized singly to assess tolerogenic profile, but with limited success. The mechanism of chimerism mediated regulation was also assessed in a group of DBMC infused recipients by depleting the cells of donor phenotype from the recipient’s post-transplant responding cells in MLR as well as by adding them back to the cultures at serial doses.
Despite the recent observations by Kawai, et.al. [30], we still consider the absence of antibodies to the donor as a pre-requisite for tolerance. None of the three groups of patients had antibodies to the donor (Table 1). However, when very sensitive Luminex assessments were made, many patients had varying levels of (non-specific) PRA (Supplemental Table 1) and antibodies to MICA (not shown); but their relevance is still not clear.
Among the cellular immune responses, the first to disappear were donor specific CTLs, consistent with previous observations [31, 32]. Thus, CML unresponsiveness was observed in most DBMC patients after 1–2 years (Fig. 2A), which appeared to be due to the deletion of CTL-precursors from the peripheral circulation as shown by the LDA results (Fig. 2 C), possibly similar to observations in liver transplant recipients [23]. However, in a few recipients PBMC were still capable of producing granzyme-B upon stimulation with donor cells even 5–6 years post-operatively (Fig. 3 D & Table 1), thus also indicating that the CTLs might not be deleted as yet in all recipients.
The T-V DTH assay is a relatively new and is being utilized in a few laboratories for transplant immune monitoring [27, 28, 33, 34]. It appeared to be quite sensitive to detect alloimmune sensitization vs immunoregulation in this study (Fig. 4 and Table 1). However, the T-V DTH can be very subjective, and needs to be performed in a blinded fashion. Nonetheless, in the present study, it was the only assay that singly discriminated between the controls, the DBMC infused and the HLA-identical patients. Thus, none of the controls but majority of DBMC infused recipients, showed both donor specific unresponsiveness and “linked suppression” [28]. It is interesting to note that 4/11 HLA-identical recipients showed T-V DTH to the donor possibly by allo-sensitization to donor non-MHC and/or minor antigens [35]. However, since this group of patients was not infused with DBMC, the majority did not demonstrate “linked suppression”. The latter finding is in divergence with those of Cai et al, [35] who observed “linked suppression” in this group.
The production of IFN-γ in the ELISPOT assays appears to be important since patients who produced this cytokine were also reactive to the donor in many other assays (Table 1).
A mechanism by which unresponsiveness to the donor occurred in DBMC patients might have been through immune regulation by donor microchimerism in the bone marrow compartment (Table 1) and in the circulation [12, 15]. Depletion of cells of donor phenotype from the post-transplant responder PBMC increased the anti-donor MLR (Fig. 5A) and in some patients CML responses (not shown). This increase was observed in patients who were still reactive or had become recently unresponsive to the donor (i.e. at the early post-transplant period). Furthermore, addition of purified RdD chimeric cells into donor cell-depleted recipient responder PBMC specifically inhibited the recipients’ MLR in a dose-dependent manner (Fig. 5C), confirming our previous results [15, 20]. This inhibition was quasi-antigen specific in that the anti-third party MLR responses were strongly inhibited at higher but not at lower modulator cell numbers (Fig. 5D) that still inhibited the anti-donor responses (Fig. 5C). This specificity was also observed when depletion of donor chimeric cells did not increase the anti-third party MLR (Fig. 5B). Similar regulatory cell effects were also observed by Burlingham et al. [36]. We have also observed such phenomena in alemtuzimab treated, donor hematopoietic stem cell infused recipients, in that depletion of either donor cells or recipient CD25+ cells from the post-transplant responder PBMC increased the anti-donor MLR, as well as purified post-transplant chimeric cells of both donor and recipient phenotypes potently inhibited the (pre-transplant) responses in a dose-dependent manner [37]. Additionally, we have described the presence of higher levels of Fox-P3 messenger RNA in a group of long-term dd-kidney transplant recipients infused with DBMC and with better 10 year graft survival, when compared to similarly treated non-randomized non- infused controls [17]. These studies, therefore, would strongly suggest a major role for regulatory cells in inducing the ex vivo unresponsiveness observed after DBMC infusion, although the true test is obviously successful IS minimization or even withdrawal.
In summary we have developed a proposed “tolerance profile” for the identification of renal transplant recipients in whom reduction or perhaps complete withdrawal of IS might be considered. A systematic analysis of the three aspects of the anti-donor immune responses, i.e., humoral, cellular and inflammatory hypersensitivity, using an array of ex vivo assays has been performed. Use of this summation may allow us to propose a scheme wherein unresponsiveness to the donor in the various assays from most to least importance can be assessed: absence of antibodies to donor specificities > CTL unresponsiveness > absence of granzyme-B producing cells > non-reactivity in the transvivo-DTH assays > possible presence of “linked suppression in transvivo-DTH assays > absence of IFN-γ producing cells > possible MLR unresponsiveness. It may further be suggested that the patients who have achieved unresponsiveness to the donor in all these, except may be in the MLR, is truly tolerant to the donor. The only clear test for this notion is to discontinue the use of immunosuppressive drugs in these patients. Additionally, we have not monitored the immune status within the graft itself due to the invasiveness of the procedure. Most importantly, this study has also indicated the tolerogenic nature of DBMC infusions.
Supplementary Material
ACKNOWLEDGEMENTS
We thank Ms. Teresa Vallone for excellent technical help. This work was supported by NIH R01-DK25243-25 and Medical services of the Miami Veterans Affairs Medical Center.
ABBREVIATIONS
- 3H-TdR
Tritiated Thymidine
- BM
Bone Marrow
- CML
Cell Mediated Lympholysis
- CPM
Counts per Minute
- CTL
Cytotoxic T Lymphocytes
- CTLp
CTL Precursors
- Cr
Creatinine
- DBMC
Donor Bone Marrow Cell(s)
- dd
Deceased Donor
- EBV
Epstein - Barr Virus
- ELISPOT
Enzyme-Linked Immuno-spot
- Gr-B
Granzyme-B
- Haplo-controls
haploidentical LRD-kidney control patients (without DBMC infusion)
- HLA
Human Leukocyte Antigen
- HLA-Id
HLA-identical (Renal Transplant Patients)
- IFN-γ
Interferon-gamma
- IS
Immunosuppression; Immunosuppressive Drugs
- LDA
Limiting Dilution Analysis
- LRD
Living Related Donor
- MHC
Major Histocompatibility Complex
- MLR
Mixed Lymphocyte Reaction
- MMF
Mycophenolate Mofetil
- NAB-CM
Normal AB Serum containing Culture Medium
- PBMC
Peripheral Blood Mononuclear Cells
- PRA
Panel Reactive Antibodies
- RdD Cells
Recipient derived Donor Cells
- SCID
Severe Combined Immunodeficient
- SI
Stimulation Index
- T-V DTH
Trans-vivo Delayed Type Hypersensitivity
Footnotes
Publisher's Disclaimer: This is a PDF file of an unedited manuscript that has been accepted for publication. As a service to our customers we are providing this early version of the manuscript. The manuscript will undergo copyediting, typesetting, and review of the resulting proof before it is published in its final citable form. Please note that during the production process errors may be discovered which could affect the content, and all legal disclaimers that apply to the journal pertain.
REFERENCES
- 1.Salama AD, Womer KL, Sayegh MH. Clinical transplantation tolerance: many rivers to cross. Journal of Immunology. 2007;178(9):5419. doi: 10.4049/jimmunol.178.9.5419. [DOI] [PubMed] [Google Scholar]
- 2.Fudaba Y, Spitzer TR, Shaffer J, Kawai T, Fehr T, Delmonico F, Preffer F, Tolkoff-Rubin N, Dey BR, Saidman SL, Kraus A, Bonnefoix T, McAfee S, Power K, Kattleman K, Colvin RB, Sachs DH, Cosimi AB, Sykes M, Fudaba Y, Spitzer TR, Shaffer J, Kawai T, Fehr T, Delmonico F, Preffer F, Tolkoff-Rubin N, Dey BR, Saidman SL, Kraus A, Bonnefoix T, McAfee S, Power K, Kattleman K, Colvin RB, Sachs DH, Cosimi AB, Sykes M. Myeloma responses and tolerance following combined kidney and nonmyeloablative marrow transplantation: in vivo and in vitro analyses.[see comment] American Journal of Transplantation. 2006;6(9):2121. doi: 10.1111/j.1600-6143.2006.01434.x. [DOI] [PubMed] [Google Scholar]
- 3.Scandling JD, Busque S, Dejbakhsh-Jones S, Benike C, Millan MT, Shizuru JA, Hoppe RT, Lowsky R, Engleman EG, Strober S. Tolerance and chimerism after renal and hematopoietic-cell transplantation. New England Journal of Medicine. 2008;358(4):362. doi: 10.1056/NEJMoa074191. [DOI] [PubMed] [Google Scholar]
- 4.Slavin S, Fuks Z, Strober S, Kaplan H, Howard RJ, Sutherland DE. Transplantation tolerance across major histocompatibility barriers after total lymphoid irradiation. Transplantation. 1979;28(5):359. doi: 10.1097/00007890-197911000-00001. [DOI] [PubMed] [Google Scholar]
- 5.Gozzo JJ, Wood ML, Monaco AP. Use of allogenic, homozygous bone marrow cells for the induction of specific immunologic tolerance in mice treated with antilymphocyte serum. Surgical Forum. 1970;21:281. [PubMed] [Google Scholar]
- 6.Caridis DT, Liegeois A, Barrett I, Monaco AP. Enhanced survival of canine renal allografts of ALS- treated dogs given bone marrow. Transplantation Proceedings. 1973;5(1):671. [PubMed] [Google Scholar]
- 7.Thomas JM, Carver FM, Foil MB, Hall WR, Adams C, Fahrenbruch GB, Thomas FT. Renal allograft tolerance induced with ATG and donor bone marrow in outbred rhesus monkeys. Transplantation. 1983;36(1):104. [PubMed] [Google Scholar]
- 8.Starzl TE, Demetris AJ, Trucco M, Murase N, Ricordi C, Ildstad S, Ramos H, Todo S, Tzakis A, Fung JJ, et al. Cell migration and chimerism after whole-organ transplantation: the basis of graft acceptance. Hepatology. 1993;17(6):1127. [PMC free article] [PubMed] [Google Scholar]
- 9.Starzl TE, Demetris AJ, Trucco M, Zeevi A, Ramos H, Terasaki P, Rudert WA, Kocova M, Ricordi C, Ildstad S, Starzl TE, Demetris AJ, Trucco M, Zeevi A, Ramos H, Terasaki P, Rudert WA, Kocova M, Ricordi C, Ildstad S, et al. Chimerism and donor-specific nonreactivity 27 to 29 years after kidney allotransplantation. Transplantation. 1993;55(6):1272. doi: 10.1097/00007890-199306000-00012. [DOI] [PMC free article] [PubMed] [Google Scholar]
- 10.Ricordi C, Karatzas T, Selvaggi G, Nery J, Webb M, Fernandez H, Ruiz P, Kong SS, Esquenazi V, Miller J, et al. Multiple bone marrow infusions to enhance acceptance of allografts from the same donor. Annals of the New York Academy of Sciences. 1995;770:345. doi: 10.1111/j.1749-6632.1995.tb31066.x. [DOI] [PubMed] [Google Scholar]
- 11.Garcia-Morales R, Carreno M, Mathew J, Zucker K, Cirocco R, Ciancio G, Burke G, Roth D, Temple D, Rosen A, Fuller L, Esquenazi V, Karatzas T, Ricordi C, Tzakis A, Miller J. The effects of chimeric cells following donor bone marrow infusions as detected by PCR-flow assays in kidney transplant recipients. Journal of Clinical Investigation. 1997;99(5):1118. doi: 10.1172/JCI119240. [DOI] [PMC free article] [PubMed] [Google Scholar]
- 12.Garcia-Morales R, Carreno M, Mathew J, Cirocco R, Zucker K, Ciancio G, Burke G, Roth D, Temple D, Fuller L, Esquenazi V, Eskind L, Kenyon NS, Ricordi C, Tzakis A, Miller J. Continuing observations on the regulatory effects of donor-specific bone marrow cell infusions and chimerism in kidney transplant recipients. Transplantation. 1998;65(7):956. doi: 10.1097/00007890-199804150-00016. [DOI] [PubMed] [Google Scholar]
- 13.Miller J, Mathew J, Garcia-Morales R, Zucker KE, Carreno M, Jin Y, Fuller L, Burke GW, Ciancio G, Tzakis AG, Ricordi C, Olson L, Rosen A, Roth D, Esquenazi V. The human bone marrow as an immunoregulatory organ. Transplantation. 1999;68(8):1079. doi: 10.1097/00007890-199910270-00001. [DOI] [PubMed] [Google Scholar]
- 14.Ciancio G, Miller J, Garcia-Morales RO, Carreno M, Burke GW, 3rd, Roth D, Kupin W, Tzakis AG, Ricordi C, Rosen A, Fuller L, Esquenazi V. Six-year clinical effect of donor bone marrow infusions in renal transplant patients. Transplantation. 2001;71(7):827. doi: 10.1097/00007890-200104150-00002. [DOI] [PubMed] [Google Scholar]
- 15.Ciancio G, Burke GW, Garcia-Morales R, Suzart K, Rosen A, Ricordi C, Kenyon NS, Mathew JM, Tzakis AG, Esquenazi V, Miller J. Effect of living-related donor bone marrow infusion on chimerism and in vitro immunoregulatory activity in kidney transplant recipients. Transplantation. 2002;74(4):488. doi: 10.1097/00007890-200208270-00010. [DOI] [PubMed] [Google Scholar]
- 16.Chatzipetrou MA, Mathew JM, Kenyon NS, Esquenazi V, Miller J, Ricordi C, Tzakis AG. Analysis of post-transplant immune status in recipients of liver/bone marrow allografts. Human Immunology. 1999;60(12):1281. doi: 10.1016/s0198-8859(99)00115-9. [DOI] [PubMed] [Google Scholar]
- 17.Cirocco RE, Carreno MR, Mathew JM, Garcia-Morales RO, Fuller L, Esquenazi V, Ciancio G, Burke GW, Gaynor JJ, Blomberg BB, Rosen A, Kleiner G, Ricordi C, Miller J, Cirocco RE, Carreno MR, Mathew JM, Garcia-Morales RO, Fuller L, Esquenazi V, Ciancio G, Burke GW, Gaynor JJ, Blomberg BB, Rosen A, Kleiner G, Ricordi C, Miller J. FoxP3 mRNA transcripts and regulatory cells in renal transplant recipients 10 years after donor marrow infusion. Transplantation. 2007;83(12):1611. doi: 10.1097/01.tp.0000266908.37446.02. [DOI] [PubMed] [Google Scholar]
- 18.Ciancio G, Burke GW, Moon J, Garcia-Morales R, Rosen A, Esquenazi V, Mathew J, Jin Y, Miller J. Donor bone marrow infusion in deceased and living donor renal transplantation. Yonsei Medical Journal. 2004;45(6):998. doi: 10.3349/ymj.2004.45.6.998. [DOI] [PubMed] [Google Scholar]
- 19.Mathew JM, Garcia-Morales RO, Carreno M, Jin Y, Fuller L, Blomberg B, Cirocco R, Burke GW, Ciancio G, Ricordi C, Esquenazi V, Tzakis AG, Miller J. Immune responses and their regulation by donor bone marrow cells in clinical organ transplantation. Transplant Immunology. 2003;11(3–4):307. doi: 10.1016/S0966-3274(03)00056-X. [DOI] [PubMed] [Google Scholar]
- 20.Mathew JM, Garcia-Morales R, Fuller L, Rosen A, Ciancio G, Burke GW, Carreno M, Temple D, Tzakis AG, Ricordi C, Miller J, Esquenazi V. Donor bone marrow-derived chimeric cells present in renal transplant recipients infused with donor marrow. I. Potent regulators of recipient antidonor immune responses. Transplantation. 2000;70(12):1675. doi: 10.1097/00007890-200012270-00003. [DOI] [PubMed] [Google Scholar]
- 21.Mathew JM, Carreno M, Fuller L, Ricordi C, Tzakis A, Esquenazi V, Miller J. Modulatory effects of human donor bone marrow cells on allogeneic cellular immune responses. Transplantation. 1997;63(5):686. doi: 10.1097/00007890-199703150-00013. [DOI] [PubMed] [Google Scholar]
- 22.Mathew JM, Blomberg B, Fuller L, Burke GW, Ciancio G, Kenyon N, Ricordi C, Tzakis AG, Esquenazi V, Miller J. A novel micro-cell-mediated lympholytic assay for the evaluation of regulatory cells in human alloreactive CTL responses. Journal of Immunological Methods. 2003;272(1–2):67. doi: 10.1016/s0022-1759(02)00432-5. [DOI] [PubMed] [Google Scholar]
- 23.Mathew JM, Marsh JW, Susskind B, Mohanakumar T. Analysis of T cell responses in liver allograft recipients. Evidence for deletion of donor-specific cytotoxic T cells in the peripheral circulation. Journal of Clinical Investigation. 1993;91(3):900. doi: 10.1172/JCI116311. [DOI] [PMC free article] [PubMed] [Google Scholar]
- 24.Taswell C. Limiting dilution assays for the determination of immunocompetent cell frequencies. I. Data analysis. Journal of Immunology. 1981;126(4):1614. [PubMed] [Google Scholar]
- 25.Gebauer BS, Hricik DE, Atallah A, Bryan K, Riley J, Tary-Lehmann M, Greenspan NS, Dejelo C, Boehm BO, Hering BJ, Heeger PS. Evolution of the enzyme-linked immunosorbent spot assay for post-transplant alloreactivity as a potentially useful immune monitoring tool. American Journal of Transplantation. 2002;2(9):857. doi: 10.1034/j.1600-6143.2002.20908.x. [DOI] [PubMed] [Google Scholar]
- 26.Heeger PS, Greenspan NS, Kuhlenschmidt S, Dejelo C, Hricik DE, Schulak JA, Tary-Lehmann M. Pretransplant frequency of donor-specific, IFN-gamma-producing lymphocytes is a manifestation of immunologic memory and correlates with the risk of posttransplant rejection episodes. Journal of Immunology. 1999;163(4):2267. [PubMed] [Google Scholar]
- 27.Burlingham WJ, Jankowska-Gan E. Mouse strain and injection site are crucial for detecting linked suppression in transplant recipients by trans-vivo DTH assay. American Journal of Transplantation. 2007;7(2):466. doi: 10.1111/j.1600-6143.2006.01627.x. [DOI] [PubMed] [Google Scholar]
- 28.VanBuskirk AM, Burlingham WJ, Jankowska-Gan E, Chin T, Kusaka S, Geissler F, Pelletier RP, Orosz CG. Human allograft acceptance is associated with immune regulation. Journal of Clinical Investigation. 2000;106(1):145. doi: 10.1172/JCI9171. [DOI] [PMC free article] [PubMed] [Google Scholar]
- 29.Garcia-Morales R, Esquenazi V, Zucker K, Gomez CI, Fuller L, Carreno M, Cirocco R, Alamo A, Karatzas T, Burke GW, 3rd, Ciancio G, Temple D, Fernandez H, Ricordi C, Tzakis A, Miller J. An assessment of the effects of cadaver donor bone marrow on kidney allograft recipient blood cell chimerism by a novel technique combining PCR and flow cytometry. Transplantation. 1996;62(8):1149. doi: 10.1097/00007890-199610270-00021. [DOI] [PubMed] [Google Scholar]
- 30.Kawai T, Cosimi AB, Spitzer TR, Tolkoff-Rubin N, Suthanthiran M, Saidman SL, Shaffer J, Preffer FI, Ding R, Sharma V, Fishman JA, Dey B, Ko DSC, Hertl M, Goes NB, Wong W, Williams WW, Jr, Colvin RB, Sykes M, Sachs DH. HLA-mismatched renal transplantation without maintenance immunosuppression. New England Journal of Medicine. 2008;358(4):353. doi: 10.1056/NEJMoa071074. [DOI] [PMC free article] [PubMed] [Google Scholar]
- 31.Baan CC, Vaessen LM, Ouwehand AJ, Heyse P, Daane CR, Jutte NH, Claas FH, Weimar W. Monitoring of cardiac graft recipients: comparison of in vivo activated, committed T lymphocytes in peripheral blood and in the graft. Transplant International. 1992;5 Suppl 1:S281. doi: 10.1007/978-3-642-77423-2_88. [DOI] [PubMed] [Google Scholar]
- 32.Hernandez-Fuentes MP, Warrens AN, Lechler RI. Immunologic monitoring. Immunological Reviews. 2003;196:247. doi: 10.1046/j.1600-065x.2003.00092.x. [DOI] [PubMed] [Google Scholar]
- 33.Burlingham WJ, Jankowska-Gan E, VanBuskirk A, Orosz CG, Lee JH, Kusaka S. Loss of tolerance to a maternal kidney transplant is selective for HLA class II: evidence from trans-vivo DTH and alloantibody analysis. Human Immunology. 2000;61(12):1395. doi: 10.1016/s0198-8859(00)00217-2. [DOI] [PubMed] [Google Scholar]
- 34.Burlingham WJ, O'Connell PJ, Jacobson LM, Becker BN, Kirk AD, Pravica V, Hutchinson IV. Tumor necrosis factor-alpha and tumor growth factor-beta1 genotype: partial association with intragraft gene expression in two cases of long-term peripheral tolerance to a kidney transplant. Transplantation. 2000;69(7):1527. doi: 10.1097/00007890-200004150-00058. [DOI] [PubMed] [Google Scholar]
- 35.Cai J, Lee J, Jankowska-Gan E, Derks R, Pool J, Mutis T, Goulmy E, Burlingham WJ, Cai J, Lee J, Jankowska-Gan E, Derks R, Pool J, Mutis T, Goulmy E, Burlingham WJ. Minor H antigen HA-1-specific regulator and effector CD8+ T cells, and HA-1 microchimerism, in allograft tolerance. Journal of Experimental Medicine. 2004;199(7):1017. doi: 10.1084/jem.20031012. [DOI] [PMC free article] [PubMed] [Google Scholar]
- 36.Burlingham WJ, Grailer AP, Fechner JH, Jr, Kusaka S, Trucco M, Kocova M, Belzer FO, Sollinger HW. Microchimerism linked to cytotoxic T lymphocyte functional unresponsiveness (clonal anergy) in a tolerant renal transplant recipient. Transplantation. 1995;59(8):1147. [PubMed] [Google Scholar]
- 37.Mathew JM, Vallone T, Rosen A, Ruiz P, Ciancio G, Burke GW, Tzakis AG, Miller J. Circulating and graft infiltrating regulatory cells in donor stem cell infused kidney transplant patients. Human Immunology. 2007;68 1, Supplement 1:S112. [Google Scholar]
Associated Data
This section collects any data citations, data availability statements, or supplementary materials included in this article.


