

1. Introduction
Magnetic Resonance Imaging (MRI) has been immensely valuable in diagnostic clinical imaging over the last few decades owing to its exceptional spatial and anatomical resolution. The signal in MRI is generated by relaxation of the transverse component of the net magnetization of protons present in the body, predominantly from bulk water. Thus, any agent or process that affects the net magnetization of the water protons in body tissues will also influence image contrast. Gd3+-based contrast agents shorten both the longitudinal and transverse relaxation times (T1 and T2) of water protons to approximately the same extent, in essence by relaxing all nearby proton spins. This effect is detected as increased signal intensity in T1 weighted MRI images when the appropriate pulse sequence is applied. Over the past 25 years Gd3+-complexes have been spectacularly successful as extracellular or blood pool T1 agents but their relative insensitivity to changes in environment coupled with the fact that they are never completely silent limits their applicability in the design of responsive MRI agents. A conceptually different approach to contrast enhancement is based on chemical exchange saturation transfer (CEST). This technique relies on dynamic chemical exchange processes inherent in biological tissues to transfer saturated 1H spins into the bulk water proton pool, which leads to a decrease of net magnetization and is detected as a negative contrast (darkening of the image) in MRI. Originally exchangeable -NH and -OH protons of various biomolecules were used to generate CEST contrast (DIACEST). However, these agents suffer from a few drawbacks, particularly in association with the small, usually less than 6 ppm, chemical shift difference between the two exchanging pools. The great benefit of using paramagnetic hyperfine shifting lanthanide complexes as CEST agents (PARACEST) is that the chemical shift difference between the two exchanging pools can potentially be much larger, up to several hundred ppm, facilitating easy saturation of one of the exchangeable spin pools without partial saturation of the bulk water pool. Another advantage of PARACEST is that the exchangeable sites are not limited to -NH or -OH protons but sites with faster exchange rates such as a Ln3+-bound H2O molecule, in particular, can also be considered. Since the water exchange rate on lanthanide complexes is extremely sensitive to the chemical environment, this has created unprecedented opportunities in the design of responsive PARACEST agents. In addition, multi-frequency MRI imaging is inherent to PARACEST: multiple agents present in the body can be imaged in one experiment by selectively turning on and off each agent by applying the appropriate saturation frequency.
2. About this Review
This article on alternatives to Gd3+-based MRI contrast agents focuses mainly on paramagnetic CEST (PARACEST) agents with special emphasis on their tremendous advantages as responsive agents. Since the conception of CEST for contrast enhancement in MRI,1 numerous reviews have dealt with different aspects of CEST-based contrast agents, both diamagnetic and paramagnetic.2–12 The goal of this review is to offer a comprehensive discussion of the theoretical background of chemical exchange as applied to CEST and in turn examine the fundamental aspects of the different parameters of paramagnetic lanthanide complexes that aid in the design of novel PARACEST agents. The first section on paramagnetic properties of the lanthanide ions provides a basic understanding of the advantages of Ln3+ complexes in general as MRI contrast agents. The historical and theoretical background of chemical exchange, the initial use of CEST for contrast enhancement in diamagnetic molecules and the various factors influencing water exchange processes in lanthanide ions facilitate a better understanding of the rational design of novel PARACEST agents that are discussed in extensive detail in the following sections. An entire section is devoted to the evaluation of the responsive behavior of these agents reported up to the publication date of this review, targeting ten different classes of responsive targets. Similar to Gd3+-based contrast agents, small molecule PARACEST agents also face problems associated with detection sensitivity and retention time in vivo. Several examples of the efforts of various groups to tackle this problem and the success attained so far are discussed. We also delve into the important in vivo characteristics of these compounds by discussing the kinetic inertness, thermodynamic stability and biodistribution of selected lanthanide complexes before exploring the problems associated with the in vivo imaging of these agents. Finally, a few other paramagnetic lanthanide complexes based on Tm3+, Dy3+ and Eu2+, that could potentially be used as MRI contrast agents and not based on CEST are discussed briefly in a separate section.
3. Paramagnetism of the Trivalent Lanthanide Ions
All Ln3+ ions, with the exception of La3+ and Lu3+, have unpaired electrons and are thus paramagnetic. These unpaired electrons are located in the 4f orbitals, which are lower in energy than the unfilled 5d orbitals and do not overlap significantly with ligand orbitals. For this reason, the 4f electrons delocalize only to a small extent onto ligand orbitals, rendering the bonding in Ln3+ complexes predominantly ionic. Consequently, the coordination geometry is determined largely by steric rather than electronic factors. As the f-orbitals are largely shielded from the ligand, the crystal field effects are insignificant and the electronic and magnetic properties of Ln3+-ions are not influenced appreciably by the coordinating ligand.13
Unlike their chemical behavior, the magnetic properties of the lanthanides differ dramatically along the series. Each of the lanthanide elements has a different magnetic moment and magnetic susceptibility that is determined by the electron configuration (Figure 1). For example, trivalent lanthanide ions that have half-odd integer values viz Nd3+, Sm3+, Gd3+, Dy3+, Er3+ and Yb3+ (Kramers’ ions) are associated with a permanent magnetic moment in the absence of a magnetic field, while the rest of the lanthanide ions are not (non-Kramers’ ions).14–15 Magnetic susceptibility is a 2nd rank tensor that governs the magnitude and directionality of the interaction between the magnetic moment and the external magnetic field. The Ln3+-ion affects nuclei in its vicinity mainly through paramagnetic relaxation enhancements (PRE) and lanthanide induced shifts (LIS), both of which depend on the magnetic susceptibility of the lanthanide ion.16–19 PRE is generated as a result of the interaction between fluctuating magnetic fields created by the unpaired electrons with the nuclear spin and is manifested as the shortening of the nuclear relaxation time 1/Ti,M, where i = 1, 2. The relaxation enhancing effect can be expressed as the sum of three components: contact (scalar), dipolar and Curie relaxation enhancement (Eq 1).17
Figure 1.

Paramagnetic properties of the lanthanides. μeff is the calculated magnetic moment calculated based on the ground term, μB is the Bohr magneton, χ is the magnetic susceptibility tensor, Δχax and Δχrh are the axial and rhombic components of χ. PRE is the paramagnetic relaxation enhancement and the radius of the yellow sphere indicates the distance at which 1H NMR signals experience significant line broadening. PCS is the pseudo contact shift and the isosurfaces represent the sign and magnitude of the lanthanide induced pseudocontact shift for each ion.21 Note, that Eu3+ would theoretically be diamagnetic according to its 7F0 ground state, but its magnetic properties are also influenced by contributions from the low lying, thermally accessible 7F1 and 7F2 levels giving rise to a magnetic moment of around 3.5 μB.13 Reproduced with permission from reference 21. Copyright 2007 American Chemical Society.21
| (1) |
The contact relaxation enhancement is a through-bond effect and can be quite significant for directly coordinated atoms but its strength rapidly decreases as the number of bonds increases. For nuclei that are not directly coordinated to the paramagnetic center, the other two mechanisms (dipolar and Curie relaxation enhancement) depend on the electronic relaxation time T1e of the paramagnetic metal ion. Qualitatively, the dipolar relaxation enhancement (Solomon effect) is most efficient when the electronic relaxation rate of the metal matches the Larmor frequency of the nucleus to be relaxed. Therefore, the dipole-dipole relaxation enhancement is dominant only for metal ions with relatively long electronic relaxation times. Gd3+ is unique among the lanthanides because its symmetric seven electron ground state (8S7/2) results in an electronic relaxation rate that is six orders of magnitude slower than the other Ln3+ ions.17–20 The unpaired electrons in Ln3+ ions other than Gd3+ by necessity populate the f orbitals anisotropically which gives rise to low energy excited states. This in turn results in a strong magnetic anisotropy and fast electronic relaxation with very short T1e, on the order of 10−13 s.21–22 The relaxation enhancement of these metal ions can have significant contribution from the Curie-spin relaxation mechanism, which arises from the interaction of the nuclear spin with the thermal average of the electron spin.17,19,23 While the dipolar relaxation enhancement is proportional to the isotropic magnitude of the magnetic susceptibility tensor (χ) of the Ln3+-ion, the Curie-spin relaxation is proportional to the square of χ. The Curie spin relaxation effect is significant at lower temperatures and higher magnetic fields and for ions whose magnetic moment is large. Generally, Curie spin relaxation affects the transverse relaxation more than the longitudinal relaxation. As a result, paramagnetic Ln3+-ions other than Gd3+ are less efficient T1 relaxation agents; but the strongly paramagnetic ions (Tb3+, Dy3+, Ho3+, Er3+) can have a significant effect on NMR linewidths. Such line broadening often makes it difficult or even impossible to detect nuclei that are located within a certain distance of the lanthanide ion. For example, the radius of this “blind sphere” in which heteronuclear 1H-13C cross peaks cannot be detected due to excessive line broadening of the 1H signal (>100 kHz) ranges from less than 3 Å for the weakly paramagnetic Eu3+ to about 12–14 Å for the strongly paramagnetic Dy3+. However, because paramagnetic relaxation effects scale with r−6 while pseudocontact shifts scale with r−3, lanthanide induced shifts are easily detectable at a distance where the relaxation effect is already negligible.17,19,24 The dipolar relaxation enhancement (Solomon effect) and Curie spin relaxation enhancement has been reviewed in detail elsewhere.17,19–20,25–26
The LIS experienced by a nucleus j in the vicinity of the Ln3+-ion i is a sum of three effects: diamagnetic, contact and pseudocontact shifts (Eq 2).17,19,27
| (2) |
The diamagnetic shift is caused by inductive and electric field effects and its value can be estimated using a diamagnetic lanthanide ion (La3+, Lu3+) or the pseudo-lanthanide Y3+. The origin of contact shift is the through bond interactions of the unpaired 4f electron spins with the observed nucleus. Contact shift can be quite large for nuclei directly coordinated to the lanthanide ion but its magnitude decreases rapidly as the number of bonds between the lanthanide and the observed nucleus increases. The strength of the contact interaction is dependent on the hyperfine coupling constant A/ђ and the spin expectation value <SZ> which is characteristic for each lanthanide (Eq 3).28–29
| (3) |
The magnitude of the Fj factor is determined by the nature of the nucleus i and independent of the lanthanide j and the structure of the ligand. The isotropic hyperfine coupling constant A/ħ is included in Fi (Eq 4).19
| (4) |
where μB is the Bohr magneton, k the Boltzmann constant, γi the gyromagnetic ratio of nucleus i and T the absolute temperature.
The pseudocontact shift originates as a result of through-space dipolar interactions between the unpaired electron and the nucleus (Eq 5). Its strength is expressed for the general case as:24,27,30
| (5) |
G1i and G2i are geometric factors given by Eqs 6 and 7:
| (6) |
| (7) |
where r, θ and ϕ are the polar coordinates of nucleus i in the reference system formed by the principal axes of the magnetic susceptibility tensor. D1j and D2j are magnetic anisotropy constants proportional to Bleaney’s constant, Cj, and and are the second order crystal field coefficients, which reflect the strength of interaction between the metal and donor atoms. For a series of isostructural complexes the G factor and the crystal field coefficients are independent of the lanthanide and the pseudocontact shift produced by a Ln3+-ion is proportional to its Cj value. The lanthanide independent parameters are often combined to give Eq 8 (McConnell-Robertson). 24,27
| (8) |
The lanthanide dependent <Sz> and Cj values have been determined for each lanthanide and are listed in Table 1.
Table 1.
| Ln3+ | Ce3+ | Pr3+ | Nd3+ | Sm3+ | Eu3+ | Gd3+ | Tb3+ | Dy3+ | Ho3+ | Er3+ | Tm3+ | Yb3+ |
|---|---|---|---|---|---|---|---|---|---|---|---|---|
| Cj | −6.3 | −11.0 | −4.2 | −0.7 | 4.0 | 0.0 | −86 | −100 | −39 | 33 | 53 | 22 |
| <Sz> | −0.98 | −2.97 | −4.49 | 0.06 | 10.68 | 31.50 | 31.82 | 28.55 | 22.63 | 15.37 | 8.21 | 2.59 |
According to Bleaney’s theory,31 the second order crystal field parameters are proportional to the anisotropic (axial and rhombic) components (χax and χrh) of the magnetic susceptibility tensor and so the magnitude of the pseudocontact shift can be expressed as in Eq 9.
| (9) |
Since the magnitude of the tensor anisotropy Δχ is quite different for each lanthanide ion, the magnitude of the pseudocontact shift at each nucleus in a complex will vary significantly depending upon its distance from the lanthanide ion, ranging from only those nuclei in the immediate vicinity of the complex (Sm3+) to over 40 Å (Dy3+). When θ = 54.74° and ϕ = 45, the dipolar field vanishes and pseudocontact shift is zero (Figure 2). The Ln3+-induced dipolar field thus has a spatial directionality and consequently the pseudocontact shifts experienced by each nuclei of the ligand provides three-dimensional structural information about the complex. Hence, Eq 9 forms the basis of the application of lanthanide shift reagents in the determination of three dimensional structures of proteins and other molecules.17–18,21,32
Figure 2.

A schematic representation of the anisotropy of the lanthanide induced pseudocontact shift.
For axially symmetric complexes or when conformational averaging of the Ln3+-shift reagent-substrate adduct occurs, the second term is zero. In this case the dipolar field is determined by 3(cos2 θ − 1) and the paramagnetic shift is given by Eq 10.
| (10) |
Eq 10 can be re-arranged into linear forms giving Eqs 11 and 12:
| (11) |
| (12) |
For a series of Ln3+ complexes, the lanthanide induced shift data should give a linear relationship when plotted according to Eq. 11 or 12 provided that the complexes are isostructural. In this case Fi and are invariant along the lanthanide series and their values can be determined by fitting either equation, thereby allowing separation of the contact and pseudocontact shifts.33–35 However, the assumption that the complexes are isostructural along the lanthanide series does not always hold true and gradual changes in the coordination geometry can give rise to variations of the crystal field coefficient and the hyperfine coupling constant across the series. Hence, plots of versus or versus do not always give a linear correlation but a break is often observed around the middle of the series near gadolinium. Crystal field independent methods that treat this deviation from linearity have been developed. 36–39 Another general method of LIS analysis that requires no assumptions about the orientation of principle magnetic axis system uses a linear least squares fitting of the measured LIS data to equations involving components of the magnetic susceptibility tensor. The best fit of the LIS data is determined through permutations of the LIS values over a number of nuclei. A computational method (SHIFT ANALYSIS program) based on this approach has also been developed.40–41 The SHIFT ANALYSIS program combined with molecular mechanics (MM+) calculations is a powerful method for the solution structure determination of various Ln3+-complexes and its effectiveness has been demonstrated with several lanthanide complexes including Ln3+-DOTA-tetraamide type chelates.41–42
Finally, it is worth noting that a simple method to elucidate the number of inner sphere water molecules in lanthanide complexes under fast exchange conditions is based on the measurement of the bulk water 17O NMR shifts.43–44
4. Chemical Exchange Saturation Transfer (CEST)
Since clinical MRI mainly involves the imaging of bulk water protons because of their high abundance in tissues, our focus here will be on contrast mechanisms that involve bulk water in chemical exchange with the labile protons (amines, amides, guanidinium protons, alcohols), either endogenous or exogenous. Chemical exchange in such cases can involve the conventional magnetization transfer (MT) techniques, which involves exchange of magnetization between a semi-solid macromolecular phase and bulk water or the more recent CEST techniques that involve exchange between protons of solutes and bulk water.45–46 Conventional magnetization transfer experiments have found numerous applications since first demonstrated for in vivo imaging by Balaban.47 One of the major applications is magnetic resonance angiography (MRA) and characterization of white matter disease in the brain (mainly multiple sclerosis) among others.45 Although the exact mechanism underlying magnetization transfer has been under debate, it is generally assumed that both chemical exchange and dipolar interactions play an important role.12,48 There have been numerous reviews focused on magnetization transfer techniques and their applications;45,49–50 here we discuss saturation transfer techniques as applied to exchange between protons of solutes (both endogenous and exogenous) and bulk water, while briefly sketching the effects of inherent MT effects in vivo on CEST. These techniques have garnered significant attention since the first report by Balaban and Ward demonstrated that saturation of the labile protons of a low concentration solute (contrast agent) can result in a collective buildup of spin saturation in bulk water protons as a result of chemical exchange.1,51–52 Before discussing CEST spectroscopy and imaging, a brief background on the theory of chemical exchange as well as a description of the modified Bloch equations for two-site chemical exchange is given.
4.1 Chemical Exchange
The use of NMR to study chemical exchange has been around since the early 1950s, discovered around the same time as scalar spin-spin coupling.53–56 Gutowsky and co-workers were among the first to cite examples of intramolecular exchange as indicated by the 1H or 19F multiplets in compounds such as PH3, PF3, F2PO(OH) and BrF5.54 Since then different types of chemical exchange processes have been studied by NMR including intramolecular processes involving motions of side chains of proteins, conformational equillibria and unfolding of proteins or intermolecular processes involving enzyme catalyzed reactions, binding of small molecules to macromolecules, protonation/deprotonation reactions and exchange of labile protons on a macromolecule with the solvent. NMR chemical exchange refers to any process whereby a nucleus exchanges between two or more environments with different NMR parameters (chemical shift, relaxation or scalar coupling).57 Figure 3 shows a classic example of chemical exchange between two equally populated spin states. At low temperatures, the two methyl groups are magnetically non-equivalent and exhibit two separate signals suggesting slow exchange. As the temperature is raised, the two peaks begin to coalesce and eventually sharpen into a single peak at higher temperatures. The coalescence at higher temperatures is a result of the reaction rate matching the difference in Larmor frequencies between the two sites (magnetic environment).
Figure 3.

Proton NMR spectra at 300 MHz of the N-methyl signals in a derivative of azapropazone as a function of temperature. The bottom spectrum was recorded at 223 K while the others were recorded at 243, 243, 263 and 273, respectively. Reprinted from reference 53, Copyright (2003), with permission from Elsevier.53
Many NMR techniques have been used to quantify exchange processes, including lineshape analysis, two-dimensional NMR spectroscopy and double resonance techniques among others.54,58–59 These techniques have been reviewed in numerous other reports and textbooks.53,60–62 An alternate practice to study exchange was first performed by Forsen and Hoffman in 1963, who used saturation transfer or magnetization transfer to measure proton transfer rates between salicylaldehyde and water.7,63 Saturation transfer experiments usually involve perturbation of one of the pools by an external radiofrequency field; in other words, the longitudinal relaxation pertaining to this signal is selectively perturbed. Upon exchange, saturation transfer can be monitored by observing the change in intensity of the other signal. This technique has since been exploited in numerous investigations.47,51,64–66
CEST can occur in any slow-to-intermediate chemical exchanging system involving nuclei in two or more magnetically nonequivalent environments or “pools”67 and typically requires separate resonances for each of the pools under consideration for magnetization transfer (Figure 3, bottom spectrum). The condition for slow-to-intermediate exchange on the NMR timescale is classically defined by Eq 13: the rate of exchange (kex) must be no greater than the frequency difference between the two pools, Δω (ω is expressed in units of radians.sec−1).
| (13) |
4.1.1 Two-Site Chemical Exchange
Consider two pools of protons, A and B with pool A representing the bulk water protons and pool B representing the pool of labile protons associated with a contrast agent. In this special case, Δω in Eq 13 can be considered to represent the frequency difference between the exchange site on the contrast agent and bulk water. Eq 13 can be re-written as
| (14) |
Here, τm represents the lifetime of the labile proton on the contrast agent and is just the reciprocal of the exchange rate constant, kex. As briefly described above, the basic CEST experiment first involves the application of a selective RF pulse at the Larmor frequency of pool B for a sufficiently long period of time so as to reach a new level of steady state magnetization. At that point, the magnetization along all three rotating frames are time-independent. This results in the distribution of spins in pool B moving closer to saturation; in other words, the number of spins aligned with and against the field in the Boltzmann distribution of nuclear spins becomes almost equal, resulting in a decrease in the bulk magnetization of pool B. If the exchange condition (Eqs 13 and 14) is satisfied, there will be a subsequent decrease in the bulk magnetization of pool A, thereby translating into a decrease in the signal intensity of the bulk water protons.4 In most cases involving imaging, the bulk water protons (pool A) are always present at much higher concentration in tissues (~80 M) than pool B protons, typically no more than millimolar. Thus, there is constant accumulation of non-saturated protons in pool B from A accompanied by replacement of a large number saturated protons in pool A from B and, since one always monitors bulk water, even a 10% saturation of the pool B protons can result in a significant decrease in pool A intensity.
The frequency difference between the two pools of protons (Δω) plays an important role in determining the efficiency of saturation transfer. The larger the frequency difference between the bulk water protons (pool A) and the protons of the contrast agent (pool B), the faster the exchange rate can be without approaching the fast exchange condition (Eqs 13 and 14). A large frequency difference also implies greater specificity of the selective radiofrequency pulse used to saturate pool B, without directly saturating the bulk water protons. Also, as will be discussed later, large Δω values results in a significant reduction of the macromolecular-water background (tissue MT effect).1 In other words, if the Δω values are sufficiently large, then magnetization transfer due to saturation of macromolecules and their subsequent exchange with bulk water has a smaller contribution to the CEST spectrum.
4.1.2 The Bloch Equations
One can use the well-known NMR Bloch equations modified for chemical exchange to predict the NMR behavior of the two exchanging pools of proton spins. The Bloch equations, traditionally used to derive nuclear magnetizations along the x, y, and z axes,68–69 were first modified by McConnell and Thompson in 1957 to include the terms for chemical exchange.70 The simplest case of a two-site exchange was described by Woessner to obtain the variation of x, y and z magnetizations with time for each of the two pools (Eqs 15–20).12,67
| (15) |
| (16) |
| (17) |
| (18) |
| (19) |
| (20) |
| (21) |
| (22) |
T1a and T2a are the spin-lattice and transverse relaxation times of the bulk water pool A in the absence of exchange, ω is the Larmor frequency at which the selective radiofrequency irradiation pulse is applied, ωa is the Larmor frequency of the protons of poolA and ωb is the Larmor frequency of pool B. ω1 is the nutation rate of the selective RF irradiation , Ca is the rate at which spins leave pool A, and Cb is rate at which spins leave pool B. By definition then, Cb is the inverse of τb, the lifetime of protons in pool B (also often referred to as τm). The Z magnetization at thermal equilibrium in the two pools, and , are proportional to the number of protons in each pool as determined by the chemical composition of the exchanging system.4 Since chemical exchange is restricted by mass balance, Eq 23 holds true.
| (23) |
| (24) |
In a CEST experiment, when a selective RF pulse of frequency ω is applied at the Lar mor frequency of the pool B protons until steady state is achieved, the time derivatives of all nuclear magnetizations are equal to zero (left hand side of Eqs 15–20). The resulting set of equations, solved algebraically, give the net magnetization of pool A protons (bulk water) along the z axis, for a selected range of irradiation frequencies. It is clear from these equations that the saturation transfer efficiency of a contrast agent depends on numerous factors: (a) the time constant for proton exchange τb, (b) the saturation power B1, (c) the Larmor frequency difference between the two exchanging sites Δω, (d) the number of exchanging sites per agent ( , where c is the concentration of the contrast agent and q is the number of exchanging sites in the agent), and (e) the relaxation rates of both proton pools.
Owing to the complexity of these equations, and the factors that affect chemical exchange, numerous approximations have been made.71–75 The earliest approximation and most widely used approach made by Forsen and Hoffman in their landmark paper on chemical exchange involves the assumption that complete saturation of pool B protons can be achieved by using a frequency selective, weak saturation pulse such that there is negligible direct saturation of pool A protons.63,76 With these assumptions, the last two terms of Eq 19 can be omitted: can be dropped since we assume complete saturation of the pool B protons ( ) and can be neglected when there is negligible direct saturation of the pool A (ω1 ~ 0, Eq 25). Under steady state conditions, the time derivative equals zero and a simplified solution is obtained (Eqs 25–28).2
| (25) |
| (26) |
Considering mass balance requirements (Eqs 23 and 24), Eq 26 can be further simplified as:
| (27) |
| (28) |
Here, c is the concentration of the contrast agent and q is the number of exchangeable proton sites, with 55.5 representing the molar concentration of bulk water. In other words, the protons that leave pool A with the z-magnetization will be replaced by protons from pool B with no magnetization; consequently decreasing the bulk magnetization of pool A at the rate, . At the same time, the spin-lattice relaxation will simultaneously return the z-magnetization of pool A to its equilibrium value at a rate , so at steady state, these rates become equal (Eq 29).
| (29) |
While Eq 29 provides a simple solution, it only makes predictions for limiting cases. In particular, it should be noted that the pool B protons can reach complete saturation only using a strong RF field, and under ideal situations and in most cases this system never actually reaches complete saturation.12
4.1.3 CEST Spectroscopy and Imaging
In CEST experiments, the effect on bulk water is usually displayed as a function of saturation frequency (ω) relative to the magnitude of the remaining water proton signal (Ms/M0), where Ms is the water signal intensity with saturation and M0 is the signal intensity without saturation. Grad and Bryant first coined the term Z-spectrum and used it to describe the change of intensity of one resonance as a function of the frequency of a saturating pulse applied selectively to another resonance in chemical exchange with the observed resonance.77 To obtain a Z-spectrum, one simply applies a selective radiofrequency pulse for a favorable duration followed immediately by a traditional spin-echo observation pulse to attain the net signal intensity of the bulk water. Repeating this experiment over a range of frequencies gives a complete Z-spectrum (equivalent to a CEST spectrum) for the contrast agent under study. An example of a simulated Z-spectrum is displayed in Figure 4 (simulations done using MATLAB 7, Mathworks Inc., Natick, MA).67 The CEST effect is also more commonly represented as a percent decrease in total bulk water intensity (Eq 30).
Figure 4.

Simulated Z-spectrum for a two-pool exchange system with pool A (bulk water) at zero and pool B (solute protons) at 25 ppm. Values for simulation include a presaturation pulse of 250 Hz with irradiation time of 3 s. The peak at 0 ppm shows the net decrease in magnetization ( ) of bulk water upon direct saturation, while the peak at 25 ppm shows the net decrease in magnetization of the bulk water upon saturation of the pool B protons. This figure also provides a schematic illustration of the procedure used to obtain a CEST image.
| (30) |
As first demonstrated by Wolff and Balaban, and explained later in detail in Section 4.4.11.4, imaging proton chemical exchange processes requires collection of two images; the first collected after selective saturation at the exchanging site of interest (Ms), while the second image is collected at the opposite side of the water resonance from the site of interest (M0).51,64 Pixel-by-pixel division (Ms/M0) or subtraction of the images (M0−Ms) yields a CEST image which reflects the contrast enhancement as a result of the agent.1 Taking the simulated spectrum in Figure 4 as an example, a selective radiofrequency pulse is first applied at +25 ppm corresponding to the decrease in magnetization of pool A bulk water protons due to exchange with pool B. This results in decreased bulk water signal intensity (MS) and consequently a darker image (negative contrast). Following this, another radiofrequency pulse is applied at −25 ppm corresponding to the opposite end of the Z-spectrum where no CEST effect is seen. Since there are no exchanging sites at this frequency, there is no decrease in magnetization of bulk water and hence a brighter image is obtained (M0). Subtraction of these two images, (M0 − Ms), yields a CEST image which reflects only the effects of the contrast agent.
4.2 Diamagnetic Chemical Exchange Saturation Transfer (DIACEST)
4.2.1 Small Molecule DIACEST Agents
The use of CEST techniques in the design of contrast agents for MRI was first demonstrated by Balaban and Ward in early 2000 (Figure 5).1 They evaluated different types of exchangeable proton sites in small molecules such as sugars, amino acids, nucleosides and other diamagnetic molecules. The authors found that the nitrogen bound protons of amines, amides and guanidinium groups were most effective in reducing the signal intensity of bulk water by saturation transfer. Table 2 lists the findings of some representative molecules reported in their work. It was shown that the CEST properties of these small molecules are dependent on numerous factors including pH, temperature and, of course, concentration of contrast agent. Some general conclusions can be drawn from this small library of CEST compounds:12 (a) these agents are inherently pH and temperature sensitive, (b) a single compound with multiple types of exchange sites can display different CEST properties depending on the frequency of saturation, (c) as the exchange rate of the compound increases, the CEST peak becomes broad and shifts towards bulk water, (d) the CEST efficiency of the agent increases linearly with its concentration, but the line shape of the CEST peak is maintained, and (e) one of the most attractive features of these contrast agents over traditional T1 or T2-based contrast agents is the ability to turn the CEST contrast effect on and off at will, either by turning off the presaturation pulse or by changing its frequency. Following this initial report on diamagnetic small molecules (DIACEST agents) as contrast agents for MRI, numerous reports on different techniques for improving the CEST efficiency of these molecules were reported.52,66,75,78–83 Balaban and co-workers demonstrated that proton exchange processes between endogenous metabolites, like urea and ammonia, and water could be sensitively detected ex vivo and in vivo.65–66 In an interesting account, Aime and co-workers reported the use of a common X-ray contrast agent, iopamidol, as a potential CEST agent.84 Iopamidol has two types of labile protons (amide –NH and alcoholic –OH) capable of exchange with bulk water. The -OH protons exhibit much faster water exchange rates and fall in the fast exchange regime, , and are hence not suitable for CEST. The amide protons however exhibit much slower water exchange kinetics ( estimated at 2560 s−1) and can act as CEST exchange sites. Initial experiments measuring the T1 and T2 relaxation capabilities of iopamidol revealed that while not useful as a T1 agent, it did show promise as a T2-shortening contrast agent. An MR image with a multi-echo type experiment (TE = 120 ms) confirmed that a negative contrast of ~25 % could be detected in the presence of 13 mM agent. Additionally, a phantom image of the same agent at different concentrations revealed that iopamidol can also function as an efficient CEST agent. A comparison of the two phantom images is shown in Figure 6.
Figure 5.

CEST Spectrum of an aqueous solution of barbituric acid. Reproduced, with permission, from the Annual Review of Biomedical Engineering, Volume 10 © 2008 by Annual Reviews www.annualreviews.org.7
Table 2.
CEST data for selected compounds studied by Balaban and co-workers. Reprinted from reference 1, Copyright (2000), with permission from Elsevier.1
| Diamagnetic Molecule | Concentration (mM) | Exchanging Site | ωb (Larmor frequency of exchanging site) ppm | pH | CEST Effect % |
|---|---|---|---|---|---|
| Sugars | |||||
| Sucrose | 250 mM | -OH | 1.333 | 7.0 | 10.2 |
| Maltose | 250 mM | -OH | 1.500 | 7.0 | 14.8 |
| Amino Acids | |||||
| L-Alanine | 125 mM | -NH2 | 3.000 | 4.0 | 67.4 |
| 5-Hydroxytryptophan | 62.5 mM | -N(NH2) | 2.833 | 4.0 | 41.6 |
| Indole Ring –NH | 5.333 | 8.0 | 21.2 | ||
| Nucleosides | |||||
| 5,6-dihydrouracil | 62.5 mM | 3-NH | 5.000 | 6.0 | 22.2 |
| 2-NH | 2.667 | 7.0 | 22.2 | ||
| Barbituric acid | 62.5 mM | -NH | 5.000 | 6.5 | 32.5 |
Figure 6.
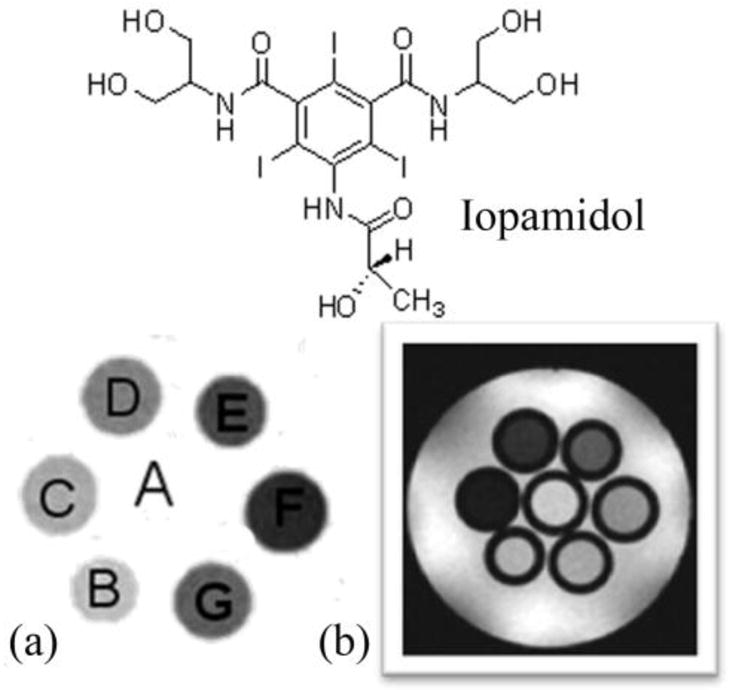
A comparison between the T2-weighted MR image (b) and a CEST MRI difference image (a) of the same phantom. The phantoms A-G contain different concentrations of iopamidol in solution, A: Water, B: 13 mM, C: 26 mM, D: 65 mM, E: 130 mM, F: 260 mM, G: 520 mM. CEST MR imaging conditions (Ms-M0, 7.05 T, pH 7.4 and 310 K): irradiation power = 12.4 μT, irradiation time = 7 s. Reference 84. Copyright (2000); Reprinted with permission of John Wiley & Sons, Inc.84
4.2.2 Macromolecular DIACEST Agents
Goffeney and coworkers subsequently demonstrated the use of macromolecular cationic polymeric molecules with hundreds of exchanging sites per molecule as a mechanism to enhance the molecular sensitivity of DIACEST agents.78 Cationic polymers have gained significant attention as non-viral DNA delivery systems85 and complexes of cationic polymers with DNA plasmids (anionic polymers), called polyplexes, have been effective in gene therapy. Owing to their importance, non-invasive in vivo monitoring of gene delivery could provide crucial information regarding distribution, local concentration and kinetics. Taking advantage of the large number of amide protons present in macromolecular cationic polymers, Goffeney et al. showed that CEST sensitivity enhancements as large as 500,000 can be obtained compared to monomeric DIACEST agents. For example, poly-L-lysine (PLL, molecular weight of 500 kD) with roughly 2000 amide protons and twice as many amine protons, can result in nearly a 40% change in the signal intensity of bulk water at concentrations as low as 100 μM, a significant improvement over the initial DIACEST molecules proposed by Ward and Balaban. Since this report, other macromolecular DIACEST agents have been explored for use as contrast agents in MRI and have been reviewed elsewhere.12,79,86–87
4.2.3 glycoCEST
Glycogen is the readily metabolizable storage form of excess glucose in animals and humans, analogous to starch in plants. It is a large, branched polysaccharide made up of glucose residues linked by α-1,4-glycosidic bonds that can be broken down to yield glucose molecules when needed. Glycogen metabolism in liver plays a critical role in maintaining the blood glucose levels. Excess glucose is converted to glycogen predominantly in liver and muscle cells.88 In the muscle, glycogen provides fuel for muscle contraction whereas in the liver, glycogen is broken down and exported from liver into blood whenever glucose is needed by other organs. While inherited disorders of glycogen metabolism occur in rare cases, glycogen content can also be abnormal in conditions such as obesity, insulin resistance and Type 2 Diabetes (T2D).89–90 Consequently, a non-invasive method to quantify the glycogen content in vivo could have a major impact in understanding the pathophysiology of these common diseases.91 13C MRS can be used as a non-invasive technique in directly detecting the concentration of glycogen in vivo by utilizing the natural abundance 13C 1-C of glycogen, but the requirement of specialized coils and amplifiers on clinical scanners ultimately limits this tool to research sites.
van Zijl and co-workers hypothesized that it should be possible to detect chemical exchange between the hydroxyl groups of glycogen and water using CEST principles and use it as a tool for non-invasive imaging of glycogen in vivo using a standard clinical MRI scanner.91 Conventional 1H NMR spectra of glycogen in water indicated that two potential exchange sites for glycogen, one at 1.2 ppm reflecting the secondary -OH protons and another at 0.7 ppm reflecting the CH2OH group, could potentially be used for CEST (spectrum referenced to water at 0 ppm). The 1.2 ppm -OH resonance is fairly sharp at 4°C but gradually broadens as the temperature is raised to 37°C, indicative of relatively slow exchange at the lower temperature and faster exchange at physiological temperature. Interestingly, the CEST spectrum of glycogen shows only a small CEST exchange peak at 1.2 ppm at 4°C but the effect increases in magnitude at higher temperatures up to 37°C. The CEST spectra recorded at 4.7 T and 9.4 T clearly illustrate the advantage of working in higher magnetic fields owing not to better adherence to the slow exchange condition but to better separation of the resonances from bulk water (larger Δω), thus greatly improving selectivity (Figure 7).
Figure 7.

(a) CEST spectra of 200 mM glycogen in PBS buffer at 310 K acquired at both 9.4 T and 4.7 T. (b) CEST spectra and asymmetryplots of glycogen at varying concentrations acquired at 9.4 T in PBS at 310 K and pH = 7.4. CEST spectroscopy conditions: irradiation time = 10 s, irradiation power = 1.9 μT. Copyright (2007) National Academy of Sciences, U.S.A.91
To evaluate the utility of glycogen detection in tissue using CEST principles (glycoCEST), the breakdown of glycogen (glycogenolysis) stimulated by the hormone glucagon was followed in livers isolated from fed mice and perfused with a normal Krebs-Henseleit buffer. The liver of a fed mouse has excess glycogen that is easily degraded and exported for use by other tissues. When the blood glucose levels are low, the hormone glucagon (produced by pancreas), initiates glycogenolysis and the export of glucose. This process can be monitored in perfused livers by following the CEST properties of glycogen before and after injection of glucagon. A series of colorized glycoCEST images of the ex vivo perfused liver as a result of presaturation at ±1 ppm are shown in Figure 8.
Figure 8.

(a) 13C NMR spectra of a liver from a fed mouse showing the disappearance of glycogen after glucagon administration. The resonance at 100 ppm is distinctive of the C1 carbon of glycogen with the 130 ppm resonance being from unsaturated fats in liver (used in this study as an internal standard only). (b) Colorized glycoCEST images of a perfused fed-mouse liver at 4.7 T and 310 K. The colorized CEST images as a function of time show the relative CEST intensity of liver tissue as a function of perfusion time. Copyright (2007) National Academy of Sciences, U.S.A.91
The first grayscale image marks the t = 0 perfusion with glucagon. The orange pixels in the colorized images indicate regions of glycogen concentration, suggesting either a non-uniform distribution of glycogen in the liver or variations in proton exchange rates depending on the size or location of the glycogen particle.7 As glucagon perfusion continues over a period of time, the regions of orange pixels substantially reduce and then become constant. These glycoCEST images acquired at regular intervals after administering glucagon clearly illustrate that the magnitude of CEST is reduced following the depletion of glycogen. This technique thus presents an attractive alternative to 13C MRS for following glycogen metabolism in tissues using standard clinical MRI scanners.
4.3 Water Exchange Processes in Ln3+ Ions
The DIACEST examples described above all involve transfer of proton spins but, as we shall see (Section 4.4), exchange of water molecules between multiple pools offers an alternative mechanism for initiating CEST contrast. The resonance frequencies of these pools obviously have to be different and paramagnetic hyperfine shifting lanthanide complexes in which the metal bound water corresponds to one of the pools could potentially be very advantageous because the chemical shift of the lanthanide bound water protons can be very large. The successful application of these complexes for CEST, however, requires that the water exchange rates satisfy the slow to intermediate exchange condition (Eq. 14). For this reason, it is important to briefly review what is known about water molecule exchange in lanthanide complexes. Given the fundamental importance of water exchange in determining the relaxivity of Gd3+-based contrast agents, water exchange in various lanthanide complexes, particularly the Gd3+ chelates, has been studied in great detail.92–94 Variable temperature and variable pressure 17O NMR has proven to be an efficient way to determine the exchange rate and mechanism respectively on various metal complexes. The volume of activation (ΔV‡), defined as the difference between the partial molar volumes of the transition state and the combined partial volumes of the reactants), can be determined from the pressure dependence of the kex by 17O transverse relaxation measurements. ΔV‡ involves the effect of change in bond lengths due to formation and breaking of bonds in the transition state as well as the effect of solvation. The latter is negligible when the ground and transition states have the same charge. In this case, ΔV‡ is a direct measure of the bond formation and breaking occurring in the transition state and provides valuable information about the mechanism of the exchange process. A large positive activation volume is indicative of an expanded transition state of a limiting dissociative mechanism (D) while a large negative activation volume is characteristic for a limiting associative process (A) with a shrunken transition state. Between these two extremes there is a continuous spectrum of interchange (I) mechanisms with smaller positive, zero or negative activation volumes (Id, I, Ia) depending on the extent of contribution of the incoming water molecule. 92–94
4.3.1 Water Exchange Processes in Ln3+ Aqua Ions
The coordination number of lanthanide aqua ions has been the focus of active research for many years. It is now widely accepted that, due to the gradual decrease in ionic radius along the lanthanide series (lanthanide contraction), the lighter (larger) Ln3+- aqua ions (La3+ to Nd3+) are nine coordinate with a tricapped trigonal prism (TTP) geometry while the heavier (smaller) ones (Gd3+ to Lu3+) are eight coordinate with a square antiprism (SAP) geometry.95–98 The Sm3+ and Eu3+ aqua ions exist as an equilibrium mixture of eight and nine coordinate species, presumably due to the particular size requirements of these two species and the ionic radii of these two ions. This change in water coordination number that occurs near Sm3+/Eu3+ influences the mechanism of water exchange. The water exchange rate, kex, for the eight coordinate, heavier lanthanide ions decreases from Gd3+ to Yb3+ and the kinetic data (activation entropy and volume) obtained by 17O NMR relaxation measurements are in accordance with an interchange associative Ia mechanism, which proceeds through a nine coordinate TTP transition state.43,99–103 Unfortunately, for the lighter lanthanides the kinetic effect is not large enough to allow the accurate determination of water exchange rate by 17O NMR measurements, but interchange rate constants with SO42− and the lower limit of kex determined by 17O NMR at 14.7 T for Pr(H2O)9 and Nd(H2O)9 104 suggest that water exchange is the fastest for Eu3+ and gradually decreases towards La3+ (Figure 9).104–105
Figure 9.
Dependence of the water exchange rate of lanthanide aqua ions on the ionic radius. The values for Pr3+ and Nd3+ represent the lower limit of kex. Adapted with permission from reference 93, Copyright 2005 American Chemical Society.93
Water exchange in the lighter lanthanides likely occurs by an interchange dissociative (Id) mechanism with an eight coordinate SAP transition state. The rate of water exchange is determined by the free energy difference between the eight coordinate SAP and the nine coordinate TTP species for a given Ln3+ ion. For the heavier lanthanides, [Ln(H2O)8]3+ has the lowest energy and the energy difference between the eight coordinate ground and nine coordinate transition state increases with decreasing ion size going from Gd3+ to Lu3+ because it becomes more and more difficult to accommodate nine inner sphere water molecules with decreasing size. For the lighter lanthanide ions, the nine coordinate [Ln(H2O)9]3+ is the ground state and the exchange is assumed to occur by a dissociatively activated pathway through an eight coordinate transition state. The water exchange rate is expected to increase with decreasing ionic size from La3+ to Nd3+ as the energy difference between the eight coordinate and nine coordinate geometry increases. In the crossover region (Sm3+ − Eu3+), the energy difference between the eight and nine coordinate species is very low (they exist in equilibrium) so exchange is fastest at these ions.92–94 It is worth noting that a gradual change in the kex along the lanthanide series would be expected if the hydration state of all the Ln3+ ions were the same. However, the observed trend of water exchange rate is a classic example of the so called gadolinium break, which describes an abrupt change in the properties (partial molar volume, heat capacity, molar entropy and extraction behavior) of lanthanide compounds at or near Gd3+.36,106–110 According to a recent extended X-ray absorption fine structure (EXAFS) spectroscopy study,111 all the lanthanide ions exist in aqueous solution as tricapped trigonal prismatic (TTP) species and, contrary to the gadolinium break hypothesis, there is no sudden change in coordination geometry. The water molecules in the TTP capped positions in the lighter lanthanide aqua ions (La3+ − Nd3+) are equidistant but distortions of the regular TTP geometry start to become more and more pronounced from Sm3+ to Dy3+. Gradually increasing water deficiency in the capping positions for the heaviest lanthanides will eventually lead to only one strongly bound capping water molecule for Lu3+. Thus, the gadolinium break is due to increasingly distorted coordination geometry and increasing differences in the Ln3+-O (capping) – Ln3+-O (prismatic) distances.
4.3.2 Water Exchange Processes in Ln3+ Polyaminopolycarboxylate Complexes
According to the Solomon-Bloembergen theory, water exchange rate (kex) in the various chelated forms of Gd3+ is one of the determining factors of relaxivity (the others are rotational correlation time τr and electronic relaxation time τe). Theory predicts a kex value of around 108 s−1 for optimal relaxivity. Originally, the water exchange rate of Gd3+-based MRI contrast agents was assumed to be even faster than that of the Gd3+ aqua ion, mainly because multidentate spectator ligands in transition metal complexes speed up the exchange of coordinating solvent molecules. Later, direct water exchange rate measurements performed in Merbach’s laboratory by 17O NMR revealed that water exchange in lanthanide complexes is actually significantly slower than that in the corresponding aqua ion. Current Gd3+-based contrast agents have water exchange rates that are about one order of magnitude slower than the optimal value predicted by the Solomon-Bloembergen theory.20,93 This disparity prompted an extensive worldwide research effort to develop “high relaxivity” agents. As a result, a large number of new Gd3+-complexes have been synthesized and their water exchange kinetics measured. Typically, most ligands for Gd3+ were based on a poly-aza poly-carboxylate framework and, in virtually all cases, water exchange was found to be slower than that required for optimal relaxivity; so a major effort was directed at accelerating water exchange in these complexes toward the optimal value. With the advent of PARACEST agents, the focus of research attention shifted to the design of lanthanide complexes that exhibit relatively slow water exchange. Thus, a considerable amount of knowledge has been gained about the structures of various lanthanide complexes and the rate at which water exchanges in those complexes as well the various factors that affect the water exchange rate. These will be discussed in detail in the following sections.
4.3.3 Factors Affecting Water Exchange Rates
4.3.3.1 Coordination Number
Lanthanide chelates with octadentate poly-amino poly-carboxylate ligands (including all commercial Gd3+-based contrast agents) generally have one inner sphere water molecule. Activation volume measurements on Gd 3+-1 (1 is commonly referred to as DTPA: diethylenetriamine pentaacetic acid) and Gd3+-2 (2 is commonly referred to as DOTA: 1,4,7,10-tetraazacyclododecane-1,4,7,10-tetraacetic acid) indicate a limiting dissociative (D) mechanism in which the incoming water molecule does not participate in the exchange.112 This results in an increase in activation energy and consequently slower exchange rates compared to the Gd3+-aqua ion, where the water exchange proceeds by an interchange mechanism (I). This is not surprising because the cage of donor atoms surrounding the Gd3+-ion is expected to prevent the entering water molecule from assisting the leaving one (ten coordinate transition state is not possible). If the coordination number is lower than 9, then the incoming water molecule can assist the outgoing molecule resulting in a faster exchange rate. This effect is nicely illustrated by a comparison of the exchange rates for two related complexes, the nine coordinate Gd3+-3 (τm = 70 ns) with two bound water molecules and the eight coordinate Gd3+-4 (τm = 6 ns).113 The latter has only one metal bound water molecule resulting in a water exchange rate two orders of magnitude faster than the nine-coordinate complex. It is assumed that the two complexes have different exchange mechanisms: water exchange on the eight-coordinate complex proceeds by an associative mechanism because the transition state can easily accommodate another H2O molecule, which is not possible for the nine-coordinate species.
4.3.3.2 Steric Crowding and Coordination Geometry
As expected, for a dissociative water exchange mechanism (D), increased steric crowding around the water binding site will accelerate water exchange because the coordinated water molecule must leave before the incoming molecule can bind. Insertion of an extra methylene group into the polyamine backbone or the pendant arm of the ligand is a simple way to increase the steric compression around the binding site.114–117 For example, addition of a methylene group to the macrocyclic amine backbone of DOTA gives rise to the ligand 5 whose Gd3+ complex has a water exchange rate almost two orders of magnitude faster than Gd3+-2.114–115 Interestingly, the Gd3+-O (bound water) distances are quite similar in these complexes (0.248 nm in Gd3+-5 and 0.245 nm in Gd3+-2) so the faster exchange in Gd3+-5 is not due to an increased Gd3+-O bond distance but rather has been traced to the extra methylene group which shifts the plane defined by the four carboxylate oxygens closer to the bound water, thereby hastening dissociation.114 The small negative value of activation volume for the exchange process indicates a strong participation of the incoming water molecule (interchange mechanism).115 A further increase in steric compression around the water coordination site by adding more methylene groups results in complexes which do not contain an inner sphere water molecule. An example of this is given by Gd3+-6.112,118 Introducing a methylene group into DTPA has a similar effect: both Gd3+-7 and Gd3+-8 have much faster water exchange rates than Gd3+-1, while Gd3+-9 does not contain a inner sphere water molecule.115–117 A comparison of these complexes suggests that backbone modification should have a stronger effect by about an order of magnitude. Substituting the bulkier phosphonate groups for acetate is another approach to increase the steric crowding around the water binding site. Thus, replacing one acetate sidearm of DOTA with a phosphonate group as in Gd3+-10 results in a significant increase in the rate of water exchange.119–120 Replacing more acetates with phosponates again sterically blocks the inner sphere water coordination position such that lanthanide complexes of 11 and 12 do not have a metal bound water.120–121
While these examples demonstrate that it is possible to alter the water exchange rate of DOTA and DTPA-like complexes by adding a methylene group to the ligand or replacing the acetates with other functional groups, the resulting complexes usually have decreased thermodynamic stability and/or kinetic inertness compared to the corresponding parent ligand.115,122 However, lanthanide complexes of DOTA and its derivatives exhibit a very unique type of coordination isomerism which allows more subtle control of the steric compression around the water coordination site. The relative orientation of the acetate sidearms and the macrocyclic ring results in two diastereomeric coordination isomers that differ in the twist angle between the basal N4 and capped O4 squares. A N4/O4 twist angle of around 39° defines a square antiprismatic (SAP) geometry, while −29° defines the twisted square antriprismatic (TSAP) coordination geometry (Figure 10). Complexes of DOTA and DOTA-like ligands have two independent components of chirality originating from the conformation of the five-membered N-C-C-N chelate ring and the helicity of the side-arms. Depending on the sign of the N-C-C-N torsion angle, the conformation of each ethylene group in the macrocyclic ring is left-handed, designated as λ (negative N-C-C-N torsion angle) or right-handed, δ (positive N-C-C-N torsion angle), and so the macrocyclic ring can have either (λλλλ) or (δδδδ) conformation. Similarly, the orientation of the pendant arms can be clockwise Δ (positive N-C-C-O torsion angle) or counter-clockwise Λ (negative N-C-C-O torsion angle). Hence, there are two enantiomeric pairs of diastereoisomers: the Δ (λλλλ) and Λ (δδδδ) enantiomeric pair adopts the SAP geometry while the Λ(λλλλ) and Δ(δδδδ) enantiomeric pair adopts the TSAP geometry.123–124 These coordination isomers can interconvert by arm rotation (Λ ↔ Δ) or ring inversion [(λλλλ) ↔ (δδδδ)]. The SAP/TSAP ratio can easily be estimated from the 1H NMR spectra because the lanthanide induced shifts observed for the ligand protons (and the bound water protons, when observable) are substantially larger in the SAP isomer. Interestingly, the water exchange rates in the TSAP isomers are about two orders of magnitude faster than in the SAP isomers because the latter has a more compact structure with less steric crowding around the bound water. 125–128 In fact, the Gd3+-bound water lifetime of the TSAP isomer of Gd3+-2 is close to the optimal value predicted by Solomon Bloembergen Morgen theory. However, the population of the two species is strongly influenced by steric factors including the size of the lanthanide ion. As expected, the lighter (larger) ions prefer the TSAP geometry while the heavier (smaller) lanthanide ions favor the SAP configuration. 129 To control the water exchange rate across the lanthanide series, one must be able to select one of the coordination isomers independently from the size of the lanthanide. This was elegantly achieved with DOTA-like ligands by freezing out the molecular motions through which the inter-conversion occurs. In lanthanide complexes of ligand 13, chiral substitution of the alpha carbon of all four acetate sidearms with methyl groups inhibits the arm rotation, while the nitrobenzyl group on the macrocyclic backbone eliminates the ring inversion. Since the orientation of the arms and the conformation of the macrocyclic ring is determined by the chirality of the asymmetric carbons present in the ligand (the alpha carbons of sidearm on the carbon bearing the nitrobenzyl substituent), appropriate selection of the chirality will control the coordination geometry, and thus the water exchange rate.130 Lanthanide complexes of the bridged ligand 14 represent an example of locking the conformation of the ligand without the use of chiral carbon. The original intent of this work was to slow water exchange by hindering the departure and approach of water molecules to the lanthanide ion, yet it was found that the bridge was so rigid that water was entirely excluded from the Ln3+ coordination sphere. The crystal structure of the Yb3+ complex revealed that it exists exclusively as the TSAP isomer. This unexpected geometry for Yb3+ is due to the presence of the bridging unit, which forces the same orientation on the conformation of the macrocyclic ring and the helicity of the pendent arms affording only the two TSAP enantiomeric pairs, Λ(λλλλ) and Δ(δδδδ). The “conformation locking” effect of the bridge can be understood by considering the two ethylene bridges that are shared by the macrocycles (the 12- and 21-membered) of the bicyclic system, which will achieve the lowest energy when the two rings adopt the same conformation (λ or δ). In addition, two of the amide side-arms are part of the 21-membered ring and so their helicity will be determined by the conformation of the macrocyclic backbone. Interestingly, the interconversion between the two enantiomers [Λ(λλλλ) ↔ Δ(δδδδ))] must occur by sequential arm rotation and ring inversion through the SAP isomer.
Figure 10.

Schematic representation of the SAP and TSAP coordination geometries showing only the atoms directly coordinating to the central lanthanide metal ion.
4.3.3.3 Size of the Ln3+ Ion
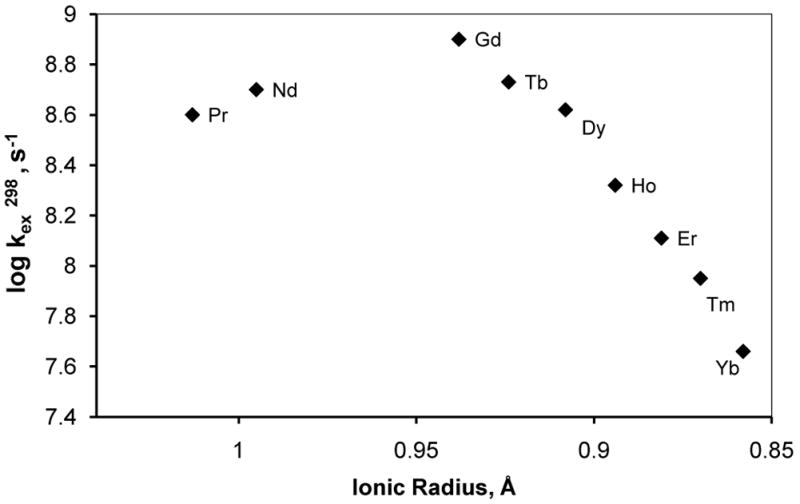
The water exchange rates of lanthanide complexes of both DTPA and DOTA amides show a strong dependence on the lanthanide ionic radii.131 The exchange rates in the lanthanide complexes of 15 is nearly constant for the lighter lanthanides (Ln = Nd3+, Eu3+), but increases sharply for the heavier ones from Gd3+ to Ho3+ (Figure 11a). This trend was explained by a change in the mechanism near the center of the lanthanide series; activation volume of exchange (Figure 11b) was consistent with an interchange mechanism (I) for the Nd3+ complex, while water exchange occurs by a dissociative mechanism (D) for the remaining lanthanide complexes. Water exchange in the LnDOTA-tetra-glycinate complexes (ligand 16) shows an even more surprising trend, opposite that observed for the aqua ions (Figure 12).132 Based on the measured bound water lifetimes (τM), the complexes can be divided into three distinct groups. The lifetime increases from Pr3+ to Eu3+, decreases dramatically between Eu3+ and Tb3+, then decreases very slightly between Tb3+ and Yb3+. The high resolution NMR spectra report that the entire series of Ln3+-16 complexes exist in solution largely as the SAP isomers, so the observed trend of kex is not due to a switch in coordination geometry but rather is more likely due to a change (or changes) in exchange mechanism that occurs along this series. The activation volumes of exchange measured for Eu3+-17 and Eu3+-18 (+ 4.9 cm3/mol and +6.9 cm3/mol, respectively) indicates that water exchange in these two DOTA-tetraamide systems occurs via a dissociative activation mechanism.128 Assuming the same exchange mechanism is operative for the remaining heavier lanthanide complexes of these DOTA-tetraamide ligands, one would predict an increase in the Ln3+-O (bound water) distance with decreasing ionic radii (from Eu3+ to Lu3+) and hence faster water exchange as observed for the complexes with ligand 16 (Figure 12). For the lighter Ln3+ ions water exchange slows from Sm3+-16 to Eu3+-16 and this likely reflects at least a partial contribution from an associative mechanism whereby the incoming water molecule assists the leaving molecule. The fact that water exchange is so finely tuned with a minimum at Eu3+ has important implications for the design of paramagnetic magnetization transfer agents. While the hyperfine shifts induced by Eu3+ are smaller than the ones produced by some other lanthanides (Tb3+, Dy3+ and Tm3+), the slowest water exchange rate of Eu3+ combined with its low paramagnetic relaxation enhancement (T1 and T2 shortening effect) makes Eu3+ the paramagnetic ion of choice in the design of PARACEST agents involving presaturation of the bound water molecule.
Figure 11.

(a) Dependence of the metal-bound water exchange rate of Ln3+-15 complexes on the ionic radius. (b) Dependence of the activation volume for the metal-bound water exchange of Ln3+-15 on the ionic radius. Adapted with permission from reference 131, Copyright 1995 American Chemical Society.131
Figure 12.
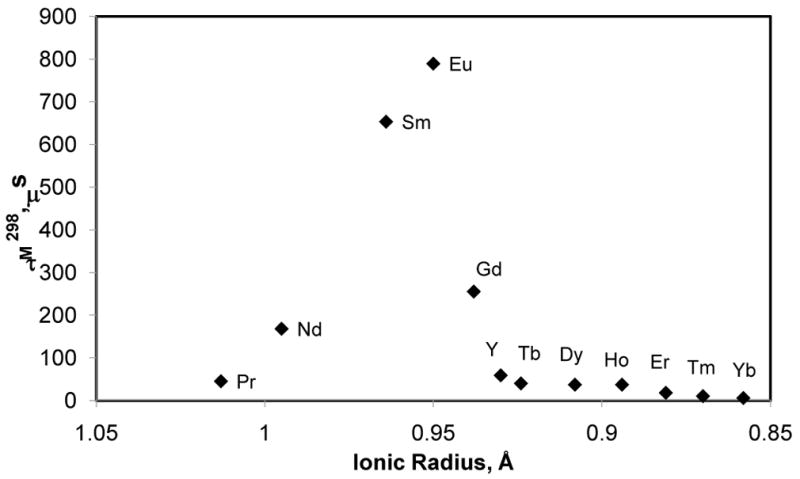
Dependence of the metal-bound water residence lifetime of Ln3+-16 on the ionic radius. Adapted with permission from reference 132, Copyright 2002 American Chemical Society.132
4.3.3.4 The Effects of the Counter Ion in Positively Charged Complexes
A recent study of the positively charged complex, Gd3+-17, with different counter ions X (X = OTf−, Cl−, OAc−, Br− and I−) demonstrated that the counter ion has a surprisingly big effect on water exchange (Figure 13).133 It was proposed that anions modulate water exchange by altering the structural ordering or the extent of the second sphere hydration - the more ordered the second sphere hydration, the slower the water exchange rate. This was supported by the X-ray crystal structures of the complexes where the degree of structural order and local hydration decreased from Cl− to I−, consistent with faster water exchange. Interestingly, no significant anion effect was found for the more hydrophobic (SSSS)-19, which was explained by the overriding effect of the hydrophobic side-arms.
Figure 13.
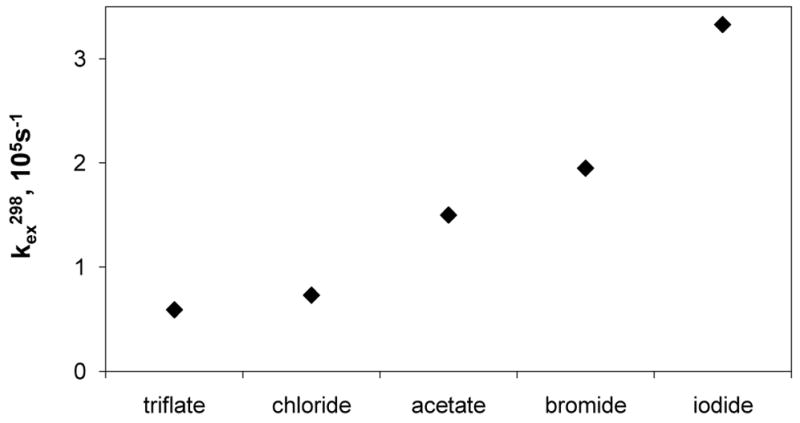
Dependence of the metal-bound water exchange rate of Gd3+-17 on the counter ion. Reference 133- Adapted with permission of the Royal Society of Chemistry.133
4.3.4 Ln3+ Complexes of DOTA-tetraamide Ligands Display Unusually Slow Water Exchange
Ultimately, the water exchange rate in lanthanide complexes is determined by the electron deficiency around the central lanthanide ion. Qualitatively, greater electron deficiency on the lanthanide ion increases the electrostatic attraction between the metal ion and the bound water resulting in a shorter Ln3+-O (bound water) bond distance and slower water exchange. If Gd3+-2 is considered as the reference complex, ligating groups that render the central metal ion more electron-deficient compared to carboxylates are expected to decelerate water exchange. Accordingly, neutral coordinating groups that are less capable of electron donation to the central lanthanide ion compared to the negatively charged carboxylate should decelerate water exchange. The oxygen of the amide functionality is a nice example of such a donor atom. The weak donor strength of amides compared to carboxylates correlates well with the basicity of these functional groups. The pKa of the conjugate acid of amides is around −0.5 while the pKa of carboxylic acids is roughly 4.134 These and other properties of the amide group (restricted rotation about the C-N bond, short C-N bond length, stability toward hydrolysis and protonation at the oxygen rather than nitrogen) can adequately be explained by the structure shown in Figure 14, in which the contribution of the C=N resonance form is around 30% even though there remains considerable ongoing debate about the validity of this description.135 The decelerating effect of a coordinating amide to water exchange in DOTA and DTPA-amide complexes is surprisingly strong. This is nicely illustrated by a series of both DOTA- and DTPA-based Gd3+-complexes (Gd3+-20, Gd3+-21, Gd3+-22, and Gd3+-23-Gd3+-34) in which progressive substitution of an acetate side-arm by an amide side-arm slows water exchange substantially with each substitution. As a general rule of thumb, substitution of an amide for a carboxylate results in about 3 to 4 fold decrease in kex.5,136 In the case of PCTA derivatives, which have two bound water molecules, the effect of amide substitution is significantly weaker, as the water exchange rate of Gd3+-35 is only about half of that for Gd3+-3.137
Figure 14.

The resonance structure of the amide functional group.135
4.3.5 Some Structural Features of Ln3+ DOTA-tetraamide Complexes
High resolution 1H NMR studies indicate that lanthanide complexes of DOTA-tetraamide ligands usually adopt the SAP geometry in solution when the amide side-arms are not sterically demanding. However, increasing steric requirements of the side-arms favor the TSAP isomer with bulky primary amines or secondary amines showing a marked preference for the TSAP geometry. Alpha substitution on the acetate sidearms also increases the steric crowding around the central lanthanide ion and DOTA-tetraamide complexes such as 36 exist in solution largely as the TSAP isomer.125,128,138 The crystal structure of various LnDOTA-tetraamide complexes indicates a preference for SAP geometry in the solid state.125,139–142 The crystal structures of the lanthanide complexes with ligand 19 show that all complexes adopt the SAP geometry in solid state.139 As a consequence of increased steric crowding around the Ln3+-ion with decreasing ionic radius, the size of the O4 square and O-Ln3+-O angle decreases while the Ln3+-O (bound water) distance gradually increases the along the series. Although the distance between the N4-O4 squares seems to be relatively invariant across the series, the heavier, smaller Ln3+ ions are positioned closer to the N4 plane. NMR studies confirmed that the Eu3+ complex adopts the same SAP geometry in solution yet, interestingly, the observed 1H NMR shift values for the Yb3+ complex show that it adopts the TSAP geometry in solution with one Yb3+-bound water molecule.143 The SAP isomer could not be detected in solution but clearly it must be present in very low concentration because the complex crystallized in this form. The preferential crystallization of the minor isomer in this case clearly demonstrates that the crystal structure is not always representative of the solution structure.
The crystal structure of Eu3+-19 triflate indicates that this complex also adopts the typical SAP geometry but the Eu3+-O (bound water) distance is slightly shorter than usual.139 Interestingly, the four pendant arms are not equivalent as one of them is positioned perpendicular to the Ln3+-O (bound water) bond while the other three occupy an equatorial position. The solution structure of Yb3+-16 was studied by hyperfine shift analysis using the SHIFT ANALYSIS method and a comparison of the experimental and predicted LIS values revealed that in acetonitrile the side-arms are positioned axially, while in water, which is more polar than acetonitrile, an equatorial arrangement is preferred. The dependence of the average position of the side-arms on the solvent may explain why the exchange rate is slower in acetonitrile.42
4.3.6 Fine Tuning the Water Exchange Rate in Ln3+ DOTA-tetraamide Complexes
Recent studies of EuDOTA-tetraamide derivatives revealed that the water exchange rate can be further modulated by electronic effects and the degree of hydrophobicity, polarity and steric bulk of the substituent attached to the amide nitrogen atoms of the ligand. The available experimental data strongly suggest that a complex interplay of each of these factors will significantly affect water exchange and should be considered in the design of new PARACEST agents. Modulation of water exchange through electronic effects was first demonstrated with the Gd3+-complexes of p-nitrobenzyl- and p-aminobenzyl-DO3A (37). In the nitro derivative, the electron deficiency around the Gd 3+-ion is greater than in the p-amino derivative and this stabilizes the nine-coordinate ground state of the complex resulting in slower water exchange.144 Later it was shown that inductive and mesomeric effects of remote substituents can also affect water exchange rates in a series of EuDOTA-tetraamide (38) complexes provided the substituent can electronically communicate with the donor atoms.145 Although the largest difference in the water exchange rates in this series of complexes was only about two fold, the kex values showed a good correlation with the electron donating/withdrawing effects of the substituent. These data suggest that modulation of the water exchange rates by electronic effects is a feasible approach to the design of responsive PARACEST agents.145 Intuitively, one would expect that bulky, hydrophobic substituents on the amide would slow down water exchange by restricting access of water to the metal ion. Indeed, a good correlation between the kex and the calculated solvent accessible surface area was found for a series of EuDOTA-tetraamides with different amide substituents (Figure 15). This effect was attributed to altered organization of the second hydration sphere, which increases the free energy of the transition state for the exchange.146 However, recent data on other DOTA-tetraamide derivatives with varying hydrophobicity and polarity (43–48) strongly suggest that “smaller the accessible surface area, slower the water exchange rate” rule is not always valid and other factors are also involved. In addition to hydrophobic effects, another important factor is polarity. In fact, it was shown that introduction of polar substituents capable of participating in hydrogen-bonding interactions with second sphere water molecules slows down water exchange, stabilizing the second coordination hydration sphere which, in turn, stabilizes the single inner-sphere water molecule.138
Figure 15.
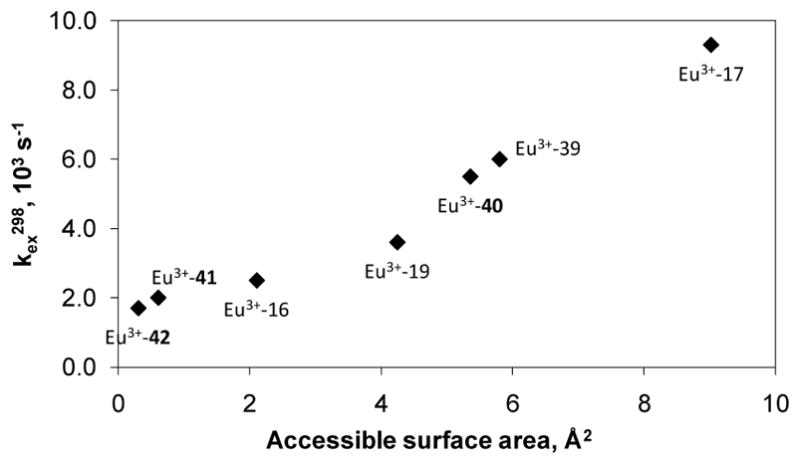
Dependence of the metal-bound water exchange rate on the accessible surface area. Reference 146- Adapted with permission of the Royal Society of Chemistry.146
4.3.7 Water Exchange as the Lower Limit of Proton Exchange
Water molecule exchange by definition involves the exchange of oxygen atoms and therefore the water exchange rate represents the lower limit of the prototropic exchange rate. Obviously, the exchange of protons can occur independently from the coordinated water but this requires an acid or base catalyst. So, it is normally assumed that the prototropic exchange rate is equal to the water exchange rate over a wide range of pH, about 3–8.32,147 However, certain functional groups on a ligand (as in 22 and 49) can act as a catalyst to speed up proton exchange.148–149 For example, the residence lifetime of the bound water in Gd3+-22 (26 μs as determined by 17O NMR) is not pH dependent but the water 1H relaxivity of the complex shows strong pH dependence between pH 5 – 8. The pH responsive behavior of this complex is due to catalysis of prototropic exchange by the extended phosphonate groups that undergo protonation in this pH range.
4.4 Paramagnetic Chemical Exchange Saturation Transfer Agents
4.4.1 Paramagnetic CEST (PARACEST)
Although numerous experiments involving diamagnetic agents have been performed using CEST techniques, they are faced with one major drawback. A CEST experiment is bound by the condition that the exchangeable proton needs to be selectively irradiated while maintaining the intermediate-to-slow exchange condition (kex ≤ Δω). Accordingly, the frequency difference (Δω) between the two exchanging pools needs to be sufficiently large. Since Δω values are typically no more than ~6 ppm, very slow exchange rates are required to satisfy the intermediate-to-slow exchange condition. While the use of higher magnetic fields is obviously advantageous as discussed earlier (Figure 7a), the practical feasibility of moving to a high enough field to meet this requirement may be problematic. Another intrinsic problem associated with using DIACEST agents in vivo is that it may be difficult to distinguish the CEST effects of the agent from the inherent tissue MT effect. Therefore, a large Δω value is clearly advantageous for CEST not only because it would permit the use of more rapidly exchanging species, but it may allow for easy differentiation of CEST from tissue MT.
While it has been known for more than 40 years that some of the paramagnetic lanthanides are able to induce extremely large (up to several hundred ppm) hyperfine shifts in nearby nuclei, it was only relatively recently realized that the exchange rate of a Ln3+-bound water molecule in certain lanthanide complexes may be slow enough to satisfy the kex ≤ Δω condition for CEST. The first generation of such compounds consists of lanthanide complexes with a variety of DOTA-tetraamide ligands. Such systems typically consist of one Ln3+-bound water molecule and –NH groups. The Ln3+-bound water molecule is in a capping position and aligned with the principle magnetic axis of the complex and, for this reason, experiences the largest hyperfine shifts, while the amide protons are situated somewhat further away from the Ln3+ ion and are oriented in the direction where the dipolar field of the Ln3+ ion nearly vanishes (Figure 16). Consequently, the amide proton shifts are roughly an order of magnitude smaller than those observed for the Ln3+-bound water molecule (Refer Section 3, Figure 2 for a more detailed explanation on lanthanide-induced shifts). In breakthrough experiments that set the stage for PARACEST, two independent research groups concurrently discovered that the water molecule in Eu(III) complexes of certain DOTA-tetraamide ligands (16, 17, and 18) could be observed directly using 1H and 17O NMR.42,126,150
Figure 16.

Illustration of the lanthanide induced shift on the lanthanide bound water protons and the amide protons. The lanthanide bound water molecule aligned along the principle z axis experiences the largest hyperfine shift, while the amide protons are oriented such that they do not experience the dipolar magnetic field of the lanthanide ion. The dipolar field of the Ln3+ ion is indicated by the blue cone.
4.4.2 Direct 1H and 17O NMR Detection of a Ln3+-Bound Water Molecule
The separate resonance for bound water cannot be observed in the NMR spectra of Ln3+-DOTA or Ln3+-DTPA because water exchange is too fast in these poly-carboxylate systems to be seen on the NMR timescale. Lanthanide complexes of the DOTA-tetraamide ligands, on the other hand, often display slow enough water exchange to allow direct detection of the bound water molecule by 1H and 17O NMR.42,125–126,128,143,150–152 As one would expect, the conditions necessary for detection depend on the exchange rate and the paramagnetic line broadening properties of the lanthanide ion itself. Often, the NMR spectra are recorded in wet acetonitrile at temperatures ranging from 233 K to 333 K,126,150,152 but, in some cases, when the exchange is slow enough, the bound water can be observed in pure water at room temperature.42 Based on the 1H NMR data of several Ln3+-DOTA-tetraamide complexes, an interesting and quite useful empirical relationship has been established between the 1H chemical shift of the bound water and the axial H4 macrocyclic proton; the shift of the bound water proton resonance is about 2-fold larger than that of the H4 proton.152 This relationship is very helpful in estimating the chemical shift of the bound water protons even when they cannot be directly observed. The kinetic parameters characterizing the exchange process (kex, activation volume activation enthalpy and entropy) in such systems can be determined from variable temperature and variable pressure 1H and 17O NMR measurements.126,128,150 Separate Eu3+-bound water resonances were detected for the SAP and TSAP coordination isomers in Eu3+-17 and as anticipated, the hyperfine shifts of the two bound water resonances were quite different with the SAP isomer displaying a much larger hyperfine shift than the TSAP isomer. In acetonitrile and at low temperatures (232 K), the bound water 1H and 17O NMR resonances were identified at 1H δ = 84.1 ppm, 17O δ ≈ −1150 ppm (SAP isomer) and 1H δ = 19 ppm, 17O δ ≈ −950 ppm (TSAP isomer), respectively.126,150 Variable temperature and pressure 1H and 17O NMR studies of the two isomers not only afforded the kex values of each isomer but also provided direct insight into the correlation between the water exchange and SAP-TSAP interconversion. Simultaneous fitting of the NMR data for water exchange and the SAP/TSAP interconversion revealed that both processes proceed through a common intermediate that does not have an inner sphere water molecule, with interconversion of isomers occurring predominantly though arm rotation.126 Subsequent research after the first reports of direct NMR observation of the metal bound water soon led to the application of slowly exchanging lanthanide complexes in CEST experiments.
4.4.3 Exchanging Sites on PARACEST Agents
4.4.3.1 The Bound Water Site
A high resolution 1H NMR spectrum of Eu3+-16 in water at room temperature is illustrated in Figure 17. The relatively broad peak near 50 ppm that integrates as two protons and disappears upon addition of a drop of D2O to this sample can be assigned to a single, inner-sphere Eu3+-bound water molecule. RF saturation of this highly shifted peak prior to collection of the NMR spectrum resulted in a 20 % reduction in signal intensity at concentrations of agent as low as 10 mM.1,151 If one performs this presaturation experiment over a wide range of saturation frequencies, one obtains the CEST spectrum shown in Figure 18. While the Eu3+ complexes of various DOTA-tetraamide complexes typically display a Eu3+-bound water resonance around 50±10 ppm depending upon temperature, other lanthanide ions show even larger hyperfine shifted water resonances, ranging from +500 ppm to −720 ppm (Table 3). The CEST spectrum of Dy3+-17 shows a broad CEST peak at −720 ppm from the bound water protons (Figure 19) owing to the fact that Dy3+ induces about 25-fold larger pseudocontact shifts than Eu3+ (see Table 1).4 These examples illustrate that exchange sites covering a wide range of Δω values are potentially available for CEST activation. This expands the number of possible exchanging species that can potentially meet the CEST requirement to include functional groups that normally would exchange too fast in a diamagnetic molecule. As discussed in detail below, the rate at which a Ln3+-bound water molecule exchanges with bulk solvent is much more sensitive to subtle changes in the structure of the complex and the chemical environment than amide protons, making water exchange a versatile platform for the design of responsive PARACEST agents.
Figure 17.

High Resolution 1H NMR spectrum of an aqueous solution of Eu3+-16 at 400 MHz at 20°C.
Figure 18.

The CEST spectrum of barbituric acid (blue) is shown in the same scale as that of Eu3+-16 (red) for comparison. Reproduced, with permission, from the Annual Review of Biomedical Engineering, Volume 10 © 2008 by Annual Reviews www.annualreviews.org.7
Table 3.
The approximate chemical shifts of the bound water protons and the amide protons in a typical series of Ln3+-DOTA- tetraamide complexes.152,154,167
| Ln3+ Complexes | δ ppm (Bound Water) | δ ppm (Amide Protons) |
|---|---|---|
| Pr3+ | −60 | 13 |
| Nd3+ | −32 | 11 |
| Sm3+ | −4 | |
| Eu3+ | 50 | −4 |
| Tb3+ | −600 | 61 |
| Dy3+ | −720 | 77 |
| Ho3+ | −360 | 39 |
| Er3+ | 200 | 22 |
| Tm3+ | 500 | −51 |
| Yb3+ | 200 | 16 |
Figure 19.

The CEST spectrum of Dy3+-17 recorded at 400 MHz and 298 K. The peak at +80 ppm represents amide proton exchange while the peak at −720 ppm reflects exchange of the bound water molecule in the complex. Reference 4- Reproduced by permission of the Royal Society of Chemistry.4
It is interesting to note that CEST activation via an exchanging water molecule has only been detected in lanthanide complexes (mostly Eu3+) of DOTA-type ligands. As indicated earlier (Section 4.3.3.2), Ln3+ complexes of DTPA pentaamide derivatives like 30 and 31 display water exchange that is too fast for CEST. The reason for this, likely, lies in the unique properties of DOTA and its derivatives. The physico-chemical properties of the complex (thermodynamic stability, kinetic behavior, magnitude of the induced shifts and spectroscopic properties) are determined by its molecular structure. The macrocyclic DOTA ligand is more rigid, preorganized and symmetric than the acyclic DTPA and it is quite plausible that the higher flexibility of DTPA-amide derivatives may allow faster water exchange by a different mechanism. The effect of rigidity has not been studied in detail for DOTA-tetraamide derivatives, although there is some indication that rigidifying the macrocyclic ring may actually accelerate the exchange since the water exchange on the more rigid, backbone substituted complex Gd3+-50 is about 20 times faster than on Gd3+-22.153
4.4.3.2 Amide-Based PARACEST
Although not apparent in the CEST spectrum of Eu 3+-16, the protons of the coordinated water molecule are not the only exchanging site in this complex. The amide protons of the complex also show significant reduction in water intensity, as can be seen from the CEST spectrum of the analogous acid Eu3+-51 (Figure 20). While it is difficult to observe the NH-based CEST effect clearly in Eu 3+-based PARACEST agents, other lanthanide complexes induce much larger shifts. From a comprehensive report by Terreno and co-workers of the amide-based PARACEST effects across the lanthanide series for the ligand 51 along (Table 3), it is evident that most of the lanthanide complexes in the series satisfy the exchange condition required to observe CEST resulting from amide proton exchange.154 Another classic example of amide CEST can be illustrated by considering the Yb3+ complex of 17.155 The 1H NMR spectrum of the complex is dominated by the presence of two non-equivalent amide protons of each -NH2 group at −14.5 ppm and −17.7 ppm, with both protons being highly sensitive to pH (Figure 21).
Figure 20.

CEST spectrum of a 20 mM aqueous solution of Eu3+-51 at 298 K and pH 7.0 with CEST responses from bound water (55 ppm) and –NH protons (−5 ppm).
Figure 21.

High resolution 1H NMR spectrum of a 30 mM aqueous solution of Yb 3+-17 recorded at 500 MHz, pH 7.4 and 298 K. The inset shows the signals of the two amide protons as a function of pH. Reference 155. Copyright (2002); Reprinted with permission of John Wiley & Sons, Inc.155
Proton exchange involving either –NH, -OH or –SH groups with solvent protons can be generally described by Eq 31 which includes H+, OH− and other general acid/base catalysts.156–158
| (31) |
ka, k b and kc represent the rate constants due to acid-catalyzed exchange (ka), base-catalyzed exchange (kb) or other possible contributions (kc). The rate determining step for amide protons is deprotonation under base-catalyzed conditions and protonation under acid-catalyzed conditions. Non-catalyzed proton exchange with water is thought to be negligible for the amide protons.158–159 The pH dependence of these NH-based exchange mechanisms has been studied in detail for many years as a means to understand protein structures in solution – these have been reviewed elsewhere in detail.156–157,160–161 It has been shown that amide proton exchange is largely base-catalyzed at pH > 5 so Eq 31 can be reduced to Eq 32.
| (32) |
Consequently, while NH-based PARACEST effects are not as strongly influenced by the lanthanide induced shifts when compared to bound-water PARACEST effects, they may offer some advantages owing to their innate pH-sensitivity and their slower exchange kinetics.
4.4.3.3 Alcohol-Based PARACEST
Woods and co-workers were able to identify another potential exchange group in lanthanide complexes of DOTA-type ligands when they replaced the coordinating amide side groups with hydroxyethyl arms (ligands 52 and 53).162 It was shown earlier that the hydroxyethyl arms retain their protons even upon coordination of the –OH groups to a lanthanide ion leaving them open for exchange with bulk water.163–165 However, high-resolution 1H NMR spectra also show that the coordinated –OH protons are not highly shifted in this complex and consequently –OH proton exchange is fast compared to Δω. However, with similar complexes (Eu-53) dissolved in slightly wet acetonitrile, CEST exchange peaks were detected for all three hydroxyl groups plus the Eu3+-bound water molecule (Figure 22). As more water was added to this system, the rate of proton exchange with the water pool gradually increased and the CEST effects completely disappeared in pure water. While structurally significant and an interesting example of –OH based CEST, these ligands need to be further modified to provide stronger lanthanide induced shifts and slower water exchange rates for practical applications.
Figure 22.

CEST spectrum of a 36 mM solution of Eu3+-53 recorded in CD3CN. CEST spectroscopy conditions (270 MHz and 296 K): irradiation time = 2s, irradiation power = 0.64 μT. Reproduced with permission from reference 162. Copyright 2006 American Chemical Society.162
4.4.4 Optimization of the Water Exchange Kinetics in PARACEST Agents
One of the most important advantages of PARACEST agents over their diamagnetic counterparts lies in the fact that faster exchanging systems can be used to generate CEST effects due to the large Δω values induced by the paramagnetic lanthanide ions. While this is true, it is clear from the modified Bloch equations for chemical exchange (Section 4.1.2) that other factors such as relaxation rates, applied power and duration of the presaturation pulse also play an important role. For PARACEST agents to be useful in a clinical setting, one of the critical considerations is the specific absorption rate (SAR) power limitations (B1) of any future human application. There is general agreement among users that a 3 to 5 % change in the water signal intensity is sufficient to see contrast in an MR image. In order to understand the parameters that need to be optimized to maximize CEST effects for clinical applications, Woods et al. used a previously published two-site exchange model to make several important predictions.4 Eq 33 (a rearranged form of Eq 27) predicts that a maximum CEST effect (largest decrease in bulk water intensity ≡ smallest Mza/Moa) will be observed for a PARACEST agent whenever the water residence lifetime of a pool of exchangeable protons (τb) is as small as possible and the concentration of the contrast agent ( ) and bulk water relaxation (T1a) remain as large as possible. The observed CEST effect will also depend on the extent of saturation of the PARACEST agent (pool B) - incomplete saturation of the pool B protons, determined mainly by the power and duration of the presaturation pulse B1, will result in less than optimal CEST.
| (33) |
Although CEST increases with higher B1 values, this value needs to be chosen to achieve the right balance between optimum CEST and minimum indirect irradiation of the bulk water pool of protons (pool A) while still staying within the limitations imposed by SAR for irradiation power.67 Thus, the chemical parameters that can be optimized for optimal CEST include the residence lifetime of the protons on the contrast agent, τb, the chemical shift of the exchangeable protons, Δω, and the bulk paramagnetic relaxation properties of the contrast agent itself. A numerical analysis presented by Woessner et al. predicts quite simply that the optimal τb depends on the applied B1 (Eq 34).67 Simulated two-site exchange CEST spectra show that for a given value of B1, the residual magnetization of the pool A protons passes through a minimum (maximum CEST effect) when Eq 34 holds true.
| (34) |
This important relationship, shown graphically in Figure 23 allows us to predict an optimal value of τb for any a given value of B1. Thus, from a group of PARACEST agents with known water exchange kinetics, we should be able to select the optimal agent for any given B1 restriction (determined by the experimental setup, i.e., instrument, coil, SAR limitations). Numerous chemical modifications to modulate water exchange rates have already been discussed in detail earlier in this review. As an example, a recent work by Mani et al. elegantly demonstrated this prediction that simple structural modifications to the ligand framework allows us to modulate the water exchange rates for a series of Eu(III)-based PARACEST agents.138
Figure 23.

(a) Simulated CEST spectra for a two-site exchange system showing the effects of different exchange rates for a given value of B1 on the residual magnetization of the bulk water. The inset shows a plot of the residual magnetization ( ) vs exchange rate, varying from 300 s-1 to 10000 s-1. Maximum CEST effect is observed when the exchange rate (1/τb) is equal to 2πB1. Reference 4. Copyright (2005); Reprinted with permission of John Wiley & Sons, Inc.67 (b) Changes in the CEST effects ( ) of a PARACEST agent as a function of the residence lifetime of the exchanging protons in the PARACEST agent. Reference 4– Reproduced by permission of the Royal Society of Chemistry.4
4.4.5 Multi-Frequency PARACEST Agents
One of the primary advantages of CEST as a contrast mechanism is that the effect is detectable only when a selective RF irradiation pulse is applied at the specific frequency of the exchangeable protons. Consequently, if the resonance frequencies of the exchangeable protons are well separated, multiple agents can be used in one imaging experiment and selectively turned on and off by applying the appropriate frequency-selective RF pulse. PARACEST agents based on Ln3+ ions are particularly attractive in this respect because a variety of lanthanide ions across the series can be used to generate markedly diverse complexes with exchangeable protons covering a wide range of frequencies. The proof of principle for multi-frequency MRI was demonstrated by Aime and co-workers in phantoms and living cells with Eu3+ and Tb3+-based PARACEST agents.166 Phantom images of the two complexes, Eu3+-51 and Tb3+ -51, both individually and as a cocktail mixture clearly presented the selectivity of the PARACEST agents; while the Eu3+ complex was irradiated only at the resonance frequency of its bound water proton at 50 ppm, the Tb3+ complex was selectively irradiated at −600 ppm (Figure 24).
Figure 24.

MRI phantom images acquired at 7.05 T in PBS buffer of four capillaries that contain: (A) PBS Buffer, (B) Tb3+-51 (2 mM), (C) Eu3+-51 (2 mM), (D) Tb3+-51 and Eu3+-51 (1 mM each). Left Image: CEST MR Difference image obtained by irradiation of the metal bound water protons of the Tb3+ complex at -600 ppm. Right Image: CEST MR Difference image obtained by irradiation of the Eu3+ complex at +50 ppm. The red and green colors are assigned arbitrarily. CEST MR imaging conditions: train of sinc 3 pulses (1 ms for Eu3+ and 250 μs for Tb3+), inter-pulse delay = 10 μs, irradiation power = 250 μT, irradiation time = 2s. Reference 166, Copyright 2005; Reprinted with permission of John Wiley & Sons, Inc.166
“Multi-Frequency” MRI using PARACEST agents would be extremely useful for imaging multiple biomarkers simultaneously, since any parameter (pH, temperature, redox, metabolite concentration) that alters the water exchange kinetics will in turn alter image contrast.145,167–170 To date, however, with a few exceptions, only Eu3+ complexes have displayed sufficiently slow water exchange kinetics to satisfy the kex ≤ Δω requirement in pure water. Complexes of other lanthanide ions that induce large paramagnetic shifts [Tm 3+, Tb3+, Pr3+ and Yb3+] have faster than optimal water-exchange kinetics and usually do not show CEST from bound water. This has limited the development of multi- frequency PARACEST agents based on water exchange. An alternate approach to overcome this problem was shown by Aime et al. using LIPOCEST agents (Section 4.4.8).171–172 They demonstrated that encapsulating different neutral polynuclear Tm3+-based shift reagents in the inner core of liposomes produces significant changes in the frequencies of the water protons encapsulated within the core.
In a recent account, Viswanathan et al. demonstrated that the resonance frequency of the Eu3+-bound water is sensitive to relatively minor structural changes in the periphery of the ligand (54–56).173 All three Eu3+ complexes used in this study exhibited three distinct, well separated resonance frequencies for the Eu3+-bound water protons: 45 ppm for Eu3+-54, 54 ppm for Eu3+-55 and 64 ppm for Eu3+-56. In a mixture containing all three complexes, each agent could selectively be activated without interference from the others by applying the appropriate presaturation frequency to produce multi-frequency PARACEST images (Figure 25).
Figure 25.


(a) Combined PARACEST spectra due to bound water protons at 45 ppm (20 mM), 54 ppm (15 mM) and 64 ppm (11 mM) for Eu 3+-54 (Red), Eu3+-55 (Green) and Eu3+-56 (Blue) respectively The black trace indicates a cocktail of the three complexes (20 mM). CEST spectroscopy conditions (recorded at 400 MHz, 298 K, pH = 7.0): irradiation power = 5 μT and irradiation time = 5 s. (b) Colored images of the three complexes and the cocktail: water (Dark Region), 44 (Red), 45 (Green), and 46 (Blue). CEST MR imaging conditions (recorded at 4.7 T, 298 K, pH = 7.0): irradiation time = 5 s and irradiation power = 8 μT. (c) A graph quantifying the selectivity of each Eu3+ complex in the presence of other agents: Eu3+-54 (Red), Eu3+-55 (Green), and Eu3+-56 (Blue). Reference 173, Copyright 2005; Reprinted with permission of John Wiley & Sons, Inc.173
4.4.6 Calculation of Bound Water Exchange Rates of PARACEST Agents
Several methods, virtually all NMR based, have been used for the measurement of water exchange rates of lanthanide complexes. Merbach and co-workers pioneered the use of 17O variable temperature and pressure experiments for the measurement of kinetic and activation parameters that describe the water exchange processes in lanthanide macrocyclic complexes.93,112 In relatively fast exchanging systems, the bound water signal cannot be observed in the 17O spectra. In such cases, the water exchange rates for the coordinated water molecule can be directly obtained from the variable temperature measurements of the transverse 17O relaxation rates of the bulk water using the Swift Connick approach, as reviewed elsewhere.92–94,102,115,126,131,174–175 This technique is applicable to the determination of kex values over a wide range except for extremely fast or slow systems. It is especially useful for Ln3+ complexes where the relaxation enhancement of water is relatively large (Gd3+, Tb3+, and Dy3+). If the complex exists as two interconverting isomers, the bulk water is obviously affected by both isomers present in the solution, the kex thus obtained contains contributions from both isomers and represents a weighted average of the individual kex values (Eq 35):125,127
| (35) |
where P is the molar fraction of each isomer.126
Under slow exchange conditions when the Ln3+-bound water 1H and 17O NMR signals are observable, the exchange rate can be determined by the temperature dependent line shape analysis of either or both of the 1H or 17O resonances using a simple two-site chemical exchange model with unequal populations.42,126,128 This method has been used to measure the exchange rate of several LnDOTA-tetraamide complexes in acetonitrile at low temperatures and in some cases, when the bound water peaks due to both the SAP and TSAP isomers are observable, the kex value of each isomer can be determined separately.
Other techniques based on NMRD profiles, variable temperature 1H NMR relaxation time and luminescence measurements have also been used to measure water exchange rates in lanthanide complexes but the scope of these methods are more limited. 176–177 In this section, we concentrate on two methods in particular, that have wide applications for PARACEST agents - numerical solutions to the modified Bloch equations and Omega plots.
4.4.6.1 Numerical Solutions to the Modified Bloch Equations
Most PARACEST agents typically have more than one type of exchanging site, protons from the amide group and bound water being the most common sites encountered. In order to measure the exchange rates for such a three pool system, Woessner and co-workers extended the modified Bloch equations described earlier to a three-pool case to include exchange for a three-pool system between pool A (bulk water) and pool B (bound water) and between pool A (bulk water) and pool C (-NH). 67 It is generally assumed that there is no exchange between the pools B and C (Eqs 36–44).67
| (36) |
| (37) |
| (38) |
| (39) |
| (40) |
| (41) |
| (42) |
| (43) |
| (44) |
Cb and Cc represent the transition rates of the protons leaving pools B and C and entering pool A. Two new terms (Cab and Cac) have been introduced in the three pool system when compared to the two pool system described earlier (Section 4.1.2). Cab is the transition rate of the pool A protons entering pool B and Cac is the transition rate of the pool A protons entering pool C. All the other definitions remain similar to the two-pool case. Similar to the previous descriptions for the two pool case, the thermal equilibrium Z magnetizations ( and ) are directly proportional to the number of protons in each pool (Eqs 45–47).
| (45) |
| (46) |
| (47) |
At steady state, with the time derivatives of all nuclear magnetizations at zero, solutions to the resulting set of nine equations gives . Nevertheless, solutions to these equations without algebraic simplification for a three pool system or even more complicated systems are painstaking. To obtain a simplified solution without approximations, Woessner et al. applied Cramer’s rule to numerically solve the modified Bloch equations for the steady state case. Cramer’s rule simply involves writing the augmented matrix that contains the coefficients of all the nuclear magnetizations and constant terms. The numerical X, Y, and Z magnetizations for all the pools are included in the matrix shown in Eq 48. Using commercial software such as MATLAB or PSI-PLOT, these matrix equations can be re-written as a linear equation of the form dY/dt = A * Y + b and solved by using the matrix left division (\) and matrix power (expm 1) functions of MATLAB. One of the most important advantages of this method lies in the fact that it does not require an assumption that the system is at steady-state. Instead, the matrix solution to the modified Bloch equations accounts for the length of the presaturation pulse by the use of an exponential operator that expresses the time dependence of the equations.
| (48) |
Fitting experimental CEST spectra to the modified Bloch equations enable one to obtain water exchange rates for any number of complicated exchange processes involving multiple exchanging pools for a wide variety of situations, without approximations.82–83
4.4.6.2 The Omega Plot
In a recent report,178 Dixon and co-workers detailed a new concentration-independent method to determine the water exchange rates of CEST contrast agents. Consider first the direct saturation of a single pool of bulk water protons (pool A) without chemical exchange, as discussed by Woessner et al. (Eq 49).67
| (49) |
If this pool encounters chemical exchange with another pool during this process, an additional term, τa (the lifetime of the protons in pool A) is introduced into Eq 49.
| (50) |
Under the approximation that the rate of exchange is relatively fast when compared to the relaxation rates, Eq 50 reduces to Eq 51.
| (51) |
Now consider the case of PARACEST agents, where bound water pool protons are in chemical exchange with protons of the bulk water. After prolonged saturation of the bound water protons, such that they achieve steady state, the net magnetization remaining in the bulk water pool is determined by the loss of magnetization of the pool B protons and the rate of recovery of the bulk water magnetization due to T1a. Thus,
| (52) |
Rearranging the above equation into a linear form of the form y = mx + c,
| (53) |
Thus, a plot of vs should give a straight line with a slope of 55.5Cb/c and a Y-axis intercept of 55.5/cCbT1a, while the X-axis intercept provides a direct readout of the exchange rate . Once the exchange rate is determined, the concentration can be determined from the slope or the Y-intercept. The Omega plot has the advantage in that it provides a concentration independent approach to determine the water exchange rates of PARACEST agents. This may prove to be especially important in vivo.
4.4.7 Responsive Agents
The current focus of many imaging techniques involves the design of sensors to specifically measure certain physiological parameters such as pH and temperature or to signal the presence of metabolites and biomarkers in tissues. Many techniques including electrochemical,179–180 fluorescence,181–182 magnetic resonance,183 and PARACEST have been employed to selectively target nitric oxide,184 glucose,169,185 lactate,170 and metal ions186 among others.187 In applying these techniques to a biological target, there are a number of obstacles that must be resolved before they could be considered useful clinically. There are several properties a good sensor must possess: (a) the agent must be kinetically and thermodynamically stable in biological media, (b) it must be nontoxic, (c) should not disturb the biological system of interest at a molecular level, and (d) should be minimally invasive for patient comfort.148,188 Direct detection of the analyte is generally considered best, although this principle may not always hold true. Ideally, interactions of the analyte with the sensor should be reversible, particularly in cases where the analyte plays a key role in biological cascades needed for homeostasis, and the binding affinity should approximately match the concentration of the analyte typical of normal biology.
Several biological sensors based on PARACEST agents have been reported.4 The ability of a PARACEST agent to be selectively turned on and off by varying the frequency of the selective presaturation pulse is a substantial positive for this platform because this offers the possibility of detecting multiple biological responses in a single experiment. It is thus reasonable to suggest that further discoveries will result in useable sensors that respond to early biomarkers of disease, report on the effectiveness of disease treatment, and provide insights into a variety of metabolic processes.
4.4.7.1 pH Sensitive
pH plays a key role in biological homeostasis, with small changes serving as indicators of various abnormalities. For example, healthy tissues have an extracellular pH around 7.4 while cancerous tissues are more acidic, typically having an extracellular pH of 6.8–6.9.189 Therefore, it is not surprising that pH mapping was one of the earliest and most important targets for contrast agents. The earliest studies of diamagnetic CEST molecules already recognized that the magnitude of CEST response was pH dependent.1,52 Consequently, in theory, any molecule that shows a pH dependent CEST response could potentially be used as a pH imaging agent.
A number of Gd3+-based complexes display a change in relaxivity with changes in pH and can therefore be used as pH imaging agents.189–190 However, the contrast enhancement observed can either be a result of change in local concentration of the agent or a pH effect or both. One approach to overcome this problem is to use a dual contrast agent method involving the sequential injection of two different agents with identical pharmacokinetics. The pH sensitive agent is injected first followed by a second agent that mimics the tissue concentration distribution of the first agent, but is pH insensitive.6 While pH mapping studies have been done using this protocol in animals, it is impractical for clinical applications.. Unlike Gd3+-based agents, two different PARACEST agents can be administered and imaged simultaneously negating the need to know the exact tissue concentration of the sensor. As an alternative, single agent ratiometric methods can also be used, provided that the agent has two CEST sites whose pH response is different. In this case, two images can be collected and the ratio of those two CEST responses should directly report tissue pH. Two ratiometric methods have been proposed for monitoring pH in tissues based upon using two exchanging pools either on two separate molecules or within the same molecule.
Aime and co-workers were the first to propose the use of the ratiometric method involving two PARACEST agents, Yb3+-51 and Eu3+-51, to measure pH in vitro.167 They investigated a series of Ln3+-51 complexes and found that the Yb3+ complex showed the most promising CEST properties for the amide protons, based on their exchange rates and pH dependence, vide infra. While Yb3+-51 displays an amide-based CEST response at −16 ppm, no Yb3+-OH2 peak was observed, presumably because water exchange in this complex is too fast to be observed on the NMR timescale. It is assumed that the pH response of Yb3+-51 is base-catalyzed as demonstrated for a variety of other -NH protons (Section 4.4.3.2). A linear relationship between CEST and pH was observed over the pH range from 5.5 to 8.1 for Yb3+-51. This first generation pH sensor showed nice differences CEST contrast as shown in Figure 26. A maximum CEST contrast effect was seen at pH 8.1 but is almost completely diminished at pH ~ 6. The Eu3+-51 contrast agent, needed purely for ratiometric analysis in this case, shows a bound water CEST response that is virtually independent of changes in pH at ~50 ppm downfield from bulk water. Figure 27 illustrates the CEST spectrum resulting from a combination of 16 mM Eu3+-51 and 20 mM Yb3+-51 at pH 8.1. The water exchange resonance from Eu3+-51 is visible as a broad shoulder at ~ 50 ppm while the –NH exchange component from Yb3+-51 is less well-resolved on upfield shoulder of the bulk water resonance. Nevertheless, this study set the groundwork for other PARACEST pH sensors by establishing the ratiometric method. Additionally, in vivo applications of this dual sensor system are theoretically possible because it is relatively safe to assume identical bio-distributions for these two complexes because they have identical charges and hydrophilic/lipophilic balances.
Figure 26.

A CEST MR phantom image (M 0-Ms) containing four vials of Yb3+-51 (30 mM) in the pH range of 5.4–8.4. The vials were dipped in water containing 30 mM of Yb3+ aqua-ion. CEST MR imaging conditions (acquired at 7.05 T, 298 K): irradiation time = 4 s and irradiation power = 12 μT. Reference 167. Copyright (2002); Reprinted with permission of John Wiley & Sons, Inc.167
Figure 27.

CEST spectrum of a solution containing both Eu3+-51 (16 mM) and Yb3+-51 (20 mM). CEST spectroscopy conditions (recorded at 300 MHz, pH 8.1 312 K): irradiation time = 4 s and irradiation power = 25 μT. Reference 167. Copyright (2002); Reprinted with permission of John Wiley & Sons, Inc.167
An alternative method which would not require the use of two imaging agents in vivo is possible if the two CEST responsive pools were in the same molecule. The Yb3+ complex of 17 proved to have two observable CEST effects for the amide protons.155 These protons are magnetically non-equivalent and result in two broad resonances at −14.5 and −17.7 ppm. As shown in the inset in Figure 21, these protons are quite sensitive to changes in pH. Surprisingly, Zhang et al. observed that τM varies only slightly in the range of pH 6.46 – 7.84, indicating that these resonances should serve as efficient antennae for transferring magnetization to bulk water at pH value relevant to biological conditions.155 In fact, a 30 mM solution of Yb3+-17 showed 52 and 42 % decrease in bulk water signal when the –NH protons were irradiated separately and a 70% decrease upon simultaneous radiation. Such promising results led to the use of this complex in dendrimer studies (Section 4.4.9). Nevertheless, this is a perfect example of using one molecule with two exchangeable sites for the ratiometric detection of pH.
Another promising example of a PARACEST agent with two detectable exchanging sites is the Pr3+ complex of 51. This complex shows a measurable CEST response from the metal bound water molecule as well as the amide protons, making it a dual pool sensor.154 As shown in Figure 28, the bound water CEST effect is independent of pH while that of the amides is highly pH dependent in the range of 5.0 – 8.0. Here, water exchange is independent of pH while base-catalyzed exchange of the amide protons in the same molecule has their usual pH dependency. As the two CEST exchange peaks in this complex are well separated in terms of frequency, the use of this complex to monitor pH in vivo would be exciting. However, the CEST response of a 30 mM sample at pH 7.4 is only about 40% likely making this agent too insensitive for in vivo studies. Nevertheless, if concentration issues can be solved, a sensor of this type would be optimal for in vivo applications.
Figure 28.

pH dependence of the CEST effect of the amide protons (●) and metal-bound water protons (■) for a 30 mM aqueous solution of Pr3+-51. CEST spectroscopy conditions (300 MHz, 312 K): irradiation time = 4 s, irradiation power = 7 μT (for the amide protons) and 87.6 μT (for the metal-bound water protons).154
4.4.7.2 Temperature Sensitive
Understanding the relationship between variations in tissue temperatures and metabolism, physiology and disease states is a topic of great interest.168 This is, in part, due to recent studies that show elevated temperatures in cancer as well as in some heart conditions.191–193 In vivo tissue measurements include invasive thermocouples that are highly sensitive but are limited in that they measure only local tissue temperature and not simultaneous organ temperature gradients.194–195 A number of MRI techniques have been proposed as non-invasive methods for imaging temperature. The most widely used, proton resonance frequency (PRF) shifts, has shown promise in this arena with measurements that show an accuracy of ±1–3 °C. This technique is based on the observation of Hindman,195 who noted that the frequency of water proton resonance has a linear relationship with temperature over the range of 37 – 43 °C. This range of accuracy would be appropriate for tumor ablation but would not be widely applicable for imaging corticoid atherosclerotic plaques which only differ in temperature about 0.2–0.3 °C compared to normal tissues. Other techniques, such as hyperfine shift agents or paramagnetic relaxation agents, are beleaguered by poor spatial resolution and high concentrations need for imaging.196 PARACEST thermometry imaging, however, uses the bulk water, present at 40–50 M in vivo, for detection so this improves sensitivity considerably.
There are two factors that response to changes in temperature in these complexes, the rate of water/proton exchange and the magnitude of the lanthanide-induced hyperfine shift. Thus, both the magnitude and the shape of the CEST exchange peaks are extremely sensitive to temperature variations. As all PARACEST agents response to changes in temperature, the following examples are intended to illustrate the basic principles of using these systems in vivo. Terreno et al. took advantage of the two pools of exchangeable protons in Pr3+-51 and utilized a ratiometric approach to measure temperature gradients over a range of 295 – 330 K.154 An inverse linear relationship between temperature and CEST from water exchange was found in this complex (Figure 29). The amide protons, however, showed a more complicated behavior with changes in temperature. Here, the CEST response increased with temperature to a maximum at around 315K and then decreased with further increases in temperature. By taking the ratio of these two pools, -NH and Pr3+-OH2, a concentration-independent measure of temperature was described. Using a somewhat different approach, Zhang, et al. demonstrated that the frequency of the CEST water exchange peak in Eu3+-51 could be used as a temperature sensor.168 Given that the frequency of this exchange peak is independent of concentration (even though its magnitude is concentration dependent), one can extract an exact temperature measurement by simply scanning the frequency of the presaturation pulse over a narrow range of frequencies to locate the peak maximum. To demonstrate this, temperature maps were generated on phantom samples containing 10 mM Eu3+-51, pH 7 at different controlled temperatures. The images in Figure 30 show that even small temperature gradients are easily detected, an excellent property for biological thermometry. This rather simple first generation PARACEST thermometer showed a ~690 fold increase in temperature sensitivity over the more widely used PRF technique.
Figure 29.

Temperature dependence of the CEST effect of the amide protons (●) and metal-bound water protons (■) for a 30 mM aqueous solution of Pr3+-38. CEST spectroscopy conditions (300 MHz, pH 7.4): irradiation time = 4 s, irradiation power = 7 μT (for the amide protons) and 86.7 μT (for the metal-bound water protons).154
Figure 30.

Temperature maps of a phantom containing 1 mL of a 10 mM aqueous solution of Eu3+-51. The temperatures of the air flowing over the sample are indicated in each figure (Tair), while those reported by imaging are shown by the color bar (in units of °C). CEST MR imaging conditions (4.7 T, pH 7.0): irradiation time = 2s and irradiation power = 17 μT. Reproduced with permission from reference 168, Copyright 2005 American Chemical Society.168
Li and co-workers set out to design a temperature sensitive agent capable of producing a maximum CEST response at physiological temperature. To achieve this, an additional amino acid phenylalanine was added to 51 to produce 57.194 This resulted in a slowing of water exchange and a larger maximal CEST effect at temperatures near physiological range (see Table 11). The temperature dependence of the chemical shift of Eu3+-57 was shown to be linear but not quite as sensitive to temperature changes compared to Eu3+-51 (Figure 31). This new complex provided greatest sensitivity near 38°C with an ~75% increase in CEST effect compared to Eu3+-51 under the same experimental conditions, a substantial advantage for biological applications. It is also obvious from the figure that above 40°C, rate of exchange between the bound water and the bulk water becomes fast and results in a decrease in intensity of the CEST signal. This trend can be explained by referring back to Figure 23(b) where a maximum CEST effect is seen when the rate of water exchange is equal to 2πB1 (Section 4.4.4), with any other data point showing less than optimum CEST. Though the bound water in Eu3+-51 is more sensitive to changes in temperature, greater B1 power is needed to realize the same CEST effect as that found with Eu3+-57 (assuming equivalent agent concentrations). Standard spin-echo imaging with phantoms showed that this complex was accurate to ±0.5 °C of the known value and the standard deviation of the pixel temperature was ±0.2 °C (Figure 32). These studies show extensive progress in the area of thermometric PARACEST agents and hold great promise for in vivo applications.
TABLE 11.
Exchange rates and bound water lifetimes for Ln3+ macrocyclic complexes reviewed in this work.
| Complex | kex s−1 | τM | Method | Solvent | Reference |
|---|---|---|---|---|---|
| Gd3+–1 | 4.1 × 10⁶ | 244 ns | 17O NMR | Water | 112 |
| Gd3+–2 | 4.8 × 10⁶ | 208 ns | 17O NMR | Water | 112,325 |
| 5.4 × 10⁶ – SAP | 185 ns | 1H NMRD/17O | |||
| 500.0 × 10⁶- TSAP | 2 ns | NMR/EPR (global analysis) | |||
| 1H NMRD/17O NMR/EPR (global analysis) | |||||
| Gd3+–3 | 14.3 × 10⁶ | 70 ns | 17O NMR | Water | 113 |
| Gd3+–4 | 167.0 × 10⁶ | 6.0 ns | 17O NMR | Water | 113 |
| Gd3+-5 | 270.0 × 10⁶ | 3.7 ns | 17O NMR | Water | 114 |
| Gd3+-7 | 31.0 × 10⁶ | 32 ns | 17O NMR | Water | 115 |
| Gd3+-8 | 330.0 × 10⁶ | 3 ns | 17O NMR | Water | 115 |
| Gd3+-10 | 25.0 × 10⁶ | 40 ns | 1H NMRD/17O NMR | Water (pH 4.7) | 119 |
| 71.4 × 10⁶ | 14 ns | 1H NMRD/17O NMR | Water (pH 7) | 119 | |
| Gd3+-13 (RRRR) | 8.3 × 10⁶ | 120 ns | 17O NMR | Water | 130 |
| Gd3+-13 (SSSS) | 66.7 × 10⁶ | 15 ns | 17O NMR | Water | 130 |
| Gd3+-15 | 4.3 × 10⁵ | 2.3 μs | 17O NMR | Water | 326,131 |
| Gd3+-15 (310 K) | 1.03 × 10⁶ | 967 ns | 17O NMR | Water | 327 |
| Gd3+-15 | 1.2 × 10⁶ | 810 ns | 1H NMRD | Water | 177 |
| Eu3+-15 | 0.66 × 10⁶ | 1.5 μs | 17O NMR | Water | 131 |
| Dy3+-15 | 3.5 × 10⁶ | 285 ns | 17O NMR | Water | 131 |
| Nd3+-15 | 0.53 × 10⁶ | 1.9 μs | 17O NMR | Water | 131 |
| Tb3+-15 | 1.6 × 10⁶ | 621 ns | 17O NMR | Water | 131 |
| Ho3+-15 | 6.0 × 10⁶ | 167 ns | 17O NMR | Water | 131 |
| Pr3+-16 | 22.0 × 10³ | 45 μs | 17O NMR | CD3CN | 132 |
| 52.6 × 10³ | 19 μs | 1H NMR | 132 | ||
| Nd3+-16 | 6.0 × 10³ | 168 μs | 17O NMR | CD3CN | 132 |
| 14.1 × 10³ | 70 μs | 1H NMR | |||
| Sm3+-16 | 1.5 × 10³ | 653 μs | 17O NMR | CD3CN | 132 |
| 1.8 × 10³ | 565 μs | 1H NMR | |||
| Eu3+-16 | 1.2 × 10³ | 789 μs | 1H NMR | CD3CN | 132,42 |
| Eu3+-16 | 1.2 × 10³ | 789 μs | 17O NMR | CD3CN | 132,42 |
| Eu3+-16 | 2.61 × 10³ | 382 μs | 1H NMR | Water | 132,42 |
| Eu3+-16 | 4.76 × 10³ | 210 μs | CEST-Numerical Solutions | Water | 178 |
| Eu3+-16 | 4.4 × 10³ | 225 μs | 1H NMR | Water | 178 |
| Eu3+-16 | 4.04 × 10³ | 247 μs | Omega Plot | Water | 178 |
| Gd3+ -16 | 4.0 × 10³ | 250 μs | 17O NMR | CD3CN | 153 |
| 5.2 × 10³ (pH 7) | 190 μs | T1 1H NMR | Water | 153 | |
| Y3+-16 | 16.9 × 10³ | 58.9 μs | 17O NMR | CD3CN | 132 |
| Er3+-16 | 56.5 × 10³ | 17.7 μs | 17O NMR | CD3CN | 132 |
| Dy3+-16 | 47.6 × 10³ | 21 μs | 17O NMR | Water | 328 |
| 25.5 × 10³ | 39 μs | CH3CN | 152 | ||
| Gd3+-17 | 5.2 × 10⁴ | 19 μs | 17O NMR | Water | 125 |
| Eu3+-17 | 8.3 × 10³ (SAP) | 120 μs | 1H/17O NMR | CD3CN | 126 |
| 327.0 × 10³ (TSAP) | 3 μs | ||||
| Eu3+-17 | 9.4 × 10³ (SAP) | 106 μs | 1H NMR | CD3CN | 126,128 |
| 474 × 103 (TSAP) | 2.1 μs | ||||
| Eu3+-18 | 8.2 × 10³ (SAP) | 122 μs | 1H NMR | CD3CN | 128 |
| 59.7 × 10³ (TSAP) | 16.7 μs | ||||
| Eu3+-19 | 3.6 × 10³ | 278 μs | 1H NMR | CD3CN | 143 |
| Yb3+-19 | 1.9 × 10⁶ | 526 μs | 1H NMR | CD3CN | 143 |
| Gd3+-20 | 0.769 × 10³ | 1.3 μs | 17O NMR | Water | 5 |
| Gd3+-21 | 0.161 × 10³ | 6.2 μs | 17O NMR | Water | 5 |
| Gd3+-22 | 39.2 × 10³ | 26 ns | 17O NMR | Water (pH 7.2) | 153 |
| Dy3+-22 | 47.6 × 10³ | 21 ns | 17O NMR | Water | 329 |
| Gd3+-23 | 1.9 × 10⁶ | 526 ns | 17O NMR | Water | 136 |
| Gd3+-24 | 1.3 × 10⁶ | 769 ns | 17O NMR | Water | 136 |
| Gd3+-24 (310 K) | 5.6 × 10⁶ | 179 ns | 17O NMR | Water | 330 |
| Gd3+-25 | 0.98 × 10⁶ | 1.02 μs | 17O NMR | Water | 174 |
| Gd3+-26 | 0.6 × 10⁶ | 1.67 μs | 17O NMR | Water | 174 |
| Gd3+-27 | 0.21 × 10⁶ | 4.7 μs | 1H NMRD | Water | 176 |
| Gd3+-27 (310 K) | 1.54 × 10⁶ | 648 ns | 17O NMR | Water | 330 |
| Gd3+-28 (310 K) | 1.2 × 10⁶ | 841 ns | 17O NMR | Water | 330 |
| Gd3+-29 (310 K) | 1.1 × 10⁶ | 901 ns | 17O NMR | Water (pH 6) | 330 |
| 8.7 × 10⁶ | 115 ns | 17O NMR | Water (pH 9.7) | 330 | |
| Gd3+-30 (310 K) | 0.04 × 10⁶ | 2521 ns | 17O NMR | Water | 330 |
| Gd3+-31 (310 K) | 0.035 × 10⁶ | 2882 ns | 17O NMR | Water | 330 |
| Gd3+-32 (310 K) | 0.7 × 10⁶ | 1.4 μs | 1H NMRD | Water | 176 |
| Gd3+-33 (310 K) | 0.2 × 10⁶ | 4.0 μs | 1H NMRD | Water | 176 |
| Gd3+-34 | 0.42 × 10⁶ | 2.4 μs | 1H NMRD | Water | 176 |
| Gd3+-34 (310 K) | 0.71 × 10⁶ | 1.4 μs | 1H NMRD | Water | 176 |
| Gd3+-35 | 6.3 × 10⁶ | 159 ns | 17O NMR | Water | 137 |
| Eu3+-36 | 11.2 × 10³ | 890 μs | 1H NMR | CD3CN | 128 |
| Gd3+-37 (NO2) | 7.4 × 10⁶ | 135 ns | 17O NMR | Water | 144 |
| Gd3+-37 (NH2) | 17.6 × 10⁶ | 57 ns | 17O NMR | Water | 144 |
| Eu3+-38 (CH3) | 3.2 × 10³ | 310 μs | CEST - Numerical solutions | Water/CH3CN | 145 |
| Eu3+-38 (OCH3) | 5.1 × 10³ | 198 μs | CEST - Numerical solutions | Water/CH3CN | 145 |
| Eu3+-38 (H) | 3.7 × 10³ | 269 μs | CEST - Numerical solutions | Water/CH3CN | 145 |
| Eu3+-38 (F) | 6.9 × 10³ | 144 μs | CEST - Numerical solutions | Water/CH3CN | 145 |
| Eu3+-38 (COOtBu) | 2.8 × 10³ | 352 μs | CEST - Numerical solutions | Water/CH3CN | 145 |
| Eu3+-38 (CN) | 3.0 ×10³ | 324 μs | CEST - Numerical solutions | Water/CH3CN | 145 |
| Eu3+-43 | 2.7 × 10⁴ | 37 μs | CEST - Numerical solutions | Water | 138 |
| Eu3+-44 | 1.0 × 10⁵ | 10 μs | CEST - Numerical solutions | Water | 138 |
| Eu3+-45 | 5.9 × 10⁴ | 17 μs | CEST - Numerical solutions | Water | 138 |
| Eu3+-46 | >1 × 10⁶ | < 1 μs | CEST - Numerical solutions | Water | 138 |
| Eu3+-47 | 9.61 × 10³ | 104 μs | CEST - Numerical solutions | Water | 138 |
| Eu3+-48 | 4.8 × 10³ | 210 μs | CEST - Numerical solutions | Water | 138 |
| Gd3+-50 | 0.787 × 10³ | 1.27 μs | T1 1H NMR | Water | 153 |
| Tb3+-51 | 2.3 × 10⁵ | 4 μs | 1H NMR | Water | 154 |
| Nd3+-51 (312 K) | 4.9 × 10⁴ | 20 μs | 1H NMR | Water | 154 |
| Pr3+-51 (312 K) | 2.1 × 10⁵ | 4.8 μs | 1H NMR | Water | 154 |
| Eu3+ -51 | 3.8 × 10³ | 262 μs | 1H NMR | Water (pH 7) | 153 |
| 6.3 × 10³ | 160 μs | CEST - Numerical solutions | Water | 178 | |
| 6.4 × 10³ | 156 μs | CEST - Omega plot | Water | 178 | |
| Eu3+-51 (312 K) | 5.8 × 10⁴ | 17 μs | 1H NMR | Water | 154 |
| Eu3+-54 | 5.0 × 10³ | 200 μs | CEST - Numerical solutions | Water | 173 |
| Eu3+-55 | 12.3 × 10³ | 81 μs | CEST - Numerical solutions | Water | 173 |
| Eu3+-56 | 18.2 × 10³ | 55 μs | CEST- Numerical solutions | Water | 173 |
| Eu3+-57 | 3.7 × 10³ | 271 μs | CEST - Numerical solutions | Water | 194 |
| Eu3+-58 | 45.0 × 10³ | 22 μs | CEST - Numerical solutions | Water | 197 |
| Eu3+-58 + Glucose | 23.2 × 10³ | 43 μs | CEST - Numerical solutions | Water | 197 |
| Eu3+-64 | 10.0 × 10³ | 100 μs | CEST - Numerical solutions | Water | 232 |
| Gd3+-76 | 14.7 × 10⁶ | 68 ns | 17O NMR | Water | 127 |
| Eu3+-90 | 4.5 × 10³ | 221 μs | CEST - Numerical solutions | Water | 241 |
| Eu3+-91 | 6.9 × 10³ | 144 μs | CEST - Numerical solutions | Water | 241 |
| Eu3+-94 | 1.5 × 10³ | 687 μs | CEST - Numerical solutions | Water | 270 |
| Gd3+-96 | 1.24 × 10³ | 805 μs | T1 (1H) | Water | 153,331 |
| Eu3+-96 | 0.743 × 10³ | 1346 μs | 1H NMR | CD3CN | 153,331 |
| Gd3+-107 | 0.5 × 10⁶ (SAP) | 200 ns | 17O NMR | Water | 127 |
| 22.0 × 10⁶ (TSAP) | 45 ns | ||||
| Gd3+-108 | 0.7 × 10⁶ (SAP) | 1.35 μs | 17O NMR | Water | 263 |
| 71 × 106 (TSAP) | 14 ns |
Figure 31.

(a) CEST spectra of a 10 mM aqueous solution of Eu3+-57 at different temperatures. (b) Linear dependence of the chemical shift of the bound water protons on temperature for a 10 mM aqueous solution of Eu3+-57. CEST spectroscopy conditions (400 MHz and pH 7.0): irradiation time = 10 s and irradiation power = 14 μT. Reference 194. Copyright (2008); Reprinted with permission of John Wiley & Sons, Inc. 194
Figure 32.

(a) Temperature map of a phantom containing a 10 mM aqueous solution of Eu3+-57 at pH = 7.0, (b) Temperature map of a phantom containing a 15 mM solution of Eu3+-57 with 5% bovine serum albumin at pH = 7.0, and (c) Temperature map of a phantom containing brain tissue with a 4 mM solution of Eu3+-57 at pH = 7.4. The temperature measured by a fiber optic temperature sensor placed adjacent to each phantom was 301.5 K. The corresponding average CEST spectra and the average asymmetry curves are displayed above the temperature maps. CEST MR imaging conditions: irradiation time = 5 s and irradiation power = 15 μT. Reference 194. Copyright (2008); Reprinted with permission of John Wiley & Sons, Inc. 194
4.4.7.3 Glucose Sensors
The central importance of glucose production, storage, transport, and utilization in mammalian tissues provides motivation to develop non-invasive methods for the detection of glucose in vivo.169,197 Additionally, how these pathways respond to treatment of disease states such as diabetes and cancer would invariably aid in optimizing modes of treatment. Several glucose detection techniques are currently available. Glucose sensors have been developed using ultraviolet, fluorescence, circular dichroism (CD), and electrochemical methods but are invasive and not feasible for in vivo applications.198–205 Noninvasive techniques such as 1H magnetic resonance spectroscopy (MRS) has also shown potential for biological applications but is complicated by multiple overlapping metabolite signals with similar chemical shifts.206 The use of PARACEST imaging agents would provide a non-invasive solution with potentially higher spatial resolution. Unlike the pH and temperature sensors described above, an imaging agent for sensing glucose was designed around the concept that water exchange would be altered upon binding of glucose to specific receptors on the agent surface. Trokowski, et al. first illustrated this design by ligand 58 which contains two phenylboronate groups for binding reversibly with sugar cis-diol groups.185,197 The absence of a Eu3+-OH2 peak in the 1H NMR spectrum of Eu3+-58 indicates that water exchange is too fast to be detected on the NMR time scale in the absence of glucose but, interestingly, the water exchange rate slows about 2 fold upon addition of glucose. This was attributed to glucose forming a capped complex with the two phenyboronate groups, thereby hindering Eu3+-OH2 exchange as depicted in Figure 33. This model was supported by the appearance of multiplets due to 2J-coupling between glucose and the boronate arms and by circular dichoism studies confirming that a single molecule of sugar binds to the two arms of Eu3+-58.169 While phenylboronates have been shown to bind preferentially to fructose, competitive sugar binding studies showed preferential binding with Eu3+-58 falls in the order, glucose > fructose > galactose. These studies indicate that the macrocyclic ligand helps to position the phenylboronate arms in such a manner that is advantageous for glucose binding. To further support this model, Trokowski et al. showed that a ligand with two phenyboronates cis to one in the macrocycle exhibits preferential sugar binding in the order of fructose > galactose > glucose. This technology was successfully tested recently in ex vivo perfused mouse livers.197,207 In this experiment, hyperglycemia was modeled by perfusing the isolated liver from a fed mouse with 10 mM glucose and 10 mM sensor. A control liver was isolated from a 24 hr fasted mouse and perfused with the same amount of sensor, but no glucose. As shown in Figure 34(a), the CEST spectroscopy of the liver perfused with glucose and agent showed a distinct CEST peak near 42 ppm, while the second liver perfused only with the agent showed no clear water exchange peak. The appearance of a water exchange peak in the CEST spectrum after glucose addition demonstrates qualitatively that water exchange is slower when glucose is bound to the complex. Quantitatively, the change in CEST intensity induced by glucose was a 17 % decrease in water signal. Further analysis with the proposed sensor demonstrated that at 10 mM concentration of the sensor, changes in glucose concentration over 0–20 mM can be detected (binding constant for the Eu3+-60-glucose system is 2275 ± 266 M−1 at pH 10.2 and 339 ± 29 M−1 at pH 7). This is a reasonable range for biological detection where a typical blood glucose level in the diabetic state is 7–10 mM. This work helped to establish the principle that designing complexes based on chemical principles of reactivity is an elegant way to design “smart” imaging agents.
Figure 33.

The proposed binding model for Eu3+-58 with glucose. Reference 197. Copyright (2008); Reprinted with permission of John Wiley & Sons, Inc.197
Figure 34.

(a) CEST spectra of fresh effluent from a perfused fed-mouse liver (1:1 Glc) and a 24-hr fasted mouse liver (No Glc) at 310 K showing a glucose-induced CEST peak at on 42 ppm. Both perfusates contained 10 mM Eu3+-58 agent, pH 7.4. Off-resonance (b) and on-resonance (c) CEST images of a fed mouse liver (bottom, 10 mM Glc) and a 24-hr fasted mouse liver (top, Glc free) perfused with 10 mM Eu3+-58 agent in the presence (fed liver) and absence (fasted liver) of 10 mM glucose, 310 K. The “off -resonance” image (b) showed no contrast between the two livers while the “on-resonance” image (c) showed image darkening of fed liver versus the fasted mouse liver with on 42 ppm. (d) The CEST difference image showed the glucose induced CEST contrast between the fed and fasted mouse livers. CEST MR imaging conditions: irradiation time = 2 s and irradiation frequency = 23.5 μT. Reference 197. Copyright (2008); Reprinted with permission of John Wiley & Sons, Inc.197
4.4.7.4 Redox
Redox active species including metal ions and oxygen species are tightly regulated in vivo under most circumstances. However, the amount of energy available in biological redox systems can have incredibly detrimental effects if left unregulated.207–208 More specifically, disruption of redox homeostasis is suspected to play a key role in Alzheimer’s disease, Parkinson’s disease, cancer, stroke, and atherosclerosis.209 Understanding the relationship between redox active species and their function and/or malfunction would undoubtedly advance treatment of many diseases. Therefore, the development of non-invasive imaging techniques to monitor tissue redox has been the subject of many investigations in recent years. Optical techniques are quite sensitive for redox active species such as NADH at sub-cellular levels but are plagued by attenuation with increasing tissue depth limiting their use in vivo.210–213 Paramagnetic redox-sensitive nitroxides have been used as contrast agents in MRI but are limited by low relaxivity and relatively short lifetimes in vivo.214–215 Ratnakar et al. recently demonstrated that the p-nitro moiety of Eu3+-38 may be reduced to the p-amino derivative and that the resulting complexes have remarkable different CEST properties (Figure 35).145 While this reaction is not biocompatible, this experiment demonstrates the potential of developing redox-sensitive PARACEST agents based on this platform for use in vivo.
Figure 35.

CEST difference images showing that the oxidized and reduced forms of Eu3+-38 can be discriminated by MR imaging. CEST MR imaging conditions (9.4 T, 298 K): irradiation time = 3 s and irradiation power = 24 μT. Reproduced with permission from reference 145, Copyright 2008 American Chemical Society.145
4.4.7.5 Lactate
L-Lactate, the end-product of anaerobic glycolysis, is known to be elevated in stroke, cancer, cysts, during brain activation, and a few other metabolic disorders.216 Elegant methods have been published for detecting lactate by 1H spectroscopy and imaging but overlap of the lactate proton resonances with those of fats and other tissue metabolites makes quantitative lactate imaging quite challenging. Lactate is easier to uniquely detect by 13C NMR but even with enrichment, the sensitivity of 13C for detection of lactate in vivo is difficult except in the most favorable circumstances. 217 Recent advances in hyperpolarized 13C for detection of lactate in tumors has shown considerable promise.218 The addition of a lactate-specific imaging agent as an alternative method could be beneficial in some cases. Aime et al.170 recently reported a PARACEST detection system for lactate. The amide protons of the lactate-free complex, Yb3+-59 that appears as a broad resonance in the 1H NMR spectra at −28.5 ppm is transformed into a narrow set of doublets at −14 ppm and −20 ppm upon binding of L-lactate to the Yb3+ coordination sphere (lactate acts as a bidentate ligand in this case). The separation of ~10 ppm between Yb3+-59 and the ternary adduct Yb3+-59-lactate indicates that this agent can detect both the bound and free forms of the complex. Figure 36 shows the CEST spectra of the free and bound forms of Yb3+-59 at pH 7. However, unlike the significant difference observed in the high resolution spectra between the free and bound forms, the CEST spectra show partial overlap in the CEST peaks. Nevertheless, pre-irradiation at −29.1 ppm showed significant changes in the CEST effect as a function of lactate concentration (from 60 % to 0 %) while irradiation at −15.5 ppm shows only modest changes. As later observed by Woods et al, this system of irradiation at two different frequencies could also be used to give a concentration independent ratiometric method for the determination of lactate concentration in solution.4
Figure 36.

CEST spectra of a 30 mM aqueous solution of Yb3+-59: free (□) and fully bound to L-lactate (■). CEST spectroscopy conditions (300 MHz, pH 7.4, 312 K): irradiation time = 6s and irradiation power = 25 μT. Reproduced with permission from reference 170, Copyright 2002 American Chemical Society.170
4.4.7.6 Nitric Oxide
Nitric oxide (NO) plays a key role as a signal transmitter not only in the vascular endothelium, but also in the central and peripheral neurons. A deficiency in NO has been shown to occur in atherosclerosis, subarachnoid hemorrhage, and ischemia-reperfusion injury. Detrimental affects also appear if NO levels are too high. Excess NO is believed to induce epileptic seizures and even cause neuronal injury after a stroke.219 The NO radical is produced in μM quantities by the enzyme nitric oxide synthase (NOS) in the presence of oxygen.220 In addition to its low concentration, the extremely short lifetime of this biological messenger molecule makes it very difficult to detect in vivo, especially by MRI. One way to detect NO using MRI was successfully demonstrated by Fujii et al. by using spin-trapping reagents, in a technique they called “MRI spin-trapping”.221 NO has been shown to form reasonably stable complexes with various Fe-based compounds. In fact, it is known that hemoglobin and deoxyhemoglobin act as natural spin-traps for NO in the body.222 Using this idea, Fujii et al. used an Fe(II) chelate N-methyl-D-glucamine to form a spin-trap complex with NO, (MGD)2-Fe(II)-NO, and successfully visualized and mapped the site of NO generation in rats.
Another approach to detect the short-lived NO radical would be to use responsive contrast agents that undergo irreversible reactions with NO leading to products that can be detected easily using MRI, as shown recently by Liu et al. using a PARACEST agent.184 They report the use of the Yb3+-DO3A-orthoaminoanilide derivative, Yb3+-60, for NO detection. The orthoaminoanilide derivative, with two different types of exchangeable protons, shows CEST exchange peaks at −11 ppm and +8 ppm due to the amide and amine functional groups, respectively. Upon reaction with nitric oxide in the presence of oxygen, the compound undergoes irreversible conversion to a triazene derivative, leading to permanent loss of both the CEST peaks (Scheme 1).
Scheme 1.

Illustration of the irreversible conversion of Yb3+-63 in the presence of oxygen.184
Figure 37 shows the phantom images obtained before and after treatment of the complexes with NO and O2. In an approach similar to Aime’s work on pH sensitive agents,167 Pagel also used a Tm3+-51 complex that is unresponsive to changes in NO levels to track the pharmacokinetics and biodistribution of these agents. It can be clearly observed from the phantom images that significant loss of signal is observed for both the amine and the amide peaks of the Yb3+ complex after treatment with NO while the Tm3+ complex remained unaffected. While loss of the amine signal at +8 ppm can be easily explained by the conversion of the aromatic amine to a triazene molecule, the loss of amide peak at −11 ppm is attributed to conformational changes that result in the amide peak shifting further away from the lanthanide ion. Thus, irreversible smart agents such as this have the added benefit that they can detect short-lived species like the NO radical by detecting an irreversible product that accumulates with time.
Figure 37.

(a) MR images of a 30 mM aqueous solution of Yb3+-60 before and after reaction with nitric oxide in PBS with selective saturation at -11 ppm. Each PARACEST map was independently scaled to demonstrate that only susceptibility artifacts are present in the PARACEST maps of the product after reaction. (b) The PARACEST map of a 30 mM aqueous solution of Yb3+-60 before and after reaction in PBS with selective saturation at +8 ppm. (c) The PARACEST map of a 10 mM aqueous solution of Tm3+-51 before and after applying the same reaction conditions with selective saturation at -51 ppm. CEST MR imaging conditions (9.4 T, 310 K): irradiation power = 30 μT. Reference 184. Copyright (2007); Reprinted with permission of John Wiley & Sons, Inc.184
4.4.7.7 Zinc
Divalent zinc, ranking as the 2nd most abundant transition metal ion in the body (after iron), plays ubiquitous biological roles.223 The average human is thought to have about 2.3 grams of total zinc.208 Zn2+ participates in apoptosis, regulation of synaptic transmission and cell death.189 An understanding of its tissue biodistribution would facilitate a better understanding the biological regulation of this ion. Although a number of Gd3+-based Zn2+ sensors have been reported, they suffer from the same problem as most other small molecule Gd3+ agents in that the change in T1 relaxivity is typically quite small. To test the potential advantages of PARACEST for Zn2+ detection, Trokowski et al. prepared Eu3+-61 as a sensor for Zn2+. The agent, like earlier Gd3+-based systems, contained two dipyridyl amine moieties that show strong affinity for zinc ions.186 It was anticipated that binding of Zn2+ to the two dipyridyl amine (dpa) arms above the Eu3+-inner sphere water coordination site would result in a significant change in the rate of water exchange and thereby CEST. The CEST spectrum of a 20 mM buffered solution of Eu3+-61 shows a characteristic CEST effect due to bound water at 50 ppm in the absence of zinc. Upon addition of equimolar quantities of zinc ions to the sample at pH 7.1 resulted in significant broadening of the CEST exchange peak at 50 ppm (Figure 38a). At pH 8, this same CEST peak was so broad that it nearly disappears from the spectrum, consistent with an increase in water exchange (Figure 38b). One possible reason for dramatic broadening of the bound water peak could be attributed to changes in the coordination geometry of the Eu 3+ complex upon Zn2+ binding. It is well known that only the SAP isomer of DOTA-tetraamide lanthanide complexes exhibit slow enough water exchange for CEST so it is possible that binding of Zn2+ at its binding site induces a change in structure in the Eu3+ coordination sphere from the SAP to TSAP isomer, thereby increasing water exchange. However, high-resolution NMR spectra indicate that this was not the case and the Eu3+-retains the SAP geometry upon binding of Zn2+. Further studies indicated that, while most ligand systems containing the dpa arm exhibit a 2:1 coordination with Zn2+, Eu3+-61 forms only a mononuclear complex. In fact, potentiometric studies indicate that above pH 6, a Zn2+-OH species is formed and it is this species that is responsible the increase in water exchange that occurs upon binding Zn2+ binding through base-catalyzed exchange of protons between t he Eu3+-bound water and bulk solvent.
Figure 38.


(a) CEST spectra of a 20 mM aqueous solution of Eu3+-61 in the absence (gray line) and in the presence (black line) of 20 mM Zn2+ ions in piperazine-N,N′-bis(ethanesulfonic acid) (PIPES) buffer (100 mm; pH 7.1) at 298 K. (b) CEST spectra of a 20 mM aqueous solution of Eu3+-61 in the absence (gray line) and in the presence (black line) of 20 mM Zn2+ ions in 2,4,6-tris[(dimethylamino)methyl]phenol (DMP) buffer (100 mm; pH 8.0) at 298 K. CEST spectroscopy conditions: irradiation time = 2s, irradiation power = 1000 Hz. Reference 186. Copyright (2005); Reprinted with permission of John Wiley & Sons, Inc.186
4.4.7.8 Enzyme-Activated Agents
Most PARACEST agents discussed so far require analyte concentration on the order of 1–10 mM for detection, in most cases limited by the binding affinity between the analyte and the sensor. This places serious limits on potential applications in vivo for many molecular targets that exist in lower concentrations. A different approach in sensor design was developed by Yoo et al. using PARACEST active complexes.224–225 They set out to exploit the use of enzymatic catalysis to alter the structure of the sensor molecule, thereby changing its spectral properties. Their general strategy involved linking an enzyme substrate to a lanthanide complex. In the presence of the enzyme, the substrate would be consumed while the sensor is converted into a new structure with different CEST properties. This approach allows indirect detection of relatively low concentrations of enzyme activity. Given that proton exchange between a primary amine and water is generally faster than between an amide and water, the basic concept was to construct the DOTA-peptide conjugate that could be cleaved by an enzyme leaving behind a primary amino group. The system chosen by Yoo et al. (shown in Scheme 2) consists of the TmDOTA complex with one arm of the four attached to a tetrapeptide, Asp-Glu-Val-Asp (DEVD),225 that is cleaved by caspase-3, an “executioner” of the metabolic death cascade during cell apoptosis. Imaging the levels of this enzyme could be important in evaluating patient response to apoptosis-promoting antitumor therapies. The intact non-cleaved Tm3+ complex shows a CEST exchange peak near −51 ppm corresponding to the amide proximal to the lanthanide ion. Incubation of 48 nM caspase-3 with the sensor (25 mM) for 1 h (37°, pH 7.4) showed a significant decrease of the PARACEST effect at −51 ppm and a new response at +8 ppm. The new CEST signal was consistent with the conversion of the TmDOTA-DEVD amide 62 to the TmDOTA-amine derivative shown in Scheme 2. As shown in Figure 39, a 14.5 % decrease in water signal intensity in observed in the parametric map obtained after irradiation at −51 ppm in the absence of the enzyme, while no significant change in the water signal intensity was observed after the enzyme reaction. In this preliminary design, the targeted substrate ligand arm involved conversion of an amide to an amine, which would accelerate the rate of chemical exchange from ~300 to ~3000 s−1 as well as change the frequency of the exchange. Unfortunately, the reduction in CEST signal upon reaction with caspase-3 is opposite what one would prefer in a biological sensor so this aspect will likely limit the application of this sensor in vivo. However, the principle behind this PARACEST design is quite unique. In a later report, Yoo et al. extended this work to a two sensor system. The second sensor, Yb3+-62 shows an amide based CEST response at −16 ppm.224 Upon addition of enzyme, (1) the CEST response at −51 ppm dissipates, (2) a new CEST response at +8 ppm is observed and (3) the magnitude of the CEST response at −16 ppm remains unchanged. Monitoring the CEST effect of two complexes simultaneously would allow a better visualization of enzymatic activity. In fact, preliminary PARACEST MRI experiments on phantom samples showed that the activity of caspase-3 and caspase-8 could be monitored using this two sensor system.
Scheme 2.

Representation of the reaction of Tm3+-65 with Caspase-3.224
Figure 39.

(A) PARACEST spectra and (B) MR parametric map of a 25 mM aqueous solution of Tm3+-62 before and after addition of caspase-3. The deconvoluted PARACEST spectrum of the product after reaction, showing a PARACEST effect at +8 ppm, is also shown. CEST spectroscopy conditions (600 MHz, 310 K and pH 7.4): irradiation time = 4 s and irradiation power = 31 μT. CEST MR imaging conditions (9.4 T, 310 K and pH 7.4): irradiation time = 1.106 s and irradiation power = 50 μT. Reproduced with permission from reference 224, Copyright 2006 American Chemical Society. 224
A similar method was employed by Chauvin et al. with Yb3+-63.226 The approach couples an enzyme-specific substrate, in this case αBz-βGal, to a lanthanide chelating moiety via a self-immolative spacer. This Yb3+ derivative shows no CEST response initially, but upon introduction of the β-galactosidase enzyme, the spacer is cleaved and eliminated via the enzymatic action producing amide based CEST effects at −16.7 and −20.5 ppm. The enzymatic cleavage reaction is relatively fast, t1/2 = 68 min. As shown in Scheme 3, the subsequent electron cascade of the enzyme converts the amide to an amine, with new spectral properties. CEST images obtained from 20 mM samples of Yb3+-63 before and after enzymatic reaction are shown in Figure 40. Analysis of these images indicated that no significant change in water signal intensity is observed for Yb3+-63 but a 29% CEST effect is observed after reaction with enzyme. One main advantage of this system is that the presence of enzyme activity induces a new signal so that one is not simply monitoring loss of signal of the starting material. Although it still remains to be seen whether these agents can be used at the concentrations that are more compatible for in vivo applications, this methodology offers tremendous advantages in terms of the fact that a whole library of enzyme specific sensors could quickly be built and deployed giving a plethora of data from a single experiment.
Scheme 3.

Enzymatic activation of Yb3+-66 with β-galactosidase.226
Figure 40.

Phantom images of three tubes containing water or a 20 mM aqueous solution of Yb3+-63 before and after enzymatic reaction. The tube marked “Reference” contains the non-cleaved agent, while the tube marked “ParaCEST” contains the agent after enzymatic cleavage. CEST MR imaging conditions (9.4 T, 310 K, pH 7.5): irradiation time = 4 s, irradiation power = 25 μT. The arrow shows the PARACEST effect. Reference 226. Copyright (2008); Reprinted with permission of John Wiley & Sons, Inc.226
4.4.7.9 Albumin Binding Agents
A popular approach to blood pool Gd3+-based T1 agents for vascular imaging traditionally involves reversible non-covalent conjugation of the contrast agent with high molecular weight macromolecules like albumin.227–229 Serum albumin is one of the most popular macromolecular binding targets in vivo owing to its abundance in blood and its reversible binding characteristics to a wide variety of biomolecules. Non-covalent conjugation of a Gd3+ complex to albumin increases the “effective” concentration of the agent and results in extended “half-life” of the compound in the blood, enabling imaging of multiple vascular regions after a single injection of agent.230 One could envision an analogous improvement in CEST sensitivity and significant changes in CEST by reversible binding of a PARACEST agent with albumin. To test this hypothesis, Ali et al. used the o-benzyl functionality well-known to impart high binding affinity for albumin,228,231 as the design basis for an albumin binding PARACEST agent.232 They designed two DOTA-based tetraamide derivatives (64 and 65), either di- or tetra-substituted with the o-benzyl functionality.
The Gd3+ complexes of both the ligands show considerable affinity for site II of HSA (Human Serum Albumin) with binding constants of 3.14 × 10⁴ M−1 for Gd3+-64 and 1.04 × 10⁴ M−1 for Gd3+-65 and very poor affinity for site 1.232 They exhibited a modest ~two-fold increase in relaxivity upon binding to HSA (smaller than most other HSA binding T1 agents), consistent with relatively slow water exchange in typical GdDOTA-tetraamide complexes. Working with the more soluble di-substituted Eu3+-64 complex, the authors found no change in the CEST properties of the complex upon binding with HSA (Figure 41). τm values determined from fitting the CEST spectra to Bloch equations indicated a two-fold increase in water exchange kinetics upon albumin binding. While there is still a need to address the sensitivity of these albumin binding PARACEST agents, the fact that there is very little effect on the CEST properties of these Eu3+ complexes upon albumin binding makes them potentially useful as vascular imaging agents.230
Figure 41.

(a) The CEST spectra of a 0.75 mM solution of Eu3+-64 in phosphate-buffered saline (PBS) recorded in the absence (blue) and presence (red) of 0.75 mM HSA. CEST spectroscopy conditions (400 MHz, 298 K): irradiation time = 6 s, irradiation power = 19 μT. (b) Phantom images of a 20 mM solution of Eu3+-64 in the absence (top row) and presence (bottom row) of 5 % HSA. (a) and (d): off-resonance images with irradiation at -54 ppm, (b) and (e): on-resonance images with irradiation at +54 ppm, (c) and (f): CEST difference images. CEST MR imaging conditions (4.7 T, 298 K): irradiation time = 6 s, irradiation power = 19 μT. Reprinted from reference 232, Copyright (2007), with permission from Elsevier.232
4.4.8 Peptide-Based PARACEST Agents
Peptide-based targeting vectors are increasingly becoming popular for therapeutic and diagnostic applications and a large number of DOTA-peptide conjugates have been synthesized and successfully used for targeted MRI and nuclear medicine applications.233–234 In addition to the development of molecular and enzyme specific responsive agents, an entirely new class of PARACEST imaging agents is beginning to emerge. These new PARACEST agents composed of oligopeptide-based systems offer an attractive alternative to the design of biocompatible contrast agents. An interesting array of oligopeptide-derivatized DOTA-tetraamide ligands (57, 66–75) was recently reported by Bartha et al. to identify new PARACEST complexes of different Ln3+ ions as targeting vectors.235–237 While Eu3+-based PARACEST agents have been most widely studied, Wojciechowski et al. ventured into other Ln3+ ions with an intention to discovering new Ln3+-based PARACEST agents. They reported that the different Ln3+ complexes of the oligopeptide derivatives show different CEST effects owing to their different water exchange kinetics.235
In order to understand the effects of varying the amino acid side chains on the CEST properties of these oligopeptide derivatized ligands, Suchy et al. conceptualized a new series of ligands by changing one amino acid from their original series of dipeptide-based ligands. By using ligand 57 as the basis for comparison, owing to the large CEST effect of its Eu3+-bound water protons and favorable temperature dependent CEST properties,194 they synthesized ligands 70 and 71 by replacing amino acid phenylalanine with tyrosine and tryptophan respectively. Interestingly, while the tyrosine-based Eu3+ derivative retained a similar CEST effect as Eu3+-57 (Figure 42a), the corresponding tryptophan derivative did not (Figure 42b).236
Figure 42.


CEST spectra of 10 mM aqueous solutions of Eu3+-70 (a) and Eu3+-71 (b). CEST spectroscopy conditions (9.4 T, 311 K, pH 7): irradiation time = 10 s, irradiation power = 14 μT. Reprinted from reference 236, Copyright (2007), with permission from Elsevier.236
In another report, Suchy et al. synthesized a new ligand to alter the in vivo biodistribution of their targeted oligopeptide derivatives.237 They conjugated ligand 57 to a cell-penetrating peptide, a cystamine derivative, with the expectation that the disulfide bond when cleaved in a reductive intracellular environment may result in trapping the agent within the cell. The CEST properties of the neutral complex Eu3+-75 compares favorably with its anionic precursor, Eu3+-57, thus providing a new methodology for advanced PARACEST agents with favorable in vivo properties.
4.4.9 Improving the Sensitivity of PARACEST Agents
Like other MR imaging agents, an intrinsic limitation of small molecule PARACEST agents is sensitivity. The lowest detection limit reported for a low molecular weight PARACEST agent gave a 5% decrease in water signal intensity using a concentration of 0.5 mM agent.238 The usual injected dose of clinical Gd3+-agents is 0.1 mM/kg, but for MR angiography, doses up to 0.4 mM/kg are used. This translates to peak blood Gd3+ concentrations in the low mM range.239–240 Preliminary data suggest that the concentration requirements for PARACEST agents for in vivo experiments are similar to those of the Gd3+-based T1 contrast agents currently in use. In vitro experiments of several Eu3+-DOTA tetraamide PARACEST agents in plasma were shown to have easily detectable CEST effect in this concentration range (for example 8.9 % decrease in bulk water intensity was measured for complex Eu3+-47 in 1 mM solution at 20°C, with 5 s irradiation time and B1 = 14.1 μT).138 Theoretical considerations also suggest that the detection limit of a single PARACEST exchanging species with optimal water exchange rate, chemical shift and relaxation properties should be comparable to a single Gd3+-based T1 agent.67,241 Nonetheless, molecular imaging often requires detection of biomarkers present at extremely low concentrations; so there is clearly a need for the development of PARACEST contrast agents with enhanced sensitivity and improved targeting abilities.
One approach to increase the sensitivity of CEST agents, demonstrated by Goffeney et al. for DIACEST agents, involves increasing the number of exchangeable proton sites per CEST molecule (Section 4.2.2).78 Using cationic polymers (50–800 kD MW), with a large number of amide and amine protons sites, they established that a CEST effect of almost 50% could be attainable with micromolar concentrations of the agent. In an attempt to improve on the small Δω values of diamagnetic CEST macromolecules, Aime et al. exploited the formation of supramolecular adducts between the cationic polymers used by van Zijl et al. and a shift reagent.238 Lanthanides have a long history as frequency shift reagents for a variety of NMR applications.242–244 Hence, including a shift reagent capable of forming an adduct with a macromolecular target having multiple exchange sites could potentially increase Δω substantially without eliminating the advantages offered by polymerization (higher number of exchanging sites). It is also expected that exchange kinetics of the shift reagent need not meet the slow exchange condition for CEST. Aime et al. reported the use of Tm3+-12, a widely-used shift reagent for aqueous cations, and poly-L-arginine (PLR) as the macromolecular target.238 PLR has two potentially different CEST-active sites, the amide protons of the backbone and the guanidine protons of the side-chains. In the absence of Tm3+-12, PLR has a CEST effect from the amide backbone protons (depending upon pH) but none from the guanidine protons. This is a classic example of a situation where kex > Δω for the guanidine protons. Addition of Tm3+-12 to PLR results in the formation of a tightly associated ion-pair and the appearance of a CEST peak at 30 ppm (Figure 43). In addition to the dipolar interaction of the complex with the polymer leading to an increase in Δω, it is probable that the exchange rate of the guanidyl protons with the solvent is also affected by the tight association with the complex. Regardless of mechanism, the CEST requirement, Δω > kex is then met and CEST is observed. Using this binary system, it was found that only micromolar concentrations of polymer (1.7 μM) and shift reagent (30 μM) were required to produce a 5% decrease in water signal intensity.
Figure 43.

CEST spectra of a 0.1 mM aqueous solution of PLR in the presence (■) and absence (□) of 2.0 mM Tm3+-12. CEST spectroscopy conditions (7.05 T, 312 K, pH 7.4): irradiation time = 2 s, irradiation power = 25 μT. Reference 238. Copyright (2003); Reprinted with permission of John Wiley & Sons, Inc.238
Greater improvements in sensitivity can also be made by maximizing the number of PARACEST exchanging species at the targeted site. Low molecular weight PARACEST agents typically contain between one and four exchange sites per molecule, thereby requiring a high concentration of the agent to produce significant contrast. By increasing the number of metal centers, significant enhancement in contrast is expected. Multiple approaches to resolve this strategy have been identified, involving conjugation of the PARACEST agents to high-molecular weight scaffolds like polymers or dendrimers,241,245 or encapsulation of a large number of metal centers in the inner core of high-molecular weight systems like liposomes, 246 or apoferritin.247
Aime and co-workers pioneered the effort in this field with their work on liposome-based PARACEST agents, which they termed as LIPOCEST agents.9,246 Liposomes (Figure 44), discovered by Bangham et al. in 1961,248 are tiny nano-sized bilayer vesicles with an aqueous core surrounded by phospholipid bilayers. They have attracted widespread attention mainly as drug carriers, particles for targeting, and as contrast agents for MRI.9,249 One of the advantages of using liposomes as carriers for contrast agents comes from the fact that thousands of imaging reporter molecules can be encapsulated within the aqueous core of a single liposome, significantly increasing the local concentration of these agents. These biocompatible nano-vesicles have a large number of water molecules in their inner core that are in relatively slow exchange with bulk water. Aime and co-workers first reported the use of a new class of contrast agent composed of liposomes loaded with a paramagnetic lanthanide shift reagent (SR).246 Upon entrapment of a SR within the liposome, two signals are observed in the 1H NMR spectrum, one from the exterior bulk water and another from the water within the liposome core. The resonance of the water protons inside the liposomes is shifted from that of the external bulk water to an extent that depends mainly on the shift properties of the trapped reagent. In this case, the rate of water exchange between a coordinated water molecule on the SR and the entrapped water molecules must be in the intermediate-to-fast exchange regime so that all water molecules inside the liposome experience the paramagnetic effects of the SR as quickly as possible. Therefore, the CEST requirement (Δω ≫ kex) in this case must be met by the exchange rate of water or protons across the lipid bilayer.
Figure 44.
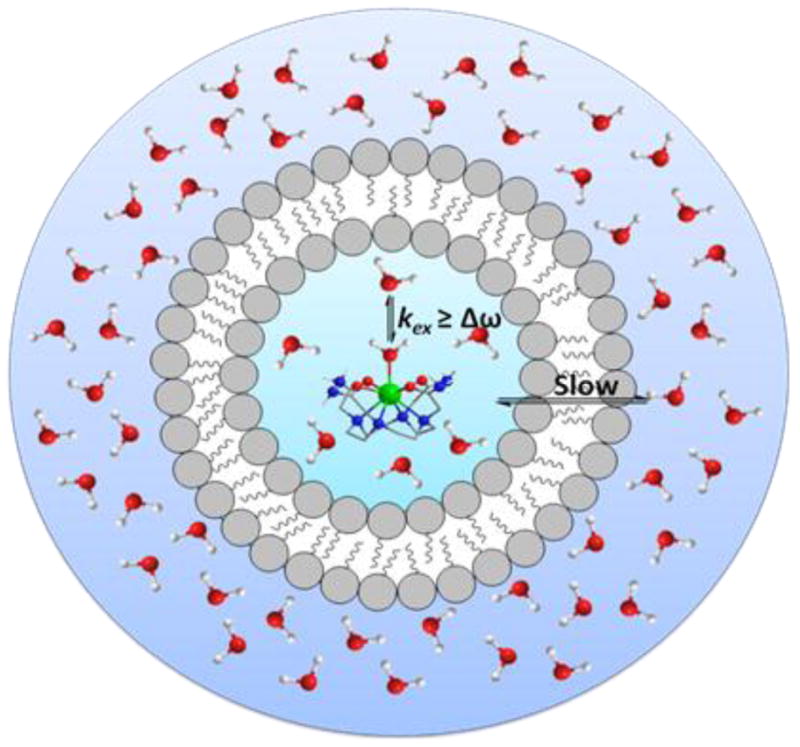
Illustration of a liposome depicting the slow exchange between the outer and inner-core water molecules. The shift reagent is in intermediate-to-fast exchange with all inner-core water molecules.
Liposomes containing 0.1 M Tm3+-76 results in a shift of the entrapped water resonance to 3.2 ppm (Δintralipo), which is well separated from the bulk resonance (Figure 45).246 Phantom images of the LIPOCEST particles at different concentrations showed that 90 pM (liposome concentration) could be detected by CEST imaging, a tremendous improvement over traditional small molecule PARACEST agents. Thus, it was proposed that by using different types of paramagnetic shift agents, one should be able to prepare LIPOCEST agents with different CEST activation frequencies, giving rise to highly sensitive, “multi-frequency” CEST agents. 166,246 Nevertheless, the relatively small chemical shift of the intraliposomal water resonance (similar in magnitude to typical DIACEST compounds) remains a significant disadvantage for the in vivo use of these first generation LIPOCEST agents. The chemical shift of the intraliposomal water resonance results from the sum of two contributions (Eq 54).
Figure 45.

CEST spectrum of a 2.88 nM concentration of liposomes entrapping 0.1 M Tm3+-76. CEST spectroscopy conditions (14.1 T, 312 K): irradiation time = 3 s, irradiation power = 12 μT. (Inset): CEST images of a phantom consisting of eight capillaries containing suspensions of the LIPOCEST agent in the concentration range 22.5–2880 pm entrapping Tm3+-76. CEST MR imaging conditions (7 T, 312 K): irradiation time = 3 s, irradiation power = 12 μT. Reference 246. Copyright (2003); Reprinted with permission of John Wiley & Sons, Inc.246
| (54) |
For fast exchanging systems, the dipolar contribution ( ) is an average of the chemical shifts of the SR-bound water and bulk water; so it is limited by the amount of SR that can be encapsulated within the liposomes. Under optimal conditions, the magnitude of contribution amounts to no more than ± 4 ppm. The bulk magnetic susceptibility (BMS) contribution that arises from the alignment of the magnetic moment of the compartmentalized SR to the external static field, negligible for a spherical liposome, can be significantly increased by changing the alignment of the magnetic moment of the SR center with the external magnetic field8 by entrapping it in a non-spherical compartment.172 Non-spherical liposomes are most easily prepared by shrinking spherical liposomes under hyper-osmotic conditions.250–251 In addition to the above mentioned two factors, Δintralipo is also governed by both the magnetic moment (μeff) of the Ln3+ and orientation of the SR within the liposome, which in turn can be modulated by incorporating amphiphilic paramagnetic complexes within the liposome membrane. A significant Δintralipo shift of the bulk water resonance was observed at ~18 ppm for a non-spherical liposome that included Tm3+-77 as part of the lipid preparation (becomes part of the membrane) with Tm3+-78 in the inner core.172 An alternate non-spherical liposome with Dy3+-77 incorporated into the membrane and Dy3+-78 encapsulated in the inner core resulted in a Δintralipo shift of −45 ppm (Figure 46). This result provides a good insight into the dependence of the magnitude and sign of Δintralipo on the magnetic moment of different lanthanide ions.
Figure 46.

CEST spectra obtained for the two osmotically shrunken LIPOCEST probes encapsulating the hydrophilic shift reagents Tm3+-78 (■) or Dy3+-78 (○) and incorporating the amphiphilic shift reagents Tm3+-77 or Dy3+-77 respectively. CEST spectroscopy conditions (7 T, 312 K): irradiation time = 2 s, irradiation power = 6 μT. Reference 172. Copyright (2007); Reprinted with permission of John Wiley & Sons, Inc.172
Deli Castelli et al. also demonstrated that the sign and magnitude of Δintralipo are not only controlled by the magnetic moment of the paramagnetic metal ion, but it also depends on the orientation of the liposomes with respect to the B1. This can be modulated by using suitable ligands where the conformation of the ligand pendant arms and their mode of coordination change the orientation of the vesicles.252 When the non-spherical liposome is parallel to the axis of the magnetic field, the Δintralipo shifts downfield and vice-versa as depicted in Figure 47. It must be noted that while the three lanthanide complexes, Tm3+-78, Dy3+-78 and Gd3+-78, show positive, negative and null shifts respectively when encapsulated in spherical liposomes, non-spherical liposome preparations with the same complexes show random trends as a result of the orientation of the liposomes with respect to B1. A series of amphiphiles based on the Tm3+, Dy3+ and Gd3+ complexes with ligands 79–83 incorporated in the liposome membrane with the corresponding Ln3+-78 entrapped in the inner core, reveals that the orientation of the non-spherical liposome depends on the type of coordination cage provided by the ligand (open-chain or macrocyclic) and the identity of the hydrophobic side-chains (Table 4).
Figure 47.

A schematic representation of the preferred orientation of the osmotically shrunken liposomes (assumed to be discoidal) in the static field B0 according to their magnetic susceptibility anisotropy (white circles: paramagnetic entrapped species; red circles: incorporated paramagnetic compound). Δχ represents the magnetic susceptibility tensor of the vesicle components. Reproduced with permission from reference 252, Copyright 2008 American Chemical Society.252
Table 4.
Summary of the LIPOCEST compounds and the shifts associated with the different agents.
| Ln3+ | Δintralipo ppm | Reference |
|---|---|---|
| First generation spherical LIPOCEST agent | ||
| Tm3+-76 | 3.2 | 84 |
| Tm3+-84 | 6.1 | 171 |
| Spherical LIPOCEST agents Δintralipo dependence on the type of Ln3+ ion used in the shift reagent | ||
| Tm3+-78 | 3.5 | 252 |
| Gd3+-78 | 0 | 252 |
| Dy3+-78 | −4.0 | 252 |
| First generation shrunken LIPOCEST agents Δintralipo dependence on the type of Ln3+ ion used in the shift reagent | ||
| Tm3+-77 | 18 | 172 |
| Dy3+-77 | −45 | 172 |
| Shrunken LIPOCEST agents Δintralipo dependence on the type of macrocyclic cage, ligand sidearms and Ln3+ ion used | ||
| Tm3+-78 | 10 | 252 |
| Gd3+-78 | 7.2 | 252 |
| Dy3+-78 | 14.1 | 252 |
| Tm3+-79 | −18.3 | 252 |
| Dy3+-79 | 15.7 | 252 |
| Gd3+-79 | 5.0 | 252 |
| Tm3+-80 | 19.0 | 252 |
| Dy3+-80 | −45 | 252 |
| Gd3+-80 | 13.9 | 252 |
| Tm3+-81 | 12.0 | 252 |
| Tm3+-82 | −31.0 | 252 |
| Tm3+-83 | 10.5 | 252 |
| Shrunken LIPOCEST agents Δintralipo dependence on the concentration of the metal | ||
| Tm3+-78 | 15.2 | 171 |
| Tm3+-84 | 21.3 | 171 |
| Tm3+-85 | 28.2 | 171 |
A recent comparison of mono-, di- and tri-nuclear Tm3+ complexes revealed that the induced shift of the inner core water protons is due not only to a BMS contribution plus the magnetic properties of the encapsulated SR, but it also depends on the concentration of the intraliposomal shift reagents. 171 The degree of the observed shift resulting from the binuclear complex Tm3+-84 is twice that of its mononuclear counterpart Tm3+-78 since the effective concentration of the metal in the binuclear complex is more that its mononuclear counterpart. However, the tri-nuclear Tm3+-85 complex did not follow this same trend because of its different coordination environment. This effect is due to the fact that the trinuclear complex, with the presence of the linear chelating groups between the macrocyclic cages, has a more flexible coordinating geometry than the macrocyclic DOTA type rigid coordination environment. Thus, the coordinating environment of the macrocyclic cage aligns the paramagnetic contact shift field of the lanthanide in an optimal manner to shift the water resonance more effectively than the linear coordination environment (Figure 48).
Figure 48.

1H-NMR (14.1 T, 298 K) spectra of LIPOCEST suspensions entrapping (A) Tm3+-78, (B) Tm3+–84, or (C) Tm3+ –85 and incorporating Tm3+-77 in the membrane. Reference 171 - Reproduced by permission of the Royal Society of Chemistry.171
When the osmotic pressure of a suspension of liposomes made of Tm3+-80 and encapsulating Tm3+-78 is increased, the liposome loses its spherical nature and shifts Δintralipo away from the bulk water until an isotonic point is reached (Figure 49).253 Further, varying the concentration of the incorporated Tm3+-80 complex, while keeping the concentration of Tm 3+-78 constant results in a linear relationship with Δintralipo and saturation transfer ratio. On the other hand, when the concentration of encapsulated Tm3+-78 was changed with respect to the Tm3+-80 there was an opposite trend in both the shift of the intraliposomal water resonance and saturation transfer ratio. The concentration of Tm3+-78 was found to regulate the osmotic pressure of the solution which, in turn, governs the shape of the liposome. As the concentration of Tm3+-78 is increased, the osmotic stress felt by the liposomes gradually decreases and they tend to become more spherical.253
Figure 49.

1H NMR spectra (14 T, 298 K) of a suspension of liposomes encapsulating Tm3+-78 (40 mM) and suspended in a buffered medium (pH 7.4) with increasing osmolarity: a) 40, b) 80, c) 110, d) 160, e) 230, f) 300 (isotonic), and g) 600 mOsm. Reference 253. Copyright (2009); Reprinted with permission of John Wiley & Sons, Inc.253
In another paper, Terreno et al. reported the first ex vivo detection of two LIPOCEST agents differing in their Δintralipo when co-injected in the bovine muscle.254 The spherical liposome with entrapped Tm3+-78 complex shows Δintralipo at +3 ppm, while the non-spherical Tm3+-80 agent shows a corresponding peak at +18 ppm. After injection of these liposomal preparations into bovine muscle, each LIPOCEST agent could be imaged independent of the other agent by applying the appropriate frequency selective presaturation pulse identified for agent. An analytical model for the size dependence of the liposomes on the magnetization transfer rate (MTR) for spherical liposomes containing Tm3+-2 was reported by Zhao et al.255 Three sizes of spherical liposomes containing the same concentration of Tm3+-2 showed a difference in the MTRasym (Figure 50) with the Δintralipo increasing as the liposome size decreases.
Figure 50.

MTRasy vs presaturation frequency offset for three liposome samples of different sizes, each containing 200 mM Tm3+-2. Inset is a CEST difference image of the three samples and PBS buffer: from left to right: 99 nm, 199 nm, 536 nm, buffer. Reproduced with permission from reference 255, Copyright 2008 American Chemical Society.255
Langereis et al. reported the first temperature sensitive non-spherical LIPOCEST agent and 19F contrast agent as a dual contrast agent and potential carrier system for MRI guided drug delivery.256 At room temperature, the dual contrast agent displays the expected CEST effect due to the entrapped shift reagent Tm3+-78. Interestingly, two different CEST peaks are observed in the CEST spectrum of the agent at +11 ppm and −17 ppm, presumably due to two different orientations of the non-spherical liposomes with respect to the magnetic field. Upon increasing the temperature to 315 K, the liposomal melting temperature, the shift reagent was released from the inner core and the CEST signal consequently disappeared (Figure 51). As anticipated, the encapsulated 19F reporter molecule (NH4PF6) showed the opposite behavior. At room temperature with the paramagnetic shift reagent and the 19F reporter molecule entrapped in the inner core of the liposome, the 19F NMR signal was too broad to be detected. Upon warming the liposome to its melting temperature near 315 K, a sharp increase in 19F intensity was observed with concomitant loss of the CEST signal. Phantom MRI images of the temperature variation of the CEST effect and 19F fluorescence intensity are shown in Figure 52. This example illustrates the basic principles behind image-guided drug delivery.
Figure 51.

CEST spectra of liposomes containing Tm3+-78 and NH4PF6 at 298 K ( ) at 315 K (■). CEST spectroscopy conditions (7 T): irradiation power = 4.5 μT. Reproduced with permission from reference 256, Copyright 2008 American Chemical Society.256
Figure 52.

(Top): The DSC thermogram shows the melting temperature of the lipid membrane. (Bottom): 1H LIPOCEST and 19F MR images of the temperature-sensitive liposomes. The CEST signal (color scale in percent) vanished at T ≥ 311 K while the fluorine signal appeared at 315 K. CEST MR imaging conditions (3 T): irradiation power = 3.6 μT. Reproduced with permission from reference 256, Copyright 2008 American Chemical Society.256
Apo-ferritin, a naturally occurring nano-sized carrier, offers similar advantages as liposomes in the transport of a large number of paramagnetic metal centers trapped in a compartment along with limited number of water molecules.9,247 An earlier report demonstrated that a Gd3+-based T1 agent entrapped within the inner core of apo-ferritin has a substantially higher water relaxivity (80 mM−1s−1) compared to the agent in water.257 It was hypothesized that such a dramatic increase in relaxivity must reflect catalytic prototropic exchange of water protons by residues on the inner surface of apo-ferritin. This catalytic effect on water exchange could prove extremely beneficial to PARACEST agents whose CEST efficiency is highly dependent on the rate of water exchange. To test this hypothesis, Vasalatiy, et al. encapsulated Eu3+-16, a slow water-exchange system, within the negatively charged inner core of apo-ferritin and found that the CEST signal from Eu3+-16 completely disappeared upon encapsulation (Figure 53).247 Further studies showed that the water and/or proton exchange rate was significantly enhanced when the complex is trapped within the protein. Indeed these studies provide sufficient proof that (a) the water exchange process across the ferritin pores is extremely fast and (b) the exchange process between the Eu3+-bound water molecule and the water within the core is catalyzed by the residues on the inner surface of the protein core. While this catalytic increase in water exchange prove beneficial to the Gd3+-based T1 agents,9 the need for slow exchange kinetics make these systems unlikely carriers for PARACEST agents.
Figure 53.

CEST spectra of a 1 mM solution of Eu3+-16 water and entrapped within the ferritin core. CEST spectroscopy conditions (4.7 T, pH = 7, 298 K): irradiation time = 3 s, irradiation power = 1020 Hz. Reference 247. Copyright (2006); Reprinted with permission of John Wiley & Sons, Inc.247
As an alternative to nano-sized PARACEST agents involving liposomes and apo-ferritin, Winter and co-workers successfully demonstrated the use of paramagnetic CEST agents conjugated to perfluorocarbon encapsulated nanoparticles for the detection of fibrin. 258 They used a methoxy-benzyl substituted DOTA-tetraamide derivative with a lipophilic tail for incorporation on a perfluorocarbon nanoparticle, Eu3+-86. The PARACEST nanoparticle emulsion, with a diameter of 294 nm and a Eu3+ concentration of 2.5 mM, shows significant CEST at +52 ppm, while control nanoparticles without the attached PARACEST agent showed no CEST. Two-chambered phantom images of the PARACEST vs control nanoparticles provided further proof of the saturation transfer properties of the PARACEST agent on the exterior surface of the nanoparticles, with over 10% change in signal intensity observed for the bulk water. Winter et al. also demonstrated that these lipid-encapsulated perfluorocarbon nanoparticles, similar to their earlier report with Gd3+-based contrast agents,259 are capable of targeting fibrin. Clot images treated with both control and PARACEST nanoparticles reveal that while the clots themselves display a uniform hypo-intensity with respect to the surrounding buffer, the surface of the clots could be clearly distinguished in the PARACEST treated images, thereby providing the first example of a targeted PARACEST agent for detection of fibrin (Figure 54).
Figure 54.


(a): Images of a two-chambered phantom containing PARACEST nanoparticles or control nanoparticles with no PARACEST agent in the inner chamber and PBS in the outer chamber. Top row: off-resonance images at −52 ppm; Bottom row: CEST difference images. (b): Images of fibrin targeted PARACEST vs control nanoparticles bound to plasma clots. Top row: off-resonance images at −52 ppm; Bottom row: CEST difference images indicating significant signal enhancement on the surface of the clot in the PARACEST treated nanoparticles, while no change is observed in the control nanoparticles. Reference 258. Copyright (2006); Reprinted with permission of John Wiley & Sons, Inc.258
While the use of physical aggregates like liposomes and other naturally occurring nano-sized carriers is very attractive, shear force and other environmental effects such as high-dilution, temperature and pressure make them vulnerable in vivo.260 An alternative approach to enhance CEST sensitivity would be to conjugate PARACEST agents by covalent modification to scaffolds such as dendrimers or polymers. Numerous studies of Gd3+-based T1 agents conjugated to dendrimers have revealed that they are excellent molecular substrates to attach multiple metal centers with their symmetric, nano-sized, well-defined and highly branched architectures.229 Taking advantage of this fact, Pikkemaat et al. designed a Yb3+ complex with exchangeable amide protons (CEST effect observed at −15 to −20 ppm) conjugated to a symmetrical poly(propylene imine) dendrimer to serve as PARACEST agents.245 In addition, the local pH of these agents can be modulated by the tertiary amines of the dendritic core of the poly(propylene imine) dendrimers, making them attractive as pH-responsive contrast agents. As expected, the G3 (3rd generation) dendrimer with 16 end-terminated Yb 3+-17-modified groups (structure 89) is 16 times more sensitive than its mono-nuclear counterpart Yb 3+-87, while the G1 dendrimer (1st generation) is 4 times more sensitive (structure 88). All three compounds are pH sensitive with the maximum changes in CEST observed over the physiological pH range, 6.5 to 7.5 (Figure 55a). The mono-nuclear compound Yb3+-87 shows a maximum CEST effect at a pH of 7.5, while the G3 dendrimer (structure 89) shows a maximum at pH 6.5; this difference can be attributed to the fact that the presence of multiple tertiary amino groups create a more basic micro-environment which in turn could result in larger exchange rates and also shifts the pH profile (Figure 55b). While these poly-nuclear dendrimer-based PARACEST agents offer only limited increase in sensitivity over the supramolecular adduct designed by Aime (millimolar for small dendrimers versus low micromolar range for LIPOCEST), fine-tuning of the dendritic core and increasing the size of the framework remains an attractive possibility.
Figure 55.

(a): CEST spectra of a 6 mM aqueous solution of the G3 PARACEST agent 89 at three different pH values. CEST spectroscopy conditions (7 T, 310 K): irradiation time = 2 s, irradiation power = 22 μT. (b): Phantom images of aqueous solutions containing the monomer Yb 3+-87 (13 mM, top row) and G3 dendrimer Yb3+-89 (0.8 mM, bottom row) at pH values of 3.2, 6.5 and 7.5, respectively. CEST MR imaging conditions (3 T and 298 K): irradiation time = 2 s, irradiation power = 10.5 μT). Reference 245. Copyright (2007); Reprinted with permission of John Wiley & Sons, Inc.245
Like dendrimers, polymer-based imaging and therapeutic probes have seen significant advances in the last decade for the diagnosis and treatment of various diseases.260–262 The combination of well-defined chemical compositions, increasing sophistication in polymer chemistry and ease of chemical modification has resulted in an increased interest in polymeric imaging probes. In an effort to use this technology to improve the efficiency and detection limit of PARACEST agents, Wu et al. designed Eu3+-based PARACEST agents with one polymerizable side-chain moiety, 90 and 91.241 Free radical polymerization of the monomer with different percentages of the initiator yielded polymers, 92 and 93, of differing molecular weight. It was shown that while the CEST efficiency on a per Eu3+ basis remains essentially the same in the polymer as that of the corresponding monomer, the molecular sensitivity was of course significantly enhanced. With a 5% change in water signal intensity set as a lower limit for CEST detection, it was found that the longer polymers exhibit detection limits in the low micromolar range, approaching the levels required for targeted molecular imaging applications (Figure 56).
Figure 56.

(a) CEST spectra of 30 mM aqueous solutions of Eu3+-91 (red) and Eu 3+-93 (2% initiator concentration, blue). CEST spectroscopy conditions (11.75 T, 298 K): irradiation time = 4 s, irradiation power = 14.1 μT. (Bottom) CEST images of different concentrations of Eu3+-93 and Eu3+-91 phantoms at 9.4 T, 292 K. The agent concentrations (mM) are given for monomer, M, and polymers, P, in (b), and W refers to water as control. (c) Colored CEST difference images. CEST MR imaging conditions (9.4 T, 298 K): irradiation time = 4 s, irradiation power = 14 μT. Reproduced with permission from reference 241, Copyright 2008 American Chemical Society.241
While all the examples discussed in this section clearly demonstrate the significant improvements to sensitivity of PARACEST agents, further optimization of the chemistry and other parameters is needed to fully realize the promise of CEST-based agents for in vivo studies.
4.4.10 Synthesis of DOTA-Tetraamides
Given that the vast majority of all PARACEST agents reported to date have been derived from DOTA-tetraamide ligands, a brief review of the synthetic methods to prepare these ligands is in order. Tetraamide derivatives of DOTA are traditionally obtained by the alkylation of cyclen (1,4,7,10-tetraazacyclododecane) with readily available bromo- or chloroacetyl amides in a dipolar aprotic solvent such as acetonitrile or DMF in the presence of a base such as K2CO3 or iPr2NEt (Scheme 4).42,138,140,145,263–265 This method is quite general, and gives reasonable yields for both primary and secondary amines with a wide variety of functional groups. In addition, it can be extended to the synthesis of DOTA amides with mixed sidearms using selective protection-alkyation-deprotection-alkylation steps starting from cyclen.266–267 This route was also adapted for the synthesis of peptide-based DOTA tetraamides. Utilizing this strategy, a large library of ligands and their subsequent lanthanide complexes were produced in excellent yields.235–237
Scheme 4.

Synthesis of DOTA tetraamide ligands by the alkylation of cyclen
Another approach to amide derivatives of DOTA involves the activation and conversion of the carboxylate groups of DOTA into amides using a coupling agent such as BOP or HBTU. This method is particularly useful in cases where haloacetyl amides are hard to synthesize or in cases where quarternization of tertiary amines is a significant problem. (Scheme 5).173,268
Scheme 5.

Synthesis of DOTA tetraamide ligands by activating DOTA
A new solid-phase route to DOTA-peptide based ligands has been developed that utilizes an interesting DOTA derivative functionalized with a NH2-group on the alpha carbon of one of the acetate sidearms. The synthesis starts with the DO3A-derivative attached to a Wang resin through one of the carboxylate arms.269 A peptide chain was then grown from the amino group of the DOTA unit using standard SPPS chemistry followed by cleavage from the resin using TFA. Finally, Tm3+-complexation was performed in water at pH 5 to 7.5 (Scheme 6). The structure of the ligand was specifically designed so that the amide group on the acetate sidearm would be positioned in the proximity of the central Tm3+-ion in the final complex in order to achieve greater Ln3+-induced shift of the amide proton. This derivative was then used to detect enzyme activity as discussed in Section 4.4.7.8.
Scheme 6.

Solid phase synthesis of peptidyl amido DOTA derivatives
The Ln3+-complexes of neutral DOTA tetraamides are usually prepared by reaction of the ligand with equivalent amount of Ln3+-salts (anhydrous triflates are commonly used) in acetonitrile or methanol under anhydrous conditions.145 Due to slow formation rates, the complexation is often run for several days at 40 to 50°C. Ln3+-complexes of anionic tetraamides such as 51 are usually synthesized in water while maintaining the pH between 5–7.42,125,140,145,173,263–265
The synthesis and CEST properties of a bifunctional chelator for PARACEST agents has also been reported.270 Here, the ligand has an aromatic nitro group that can be reduced and converted to an active isothiocyanato group for later bioconjugation (structure 94). The Eu3+ complex of ligand 94 adopts predominantly (90%) the SAP geometry as reported by 1H NMR. Interestingly, CEST spectra of this nitro-derivative showed that alpha substitution on one side arm also impacts water exchange in the resulting Eu3+ complex. Water exchange was found to be slower in the bifunctional derivative when compared to the parent complex, 16.
4.4.11 In vivo Studies of PARACEST Agents
4.4.11.1 Thermodynamic and Kinetic Characteristics of the Ln3+-DOTA Tetraamide Complexes
Since PARACEST agents are ultimately intended for in vivo applications, their tolerance, biodistribution, toxicity and metal ion release characteristics must be critically evaluated. The stability of a metal complex is usually described by two constants, a thermodynamic stability constant and a kinetic rate constant that characterizes dissociation of the complex into a “free” ligand and metal ion. The latter is referred to as kinetic inertness. Since the amount of metal ion released from the complex is largely determined by its kinetic inertness, for in vivo applications this is the more important factor and the in vivo safety of Ln3+-complexes should be judged by their resistance towards dissociation. 271 The ligand protonation constants and thermodynamic stabilities of several Ln3+-DOTA tetraamide complexes have been studied in detail by pH-potentiometry.264,272–276 In the parent ligand DOTA, the negatively charged acetate sidearms stabilize the protonated macrocyclic nitrogen atoms through hydrogen bonding interactions and thus the first and second pKa’s of the ligand are relatively high.277 The neutral amide functionality is not capable of forming analogous hydrogen bonds with the protonated nitrogen atoms and therefore, the first two pKa values of all DOTA tetraamide ligands is about 3 logK units lower than those of DOTA (Table 5).275
Table 5.
Protonation constants of DOTA tetraamide ligands.
The total basicity (the sum of pKa values) of the tetraamides is also significantly lower than that of DOTA and, for this reason, the thermodynamic stability of Ln3+-DOTA tetraamides is about ten orders of magnitude less than that of the corresponding DOTA complexes. There is only a slight variation in the stability constants with decreasing ionic size of the lanthanide ion along the series. The stabilities increase for the lighter lanthanides and then remain almost constant for the heavier ones with a small decrease seen at the very end of the series (Table 6). For each ligand, the Eu3+ complex appears to be the most thermodynamically stable of all lanthanide complexes, likely reflecting the best match between the size of coordination cavity of the ligand and this metal ion. It is worth noting that unlike DOTA, the stability of the Cu2+ and Zn2+ DOTA-tetraamide complexes is somewhat higher than that of the corresponding Ln3+-complexes. This may be of concern for in vivo applications since in this case the displacement of the Ln3+-ion by these endogenous metal ions is thermodynamically favorable. However, it has been shown that endogenous metal ions do not play a role in dissociation of Ln3+-chelates of DOTA and other DOTA-like ligands based on 12-membered macrocyclic tetra-amines (cyclen and pyclen) in vivo. In fact, the dominant pathway for release of metal ions in vivo for macrocyclic Ln3+-chelates involves the acid-catalyzed dissociation and the acid independent spontaneous dissociation of the complex. 278
Table 6.
Thermodynamic stability constants of various DOTA tetraamide complexes
| Metal | Species | 17274 | 18274 | 51275 | 2319 |
|---|---|---|---|---|---|
| Cu2+ | ML | 14.50 | 14.61 | 13.39 | 22.72 |
| Cu2+ | MHL | 4.38 | 3.78 | ||
| Cu2+ | MLH-1 | 8.41 | 8.78 | 10.54 | |
| Cu2+ | MLH-2 | 8.82 | 10.31 | ||
| Zn2+ | ML | 13.77 | 13.66 | 18.17 | |
| Zn2+ | MHL | 4.18 | |||
| Zn2+ | MLH-1 | 10.57 | 10.71 | 10.62 | |
| Ce3+ | ML | 11.93 | 12.68 | 13.02 | 23.4 |
| Nd3+ | ML | 12.40 | 13.08 | 14.45 | 23.0 |
| Eu3+ | ML | 13.80 | 13.67 | 14.84 | 23.5 |
| Gd3+ | ML | 13.12 | 13.54 | 14.54 | 24.7 |
| Dy3+ | ML | 13.57 | 13.84 | 14.37 | 24.8 |
| Tm3+ | ML | 13.46 | 14.08 | 24.4 | |
| Lu3+ | ML | 13.53 | 13.91 | 14.25 | 25.4 |
4.4.11.2 Formation and Dissociation Kinetics
The kinetic behavior, both formation and dissociation, of Ln3+-DOTA-tetraamides has been studied by UV-Vis spectrophotometry. Formation of the Ln3+-51 complexes is about 10-fold slower than that of the corresponding DOTA complexes. The formation reaction follows the same mechanism as the formation of DOTA complexes involving base-catalyzed deprotonation and rearrangement of a protonated intermediate in the rate determining step.275 The structure and stability of this intermediate has been studied in detail for DOTA complexes and it is now well established that the metal ion is coordinated to four oxygens of the acetate sidearms, two N-atoms of the macrocyclic ring and three water molecules.279–281 Although the structure of the intermediate complex has not been determined for Ln3+-51, the carboxylate groups in this case are located further away for the coordination cage, consistent with a lower stability of the intermediate. This in turn results in a slower rate of complex formation even though the basicity of the macrocyclic N atoms in 51 is significantly lower than those for 2.275
Interestingly, formation of Ln3+-complexes with neutral DOTA-tetraamides occurs considerably slower (about 2 to 3 order of magnitude) than that of the DOTA complexes and occurs through the direct reaction between the fully deprotonated ligand and the lanthanide ion (Table 7). The participation of mono and diprotonated species is negligible even at pH values where the concentration of the protonated ligand species is several orders of magnitude higher than that of the fully deprotonated ligand.276 The lack of a protonated intermediate is extremely surprising because the diprotonated complex Gd3+-H217 has been prepared and its structure in the solid state was determined.282 This X-ray structure shows that the Gd3+ ion is coordinated by four water molecules and four amide oxygens while two of the macrocyclic N atoms remain protonated. This may seem contradictory to the results of the kinetic measurements but one must realize that the existence or the crystallization of such a diprotonated intermediate does not necessarily imply that the formation of the final product occurs through this intermediate, rather, it can be a “dead-end” complex, which is not involved in the pathway leading to the final product.277
Table 7.
Formation rate constants (k0, M−1s−1) of Ln3+ DOTA tetraamide complexes
| Ligand | Ce3+ | Eu3+ | Yb3+ | Lu3+ |
|---|---|---|---|---|
| 17276 | 7.7×10³ | 2.7×10⁴ | 6.6×10³ | |
| 18274 | 3.0×10⁴ | 4.8×10⁴ | 6.5×10³ | |
| 51275,a | 4.6×10⁶ | 6.6×10⁶ | ||
| 2280,a | 3.5×10⁶ | 1.1×10⁷ | 4.1×10⁷ |
The rate constant refers to kOH characterizing the base catalyzed rearrangement of the protonated intermediate.
As already pointed out, the in vivo fate of a metal complex is largely dependent on its kinetic inertness. Considering the potential application of DOTA-tetraamide complexes as MRI agents, evaluation of their kinetic inertness is essential, especially in light of their low thermodynamic stability. Since Ln3+-chelates of DOTA-like ligands dissociate in vivo only by acid-catalyzed dissociation and acid-independent spontaneous dissociation, the endogenous metal ions (Cu2+ and Zn2+) do not affect the dissociation rates.278,280 The acid-catalyzed dissociation kinetics of some LnDOTA-tetraamides have been studied in strongly acid solutions, below pH 1 (Table 8).264,274–275 In this pH range, the complexes are thermodynamically unstable and the measurements could be performed in a reasonable amount of time. The kinetic data were collected in the presence of a large excess of acid and, under these pseudo first order conditions, the dissociation rates could be described by Eq 55.
Table 8.
Dissociation rate constants of Ln3+-DOTA tetraamide complexes.
| Ln3+ | K | 18274 | 51275 | 2 |
|---|---|---|---|---|
| Ce3+ | k0, s−1 | (1.1 0.1)×10−5 | - | not observed |
| Ce3+ | k1, M−1s−1 | (2.6 0.1)×10−5 | - | 8×10⁻⁴ 320,a |
| Eu3+ | k0, s−1 | (1.5 0.2)10−7 | 7.3×10⁻⁷ | not observed |
| Eu3+ | k1, M−1s−1 | (5.6 0.2)10−7 | 8.1×10⁻⁶ | 1.4×10⁻⁵ 280 |
| Gd3+ | k0, s−1 | - | - | 5×10⁻¹⁰ 280;<5×10⁻⁸ 321 |
| Gd3+ | k1, M−1s−1 | - | - | 2×10⁻⁵ 280;8.4×10⁻⁶ 321 |
Second order dependence on H+ ion concentration with a rate constant of 2.0 × 10⁻³ M−2s−1 was also observed.
| (55) |
The rates of dissociation were found to be linearly proportional to the acid concentration as described by Eq 56.
| (56) |
where k0 represents an acid-independent dissociation rate constant (spontaneous dissociation) and k1 represents acid-assisted dissociation of the protonated complex. This kinetic behavior is similar to that reported for the LnDOTA chelates and is consistent with a rapid formation of a monoprotonated intermediate with protonation of an amide oxygen as the initial step.280 Rearrangement of the protonated species transfers the proton from the acetate arm to a ring nitrogen atom and electrostatic repulsion between the protonated nitrogen and the metal ion results in the formation of an “out-of-basket” complex which then undergoes dissociation. A comparison of the k1 values reveals that Eu3+-51 dissociates about 15-fold faster than Eu3+-18, likely due to the fact that at this pH all four glycine carboxylates are protonated and proton transfer from the protonated glycinate carboxylates occurs relatively easily (Table 8). Even though the spontaneous dissociation of LnDOTA-tetraamides appears to be somewhat faster than dissociation of LnDOTA, acid-catalyzed dissociation of these complexes is significantly slower (up to 30 fold, depending on the structure) than dissociation of the analogous LnDOTA chelates. The slower acid-catalyzed dissociation of the LnDOTA-tetraamide complexes in general reflects the more difficult protonation of the neutral amide ligating arms which in turn improves kinetic inertness.
4.4.11.3 Biodistribution Studies
As judged by their favorable in vitro kinetic inertness, one would predict that the LnDOTA-tetraamides should be safe for in vivo use provided they are eliminated from the body as rapidly as the LnDOTA chelates. Biodistribution studies with radioactive 177 Lu3+-51, 153 Gd3+-22 and 177 Lu3+-95 demonstrated that negatively charged (anionic) complexes are excreted rapidly by renal filtration and are well-tolerated even at the relatively high concentrations required for MRI (>0.1 mmol/kg).283 However, 153 Gd3+-22 showed a marked preference for bone (33 % injected dose/organ), likely due to the bone targeting effect of the phosphonates. On the other hand, 177 Lu3+-95 in which phosphonate monoester groups were substituted for the phosphonate did not localize on bone. Cationic complexes of the ligands 16, 49, and 96 were also primarily excreted through the renal system and well tolerated at low doses (1–35 μmol). They showed slightly higher uptake in bone liver and spleen than 177 Lu3+-51. Since these organs are associated with free Ln3+ uptake as a consequence of in vivo dissociation, it is more likely that the complexes remain intact but, due to their 3+ charge, they mimic the biodistribution of a free Ln3+ ion. However, at higher doses (0.1 mmol/kg) the cationic complexes were acutely toxic, causing death within a minute of injection by interfering with heart function. Interestingly, the cationic complex, Lu3+-97 did not show any acute toxic effects when administered at a typical MRI dose.264 The exact reasons for this are not yet known but it was suggested that the decreased toxicity is due to the presence of the 12 peripheral alcoholic OH groups. This peculiar behavior may have significant implications for the design of PARACEST agents for in vivo applications because modification of a complex with a large number of peripheral alcoholic OH groups may lower its undesirable interaction with cell surfaces.
4.4.11.3.1 Nephrogenic Systemic Fibrosis (NSF), in vivo Stability and Toxicity of Ln-DOTA-Tetraamide Complexes
Free Ln ions are toxic because they act as a surrogate for Ca2+ ions and subsequently accumulate in bone and teeth. They can also form colloids with serum proteins that are eventually eliminated by the reticuloendothelial system.284 Free Gd3+ due to the dissociation of the contrast agent has also been implicated in Nephrogenic Systemic Fibrosis (NSF) although it has also been suggested that the intact complexes may play a role in triggering NSF. NSF is a systemic fibrosing disorder which characteristically exhibits fibrosis of the skin and the connective tissues, but it also affects other organs.285–287 It is important to emphasize that NSF is exceedingly rare and only affects a small percentage of patients with severely compromised renal function. Choice of contrast agent appears to have a great effect on the occurrence of NSF: there is growing evidence that NSF is associated with MRI contrast agents that exhibit low kinetic inertness, specifically Gd3+-complexes of open chain ligands derived from DTPA. So far, NSF has not been confirmed in patients who received macrocyclic contrast agents.287–288 The exceptionally high kinetic inertness of Gd3+ complexes of DOTA and DOTA-like ligands in general is the result of the preorganized, conformationally rigid structure of the macrocyclic cyclen backbone. Since Ln-complexes are eliminated by the kidney, renal failure leads to extended circulation times. The elimination half-life of Gd3+ chelates in healthy humans is around 1.5 hours, whereas it can be as long as 30 hours or more in patients with compromised renal function.239,289–291 If the kinetic inertness of the complex is not sufficiently high, the longer circulation times caused by kidney failure allow the metal-ligand system to approach equilibrium as defined by the conditional thermodynamic stability constant at a given pH. The released free Gd3+ then causes NSF.271,292–293 While it is erroneously accepted that high thermodynamic stability renders a complex stable in vivo, experimental evidence strongly suggests that the in vitro acid-catalyzed dissociation rates more accurately predict the fate of a complex in vivo. It was first reported 18 years ago that the extent of long term Gd3+-deposition in mice correlated well with the in vitro acid-catalyzed dissociation rates of the complexes. The deposition of Gd3+ was the lowest for Gd3+-2, which is in agreement with its extremely slow proton assisted dissociation rate.294
Since lanthanides other than Gd3+ can also trigger NSF, the in vivo stability and toxicity of Eu3+-51 has also been studied with regard to NSF.271 The pharmacokinetics of Eu3+-51 doped with tracer levels of 177 Lu3+-51 was followed in rats at 0.7 μmol/kg and 0.1 mmol/kg doses.271 The complex had an elimination half-life of 20 minutes and Eu3+-51 is completely eliminated from blood within 2 hours post-IV dosing. An analysis of residual 177 Lu3+-51 in tissue showed that the complex was found mainly in blood, kidney, and urine samples at 30 minutes, while at 2 hours the residual amount in these organs had decreased significantly. Such findings suggest rapid excretion of the complex by renal filtration. This pharmacokinetic behavior is very similar to that of other macrocyclic complexes such as Gd 3+-2. The chronic toxicity of Eu3+-51 was also evaluated in rats at 0.1 mmol/kg, 0.5 mmol/kg and 1.0 mmol/kg single doses, which are estimated to be required for in vivo applications. The compound was well tolerated in all cases and doses up to 1.0 mmol/kg were not associated with any toxicity. Even though the thermodynamic stability constant of Eu3+-51 is approximately 10 orders of magnitude lower than that of Gd3+ -2, Eu3+-51 dissociates about 25 times slower than Gd3+-2 (at pH = 1). While high thermodynamic stability combined with high kinetic inertness is certainly the best case scenario, thermodynamic stability is not the sole contributor to the safe application of these complexes in biological systems. Even with a low thermodynamic stability, the complex may dissociate so slowly that the amount of released metal ion is negligible before the complex is completely eliminated. Thus, kinetic inertness is a better predictor than thermodynamic stability for in vivo safety of such lanthanide complexes.271,292–293
In conclusion, PARACEST agents based on DOTA tetraamides do not exhibit overt toxicity at doses that would be required for their in vivo application (0.1–1.0 mmol/kg) and it should be emphasized that the biggest obstacle to their in vivo applications is not sensitivity or toxicity issues, but rather problems associated with inherent tissue MT effects (Section 4.4.11.4). Once these are solved, either by designing new complexes that can shift the bound water peak away from the MT window or by using improved imaging pulse sequences, all the in vitro studies of responsive agents presented in Section 4.4.7 should work in vivo.
4.4.11.4 The Effects of Tissue Magnetization Transfer (MT Effects) on CEST Imaging
In vivo MR imaging techniques based on magnetization transfer techniques have been in use for many years47 largely based on the presence of a semi-solid macromolecular component in tissue that gives a broad, underlying 1H NMR signal from water associated with the solid-like component that spans a radiofrequency range of ~100 kHz (Figure 57). It has been demonstrated that when a weak RF saturation pulse is applied at a particular frequency of this macromolecular phase, transfer of this magnetization to the bulk water signal is thought to occur by two mechanisms; (1) through dipolar coupling between the protons that have restricted motion due to entrapment of water or protons in macromolecular cavities and/or (2) through the chemical exchange between the water protons and macromolecular side chains containing –NH, -OH exchanging groups.45 It is difficult to distinguish between these two mechanisms. While the conventional MT effect of the semi-solid macromolecular phase in the tissues usually occurs over a large frequency range of ~100 kHz (determined by dipolar interaction, magnetic susceptibility and the chemical anisotropy of the macromolecules in the tissues), the CEST effects of DIACEST and PARACEST agents usually occur only over a very narrow frequency range. As recently observed by Zhou and van Zijl,12 one of the most significant differences between the inherent MT effects of biological tissues and CEST is the frequency specificity of a CEST agent as compared to the mainly symmetric appearance of the conventional MT proton signal.
Figure 57.

A schematic representation of the differences between a CEST spectrum (red line) and conventional MT effects in tissues (black line).
One of the challenges of imaging the CEST effect from a diamagnetic CEST agent in vivo is the small Δω values of the exchanging sites in these contrast agents. As a result, there is a possibility that the MT effect from tissues can largely obscure CEST from an agent.12 Initial efforts to avoid this problem for in vivo imaging involved the collection of two MR images with a presaturation offset pulse applied at equal frequencies on either side of the bulk water resonance (Figure 57).65,81 While the MT signal from tissue is reasonably symmetrical about the free bulk water resonance, the contribution from a CEST agent should result in asymmetry in the CEST spectrum. Thus, by subtracting images collected at a positive offset frequency from another collected at a negative offset frequency, a true CEST image devoid of MT effects should be obtained. Using this approach, Guivel-Scharen et al. demonstrated that tissue metabolites can be detected and imaged via water protons using the signal amplification properties of saturation transfer in the presence of in vivo MT effects.65 Images of the medulla of the kidney were obtained using a difference imaging technique between a control irradiation (− 1.74 ppm) and on-resonance irradiation (+ 1.74 ppm) using the protons of urea that are in chemical exchange with the water proton in the tissues (Figure 58).
Figure 58.
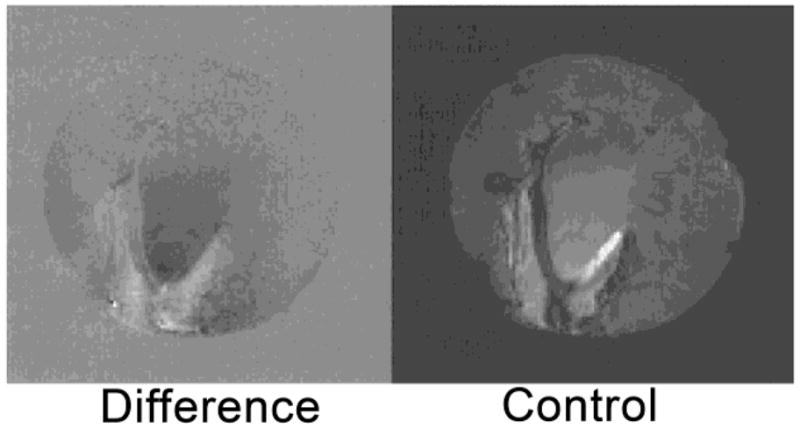
Control and difference images of a rabbit kidney ex vivo indicating chemical exchange effects. The control image corresponds to the off-resonance irradiation at −1.74 ppm, while the difference image corresponds to the difference of the off-resonance from the on-resonance (M0−Ms) image at +1.74 ppm. The darkened regions in the difference image correspond to areas of chemical exchange in the rabbit kidney predominantly due to low molecular weight metabolites. Reprinted from reference 65, Copyright (1998), with permission from Elsevier.65
It is generally expected that the intrinsic problem of MT effects might be offset to some extent by using PARACEST agents owing to the large Δω values for their exchanging sites. In one of the earliest reports of imaging PARACEST agents in tissues, Li et al. described the temperature dependence of Eu 3+-57 in brain tissue.194 Their use of a two-dimensional Fast Low Angle Shot (FLASH) pulse sequence preceded by a continuous presaturation pulse showed consistency in the average temperature of the tissue despite the inherent MT effects of the tissues. While the phantom image and the corresponding CEST spectrum in aqueous solution shows the expected result, images of the agent mixed with brain tissue show significantly overlap with the inherent MT effects in tissue. Even with this overlap, they were able distinguish asymmetry in the CEST spectrum near 50 ppm corresponding to exchange of the bound water molecule on Eu3+-57 (Figure 59).
Figure 59.

(a) The average CEST spectrum and the average asymmetry curve from a mouse brain tissue phantom with 7 mM Eu3+-57. (34 °C); (b) the corresponding CEST sensitivity map of the mouse brain tissue phantom showing an average CEST sensitivity of 7.9 ± 0.6 % even in the presence of significant MT effects in the tissue. CEST MR imaging conditions (9.4 T): irradiation time = 10 s, irradiation power = 14.1 μT. Reference 295. Copyright (2008); Reprinted with permission of John Wiley & Sons, Inc.295
To further validate these exchange phenomena in biological systems, Li et al. described a four-pool model that basically combined the three-pool model described earlier by Woessner et al. with an extra pool to describe exchange between the macromolecular protons and bulk water, the MT pool. 67,295 Simulations of the CEST spectra in the presence and absence of macromolecular protons indicate that while the agent showed little variation in the CEST effect as a function of the exchangeable proton chemical shift Δω (Figure 60a), the net CEST effect decreased considerably for chemical shifts within ±100 ppm of the bulk water as a result of the interference from the macromolecular MT (Figure 60b). On the other hand, for Δω values greater than ± 100 ppm, the effects due to tissue MT effects showed minimal interference with CEST. As discussed previously (Table 3), some paramagnetic lanthanide complexes display extremely large shifts for exchangeable water/proton resonances, especially the bound water protons in some Tb3+, Tm3+, Dy3+ and Yb3+ complexes. Thus, while Eu3+ complexes have been most extensively studied so far owing to their slow exchange kinetics, it would be extremely beneficial to use lanthanide ions that induce larger shifts to improve CEST efficiency in vivo by avoiding the MT effects from endogenous macromolecules.
Figure 60.

Simulated CEST spectra showing the effect of the PARACEST agent exchangeable proton chemical shift on the CEST efficiency in the absence (a) and presence (b) of macromolecules. Reference 295. Copyright (2008); Reprinted with permission of John Wiley & Sons, Inc. 295
Li et al. analyzed the experimental CEST results obtained for their contrast agent in vivo using the four pool model and fit the spectra using Lorentzian, Gaussian and super-Lorentzian line shapes (Figure 61). The calculated values of bound water chemical shift using the super Lorentizian fitting were in reasonably good agreement with the experimental results. The average T2 of the protons associated with the endogenous macromolecules are also in excellent agreement with the values obtained in earlier measurements, giving validity to the use of the four-pool modeling system to quantify PARACEST spectra.296 Although the CEST effects of the bound water protons of the Eu3+ complex are still considerably quenched by the endogenous macromolecular MT effects, these results represent a foray into in vivo imaging using PARACEST agents and offer sufficient hope for further improvements.
Figure 61.


CEST spectra obtained from Vero cells containing the PARACEST agent (Eu3+-57). Three different lineshape functions were used to fit the MT observed from the macromolecules: (a) Lorentzian, (b) Gaussian, and (c) superLorentzian. The residual of each fit is shown at the bottom of each plot. Reference 295. Copyright (2008); Reprinted with permission of John Wiley & Sons, Inc.295
Another method to get good temporal resolution in spite of the MT effects is the use of either a fast or slow selective presaturation time using interleaved repetitive short saturation pulses and multiple echo acquisition, as reported by Liu et al.297 The use of a short echo time and long saturation time is an ideal condition for the system to attain steady-state magnetization and to give the maximum contrast in vivo. The choice of imaging sequence is governed by the T1 of the tissue and the contrast agent. This report compares the effective improvement in PARACEST contrast between two imaging pulse sequences: one involving a short presaturation time with a long echo time using the RARE (Rapid Acquisition with Relaxation Enhancement) sequence suitable for environments with long T1, and the other involving a short presaturation time with a short echo time using the FLASH (Fast Low Angle Shot) pulse sequence that lengthens the total acquisition time, but offsets the loss of PARACEST contrast due to short T1.298–300 These modified pulse sequences provide major inroads into improving the temporal resolution and scan times of in vivo images.
While significant knowledge has been gained in these studies about in vivo imaging of PARACEST agents, there is much to be done before these agents will be used in a clinical setting. The inherent MT effect of tissues still remains as the main barrier towards the use of these agents for in vivo studies. Overcoming this problem will greatly facilitate the translation of these agents into in vivo applications, especially with respect to the responsive agents.
5. Other Contrast Agents
So far, we have discussed in great detail the use of paramagnetic lanthanide complexes as contrast agents using a new contrast enhancement technique called chemical exchange saturation transfer. While Gd3+ complexes with faster water exchange kinetics are ideal as T1 agents, other Ln3+ complexes with slow exchange kinetics have shown great promise as PARACEST agents. In this section we briefly discuss a few different types of lanthanide complexes that are viable substitutes to Gd3+-based T1 agents and PARACEST agents.
5.1 Fast Exchanging Paramagnetic Lanthanide Complexes
Many of the PARACEST agents discussed so far satisfy the slow-to-intermediate water exchange condition and are activated by saturation of a highly shifted Ln3+-bound water resonance. Using the modified Bloch equations, it can be predicted that the efficiency of saturation for CEST agents with faster water exchange can be significantly improved if a strong RF pulse is used for off-resonance saturation. This places obvious limitations on the use of conventional off-resonance saturation techniques for these fast exchanging systems owing to the fact that the power required to achieve saturation of the exchanging pool would likely exceed the acceptable specific absorption rate (SAR) limit for humans. While we have discussed the use of off-resonance saturation transfer as one of the techniques to study chemical exchange effects on slow exchanging systems as a major part of this review, many other techniques have been used to study slow exchanging processes.58,82,301–302 An alternative way to detect chemical exchange in fast exchanging paramagnetic lanthanide complex was recently demonstrated by Vinogradov et al. using a method called On Resonance Paramagnetic Agent Chemical Exchange Effect (OPARACHEE).303 The basic hypothesis is that it is possible to use exchange and relaxation-sensitive pulses directly on the bulk water resonance to observe contrast due to chemical exchange. 304–307 The principle behind OPARACHEE can be qualitatively understood as follows: application of a long, low power 360° pulse (or equivalent) on the bulk water resonance should result in a full 360 rotation of the net magnetization in the absence of exchange. But when chemical exchange occurs, some of the exchanging protons “leak away” and do not experience the full 360 degree rotation. This effect will result in a decrease of the Z-magnetization and negative contrast enhancement, quite similar to conventional CEST. In practice, this is accomplished by using a modified WALTZ-16 pulse train (WALTZ-16*), where the pulse length is fixed at 2.5 ms, which does not necessarily correspond to calibration of the 90 pulse as in the original WALTZ-16 sequence.308–309 The effectiveness of this method is dependent on several parameters, including the longitudinal and transverse relaxation times, water residence times of both the bound and bulk water pools, the chemical shift difference between the bound and bulk water resonances (Δω), and concentration of the paramagnetic agent. Simulations of the magnitude of the magnetization ratio as a function of the bulk water residence lifetime and Δω suggest that maximal effect is attained when the bulk water residence time is ~0.5−1 s and Δω is as large as possible. In practice this means that Tm 3+ and Dy3+ complexes of DOTA should in principle perform best and this was indeed demonstrated in spectroscopy and imaging experiments.
An aqueous solution of Tm3+-17 at a concentration of 12 μM showed that a 4% reduction in bulk water can be achieved using a relatively low power B1 pulse of only 200 Hz. These results were also confirmed in an imaging experiment with three tubes of phantom containing different concentrations of Tm3+-17 (Figure 62). The lowest concentration (12.5 μM) that could be seen in the spectroscopy experiment could not be differentiated with respect to bulk water alone in the phantoms. This can be attributed to the expected contribution of B0 inhomogeneity in the imaging experiments. The same experiments performed with Dy3+-17 resulted in a 12 % decrease in bulk water signal intensity using 125 μM complex.
Figure 62.

Spin-echo difference images collected at 400 MHz of phantoms containing water and different concentrations of Tm3+-17: 12.5 μM, 125 μM, and 1 mM. Images with WALTZ-16* placed very far off-resonance (effectively switched off) (a), on-resonance (b), and a relative difference image (c). Reprinted from reference 303, Copyright (2005), with permission from Elsevier.303
To evaluate the practical advantages of OPERACHEE over the “off resonance” presaturation CEST imaging techniques, mice were imaged after injection of Tm3+-51 using a WALTZ-16* pulse for excitation of the water signal followed by a standard spin echo acquisition. The kidney tissues appeared bright in such images due to the short T2 of this tissue; further delineation of different tissue types within the kidney could be achieved due to the difference in the magnetization transfer effect and the relaxation times. These results show that OPERACHEE could be used as an alternate imaging technique using other types of lanthanide complexes such Tm3+ and Dy3+ that have a fast bound water exchange and short relaxation times (Figure 63). Some advantages of OPARACHEE over CEST for imaging the exchange effects of such agents can be summarized as follows: 1) the low power WALTZ-16* pulse train causes much less RF power deposition than conventional CEST imaging, 2) the method expands the range of usable Ln3+-complexes to include fast exchanging systems that cannot be pre-saturated in the more typical CEST experiment, 3) the detection limit appears to be about an order of magnitude lower and 4) the need to know the exact frequency of Ln3+-bound water molecule is removed. A major disadvantage, however, is the high sensitivity of WALTZ-16* to short relaxing species, which removes some tissue signals from the image even in the absence of the paramagnetic complex. These experiments reveal that the OPERACHEE imaging sequence for fast exchanging systems presents a feasible alternative to the more traditional CEST method. The use of low B1 power levels of 100 to 300 Hz with agent concentrations as low as 30–200 μM greatly increase the viability of these systems when compared to other off resonance techniques.
Figure 63.

Typical WALTZ-SE (spin echo images using WALTZ-16*) in vivo images of the kidney (zoomed in on the area marked approximately on the anatomical image in the upper left corner). Images are taken right before (a) and after 2 min 40 sec (b); 5 min 20 sec (c); 10 min 40 sec (d); 16 min (e); and 18 min 40 sec (f) from the beginning of the Tm-51 bolus injection (all the timings correspond to the beginning of image acquisition). The maximum intensity decrease is observed around 3 min (b). As the agent clears through the kidney, the intensity starts to return to the levels seen prior to the agent injection (d–f). Reference 332. Copyright (2007); Reprinted with permission of John Wiley & Sons, Inc.332
5.2 Eu2+-Based T1 Contrast Agents
Europium is the only lanthanide that exhibits extensive chemistry in the divalent state in aqueous solution. Eu2+ and Sr2+ have almost exactly the same ionic radius and the coordination chemistry of these two ions is quite similar. Eu2+ is paramagnetic and has the same 4f7 electron configuration as Gd3+ (isoelectronic). Given the more favorable water exchange kinetics of Eu2+ compared to Gd3+, this divalent ion may present an attractive alternative to Gd3+ for certain T1 contrast agents applications. Eu2+ does however have a shorter electronic relaxation time than Gd3+; so the relaxivity of Eu2+ complexes are expected to be somewhat lower than the corresponding Gd3+ complexes. The Eu2+ aqua ion has an average coordination number of 7.2, suggesting that 7 and 8 coordinate species exist in equilibrium. This means that the free energy difference between the ground and transition state is very low resulting in an extremely fast exchange rate, in fact, the fastest ever measured by 17O NMR.310 Activation volume measurements have shown that water exchange proceeds by a limiting associative mechanism (A). Water exchange in Eu2+-polyamino polycarboxylate complexes is also generally much faster than the corresponding Gd3+-complexes due to the larger ionic radius and smaller ionic charge of Eu2+. From 17O NMR measurements, the water exchange in Eu2+-2 follows an interchange mechanism (Ia) with an activation volume of +0.1 ± 1.0 cm3mol−1. The extremely fast water exchange rate of Eu2+-2 is likely due to the longer than usual Eu2+-O (bound water) distance in this complex, which adopts a TSAP geometry.
Practical applications of Eu2+ complexes as T1 agents are severely hampered by the extreme sensitivity of this ion toward oxidation. This chemical feature makes Eu2+ an attractive platform for creating T1-based redox sensors. This would be especially advantageous because the oxidized product, Eu3+, has negligible relaxation effects. Generally, the sensitivity of Eu2+ complexes of poly-amino poly-carboxylate ligands (DTPA, DOTA) to oxidation is even greater than the Eu2+ aqua ion. Ligands based on the azacrown ether 1,4,10,13-tetraoxa-7,16-diazacyclooctadecane are promising but the complexes still have somewhat more negative redox potential than the aqua ion. Water exchange in Eu2+-98 proceeds by an associative mechanism (A) because there is enough room in this complex for another water molecule to coordinate. So far, the least sensitive complex is the cryptate, Eu2+-99. The variable temperature 17O NMR data fittings revealed that this complex has the slowest water exchange rate when compared with the earlier reported complexes.311 The activation volume indicates that the water exchange occurs via an interchange mechanism (Ia) where the rate determining step involves the incoming water molecule (Table 9). While biomedical applications of Eu2+ complexes may not ultimately prove feasible, the data collected in these studies could improve our understanding of how electronic relaxation mechanism and water exchange rate contributes to proton relaxivity beyond that already learned in studies of Gd3+ complexes.
Table 9.
The summary of the parameters that were obtained from variable temperature 17O NMR, NMRD, and relaxivity on the Eu2+ complexes that were reported.
| Ligand | CN | qb | E1/2 mV vs Ag/AgCl | kex (109s− 1) | τm μs | r mM−1s−11 | ΔH‡ (kJ mol−1) | ΔV‡ (cm3 mol−1) | τr298 ps | τv298 ps |
|---|---|---|---|---|---|---|---|---|---|---|
| Aqua310 | 8 | 8 | −585 | 4.4 | 227 | 15.7 | −11.3 | 16.3 | 1.0 | |
| 1322 | 9 | 1 | −1340 | 1.3 | 766 | 3.57 | 26.3 | 4.5 | 74 | 13.6 |
| 98311 | 9a | 1 | −820 | 0.43 | 2325 | 3.49 | 22.5 | −3.9 | 58.2 | 14.3 |
| 99323 | 10a | 2 | −205 | 0.31 | 3225 | 30.6 | 0.9 | 90.3 | 17.0 | |
| 100311 | 0 | −920 | - | - | - | - | - | - | ||
| 2324 | 9a | 1 | −1135 | 2.46 | 400 | 4.32 | 21.4 | 0.1 | 123 | 22.7 |
| 6324 | 8a | 0 | −996 | - | - | 2.60 | - | - | - | 17.4 |
Compared with the crystal structure of Sr2+ isoelectronic with Eu2+;
number of coordinated water molecules.
5.3 High Magnetic Field Dy3+ Contrast Agents
As explained in our discussion of the paramagnetic properties of lanthanide ions in Section 3, conventional Gd3+-based contrast agents have longer electronic relaxation times due to their isotropic electronic ground state and as a result proton relaxation is reasonably well-described by Solomon Bloembergen Morgan theory. These agents affect both T1 and T2. Most of the remaining paramagnetic lanthanide ions, especially Dy3+, Pr3+, Sm3+, Ho3+, Er3+ and Yb3+ that are characterized by shorter electronic relaxation times, relax protons via a Curie mechanism that primarily affects T2.312 The contribution of Curie relaxation mechanism increases substantially with the external magnetic field B0 and is proportional to the square of the magnetic moment of the lanthanide ion. 23,313 Among the trivalent lanthanide ions, Dy3+ has the shortest electronic relaxation time (~0.5 ps) and highest magnetic moment (10.6 Bohr magnetons) which in combination results in very efficient T2 relaxation. Vander Elst et al.314 reported a series of Dy3+ complexes based on 1 (101–104) and showed that at low field that the transverse relaxivities of the complexes are similar to their longitudinal relaxivities, while at high field there is a marked dependence of r2 on both the magnetic field and τM. According to theoretical considerations, the low field transverse relaxivity of a Dy3+-complex is determined by its electronic relaxation time and should therefore be small and similar to its longitudinal relaxivity. At higher magnetic fields, however, the Curie contribution becomes more significant and the transverse relaxivity increases with the square of the external magnetic field and attains an optimal value when τM is between 0.1 and 1 μsec. Longer or shorter bound water residence lifetimes are detrimental to r2 (Figure 64). This was clearly demonstrated by field dependent proton r2 relaxivity measurements on Dy3+ complexes of 1, DTPA bisamides and 16. At low field, all Dy3+ complexes showed small and comparable r2 values but at higher fields, the r2 of Dy3+-1 and Dy3+-16 increased only slightly because of their faster and slower than optimal exchange rate respectively while the r2 of Dy3+-101 showed a marked increase with the square of B0 (Table 10). Imaging experiments confirmed the much more efficient T2 shortening effect of Dy3+-101 compared to Dy3+-1: signal attenuation in the sample containing 10 mM of Dy3+-101 could already be observed on the first echo image and on the fifth echo the signal could no longer be detected (Figure 65).314
Figure 64.

The dependence of the water 1H transverse relaxivity (r2) for a solution of Dy3+-99 (◆), Dy3+-16 (●) and Dy3+-1 (▲) at 298 K. Adapted from references 314 (Copyright 2002; Reprinted with permission of John Wiley & Sons, Inc.) and 328 (Reprinted from reference 328, Copyright (2002), with permission from Elsevier). 314,328
Table 10.
The parameters obtained by fitting the experimental proton r1 and r2 NMRD data at two temperatures 298 and 310 K. Reference 302. Copyright (2002); Reprinted with permission of John Wiley & Sons, Inc.314
| Ligand | τs (ns) | τr (ns) | τm(ns) | Δωm(× 105 rad s−1 T−1) | ||||
|---|---|---|---|---|---|---|---|---|
| 298 | 310 | 298 | 310 | 298 | 310 | 298 | 310 | |
| 1 | 0.14 | 0.15 | 80 | 55 | 29 | 12 | 1.47 | 1.42 |
| 101 | 0.17 | 0.16 | 75 | 65 | 220 | 100 | 1.44 | 1.50 |
| 102 | 0.16 | 0.15 | 95 | 70 | 225 | 110 | 1.52 | 1.50 |
| 103 | 0.16 | 0.15 | 95 | 80 | 115 | 51 | 1.56 | 1.66 |
| 104 | 0.15 | 0.13 | 95 | 80 | 115 | 48 | 1.60 | 1.63 |
Figure 65.

The spin echo images at 4.7 T and room temperature of a phantom containing Dy 3+-1 and Dy3+-101. Reference 314. Copyright (2002); Reprinted with permission of John Wiley & Sons, Inc.314
The Curie spin contribution to r2 is also dependent on the rotational correlation time τR of the complex. This was demonstrated by Caravan et al. who measured the r2 of Dy3+-105 in the presence and absence of albumin.315 As reported earlier, Gd3+-106 has a high affinity for HSA. Dy3+-106 showed a 3–8 times increase r2 in the presence of HSA due to the increase in τR upon binding. Field dependent relaxivity measurements on Dy3+-106 indicated that the r1 of Dy3+-106 is largely field independent, while r2 increases with increasing field because the contribution of the Curie spin effect becomes larger as theoretically predicted. On the other hand, the r1 and r2 of Dy3+-105, a related complex with no metal bound water, did not change with the magnetic field. This indicates, as expected, the Curie relaxation effect of the Dy3+ is transferred to the bulk water through the exchange of the metal bound water molecule.
Dy3+-1 was also proposed for use in MRI as a T2* negative contrast agent to differentiate between healthy and damaged tissues. The complex produces a susceptibility effect due to its localization in extracellular compartments of healthy tissues. In damaged tissues where cell membranes are disrupted, the complex is distributed homogenously. As a result of compartmentalization, a local field gradient is generated because of the large magnetic susceptibility of the metal ion, which in turn results in a decrease in T2* and increasing negative contrast.316–317 However, since small chelates such as Dy3+-1 extravasate from the vascular space quite rapidly, a PAMAM dendrimer based Dy3+ complex with slower clearance rate has also been proposed as blood pool susceptibility agent.318
6. Concluding Remarks
Although Gd3+ complexes have been extremely successful in altering contrast in T1-weighted images in both basic research and in clinical applications, the new era of molecular imaging makes more demands on MRI that cannot be satisfied with current generation Gd3+ agents. Over the past several years, chemical exchange saturation transfer (CEST) agents that make use of slowly exchanging –NH, -OH or bound water protons have evolved as a potentially new class of imaging agents and a promising alternative to Gd3+-based contrast agents. Even though chemical exchange principles have been widely described in the NMR literature, it was the pioneering work of Ward and Balaban on the application of small molecule diamagnetic molecules for CEST that stimulated new interest in developing such agents for molecular imaging of biological processes. The discovery of paramagnetic lanthanide DOTA-tetraamide complexes with extremely slow water exchange kinetics has further stimulated new ideas about CEST-based contrast agents. PARACEST agents have significant advantages over their diamagnetic counterparts, mainly due to the large lanthanide induced frequency shifts of the proton exchange sites in these molecules. One of the main reasons for the explosive growth of PARACEST agents can be attributed to the fact that so much has already been studied in great detail about water exchange mechanisms for Gd3+ and its complexes. This knowledge has proven extremely useful to translate most of the known concepts involving Gd3+ to PARACEST. In addition, the fact that virtually any paramagnetic lanthanide ion (except Gd3+) can be used for CEST imaging makes these agents extremely attractive as multi-frequency contrast agents to report multiple biological parameters such as pH, redox, temperature or enzyme activity in a single imaging experiment. It would be difficult to conceive such experiments with conventional T1 or T2 agents. Finally, arguably the most attractive feature of PARACEST is the ability to turn image contrast on or off with an RF pulse, a feature that is impossible with the never silent Gd3+ agents.
As water exchange is extremely sensitive to many types of environmental or structural changes, these agents have created new opportunities for developing responsive PARACEST agents that signal changes in biological or physiological events by MRI. Several successful in vitro experiments using novel responsive PARACEST agents provide ample evidence that these agents show great promise for reporting physiological phenomena using existing imaging technologies. Initial in vivo bio-distribution experiments suggest the kinetic inertness of these complexes will result in low toxicity for these agents, similar to their Gd3+ counterparts. While considerably more must be done to realize the full potential of these contrast agents in clinical settings, it can be envisioned that PARACEST agents are paving the way for MRI to become more than a tool for anatomical imaging but a true contender for molecular imaging as well.
Chart 1.


Acknowledgments
The authors acknowledge financial support from the National Institutes of Health (CA-115531, CA-126608, RR-02584 and EB-004582) and the Robert A. Welch Foundation (AT-584) throughout the writing of this review.
Biographies

Subha Viswanathan earned her B.Sc. from Stella Maris College, Madras University, Chennai in 2000. In 2007, she earned a Ph.D in Inorganic Chemistry from Syracuse University under the guidance of Dr. Ana de Bettencourt-Dias. While there she obtained a doctoral prize for her work on the synthesis and characterization of nitro- and oxazoline-derivatized ligands for lanthanide complexes. She was also honored with the William D. Johnson award for Outstanding Teaching Assistant in 2006. In 2007 she came to the Advanced Imaging Research Center at UT Southwestern Medical Center to work as a postdoctoral researcher for Dr. Dean Sherry. Her primary research interests include the synthesis and characterization of peptide-based macrocyclic lanthanide complexes for PARACEST.
Zoltán Kovács was born in Kisvárda, Hungary in 1963. He received his Ph.D from Lajos Kossuth University, Debrecen, Hungary (now University of Debrecen) in 1992 under the direction of Dr. Béla Győri, working on cyano- and carboxy-borane complexes. Immediately thereafter he moved to the lab of Dr. Dean Sherry at the Department of Chemistry, University of Texas at Dallas as a post-doctoral researcher and later as Research Scientist to conduct research on the synthesis of bifunctional ligands for lanthanide complexes. He also worked as a Senior Research Scientist for Macrocyclics, Dallas, Texas. In 2006, he moved to the Advanced Imaging Research Center at UT Southwestern Medical Center as Assistant Professor where his primary research interests include the synthesis and application of hyperpolarized yttrium-89 complexes and carbon-13 labeled metabolic intermediates and the design and development of new ligand systems for PARACEST, T1 and radiopharmaceutical imaging.
Kayla N. Green received her B.S. degree from Tarleton State University in 2003. In 2007, she obtained her Ph.D. in Inorganic Chemistry from Texas A&M University under the direction of Marcetta Y. Darensbourg where she studied immobilized biomimetic complexes of metalloenzymes. While there she was she was honored with the U.S. Senator Phil Gramm Doctoral Fellowship Award (2007) and a Chemistry Biology Interface - NIH Training Grant (2004). In 2008 she began her postdoctoral work at UT Southwestern Medical Center. Her research currently focuses on the synthesis of lanthanide complexes for molecular imaging using novel NMR techniques and the development of computational methods for the evaluation of these complexes.

S. James Ratnakar earned his Bachelors in Science (BS) in Chemistry (April 1995) from Madras University, India and his Masters in Science (MS) in Chemistry (May 1997) Bharathidasan University, India. He received his Ph.D in July 2004 from Madras University, India for his research on the synthesis and relaxivity studies of gadolinium (III) complexes of polyazapolycarboxylate macrocycles, under the guidance of Dr. V Alexander at Loyola College Chennai, India. After a brief postdoctoral work with Dr. V. Alexander, in 2006 he joined Dr. Dean Sherry at the Advanced Imaging Research Center at UT Southwestern Medical School, Dallas, Texas. The broad area of his research interest is design and synthesis of macrocyclic ligands and their lanthanide complexes for use as imaging agents mainly for MRI.

A. Dean Sherry earned a PhD in Inorganic Chemistry at Kansas State University and won a National Institutes of Health Postdoctoral Fellowship to study metal-protein interactions before joining the chemistry faculty at UT-Dallas in 1972. He served as Chairman of the UT Dallas chemistry department from 1979–1990. In 1990, he accepted an appointment as Professor of Radiology at UT-Southwestern Medical Center where, for the next 15 years, he spent 50% of his time help build a metabolism MR program and 50% time teaching chemistry and doing research at UT Dallas. He was recognized for his outstanding achievements in chemistry by winning the Doherty Award from the DFW Section of the American Chemical Society in 1990 and was honored by receiving the Chancellor’s Outstanding Teaching Award at UT-Dallas in 1994. He currently holds a Cecil & Ida Green Distinguished Chair in Systems Biology at UT Dallas and serves as Director of the Advanced Imaging Research Center (AIRC) on the campus of UT Southwestern Medical Center. He and his collaborators have published ~320 peer-reviewed research articles and his research has been funded by the National Institutes of Health and a variety of private companies and foundations. He is the Scientific Founder of Macrocyclics, a local biomedical technology & development company that supplies bifunctional chelates and other key research intermediates to the biomedical imaging and nuclear medicine imaging & therapy communities.
Footnotes
Dedicated to the memory of Dr. Donald E Woessner who guided us in much of our science.
References
- 1.Ward KM, Aletras AH, Balaban RS. J Magn Reson. 2000;143:79. doi: 10.1006/jmre.1999.1956. [DOI] [PubMed] [Google Scholar]
- 2.Zhang S, Merritt M, Woessner DE, Lenkinski RE, Sherry AD. Acc Chem Res. 2003;36:783. doi: 10.1021/ar020228m. [DOI] [PubMed] [Google Scholar]
- 3.Woods M, Zhang S, Kovacs Z, Sherry AD. Adv Supramol Chem. 2003;9:1. [Google Scholar]
- 4.Woods M, Woessner DE, Sherry AD. Chem Soc Rev. 2006;35:500. doi: 10.1039/b509907m. [DOI] [PMC free article] [PubMed] [Google Scholar]
- 5.Woods M, Zhang S, Sherry AD. Curr Med Chem Immunol, Endocr. 2004;4:349. doi: 10.2174/1568013043357338. [DOI] [PMC free article] [PubMed] [Google Scholar]
- 6.Sherry AD, Woods M. Molecular and Cellular MR Imaging. CRC Press; Boca Raton: 2007. p. 101. [Google Scholar]
- 7.Sherry AD, Woods M. Annu Rev Biomed Eng. 2008;10:391. doi: 10.1146/annurev.bioeng.9.060906.151929. [DOI] [PMC free article] [PubMed] [Google Scholar]
- 8.Aime S, Crich SG, Gianolio E, Giovenzana GB, Tei L, Terreno E. Coord Chem Rev. 2006;250:1562. [Google Scholar]
- 9.Delli Castelli D, Gianolio E, Geninatti Crich S, Terreno E, Aime S. Coord Chem Rev. 2008;252:2424. [Google Scholar]
- 10.De Leon-Rodriguez LM, Lubag AJM, Malloy CR, Martinez GV, Gillies RJ, Sherry AD. Acc Chem Res. 2009;42:948. doi: 10.1021/ar800237f. [DOI] [PMC free article] [PubMed] [Google Scholar]
- 11.Yoo B, Pagel MD. Front Biosci. 2008;13:1733. doi: 10.2741/2796. [DOI] [PubMed] [Google Scholar]
- 12.Zhou J, van Zijl PCM. Prog Nucl Magn Reson Spectrosc. 2006;48:109. [Google Scholar]
- 13.Cotton S. Lanthanide and Actinide Chemistry (Inorganic Chemistry: A Textbook Series) 2. Wiley Interscience; West Sussex: 2006. [Google Scholar]
- 14.Lacheisserie EdTd, Gignoux D, Schlenker M. Magnetism: Fundamentals. 1. Springer; New York: 2004. [Google Scholar]
- 15.Sole JG, Bausa L, Jaque D. An Introduction to the Optical Spectroscopy of Inorganic Solids. 1. John Wiley & Sons Ltd; West Sussex: 2005. [Google Scholar]
- 16.Bertini I, Janik MBL, Lee YM, Luchinat C, Rosato A. J Am Chem Soc. 2001;123:4181. doi: 10.1021/ja0028626. [DOI] [PubMed] [Google Scholar]
- 17.Geraldes CFGC, Luchinat C. Metal Ions In Biological Systems (Lanthanides and Their Interrelations with Biosystems) Marcel Dekker Inc; New York: 2003. p. 513. [PubMed] [Google Scholar]
- 18.Otting G. J Biomol NMR. 2008;42:1. doi: 10.1007/s10858-008-9256-0. [DOI] [PubMed] [Google Scholar]
- 19.Peters JA, Huskens J, Raber DJ. Prog Nucl Magn Reson Spectrosc. 1996;28:283. [Google Scholar]
- 20.Caravan P, Ellison JJ, McMurry TJ, Lauffer RB. Chem Rev. 1999;99:2293. doi: 10.1021/cr980440x. [DOI] [PubMed] [Google Scholar]
- 21.Pintacuda G, John M, Su XC, Otting G. Acc Chem Res. 2007;40:206. doi: 10.1021/ar050087z. [DOI] [PubMed] [Google Scholar]
- 22.Helm L, Toth E, Merbach AE. Metal Ions In Biological Systems (Lanthanides and Their Interrelations with Biosystems) Marcel Dekker Inc; New York: 2003. p. 589. [PubMed] [Google Scholar]
- 23.Gueron M. J Magn Reson (1969–1992) 1975;19:58. [Google Scholar]
- 24.McConnell HM, Robertson RE. J Chem Phys. 1958;29:1361. [Google Scholar]
- 25.Toth E, Helm L, Merbach AE. Compr Coord Chem II. 2004;9:841. [Google Scholar]
- 26.Merbach AE, Toth E. The Chemistry of Contrast Agents in Medical Magnetic Resonance Imaging. Wiley-VCH; Weinheim, Germany: 2001. [Google Scholar]
- 27.Sherry AD, Geraldes CFCG. Lanthanide Probes in Life, Chemical and Earth Sciences: Theory and Practice. Elsevier; Amsterdam: 1989. p. 93. [Google Scholar]
- 28.Golding RM, Halton MP. Aust J Chem. 1972;25:2577. [Google Scholar]
- 29.Pinkerton AA, Rossier M, Spiliadis S. J Magn Reson (1969–1992) 1985;64:420. [Google Scholar]
- 30.Reuben J, Elgavish GA. J Magn Reson (1969–1992) 1980;39:421. [Google Scholar]
- 31.Bleaney B. J Magn Reson (1969–1992) 1972;8:91. [Google Scholar]
- 32.Aime S, Barge A, Botta M, Parker D, De Sousa AS. J Am Chem Soc. 1997;119:4767. [Google Scholar]
- 33.Reuben J. J Magn Reson (1969–1992) 1982;50:233. [Google Scholar]
- 34.Reilley CN, Good BW, Desreux JF. Anal Chem. 1975;47:2110. [Google Scholar]
- 35.Ren J, Sherry AD. J Magn Reson, Ser B. 1996;111:178. doi: 10.1006/jmrb.1996.0078. [DOI] [PubMed] [Google Scholar]
- 36.Rigault S, Piguet C. J Am Chem Soc. 2000;122:9304. [Google Scholar]
- 37.Ouali N, Bocquet B, Rigault S, Morgantini PY, Weber J, Piguet C. Inorg Chem. 2002;41:1436. doi: 10.1021/ic010801i. [DOI] [PubMed] [Google Scholar]
- 38.Platas C, Avecilla F, de Blas A, Geraldes CFGC, Rodriguez-Blas T, Adams H, Mahia J. Inorg Chem. 1999;38:3190. [Google Scholar]
- 39.Ren J, Zhang S, Sherry AD, Geraldes CFGC. Inorg Chim Acta. 2002;339:273. [Google Scholar]
- 40.Kemple MD, Ray BD, Lipkowitz KB, Prendergast FG, Rao BDN. J Am Chem Soc. 1988;110:8275. [Google Scholar]
- 41.Forsberg JH, Delaney RM, Zhao Q, Harakas G, Chandran R. Inorg Chem. 1995;34:3705. [Google Scholar]
- 42.Zhang S, Wu K, Biewer MC, Sherry AD. Inorg Chem. 2001;40:4284. doi: 10.1021/ic0003877. [DOI] [PubMed] [Google Scholar]
- 43.Djanashvili K, Platas-Iglesias C, Peters JA. Dalton Trans. 2008. p. 602. [DOI] [PubMed] [Google Scholar]
- 44.Djanashvili K, Peters JA. Contrast Media Mol Imaging. 2007;2:67. doi: 10.1002/cmmi.132. [DOI] [PubMed] [Google Scholar]
- 45.Henkelman RM, Stanisz GJ, Graham SJ. NMR Biomed. 2001;14:57. doi: 10.1002/nbm.683. [DOI] [PubMed] [Google Scholar]
- 46.Bryant RG. Annu Rev Biophys Biomol Struct. 1996;25:29. doi: 10.1146/annurev.bb.25.060196.000333. [DOI] [PubMed] [Google Scholar]
- 47.Wolff SD, Balaban RS. Magn Reson Med. 1989;10:135. doi: 10.1002/mrm.1910100113. [DOI] [PubMed] [Google Scholar]
- 48.Meyerhoff DJ. Magn Reson Med. 1999;42:417. doi: 10.1002/(sici)1522-2594(199909)42:3<417::aid-mrm1>3.0.co;2-t. [DOI] [PubMed] [Google Scholar]
- 49.Leibfritz D, Dreher W. NMR Biomed. 2001;14:65. doi: 10.1002/nbm.681. [DOI] [PubMed] [Google Scholar]
- 50.Gillies RJ. Annu Rev Physiol. 1992;54:733. doi: 10.1146/annurev.ph.54.030192.003505. [DOI] [PubMed] [Google Scholar]
- 51.Wolff SD, Balaban RS. J Magn Reson (1969–1992) 1990;86:164. [Google Scholar]
- 52.Ward KM, Balaban RS. Magn Reson Med. 2000;44:799. doi: 10.1002/1522-2594(200011)44:5<799::aid-mrm18>3.0.co;2-s. [DOI] [PubMed] [Google Scholar]
- 53.Bain AD. Prog Nucl Magn Reson Spectrosc. 2003;43:63. doi: 10.1016/j.pnmrs.2010.12.002. [DOI] [PubMed] [Google Scholar]
- 54.Gutowsky HS, McCall DW, Slichter CP. J Chem Phys. 1953;21:279. [Google Scholar]
- 55.Arnold JT, Packard ME. J Chem Phys. 1951;19:1608. [Google Scholar]
- 56.Liddel U, Ramsey NF. J Chem Phys. 1951;19:1608. [Google Scholar]
- 57.Roberts GCK, Lian L-Y. NMR of Macromolecules: A Practical Approach. Oxford University Press; USA: New York: 1993. p. 153. [Google Scholar]
- 58.Jeener J, Meier BH, Bachmann P, Ernst RR. J Chem Phys. 1979;71:4546. [Google Scholar]
- 59.McConnell HM. J Chem Phys. 1958;28:430. [Google Scholar]
- 60.Johnson CS., Jr Adv Magn Reson. 1966;1:33. [Google Scholar]
- 61.Dempsey CE. Prog Nucl Magn Reson Spectrosc. 2001;39:135. [Google Scholar]
- 62.Desvaux H, Berthault P. Prog Nucl Magn Reson Spectrosc. 1999;35:295. [Google Scholar]
- 63.Forsen S, Hoffman RA. Acta Chem Scand. 1963;17:1787. [Google Scholar]
- 64.Hsieh PS, Balaban RS. J Magn Reson (1969–1992) 1987;74:574. [Google Scholar]
- 65.Guivel-Scharen V, Sinnwell T, Wolff SD, Balaban RS. J Magn Reson. 1998;133:36. doi: 10.1006/jmre.1998.1440. [DOI] [PubMed] [Google Scholar]
- 66.Dagher AP, Aletras A, Choyke P, Balaban RS. J Magn Reson Imaging. 2000;12:745. doi: 10.1002/1522-2586(200011)12:5<745::aid-jmri12>3.0.co;2-h. [DOI] [PubMed] [Google Scholar]
- 67.Woessner DE, Zhang S, Merritt ME, Sherry AD. Magn Reson Med. 2005;53:790. doi: 10.1002/mrm.20408. [DOI] [PubMed] [Google Scholar]
- 68.Bloch F, Hansen WW, Packard M. Phys Rev. 1946;70:474. [Google Scholar]
- 69.Bloch F. Phys Rev. 1946;70:460. [Google Scholar]
- 70.McConnell HM, Thompson DD. J Chem Phys. 1957;26:958. [Google Scholar]
- 71.Baguet E, Roby C. J Magn Reson, Ser A. 1994;108:189. [Google Scholar]
- 72.Baguet E, Roby C. J Magn Reson. 1997;128:149. doi: 10.1006/jmre.1997.1230. [DOI] [PubMed] [Google Scholar]
- 73.Kingsley PB, Monahan WG. J Magn Reson. 2000;143:360. doi: 10.1006/jmre.2000.2018. [DOI] [PubMed] [Google Scholar]
- 74.Kingsley PB, Monahan WG. Magn Reson Med. 2000;43:810. doi: 10.1002/1522-2594(200006)43:6<810::aid-mrm6>3.0.co;2-j. [DOI] [PubMed] [Google Scholar]
- 75.Sun PZ, Van Zijl PCM, Zhou J. J Magn Reson. 2005;175:193. doi: 10.1016/j.jmr.2005.04.005. [DOI] [PubMed] [Google Scholar]
- 76.Forsen S, Hoffman RA. J Chem Phys. 1963;39:2892. [Google Scholar]
- 77.Grad J, Bryant RG. J Magn Reson (1969–1992) 1990;90:1. [Google Scholar]
- 78.Goffeney N, Bulte JWM, Duyn J, Bryant LH, Jr, van Zijl PCM. J Am Chem Soc. 2001;123:8628. doi: 10.1021/ja0158455. [DOI] [PubMed] [Google Scholar]
- 79.Snoussi K, Bulte JWM, Gueron M, van Zijl PCM. Magn Reson Med. 2003;49:998. doi: 10.1002/mrm.10463. [DOI] [PubMed] [Google Scholar]
- 80.Zhou J, Payen JF, Wilson DA, Traystman RJ, van Zijl PCM. Nat Med. 2003;9:1085. doi: 10.1038/nm907. [DOI] [PubMed] [Google Scholar]
- 81.Zhou J, Lal B, Wilson David A, Laterra J, van Zijl Peter CM. Magn Reson Med. 2003;50:1120. doi: 10.1002/mrm.10651. [DOI] [PubMed] [Google Scholar]
- 82.Zhou J, Wilson DA, Sun PZ, Klaus JA, Van Zijl PCM. Magn Reson Med. 2004;51:945. doi: 10.1002/mrm.20048. [DOI] [PubMed] [Google Scholar]
- 83.McMahon MT, Gilad AA, Zhou J, Sun PZ, Bulte JWM, van Zijl PCM. Magn Reson Med. 2006;55:836. doi: 10.1002/mrm.20818. [DOI] [PMC free article] [PubMed] [Google Scholar]
- 84.Aime S, Calabi L, Biondi L, de Miranda M, Ghelli S, Paleari L, Rebaudengo C, Terreno E. Magn Reson Med. 2005;53:830. doi: 10.1002/mrm.20441. [DOI] [PubMed] [Google Scholar]
- 85.De Smedt SC, Demeester J, Hennink WE. Pharm Res. 2000;17:113. doi: 10.1023/a:1007548826495. [DOI] [PubMed] [Google Scholar]
- 86.McMahon Michael T, AAG, DeLiso Marco A, Cromer Stacey M, Jeff Berman, Bulte WM, van Zijl Peter CM. Magn Reson Med. 2008;60:803. doi: 10.1002/mrm.21683. [DOI] [PMC free article] [PubMed] [Google Scholar]
- 87.Gilad Assaf A, Ziv K, McMahon Michael T, van Zijl Peter CM, Neeman M, Bulte Jeff WM. J Nucl Med. 2008;49:1905. doi: 10.2967/jnumed.108.053520. [DOI] [PMC free article] [PubMed] [Google Scholar]
- 88.Stryer L. Biochemistry. 4. W. H. Freeman & Company; New York: 1996. [Google Scholar]
- 89.Magnusson I, Rothman DL, Katz LD, Shulman RG, Shulman GI. J Clin Invest. 1992;90:1323. doi: 10.1172/JCI115997. [DOI] [PMC free article] [PubMed] [Google Scholar]
- 90.Bottomley PA, Hardy CJ, Roemer PB, Mueller OM. Magn Reson Med. 1989;12:348. doi: 10.1002/mrm.1910120307. [DOI] [PubMed] [Google Scholar]
- 91.van Zijl PCM, Jones CK, Ren J, Malloy CR, Sherry AD. Proc Natl Acad Sci. 2007;104:4359. doi: 10.1073/pnas.0700281104. [DOI] [PMC free article] [PubMed] [Google Scholar]
- 92.Helm L, Nicolle GM, Merbach AE. Adv Inorg Chem. 2005;57:327. [Google Scholar]
- 93.Helm L, Merbach AE. Chem Rev. 2005;105:1923. doi: 10.1021/cr030726o. [DOI] [PubMed] [Google Scholar]
- 94.Helm L, Merbach AE. Coord Chem Rev. 1999;187:151. [Google Scholar]
- 95.Habenschuss A, Spedding FH. J Chem Phys. 1979;70:3758. [Google Scholar]
- 96.Habenschuss A, Spedding FH. J Chem Phys. 1979;70:2797. [Google Scholar]
- 97.Helm L, Merbach AE. Eur J Solid State Inorg Chem. 1991;28:245. [Google Scholar]
- 98.Cossy C, Helm L, Powell DH, Merbach AE. New J Chem. 1995;19:27. [Google Scholar]
- 99.Cossy C, Helm L, Merbach AE. Inorg Chim Acta. 1987;139:147. [Google Scholar]
- 100.Cossy C, Helm L, Merbach AE. Inorg Chem. 1988;27:1973. [Google Scholar]
- 101.Cossy C, Helm L, Merbach AE. Inorg Chem. 1989;28:2699. [Google Scholar]
- 102.Micskei K, Powell DH, Helm L, Brucher E, Merbach AE. Magn Reson Chem. 1993;31:1011. [Google Scholar]
- 103.Kowall T, Foglia F, Helm L, Merbach AE. Chem--Eur J. 1996;2:285. [Google Scholar]
- 104.Powell DH, Merbach AE. Magn Reson Chem. 1994;32:739. [Google Scholar]
- 105.Fay DP, Litchinsky D, Purdie N. J Phys Chem. 1969;73:544. [Google Scholar]
- 106.Schwarzenbach G, Gut R. Helv Chim Acta. 1956;39:1589. [Google Scholar]
- 107.Laing M. J Chem Educ. 2009;86:188. [Google Scholar]
- 108.Sinha SP. Helv Chim Acta. 1975;58:1978. [Google Scholar]
- 109.Roy A, Nag K. J Inorg Nucl Chem. 1978;40:331. [Google Scholar]
- 110.Spedding FH, Pikal MJ, Ayers BO. J Phys Chem. 1966;70:2440. [Google Scholar]
- 111.Persson I, D’Angelo P, De Panfilis S, Sandstrom M, Eriksson L. Chem--Eur J. 2008;14:3056. doi: 10.1002/chem.200701281. [DOI] [PubMed] [Google Scholar]
- 112.Micskei K, Helm L, Brucher E, Merbach AE. Inorg Chem. 1993;32:3844. [Google Scholar]
- 113.Aime S, Botta M, Crich SG, Giovenzana G, Pagliarin R, Sisti M, Terreno E. Magn Reson Chem. 1998;36:S200. [Google Scholar]
- 114.Ruloff R, Toth E, Scopelliti R, Tripier R, Handel H, Merbach AE. Chem Commun. 2002:2630. doi: 10.1039/b207713b. [DOI] [PubMed] [Google Scholar]
- 115.Laus S, Ruloff R, Toth E, Merbach AE. Chem--Eur J. 2003;9:3555. doi: 10.1002/chem.200204612. [DOI] [PubMed] [Google Scholar]
- 116.Burai L, Toth E, Merbach AE. Chem Commun. 2003:2680. doi: 10.1039/b308253a. [DOI] [PubMed] [Google Scholar]
- 117.Jaszberenyi Z, Sour A, Toth E, Benmelouka M, Merbach AE. Dalton Trans. 2005:2713. doi: 10.1039/b506702b. [DOI] [PubMed] [Google Scholar]
- 118.Borel A, Helm L, Merbach AE. Chem--Eur J. 2001;7:600. doi: 10.1002/1521-3765(20010202)7:3<600::aid-chem600>3.0.co;2-h. [DOI] [PubMed] [Google Scholar]
- 119.Rudovsky J, Cigler P, Kotek J, Hermann P, Vojtisek P, Lukes I, Peters JA, Vander Elst L, Muller RN. Chem--Eur J. 2005;11:2373. doi: 10.1002/chem.200400367. [DOI] [PubMed] [Google Scholar]
- 120.Lukes I, Kotek J, Vojtisek P, Hermann P. Coord Chem Rev. 2001;216–217:287. [Google Scholar]
- 121.Kalman FK, Baranyai Z, Toth I, Banyai I, Kiraly R, Bruecher E, Aime S, Sun X, Sherry AD, Kovacs Z. Inorg Chem. 2008;47:3851. doi: 10.1021/ic7024704. [DOI] [PubMed] [Google Scholar]
- 122.Vasil’eva VF, Lavrova OY, Dyatlova NM, Yashunskii VG. Zh Obshch Khim. 1966;36:674. [Google Scholar]
- 123.Aime S, Botta M, Ermondi G. Inorg Chem. 1992;31:4291. [Google Scholar]
- 124.Hoeft S, Roth K. Chem Ber. 1993;126:869. [Google Scholar]
- 125.Aime S, Barge A, Bruce JI, Botta M, Howard JAK, Moloney JM, Parker D, de Sousa AS, Woods M. J Am Chem Soc. 1999;121:5762. [Google Scholar]
- 126.Dunand FA, Aime S, Merbach AE. J Am Chem Soc. 2000;122:1506. [Google Scholar]
- 127.Woods M, Aime S, Botta M, Howard JAK, Moloney JM, Navet M, Parker D, Port M, Rousseaux O. J Am Chem Soc. 2000;122:9781. [Google Scholar]
- 128.Dunand FA, Dickins RS, Parker D, Merbach AE. Chem--Eur J. 2001;7:5160. doi: 10.1002/1521-3765(20011203)7:23<5160::aid-chem5160>3.0.co;2-2. [DOI] [PubMed] [Google Scholar]
- 129.Aime S, Botta M, Fasano M, Marques MPM, Geraldes CFGC, Pubanz D, Merbach AE. Inorg Chem. 1997;36:2059. doi: 10.1021/ic961364o. [DOI] [PubMed] [Google Scholar]
- 130.Woods M, Kovacs Z, Zhang S, Sherry AD. Angew Chem, Int Ed. 2003;42:5889. doi: 10.1002/anie.200352234. [DOI] [PubMed] [Google Scholar]
- 131.Pubanz D, Gonzalez G, Powell DH, Merbach AE. Inorg Chem. 1995;34:4447. [Google Scholar]
- 132.Zhang S, Wu K, Sherry AD. J Am Chem Soc. 2002;124:4226. doi: 10.1021/ja017133k. [DOI] [PubMed] [Google Scholar]
- 133.Thompson AL, Parker D, Fulton DA, Howard JAK, Pandya SU, Puschmann H, Senanayake K, Stenson PA, Badari A, Botta M, Avedano S, Aime S. Dalton Trans. 2006:5605. doi: 10.1039/b606206g. [DOI] [PubMed] [Google Scholar]
- 134.Goldfarb AR, Mele A, Gutstein N. J Am Chem Soc. 1955;77:6194. [Google Scholar]
- 135.Kemnitz CR, Loewen MJ. J Am Chem Soc. 2007;129:2521. doi: 10.1021/ja0663024. [DOI] [PubMed] [Google Scholar]
- 136.Toth E, Burai L, Brucher E, Merbach AE. J Chem Soc, Dalton Trans. 1997:1587. [Google Scholar]
- 137.Rojas-Quijano FA, Benyo ET, Tircso G, Kalman FK, Baranyai Z, Aime S, Sherry AD, Kovacs Z. Chem--Eur J. 2009;15:13188. doi: 10.1002/chem.200901095. [DOI] [PMC free article] [PubMed] [Google Scholar]
- 138.Mani T, Tircso G, Togao O, Zhao P, Soesbe TC, Takahashi M, Sherry AD. Contrast Media Mol Imaging. 2009;4:183. doi: 10.1002/cmmi.279. [DOI] [PMC free article] [PubMed] [Google Scholar]
- 139.Parker D, Puschmann H, Batsanov AS, Senanayake K. Inorg Chem. 2003;42:8646. doi: 10.1021/ic030203z. [DOI] [PubMed] [Google Scholar]
- 140.Dickins RS, Howard JAK, Maupin CL, Moloney JM, Parker D, Riehl JP, Siligardi G, Williams JAG. Chem--Eur J. 1999;5:1095. [Google Scholar]
- 141.Amin S, Voss DA, Jr, Horrocks WD, Lake CH, Churchill MR, Morrow JR. Inorg Chem. 1995;34:3294. [Google Scholar]
- 142.Aime S, Barge A, Botta M, Howard JAK, Kataky R, Lowe MP, Moloney JM, Parker D, de Sousa AS. Chem Commun. 1999:1047. [Google Scholar]
- 143.Batsanov AS, Beeby A, Bruce JI, Howard JAK, Kenwright AM, Parker D. Chem Commun. 1999:1011. [Google Scholar]
- 144.Terreno E, Boniforte P, Botta M, Fedeli F, Milone L, Mortillaro A, Aime S. Eur J Inorg Chem. 2003:3530. doi: 10.1021/ic034321y. [DOI] [PubMed] [Google Scholar]
- 145.Ratnakar SJ, Woods M, Lubag AJM, Kovacs Z, Sherry AD. J Am Chem Soc. 2008;130:6. doi: 10.1021/ja076325y. [DOI] [PMC free article] [PubMed] [Google Scholar]
- 146.Aime S, Barge A, Batsanov AS, Botta M, Castelli DD, Fedeli F, Mortillaro A, Parker D, Puschmann H. Chem Commun. 2002:1120. doi: 10.1039/b202862j. [DOI] [PubMed] [Google Scholar]
- 147.Aime S, Botta M, Fasano M, Terreno E. Acc Chem Res. 1999;32:941. [Google Scholar]
- 148.Kalman FK, Woods M, Caravan P, Jurek P, Spiller M, Tircso G, Kiraly R, Bruecher E, Sherry AD. Inorg Chem. 2007;46:5260. doi: 10.1021/ic0702926. [DOI] [PMC free article] [PubMed] [Google Scholar]
- 149.Woods M, Zhang S, Von Howard E, Sherry AD. Chem--Eur J. 2003;9:4634. doi: 10.1002/chem.200305159. [DOI] [PubMed] [Google Scholar]
- 150.Aime S, Barge A, Botta M, De Sousa AS, Parker D. Angew Chem, Int Ed. 1998;37:2673. doi: 10.1002/(SICI)1521-3773(19981016)37:19<2673::AID-ANIE2673>3.0.CO;2-#. [DOI] [PubMed] [Google Scholar]
- 151.Zhang S, Winter P, Wu K, Sherry AD. J Am Chem Soc. 2001;123:1517. doi: 10.1021/ja005820q. [DOI] [PubMed] [Google Scholar]
- 152.Zhang S, Sherry AD. J Solid State Chem. 2003;171:38. [Google Scholar]
- 153.Zhang S, Jiang X, Sherry AD. Helv Chim Acta. 2005;88:923. [Google Scholar]
- 154.Terreno E, Castelli Daniela D, Cravotto G, Milone L, Aime S. Invest Radiol. 2004;39:235. doi: 10.1097/01.rli.0000116607.26372.d0. [DOI] [PubMed] [Google Scholar]
- 155.Zhang S, Michaudet L, Burgess S, Sherry AD. Angew Chem, Int Ed. 2002;41:1919. [PubMed] [Google Scholar]
- 156.Englander SW, Downer NW, Teitelbaum H. Annu Rev Biochem. 1972;41:903. doi: 10.1146/annurev.bi.41.070172.004351. [DOI] [PubMed] [Google Scholar]
- 157.Liepinsh E, Otting G. Magn Reson Med. 1996;35:30. doi: 10.1002/mrm.1910350106. [DOI] [PubMed] [Google Scholar]
- 158.Eriksson MAL, Haerd T, Nilsson L. Biophys J. 1995;69:329. doi: 10.1016/S0006-3495(95)79905-2. [DOI] [PMC free article] [PubMed] [Google Scholar]
- 159.Woodward CK, Hilton BD. Annu Rev Biophys Bioeng. 1979;8:99. doi: 10.1146/annurev.bb.08.060179.000531. [DOI] [PubMed] [Google Scholar]
- 160.Woodward CK, Rosenberg A. J Biol Chem. 1971;246:4103. [PubMed] [Google Scholar]
- 161.Woodward CK, Rosenberg A. J Biol Chem. 1971;246:4112. [PubMed] [Google Scholar]
- 162.Woods M, Woessner DE, Zhao P, Pasha A, Yang MY, Huang CH, Vasalitiy O, Morrow JR, Sherry AD. J Am Chem Soc. 2006;128:10155. doi: 10.1021/ja061498t. [DOI] [PMC free article] [PubMed] [Google Scholar]
- 163.Chin KOA, Morrow JR. Inorg Chem. 1994;33:5036. [Google Scholar]
- 164.Chin KOA, Morrow JR, Lake CH, Churchill MR. Inorg Chem. 1994;33:656. [Google Scholar]
- 165.Chappell LL, Voss DA, Jr, Horrocks WD, Jr, Morrow JR. Inorg Chem. 1998;37:3989. doi: 10.1021/ic980191v. [DOI] [PubMed] [Google Scholar]
- 166.Aime S, Carrera C, Delli Castelli D, Geninatti Crich S, Terreno E. Angew Chem, Int Ed. 2005;44:1813. doi: 10.1002/anie.200462566. [DOI] [PubMed] [Google Scholar]
- 167.Aime S, Barge A, Castelli DD, Fedeli F, Mortillaro A, Nielsen FU, Terreno E. Magn Reson Med. 2002;47:639. doi: 10.1002/mrm.10106. [DOI] [PubMed] [Google Scholar]
- 168.Zhang S, Malloy CR, Sherry AD. J Am Chem Soc. 2005;127:17572. doi: 10.1021/ja053799t. [DOI] [PMC free article] [PubMed] [Google Scholar]
- 169.Trokowski R, Zhang S, Sherry AD. Bioconjugate Chem. 2004;15:1431. doi: 10.1021/bc0498976. [DOI] [PubMed] [Google Scholar]
- 170.Aime S, Delli Castelli D, Fedeli F, Terreno E. J Am Chem Soc. 2002;124:9364. doi: 10.1021/ja0264044. [DOI] [PubMed] [Google Scholar]
- 171.Terreno E, Barge A, Beltrami L, Cravotto G, Delli Castelli D, Fedeli F, Jebasingh B, Aime S. Chem Commun. 2008:600. doi: 10.1039/b715383j. [DOI] [PubMed] [Google Scholar]
- 172.Terreno E, Cabella C, Carrera C, Delli Castelli D, Mazzon R, Rollet S, Stancanello J, Visigalli M, Aime S. Angew Chem, Int Ed. 2007;46:966. doi: 10.1002/anie.200604027. [DOI] [PubMed] [Google Scholar]
- 173.Viswanathan S, Ratnakar SJ, Green KN, Kovacs Z, De Leon-Rodriguez LM, Sherry AD. Angew Chem, Int Ed. 2009;48:9330. doi: 10.1002/anie.200904649. [DOI] [PMC free article] [PubMed] [Google Scholar]
- 174.Jaszberenyi Z, Toth E, Kalai T, Kiraly R, Burai L, Bruecher E, Merbach AE, Hideg K. Dalton Trans. 2005:694. doi: 10.1039/b417272h. [DOI] [PubMed] [Google Scholar]
- 175.Swift TJ, Connick RE. J Chem Phys. 1962;37:307. [Google Scholar]
- 176.Bligh SWA, Chowdhury AHMS, Kennedy D, Luchinat C, Parigi G. Magn Reson Med. 1999;41:767. doi: 10.1002/(sici)1522-2594(199904)41:4<767::aid-mrm16>3.0.co;2-g. [DOI] [PubMed] [Google Scholar]
- 177.Aime S, Botta M, Fasano M, Paoletti S, Anelli PL, Uggeri F, Virtuani M. Inorg Chem. 1994;33:4707. [Google Scholar]
- 178.Dixon TW, Ren J, Lubag A, Ratnakar SJ, Vinogradov E, Hancu I, Lenkinski RE, Sherry AD. Magn Reson Med. 2009 doi: 10.1002/mrm.22242. Accepted. [DOI] [PMC free article] [PubMed] [Google Scholar]
- 179.Tannock IF, Rotin D. Cancer Res. 1989;49:4373. [PubMed] [Google Scholar]
- 180.Vaupel P, Kallinowski F, Okunieff P. Cancer Res. 1989;49:6449. [PubMed] [Google Scholar]
- 181.Lim MH, Xu D, Lippard SJ. Nat Chem Biol. 2006;2:375. doi: 10.1038/nchembio794. [DOI] [PubMed] [Google Scholar]
- 182.Smith RC, Tennyson AG, Won AC, Lippard SJ. Inorg Chem. 2006;45:9367. doi: 10.1021/ic061099z. [DOI] [PubMed] [Google Scholar]
- 183.Que EL, Chang CJ. J Am Chem Soc. 2006;128:15942. doi: 10.1021/ja065264l. [DOI] [PubMed] [Google Scholar]
- 184.Liu G, Li Y, Pagel MD. Magn Reson Med. 2007;58:1249. doi: 10.1002/mrm.21428. [DOI] [PubMed] [Google Scholar]
- 185.Zhang S, Trokowski R, Sherry AD. J Am Chem Soc. 2003;125:15288. doi: 10.1021/ja038345f. [DOI] [PubMed] [Google Scholar]
- 186.Trokowski R, Ren J, Kalman FK, Sherry AD. Angew Chem, Int Ed. 2005;44:6920. doi: 10.1002/anie.200502173. [DOI] [PubMed] [Google Scholar]
- 187.Huang CH, Morrow JR. J Am Chem Soc. 2009;131:4206. doi: 10.1021/ja900290z. [DOI] [PMC free article] [PubMed] [Google Scholar]
- 188.Hilderbrand SA, Lim MH, Lippard SJ. J Am Chem Soc. 2004;126:4972. doi: 10.1021/ja038471j. [DOI] [PubMed] [Google Scholar]
- 189.Lowe MP. Curr Pharm Biotechnol. 2004;5:519. doi: 10.2174/1389201043376562. [DOI] [PubMed] [Google Scholar]
- 190.Perez-Mayoral E, Negri V, Soler-Padros J, Cerdan S, Ballesteros P. Eur J Radiol. 2008;67:453. doi: 10.1016/j.ejrad.2008.02.048. [DOI] [PubMed] [Google Scholar]
- 191.Gillies Robert J, Raghunand N, Garcia-Martin Maria L, Gatenby Robert A. IEEE Eng Med Biol Mag. 2004;23:57. doi: 10.1109/memb.2004.1360409. [DOI] [PubMed] [Google Scholar]
- 192.Quesson B, de Zwart JA, Moonen CT. J Magn Reson Imaging. 2000;12:525. doi: 10.1002/1522-2586(200010)12:4<525::aid-jmri3>3.0.co;2-v. [DOI] [PubMed] [Google Scholar]
- 193.Jayasundar R, Singh VP. Neurol India. 2002;50:436. [PubMed] [Google Scholar]
- 194.Li AX, Wojciechowski F, Suchy M, Jones CK, Hudson RHE, Menon RS, Bartha R. Magn Reson Med. 2008;59:374. doi: 10.1002/mrm.21482. [DOI] [PubMed] [Google Scholar]
- 195.Hindman JC. J Chem Phys. 1966;44:4582. [Google Scholar]
- 196.Casscells W, Hathorn B, David M, Krabach T, Vaughn WK, McAllister HA, Bearman G, Willerson JT. Lancet. 1996;347:1447. doi: 10.1016/s0140-6736(96)91684-0. [DOI] [PubMed] [Google Scholar]
- 197.Ren J, Trokowski R, Zhang S, Malloy CR, Sherry AD. Magn Reson Med. 2008;60:1047. doi: 10.1002/mrm.21722. [DOI] [PMC free article] [PubMed] [Google Scholar]
- 198.Wang J, Thomas DF, Chen A. Anal Chem (Washington, DC, U S) 2008;80:997. doi: 10.1021/ac701790z. [DOI] [PubMed] [Google Scholar]
- 199.Der BS, Dattelbaum JD. Anal Biochem. 2008;375:132. doi: 10.1016/j.ab.2007.11.010. [DOI] [PubMed] [Google Scholar]
- 200.James TD, Sandanayake KRAS, Shinkai S. Supramol Chem. 1995;6:141. [Google Scholar]
- 201.Wang W, Gao X, Wang B. Curr Org Chem. 2002;6:1285. [Google Scholar]
- 202.Shinmori H, Takeuchi M, Shinkai S. J Chem Soc, Perkin Trans 2. 1998:847. [Google Scholar]
- 203.Mizuno T, Takeuchi M, Hamachi I, Nakashima K, Shinkai S. Chem Commun. 1997:1793. [Google Scholar]
- 204.James TD, Sandanayake SKRA, Shinkai S. Angew Chem, Int Ed Engl. 1996;35:1911. [Google Scholar]
- 205.James TD, Linnane P, Shinkai S. Chem Commun. 1996:281. [Google Scholar]
- 206.Criego AB, Tkac I, Kumar A, Thomas W, Gruetter R, Seaquist ER. J Neurosci Res. 2005;82:525. doi: 10.1002/jnr.20654. [DOI] [PubMed] [Google Scholar]
- 207.Williams RJP. Concepts and Models in Bioinorganic Chemistry. Wiley-VCH; Weinheim, Germany: 2006. p. 443. [Google Scholar]
- 208.Emsley J. Nature’s Building Blocks: An A-Z Guide to the Elements. Oxford University Press, USA; New York: 2003. [Google Scholar]
- 209.Hoye AT, Davoren JE, Wipf P, Fink MP, Kagan VE. Acc Chem Res. 2008;41:87. doi: 10.1021/ar700135m. [DOI] [PubMed] [Google Scholar]
- 210.Freeman R, Gill R, Shweky I, Kotler M, Banin U, Willner I. Angew Chem, Int Ed. 2009;48:309. doi: 10.1002/anie.200803421. [DOI] [PubMed] [Google Scholar]
- 211.Patterson GH, Knobel SM, Arkhammar P, Thastrup O, Piston DW. Proc Natl Acad Sci. 2000;97:5203. doi: 10.1073/pnas.090098797. [DOI] [PMC free article] [PubMed] [Google Scholar]
- 212.Vishwasrao HD, Heikal AA, Kasischke KA, Webb WW. J Biol Chem. 2005;280:25119. doi: 10.1074/jbc.M502475200. [DOI] [PubMed] [Google Scholar]
- 213.Denk W, Strickler JH, Webb WW. Science (Washington, DC, U S) 1990;248:73. doi: 10.1126/science.2321027. [DOI] [PubMed] [Google Scholar]
- 214.Hyodo F, Soule BP, Matsumoto K-i, Matusmoto S, Cook JA, Hyodo E, Sowers AL, Krishna MC, Mitchell JB. J Pharm Pharmacol. 2008;60:1049. doi: 10.1211/jpp.60.8.0011. [DOI] [PMC free article] [PubMed] [Google Scholar]
- 215.Hyodo F, Chuang KH, Goloshevsky AG, Sulima A, Griffiths GL, Mitchell JB, Koretsky AP, Krishna MC. J Cereb Blood Flow Metab. 2008;28:1165. doi: 10.1038/jcbfm.2008.5. [DOI] [PMC free article] [PubMed] [Google Scholar]
- 216.Henriksen O, Wieslander S, Gjerris F, Jensen KM. Acta Radiol. 1991;32:95. doi: 10.1177/028418519103200201. [DOI] [PubMed] [Google Scholar]
- 217.Sherry AD, Nunnally RL, Peshock RM. J Biol Chem. 1985;260:9272. [PubMed] [Google Scholar]
- 218.Merritt ME, Harrison C, Storey C, Jeffrey FM, Sherry AD, Malloy CR. Proc Natl Acad Sci. 2007;104:19773. doi: 10.1073/pnas.0706235104. [DOI] [PMC free article] [PubMed] [Google Scholar]
- 219.Culotta E, Koshland DE., Jr Science (New York, NY) 1992;258:1862. doi: 10.1126/science.1361684. [DOI] [PubMed] [Google Scholar]
- 220.Fast W, Nikolic D, Van Breemen RB, Silverman RB. J Am Chem Soc. 1999;121:903. [Google Scholar]
- 221.Fujii H, Wan X, Zhong J, Berliner LJ, Yoshikawa K. Magn Reson Med. 1999;42:235. doi: 10.1002/(sici)1522-2594(199908)42:2<235::aid-mrm4>3.0.co;2-y. [DOI] [PubMed] [Google Scholar]
- 222.Gow AJ. Am J Respir Cell Mol Biol. 2005;32:479. doi: 10.1165/rcmb.F299. [DOI] [PubMed] [Google Scholar]
- 223.Hambidge KM, Krebs NF. J Nutr. 2007;137:1101. doi: 10.1093/jn/137.4.1101. [DOI] [PubMed] [Google Scholar]
- 224.Yoo B, Raam MS, Rosenblum RM, Pagel MD. Contrast Media Mol Imaging. 2007;2:189. doi: 10.1002/cmmi.145. [DOI] [PubMed] [Google Scholar]
- 225.Yoo B, Pagel MD. J Am Chem Soc. 2006;128:14032. doi: 10.1021/ja063874f. [DOI] [PubMed] [Google Scholar]
- 226.Chauvin T, Durand P, Bernier M, Meudal H, Doan BT, Noury F, Badet B, Beloeil JC, Toth E. Angew Chem, Int Ed. 2008;47:4370. doi: 10.1002/anie.200800809. [DOI] [PubMed] [Google Scholar]
- 227.Caravan P, Greenfield MT, Li X, Sherry AD. Inorg Chem. 2001;40:6580. doi: 10.1021/ic0102900. [DOI] [PubMed] [Google Scholar]
- 228.Aime S, Botta M, Fasano M, Crich SG, Terreno E. JBIC, J Biol Inorg Chem. 1996;1:312. [Google Scholar]
- 229.Langereis S, de Lussanet QG, van Genderen MHP, Meijer EW, Beets-Tan RGH, Griffioen AW, van Engelshoven JMA, Backes WH. NMR Biomed. 2006;19:133. doi: 10.1002/nbm.1015. [DOI] [PubMed] [Google Scholar]
- 230.Caravan P. Acc Chem Res. 2009;42:851. doi: 10.1021/ar800220p. [DOI] [PubMed] [Google Scholar]
- 231.Aime S, Chiaussa M, Digilio G, Gianolio E, Terreno E. JBIC, J Biol Inorg Chem. 1999;4:766. doi: 10.1007/s007750050349. [DOI] [PubMed] [Google Scholar]
- 232.Ali MM, Woods M, Suh EH, Kovacs Z, Tircso G, Zhao P, Kodibagkar VD, Sherry AD. JBIC, J Biol Inorg Chem. 2007;12:855. doi: 10.1007/s00775-007-0240-z. [DOI] [PMC free article] [PubMed] [Google Scholar]
- 233.De Leon-Rodriguez LM, Kovacs Z, Sherry AD. Lett Org Chem. 2005;2:160. [Google Scholar]
- 234.De Leon-Rodriguez LM, Kovacs Z. Bioconjugate Chem. 2008;19:391. doi: 10.1021/bc700328s. [DOI] [PubMed] [Google Scholar]
- 235.Wojciechowski F, Suchy M, Li AX, Azab HA, Bartha R, Hudson RHE. Bioconjugate Chem. 2007;18:1625. doi: 10.1021/bc0701287. [DOI] [PubMed] [Google Scholar]
- 236.Suchy M, Li AX, Bartha R, Hudson RHE. Bioorg Med Chem. 2008;16:6156. doi: 10.1016/j.bmc.2008.04.038. [DOI] [PubMed] [Google Scholar]
- 237.Suchy M, Li AX, Bartha R, Hudson RHE. Org Biomol Chem. 2008;6:3588. doi: 10.1039/b808282k. [DOI] [PubMed] [Google Scholar]
- 238.Aime S, Delli Castelli D, Terreno E. Angew Chem, Int Ed. 2003;42:4527. doi: 10.1002/anie.200352132. [DOI] [PubMed] [Google Scholar]
- 239.Aime S, Caravan P. Journal of magnetic resonance imaging: JMRI. 2009;30:1259. doi: 10.1002/jmri.21969. [DOI] [PMC free article] [PubMed] [Google Scholar]
- 240.Frayne R, Omary RA, Unal O, Strother CM. Journal of vascular and interventional radiology: JVIR. 2000;11:1277. doi: 10.1016/s1051-0443(07)61301-3. [DOI] [PubMed] [Google Scholar]
- 241.Wu Y, Zhou Y, Ouari O, Woods M, Zhao P, Soesbe TC, Kiefer GE, Sherry AD. J Am Chem Soc. 2008;130:13854. doi: 10.1021/ja805775u. [DOI] [PMC free article] [PubMed] [Google Scholar]
- 242.Li X, Zhang S, Zhao P, Kovacs Z, Sherry AD. Inorg Chem. 2001;40:6572. doi: 10.1021/ic010291s. [DOI] [PubMed] [Google Scholar]
- 243.Cockerill AF, Davies GLO, Harden RC, Rackham DM. Chem Rev. 1973;73:553. [Google Scholar]
- 244.Ren J, Springer CS, Jr, Sherry AD. Inorg Chem. 1997;36:3493. doi: 10.1021/ic970128q. [DOI] [PubMed] [Google Scholar]
- 245.Pikkemaat JA, Wegh RT, Lamerichs R, van de Molengraaf RA, Langereis S, Burdinski D, Raymond AYF, Janssen HM, de Waal BFM, Willard NP, Meijer EW, Gruell H. Contrast Media Mol Imaging. 2007;2:229. doi: 10.1002/cmmi.149. [DOI] [PubMed] [Google Scholar]
- 246.Aime S, Castelli DD, Terreno E. Angew Chem, Int Ed. 2005;44:5513. doi: 10.1002/anie.200501473. [DOI] [PubMed] [Google Scholar]
- 247.Vasalatiy O, Zhao P, Zhang S, Aime S, Sherry AD. Contrast Media Mol Imaging. 2006;1:10. doi: 10.1002/cmmi.93. [DOI] [PubMed] [Google Scholar]
- 248.Bangham AD, Standish MM, Watkins JC. J Mol Biol. 1965;13:238. doi: 10.1016/s0022-2836(65)80093-6. [DOI] [PubMed] [Google Scholar]
- 249.Glogard C, Stensrud G, Aime S. Magn Reson Chem. 2003;41:585. [Google Scholar]
- 250.Menager C, Cabuil V. J Phys Chem B. 2002;106:7913. doi: 10.1021/jp711811u. [DOI] [PubMed] [Google Scholar]
- 251.Boroske E, Elwenspoek M, Helfrich W. Biophys J. 1981;34:95. doi: 10.1016/S0006-3495(81)84839-4. [DOI] [PMC free article] [PubMed] [Google Scholar]
- 252.Delli Castelli D, Terreno E, Carrera C, Giovenzana GB, Mazzon R, Rollet S, Visigalli M, Aime S. Inorg Chem. 2008;47:2928. doi: 10.1021/ic702501y. [DOI] [PubMed] [Google Scholar]
- 253.Terreno E, Delli Castelli D, Violante E, Sanders HMHF, Sommerdijk NAJM, Aime S. Chem--Eur J. 2009;15:1440. doi: 10.1002/chem.200801766. [DOI] [PubMed] [Google Scholar]
- 254.Terreno E, Castelli DD, Milone L, Rollet S, Stancanello J, Violante E, Aime S. Contrast Media Mol Imaging. 2008;3:38. doi: 10.1002/cmmi.225. [DOI] [PubMed] [Google Scholar]
- 255.Zhao JM, Har-el Y-e, McMahon MT, Zhou J, Sherry AD, Sgouros G, Bulte JWM, van Zijl PCM. J Am Chem Soc. 2008;130:5178. doi: 10.1021/ja710159q. [DOI] [PMC free article] [PubMed] [Google Scholar]
- 256.Langereis S, Keupp J, van Velthoven JLJ, de Roos IHC, Burdinski D, Pikkemaat JA, Gruell H. J Am Chem Soc. 2009;131:1380. doi: 10.1021/ja8087532. [DOI] [PubMed] [Google Scholar]
- 257.Aime S, Frullano L, Geninatti Crich S. Angew Chem, Int Ed. 2002;41:1017. doi: 10.1002/1521-3773(20020315)41:6<1017::aid-anie1017>3.0.co;2-p. [DOI] [PubMed] [Google Scholar]
- 258.Winter PM, Cai K, Chen J, Adair CR, Kiefer GE, Athey PS, Gaffney PJ, Buff CE, Robertson JD, Caruthers SD, Wickline SA, Lanza GM. Magn Reson Med. 2006;56:1384. doi: 10.1002/mrm.21093. [DOI] [PMC free article] [PubMed] [Google Scholar]
- 259.Winter PM, Caruthers SD, Yu X, Song SK, Chen J, Miller B, Bulte JWM, Robertson JD, Gaffney PJ, Wickline SA, Lanza GM. Magn Reson Med. 2003;50:411. doi: 10.1002/mrm.10532. [DOI] [PubMed] [Google Scholar]
- 260.Haag R, Kratz F. Angew Chem, Int Ed. 2006;45:1198. doi: 10.1002/anie.200502113. [DOI] [PubMed] [Google Scholar]
- 261.Liu S, Maheshwari R, Kiick KL. Macromolecules. 2009;42:3. doi: 10.1021/ma801782q. [DOI] [PMC free article] [PubMed] [Google Scholar]
- 262.Wang W, Alexander C. Angew Chem, Int Ed. 2008;47:7804. doi: 10.1002/anie.200802474. [DOI] [PubMed] [Google Scholar]
- 263.Zhang S, Kovacs Z, Burgess S, Aime S, Terreno E, Sherry AD. Chem--Eur J. 2001;7:288. doi: 10.1002/1521-3765(20010105)7:1<288::aid-chem288>3.0.co;2-6. [DOI] [PubMed] [Google Scholar]
- 264.Pasha A, Lin M, Tircso G, Rostollan CL, Woods M, Kiefer GE, Sherry AD, Sun X. JBIC, J Biol Inorg Chem. 2009;14:421. doi: 10.1007/s00775-008-0459-3. [DOI] [PMC free article] [PubMed] [Google Scholar]
- 265.Amin S, Morrow JR, Lake CH, Churchill MR. Angew Chem. 1994;106:824. [Google Scholar]
- 266.Suchy M, Hudson RHE. Eur J Org Chem. 2008:4847. [Google Scholar]
- 267.Denat F, Brandes S, Guilard R. Synlett. 2000:561. [Google Scholar]
- 268.De Leon-Rodriguez LM, Viswanathan S, Sherry AD. Contrast Media Mol Imaging. 2010 doi: 10.1002/cmmi.371. Accepted. [DOI] [PMC free article] [PubMed] [Google Scholar]
- 269.Yoo B, Pagel MD. Bioconjugate Chem. 2007;18:903. doi: 10.1021/bc060250q. [DOI] [PMC free article] [PubMed] [Google Scholar]
- 270.Adair C, Woods M, Zhao P, Pasha A, Winter PM, Lanza GM, Athey P, Sherry AD, Kiefer GE. Contrast Media Mol Imaging. 2007;2:55. doi: 10.1002/cmmi.125. [DOI] [PubMed] [Google Scholar]
- 271.Sherry AD, Caravan P, Lenkinski Robert E. Journal of magnetic resonance imaging: JMRI. 2009;30:1240. doi: 10.1002/jmri.21966. [DOI] [PMC free article] [PubMed] [Google Scholar]
- 272.Alderighi L, Bianchi A, Calabi L, Dapporto P, Giorgi C, Losi P, Paleari L, Paoli P, Rossi P, Valtancoli B, Virtuani M. Eur J Inorg Chem. 1998:1581. [Google Scholar]
- 273.Bianchi A, Calabi L, Giorgi C, Losi P, Mariani P, Paoli P, Rossi P, Valtancoli B, Virtuani M. Dalton Trans. 2000:697. [Google Scholar]
- 274.Pasha A, Tircso G, Benyo ET, Brucher E, Sherry AD. Eur J Inorg Chem. 2007:4340. doi: 10.1002/ejic.200700354. [DOI] [PMC free article] [PubMed] [Google Scholar]
- 275.Baranyai Z, Bruecher E, Ivanyi T, Kiraly R, Lazar I, Zekany L. Helv Chim Acta. 2005;88:604. [Google Scholar]
- 276.Baranyai Z, Banyai I, Brucher E, Kiraly R, Terreno E. Eur J Inorg Chem. 2007:3639. [Google Scholar]
- 277.Kasprzyk SP, Wilkins RG. Inorg Chem. 1982;21:3349. [Google Scholar]
- 278.Bruecher E, Sherry DA. Chemistry of Contrast Agents in Medical Magnetic Resonance Imaging. Wiley; Germany: 2001. p. 243. [Google Scholar]
- 279.Moreau J, Guillon E, Pierrard JC, Rimbault J, Port M, Aplincourt M. Chem--Eur J. 2004;10:5218. doi: 10.1002/chem.200400006. [DOI] [PubMed] [Google Scholar]
- 280.Toth E, Brucher E, Lazar I, Toth I. Inorg Chem. 1994;33:4070. [Google Scholar]
- 281.Burai L, Fabian I, Kiraly R, Szilagyi E, Brucher E. J Chem Soc, Dalton Trans. 1998:243. [Google Scholar]
- 282.Stenson PA, Thompson AL, Parker D. Dalton Trans. 2006:3291. doi: 10.1039/b605876k. [DOI] [PubMed] [Google Scholar]
- 283.Woods M, Caravan P, Geraldes CFGC, Greenfield MT, Kiefer GE, Lin M, McMillan K, Prata MIM, Santos AC, Sun X, Wang J, Zhang S, Zhao P, Sherry AD. Invest Radiol. 2008;43:861. doi: 10.1097/RLI.0b013e318186531d. [DOI] [PMC free article] [PubMed] [Google Scholar]
- 284.Arvela P. Progress in Pharmacology. 1979;2:69. [Google Scholar]
- 285.Newton Ben B, Jimenez Sergio A. Journal of magnetic resonance imaging: JMRI. 2009;30:1277. doi: 10.1002/jmri.21980. [DOI] [PubMed] [Google Scholar]
- 286.Galan A, Cowper Shawn E, Bucala R. Current opinion in rheumatology. 2006;18:614. doi: 10.1097/01.bor.0000245725.94887.8d. [DOI] [PubMed] [Google Scholar]
- 287.Leiner T, Kucharczyk W. Journal of magnetic resonance imaging: JMRI. 2009;30:1233. doi: 10.1002/jmri.21985. [DOI] [PubMed] [Google Scholar]
- 288.Weinreb Jeffrey C, Abu-Alfa Ali K. Journal of magnetic resonance imaging: JMRI. 2009;30:1236. doi: 10.1002/jmri.21979. [DOI] [PubMed] [Google Scholar]
- 289.Joffe P, Thomsen HS, Meusel M. Acad Radiol. 1998;5:491. doi: 10.1016/s1076-6332(98)80191-8. [DOI] [PubMed] [Google Scholar]
- 290.Schuhmann-Giampieri G, Krestin G. Invest Radiol. 1991;26:975. doi: 10.1097/00004424-199111000-00009. [DOI] [PubMed] [Google Scholar]
- 291.Tombach B, Bremer C, Reimer P, Schaefer RM, Ebert W, Geens V, Heindel W. Invest Radiol. 2000;35:35. doi: 10.1097/00004424-200001000-00004. [DOI] [PubMed] [Google Scholar]
- 292.Idee JM, Port M, Robic C, Medina C, Sabatou M, Corot C. Journal of magnetic resonance imaging: JMRI. 2009;30:1249. doi: 10.1002/jmri.21967. [DOI] [PubMed] [Google Scholar]
- 293.Port M, Idee JM, Medina C, Robic C, Sabatou M, Corot C. BioMetals. 2008;21:469. doi: 10.1007/s10534-008-9135-x. [DOI] [PubMed] [Google Scholar]
- 294.Wedeking P, Kumar K, Tweedle MF. Magn Reson Imaging. 1992;10:641. doi: 10.1016/0730-725x(92)90016-s. [DOI] [PubMed] [Google Scholar]
- 295.Li AX, Hudson RHE, Barrett JW, Jones CK, Pasternak SH, Bartha R. Magn Reson Med. 2008;60:1197. doi: 10.1002/mrm.21752. [DOI] [PubMed] [Google Scholar]
- 296.Yarnykh Vasily L. Magn Reson Med. 2002;47:929. doi: 10.1002/mrm.10120. [DOI] [PubMed] [Google Scholar]
- 297.Liu G, Ali MM, Yoo B, Griswold Mark A, Tkach Jean A, Pagel Mark D. Magn Reson Med. 2009;61:399. doi: 10.1002/mrm.21863. [DOI] [PMC free article] [PubMed] [Google Scholar]
- 298.Haase A, Frahm J, Matthaei D, Haenicke W, Merboldt KD. J Magn Reson (1969–1992) 1986;67:258. [Google Scholar]
- 299.Hennig J, Friedburg H. Magn Reson Imaging. 1988;6:391. doi: 10.1016/0730-725x(88)90475-4. [DOI] [PubMed] [Google Scholar]
- 300.Hennig J, Nauerth A, Friedburg H. Magn Reson Med. 1986;3:823. doi: 10.1002/mrm.1910030602. [DOI] [PubMed] [Google Scholar]
- 301.Michaeli S, Sorce DJ, Idiyatullin D, Ugurbil K, Garwood M. J Magn Reson. 2004;169:293. doi: 10.1016/j.jmr.2004.05.010. [DOI] [PubMed] [Google Scholar]
- 302.Idiyatullin D, Michaeli S, Garwood M. J Magn Reson. 2004;171:330. doi: 10.1016/j.jmr.2004.09.008. [DOI] [PubMed] [Google Scholar]
- 303.Vinogradov E, Zhang S, Lubag A, Balschi JA, Sherry AD, Lenkinski RE. J Magn Reson. 2005;176:54. doi: 10.1016/j.jmr.2005.05.016. [DOI] [PubMed] [Google Scholar]
- 304.Aime S, Nano R, Grandi M. Invest Radiol. 1988;23:S267. doi: 10.1097/00004424-198809001-00058. [DOI] [PubMed] [Google Scholar]
- 305.Hu BS, Conolly SM, Wright GA, Nishimura DG, Macovski A. Magn Reson Med. 1992;26:231. doi: 10.1002/mrm.1910260205. [DOI] [PubMed] [Google Scholar]
- 306.Schneider E, Prost RW, Glover GH. J Magn Reson Imaging. 1993;3:417. doi: 10.1002/jmri.1880030218. [DOI] [PubMed] [Google Scholar]
- 307.Graham SJ, Henkelman RM. J Magn Reson Imaging. 1997;7:903. doi: 10.1002/jmri.1880070520. [DOI] [PubMed] [Google Scholar]
- 308.Shaka AJ, Keeler J, Frenkiel T, Freeman R. J Magn Reson (1969–1992) 1983;52:335. [Google Scholar]
- 309.Shaka AJ, Keeler J, Freeman R. J Magn Reson (1969–1992) 1983;53:313. [Google Scholar]
- 310.Caravan P, Toth E, Rockenbauer A, Merbach AE. J Am Chem Soc. 1999;121:10403. [Google Scholar]
- 311.Burai L, Toth E, Seibig S, Scopelliti R, Merbach AE. Chem--Eur J. 2000;6:3761. doi: 10.1002/1521-3765(20001016)6:20<3761::aid-chem3761>3.0.co;2-6. [DOI] [PubMed] [Google Scholar]
- 312.Bertini I, Capozzi F, Luchinat C, Nicastro G, Xia Z. J Phys Chem. 1993;97:6351. [Google Scholar]
- 313.Vega AJ, Fiat D. Mol Phys. 1976;31:347. [Google Scholar]
- 314.Vander Elst L, Roch A, Gillis P, Laurent S, Botteman F, Bulte Jeff WM, Muller Robert N. Magn Reson Med. 2002;47:1121. doi: 10.1002/mrm.10163. [DOI] [PubMed] [Google Scholar]
- 315.Caravan P, Greenfield MT, Bulte JWM. Magn Reson Med. 2001;46:917. doi: 10.1002/mrm.1277. [DOI] [PubMed] [Google Scholar]
- 316.Saeed M, Wendland MF, Masui T, Higgins CB. Magn Reson Med. 1994;31:31. doi: 10.1002/mrm.1910310105. [DOI] [PubMed] [Google Scholar]
- 317.Saeed M, Wendland MF, Tomei E, Rocklage SM, Quay SC, Moseley ME, Wolfe C, Higgins CB. Radiology. 1989;173:763. doi: 10.1148/radiology.173.3.2813783. [DOI] [PubMed] [Google Scholar]
- 318.Bulte JWM, Wu C, Brechbiel MW, Brooks RA, Vymazal J, Holla M, Frank JA. Invest Radiol. 1998;33:841. doi: 10.1097/00004424-199811000-00008. [DOI] [PubMed] [Google Scholar]
- 319.Martell AE, Smith RM, Motekaitis RJ. Software Version of Critically Selected Stability Constants; Version 80. 2004. [Google Scholar]
- 320.Brucher E, Laurenczy G, Makra Z. Inorg Chim Acta. 1987;139:141. [Google Scholar]
- 321.Wang X, Jin T, Comblin V, Lopez-Mut A, Merciny E, Desreux JF. Inorg Chem. 1992;31:1095. [Google Scholar]
- 322.Toth E, Burai L, Merbach AE. Coord Chem Rev. 2001;216–217:363. [Google Scholar]
- 323.Burai L, Scopelliti R, Toth E. Chemical Communications. Cambridge, United Kingdom: 2002. p. 2366. [DOI] [PubMed] [Google Scholar]
- 324.Burai L, Toth E, Moreau G, Sour A, Scopelliti R, Merbach AE. Chem--Eur J. 2003;9:1394. doi: 10.1002/chem.200390159. [DOI] [PubMed] [Google Scholar]
- 325.Dunand FA, Borel A, Helm L. Inorg Chem Commun. 2002;5:811. [Google Scholar]
- 326.Gonzalez G, Powell DH, Tissieres V, Merbach AE. J Phys Chem. 1994;98:53. [Google Scholar]
- 327.Laurent S, Vander Elst L, Muller RN. Contrast Media Mol Imaging. 2006;1:128. doi: 10.1002/cmmi.100. [DOI] [PubMed] [Google Scholar]
- 328.Vander Elst L, Zhang S, Sherry AD, Laurent S, Botteman F, Muller RN. Acad Radiol. 2002;9(Suppl 2):S297. doi: 10.1016/s1076-6332(03)80208-8. [DOI] [PubMed] [Google Scholar]
- 329.Zhang S, Wu K, Sherry AD. Angew Chem, Int Ed. 1999;38:3192. [PubMed] [Google Scholar]
- 330.Laurent S, Vander Elst L, Botteman F, Muller RN. Eur J Inorg Chem. 2008:4369. [Google Scholar]
- 331.Zhang S, Wu K, Sherry AD. Invest Radiol. 2001;36:82. doi: 10.1097/00004424-200102000-00003. [DOI] [PubMed] [Google Scholar]
- 332.Vinogradov E, He H, Lubag A, Balschi JA, Sherry AD, Lenkinski RE. Magn Reson Med. 2007;58:650. doi: 10.1002/mrm.21393. [DOI] [PubMed] [Google Scholar]