Abstract
We present a comparison of the computer simulation data of gyroid nanostructures with optical measurements (reflectivity spectra and scattering diagrams) of ventral wing scales of the Green Hairstreak butterfly, Callophrys rubi. We demonstrate that the omnidirectional green colour arises from the gyroid cuticular structure grown in the domains of different orientation. We also show that this three-dimensional structure, operating as a biophotonic crystal, gives rise to various polarization effects. We briefly discuss the possible biological utility of the green coloration and polarization effects.
Keywords: structural colour, butterflies, Lycaenidae, gyroid, photonic bandgap materials
1. Introduction
Butterflies are well known for their brilliant and often iridescent colours (Vukusic & Sambles 2003), but some species have perfectly cryptic coloration to protect themselves from predators (Kertész et al. 2006). A striking example is the Green Hairstreak, Callophrys rubi (Linnaeus 1758), a small butterfly that can be found in a wide range of habitats including rough shrubby grasslands, meadows, heathland, woodland and forest edges throughout Europe, Asia and Siberia (Asher et al. 2001). The sexes of C. rubi are very similar in appearance: the wings are dull brown on the upper side (dorsal side) and bright matte-green on the underside (ventral side). Under an Atlantic climate, one generation is produced each year, but in many parts of the Palaearctic region C. rubi has two generations. The flight period is concentrated between May and early June or somewhat later, depending on the region of origin (Asher et al. 2001). During this time of the year, the vegetation still shows its bright spring green coloration. The resting places and perching sites of C. rubi are usually green leaves. While resting or perching, C. rubi closes its wings, so that the green-coloured ventral sides of its wings make it virtually invisible.
The green coloration has been attributed to the presence of a three-dimensional lattice structure organized in irregular domains (Morris 1975; Ghiradella & Radigan 1976; Jones & Tilley 1999; Tilley 2000), but a quantitative analysis of the relation between the reflectivity and the three-dimensional structure has remained elusive. Recently, we identified the cuticular structure in the ventral wing scales of C. rubi as a gyroid (Michielsen & Stavenga 2008), a promising structure for biomimetic applications (Parker & Townley 2007), such as replication (Huang et al. 2006; Gaillot et al. 2008) into three-dimensional photonic structures.
In this paper, we compare finite-difference time-domain (FDTD) (Taflove & Hagness 2005) simulation data with the measured reflectivity spectra and scattering diagrams of the ventral wing scales of C. rubi and demonstrate that its camouflaging omnidirectional green colour arises from the gyroid cuticular structure grown in the domains of different orientation. We also show that this three-dimensional structure, operating as a biophotonic crystal, gives rise to various polarization effects. In general, the response of insects to polarized light may be direct, indirect via different patterns of reflection from a substrate, or both. We suggest that C. rubi may respond to (polarized) sunlight in the process of perching similar to the lycaenid Mitoura gryneus (Hübner 1819) (Johnson & Borgo 1976), a butterfly living in North America, closely related to and also having bright green ventral wings like C. rubi but with a variable amount of brown scaling. The ventral wing scales of M. gryneus have a gyroid structure equivalent to that of C. rubi (Michielsen & Stavenga 2008). Statistical data on the changes in the perching behaviour of M. gryneus with the time of day and on perching postures support the assumption that the butterfly orients with respect to the electric vector of the sunlight and the position of the sun (Johnson & Borgo 1976). As the perching sites of both M. gryneus and C. rubi are usually green leaves, we suggest that their green colour allows them to find mates using polarization signals for intraspecific communication while remaining camouflaged to their predators, birds with polarization-insensitive eyes.
2. Green coloration
The C. rubi butterflies we investigated were obtained from Dr I. Osipov (http://rusinsects.com/main.htm). All specimens came from a Palaearctic region (South Ural) and were of the male sex.
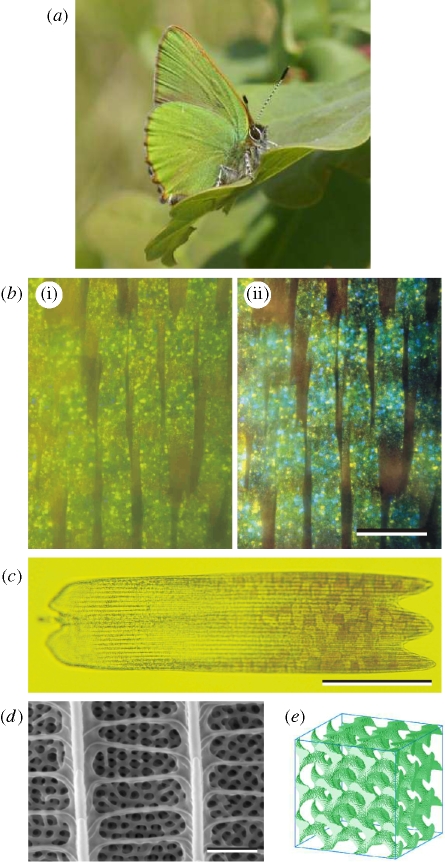
Butterfly scales are attached to the wing in rows like shingles on a roof, so that only the distal parts of the scales show. In reflected light, the resulting wing colour of C. rubi matches closely that of the plants on which the animal may rest or perch (figure 1a). A closer look at the scales reveals bright blue-, green- or yellow-coloured spots on their visible distal parts (figure 1b). A similar coloration has been observed in the ventral wings of Cyanophrys remus (Kertész et al. 2006), another lycaenid. The brownish proximal parts of the scales near the root with which the scale is attached to the wing act as a dark background and hence have no direct influence on the overall colour appearance of the wing. The bright coloured spots on the distal parts of the scales vary in intensity and colour with the direction of illumination and observation. This indicates that the origin of these local colours is structural (Kinoshita et al. 2008).
Figure 1.
(a) C. rubi in the resting position on an oak leaf, showing the green-coloured ventral face of its wings (photography Bea Koetsier). The green colour ensures excellent camouflage in its natural habitat. (b) Optical micrograph of a small region of ventral wing scales taken in reflection. b(i) Illumination with linearly polarized white light while the image was captured through a parallel linear analyser; b(ii) same as in b(i) but the image was captured through a crossed linear analyser. Green, blue and yellow spots can be identified. Scale bar, 100 µm. (c) Optical micrograph of a single ventral wing scale taken in transmission. Several domains are observed across the distal part of the scale. The dark longitudinal lines are the ridges. Scale bar, 50 µm. (d) Scanning electron micrograph of part of a scale. Scale bar, 1 µm. Below the network of ridges and crossribs, a three-dimensional cuticular structure is seen. (e) Gyroid structure modelling the cuticular structure (16 cubic unit cells).
In transmitted light, the distal parts of the ventral scales clearly exhibit distinct irregular domains (figure 1c) corresponding to the coloured spots observed in reflection (Onslow 1923; Vukusic & Sambles 2001). Scanning electron microscopy (SEM) shows that the scale has the usual arrangement of ridges and crossribs and that the interior is packed with a three-dimensional ordered lattice of cuticle (figure 1d). Morris (1975), who studied single wing scales, applying light microscopy and transmission electron microscopy (TEM), concluded that they are composed of a mosaic of irregular polygonal domains, with a mean grain diameter of 5.4 µm, and that the inside of the domains consists of a simple cubic network with lattice constant 0.257 µm and an average thickness of four lattice units. Ghiradella & Radigan (1976) concluded from more detailed TEM studies that the internal cuticular lattice was face-centred cubic (FCC) and not simple cubic. They also noticed that the cuticular lattice in the proximal part of the scale is irregular, incomplete and shallow, thus causing the lack of domains with structured cuticle (figure 1c) and hence bright coloration (figure 1b). We recently re-examined the TEM images and found that the cuticular lattice in the scales of C. rubi approximates a gyroid structure having a body-centred Bravais lattice symmetry, with a cuticle volume fraction of 0.17 and a lattice constant of 363 nm (figure 1e) (Michielsen & Stavenga 2008). Also, other recent structural studies have revealed that the cuticular structure can be described by a gyroid (Hyde et al. 2008). We also suggested that other lycaenids such as C. remus and M. gryneus have scales with gyroid structures similar to those of C. rubi (Michielsen & Stavenga 2008).
For a large range of volume fractions, the gyroid structure acts as a three-dimensional photonic crystal when the refractive index contrast between the two dielectric components becomes sufficiently large (n/n′ ≥ 2.5) (Martín-Moreno et al. 1999; Babin et al. 2002; Maldovan et al. 2002; Michielsen & Kole 2003). The gyroid structures in the butterfly wing scales, consisting of air and chitin, have a contrast of n/n′ = 1.55 + i0.06 (Vukusic et al. 1999) and therefore the gyroid cuticular structure in the scales of C. rubi may be described as a biophotonic crystal with only partial bandgaps for particular light directions or for some polarizations. Band structure calculations predict that the chiral gyroid structure reflects circularly polarized light in certain directions, particularly in the shorter wavelength ranges (Poladian et al. 2009).
Evidence for the gyroid cuticular structure causing the omnidirectional green coloration of C. rubi comes from three-dimensional FDTD calculations for light scattering from differently oriented finite gyroid structures. We modelled the cuticle–air gyroid structure by the refractive index n(X,Y, Z) = 1.55 + i0.06 if f(X,Y, Z) < 0.17 for the volume filled with cuticle and n(X,Y, Z) = 1 if f(X,Y, Z) ≥ 0.17, for the volume filled with air, where f(X,Y, Z) = sin X cos Y + sin Y cos Z + cos X sin Z (see Michielsen & Stavenga 2008). X = 2πx/a, Y = 2πy/a, Z = 2πz/a, where (x,y,z) are the positions in the cubic structure with lattice constant a = 363 nm. We considered simulation boxes (with perfectly matched layer absorbing boundaries (Taflove & Hagness 2005)) with a linear dimension of 16a and gyroid structures with a thickness 6a corresponding to the average size of one domain and the thickness of the scale of C. rubi, respectively. The domains in the scale are modelled as cutting surfaces, described with the Miller indices (h k l), of the cubic gyroid structure. Within the simulation box, we oriented the gyroid structure such that the predefined cutting surface formed the interface between the air and the gyroid structure. Computer simulation of light reflected from gyroid structures was carried out using TDME3D, a massively parallel three-dimensional FDTD Maxwell solver. One calculation (one wavelength, one angle of incidence and one type of polarization) requires a memory of approximately 260 GB (approx. equal to 1.5 × 10⁹ lattice points). Computations were performed on the IBM BlueGene/P at the University of Groningen. Each calculation used 2048 CPUs with the elapsed time varying between 3000 and 12 000 s.
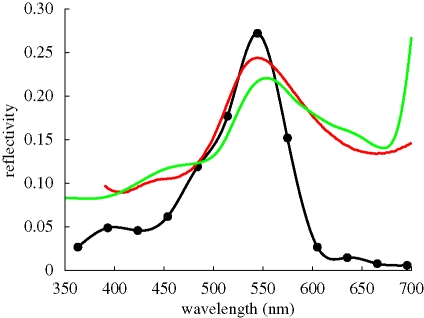
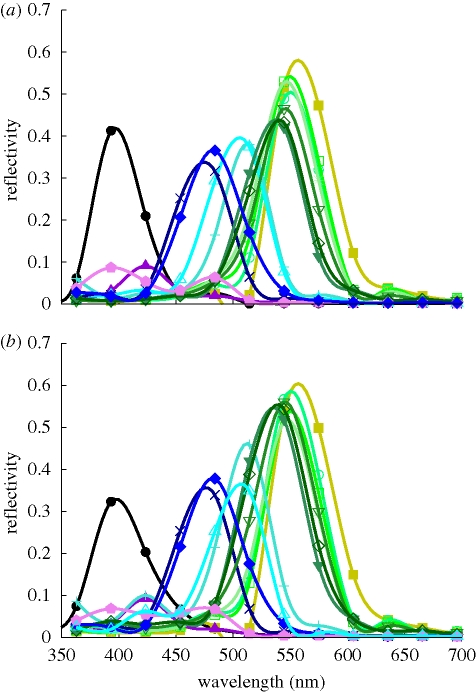
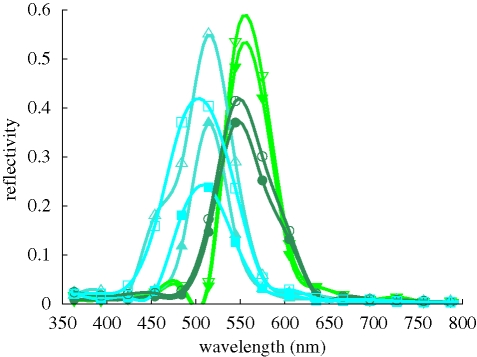
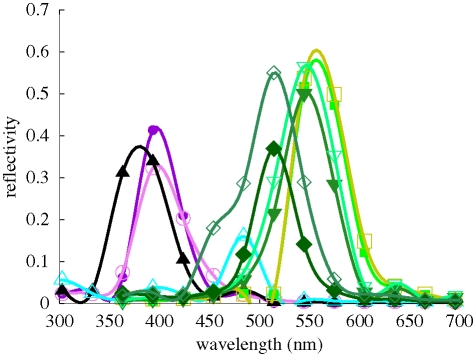
Reflectivity spectra measured with a microspectrophotometer (Vukusic & Stavenga 2009; Wilts et al. 2009) or a scatterometer (Stavenga et al. 2009) on the ventral wing scales of C. rubi vary with the position of the scale with respect to the measuring apparatus and are therefore not unique. Representative examples of the reflectivity spectra show that they peak at about 545 nm (figure 2), corresponding to the green coloration of the leaves (figure 2; see also figure 1a), a good indication for the camouflaging properties of the ventral wings. The measured reflectivity is a result of light scattered from various differently oriented domains within the scale. The light impinging on these domains is nearly normal, and is unpolarized. The calculated reflectivity curves for normally incident light on single domains of the gyroid structures (figure 3) show maxima in the ultraviolet to the green–yellow wavelength range. These maxima correspond to the blue-, yellow- and green-coloured spots in the single scales (figure 1b). Note that, for the lycaenid C. remus, the blue, yellow and green spots were attributed to the reflection of light from differently oriented domains with an FCC inverted opal structure, as confirmed by the transfer matrix simulations for the (0 1 1), (1 1 1) and (0 0 1) surfaces, respectively (Kertész et al. 2006). We suggested that C. remus may have scales with gyroid structures similar to those of C. rubi (Michielsen & Stavenga 2008) instead of scales with an inverted opal structure. The gyroid structure also gives rise to blue, yellow and green spots but not from the light reflected from the (0 0 1), (0 1 1) and (1 1 1) surfaces, as can be seen from figure 3. The qualitative correspondence of the average of the reflectivity curves from figure 3 to the experimentally measured reflectivity for C. rubi is quite good for the green and shorter wavelengths (figure 2), but the spectra deviate in the longer wavelength ranges (figure 2). This is due to the background scattered light, which has escaped absorption by melanin pigment that is present throughout the scales' cuticle (Morris 1975). Other deviations from the measured reflectivity spectra may be the result of the equal weight averaging of the calculated reflectivity over a limited set of domains with arbitrary orientation and exposed to exactly normally incident light of transverse magnetic (TM) and transverse electric (TE) polarized light (Born & Wolf 2005). Further structural studies are required to determine which orientations of the gyroid structure naturally appear in the butterfly wing scale and what the rate of their appearance is. Another characteristic of the scale, which has not been taken into account in the simulations so far, is the grating-like structure formed by the ridges (see figure 1d). As can be seen from fig. 8 in Ghiradella & Radigan (1976), this structure can be modelled by cutting out half-cylinders with radius 937 nm from the top surface of the gyroid structure filling the simulation box. A comparison of the reflectivity curves for light impinging on the (1 4 5) domain with and without grating-like structure is shown in figure 4. The reflectivities for both cases are qualitatively the same.
Figure 2.
Reflectivity spectrum measured with a microspectrophotometer of a single scale of the ventral wing of C. rubi (red line) and of an oak leaf (green line). Filled circles (solid black line): FDTD simulation result for the average of the reflectivities of 14 differently oriented gyroid structures exposed to normally incident light with transverse magnetic (TM) and transverse electric (TE) polarization (figure 3).
Figure 3.
Reflectivity for 14 different domains characterized by their Miller indices (h k l). Light incidence is normal to the top surface. Filled circles, (0 0 1); filled squares, (0 1 1); open squares, (0 2 3); stars, (0 5 8); filled upward triangles, (1 1 1); filled diamonds, (1 1 2); filled pentagons, (1 1 6); open downward triangles, (1 3 4); filled downward triangles, (1 3 5); plus signs, (1 3 8); open circles, (1 4 5); crosses, (2 2 3); open diamonds, (2 5 7); open upward triangles, (5 7 7). (a) TM polarization and (b) TE polarization.
Figure 4.
Reflectivity for the (1 4 5) domain with and without grating-like structure on the top surface of the gyroid cuticular structure. The domain is exposed to light with the angle of incidence [θ, ϕ] and with TM (filled symbols) or TE (open symbols) polarization. Circles: [15°, 0°], with grating; squares: [15°, 180°], with grating; downward triangles: [15°, 0°], without grating; upward triangles: [15°, 180°], without grating.
Imaging scatterometry reveals that the light scattered from a single scale is omnidirectional and predominantly green (Stavenga et al. 2009) (figure 5a). Just like the reflectivity spectra, these scattering diagrams are not unique. They depend on the position of the illuminated spot. What all diagrams have in common is the large circular coloured area, indicative of the omnidirectional scattering, but what may differ is their coloration. Some may contain more blue, yellow, green or even red than others. For example, the scattering diagram in figure 5a contains more red and yellowish green than the scattering diagram presented in Stavenga et al. (2009), which is predominantly green with some blue. Also here, we attribute the red colour in the diagram to the presence of melanin pigment in the scales. A scattering diagram built up from FDTD results for differently oriented cutting surfaces of the gyroid structures, showing the angular position of the zeroth-order diffraction peak for normally (figure 5b) and non-normally (figure 5c) incident light, further supports the hypothesis that the omnidirectional green colour is due to the mosaic of randomly oriented domains observed in the single scales. The intensities of the scattered light for normally (table 1) and non-normally (table 2) incident light are comparable in magnitude. Note that in figure 5b (normal incidence), the blue spots appear for scattering angles of 60° or larger and that their intensities are lower than those of the green spots (table 1). Figure 5b,c shows discrete coloured spots, representing the zeroth-order scattering from one domain. As can be seen from these figures, considering differently oriented domains exposed to normally and slightly non-normally incident light results in a large non-uniformly coloured circle for the total scattering diagram. The diffuse character of the coloration becomes even more expressed if we take into account the grating-like structure on top of the gyroid cuticular structure in our simulation model, as becomes clear from figure 6. The presence of the grating causes higher order scattering, spreading the coloration in the scattering diagram over an even broader region.
Figure 5.

(a) Scattering diagram of a single C. rubi scale taken by an imaging scatterometer. The black strip at 180° is the shadow of a thin glass micropipette carrying the scale. The white circles indicate the scattering angles of 30°, 60° and 90°. (b) Schematic scattering diagram summarizing the FDTD simulation results for scattering from 20 domains exposed to normally incident light (TM polarized). Each coloured dot represents the zeroth-order scattering from one domain. The dark grey structures surrounding each dot represent higher scattering orders having almost no intensity. Scattered light with wavelength 393 nm is coloured violet, 484 nm blue, 514 nm blue–green and 545 nm green. The intensity of the scattered light is not taken into account in the coloration but is reported in table 1. (c) Same as in (b) but for the domains (1 4 5) (numbers 1–8) and (2 3 7) (numbers 9–15) only and for incident light (TM polarized) with various non-normal angles of incidence [θ, ϕ] (table 2).
Table 1.
Reflectivity R of the light scattered from domains characterized by their Miller indices (h k l) and labelled by numbers 1–20 (figure 5b).
| label | (h k l) | R |
|---|---|---|
| 1 | (0 0 1) | 0.41 |
| 2 | (0 1 1) | 0.52 |
| 3 | (0 2 3) | 0.53 |
| 4 | (0 5 8) | 0.53 |
| 5 | (0 −5 8) | 0.53 |
| 6 | (1 1 2) | 0.37 |
| 7 | (1 3 4) | 0.47 |
| 8 | (1 3 5) | 0.42 |
| 9 | (−1 3 5) | 0.46 |
| 10 | (1 −3 5) | 0.46 |
| 11 | (1 3 −5) | 0.47 |
| 12 | (−1 −3 5) | 0.42 |
| 13 | (−1 3 −5) | 0.48 |
| 14 | (1 −3 −5) | 0.48 |
| 15 | (−1 −3 −5) | 0.47 |
| 16 | (1 3 8) | 0.38 |
| 17 | (1 4 5) | 0.49 |
| 18 | (2 2 3) | 0.32 |
| 19 | (2 3 7) | 0.33 |
| 20 | (5 7 7) | 0.37 |
Table 2.
Reflectivity R of the light scattered from the domains (145) (numbers 1–8) and (237) (numbers 9–15). The incident light (TM polarized) has an angle of incidence [θ, ϕ] (figure 5c).
| label | (θ, ϕ) | R |
|---|---|---|
| 1 | [15°, 0°] | 0.48 |
| 2 | [15°, 70°] | 0.53 |
| 3 | [15°, 125° ] | 0.45 |
| 4 | [15°, 160°] | 0.40 |
| 5 | [15°, 215°] | 0.39 |
| 6 | [15°, 250°] | 0.46 |
| 7 | [15°, 305°] | 0.52 |
| 8 | [15°, 340°] | 0.50 |
| 9 | [5°, 0°] | 0.41 |
| 10 | [5°, 70°] | 0.53 |
| 11 | [5°, 125°] | 0.28 |
| 12 | [5°, 160°] | 0.16 |
| 13 | [5°, 215°] | 0.40 |
| 14 | [5°, 250°] | 0.41 |
| 15 | [15°, 305°] | 0.47 |
Figure 6.
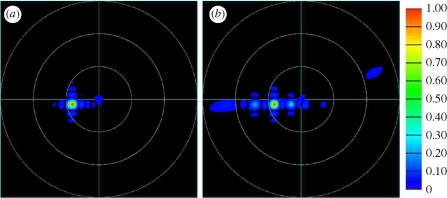
Calculated scattering diagram for the (1 4 5) domain (a) without and (b) with a grating-like structure on the top surface of the gyroid cuticular structure. The domain is exposed to normally incident light with wavelength 475 nm and TM polarization.
3. Polarization effects
Optical micrographs of a single scale illuminated with linearly polarized white light and captured through a crossed linear analyser (figure 7) demonstrate that the scales have optically active domains, that is, some domains rotate the plane of incident linearly polarized light. Various polarization effects are also observed in the FDTD simulations. (i) The maximum intensity of the scattered light differs for incident TM or TE polarized light (figures 3 and 8). For light with an angle of incidence [θ, ϕ] = [15°, 180°] impinging on the (1 4 5) domain, the maximum reflectivity is 0.37 for incident TM polarized light and 0.55 for incident TE polarized light. (ii) The wavelength of peak reflectivity can differ for incident TM and TE polarized light. For non-normal incident light with [θ, ϕ] = [15°, 0°] on a (0 0 1) surface, a maximum reflectivity of 0.34 is observed for TM polarized incident light with a wavelength λ = 393 nm, and a maximum reflectivity of 0.16 is observed for TE polarized incident light with a wavelength λ = 484 nm. In other words, for this particular example, incident TM polarized light reflects dominantly in the ultraviolet range while incident TE polarized light reflects blue. These polarization effects, observed for single domains, have an effect on the average reflectivity from the ventral wing. For most domains we have considered, we observe polarization effects of the first type. As a result, the overall average reflectivity from incident TE polarized light is larger than the overall average reflectivity from TM polarized light. Polarization effects of the second type can result in a different reflectivity for the short wavelengths for incident TE and TM polarized light, if the amount of (0 0 1) domains in the ventral wing is sufficiently large.
Figure 7.
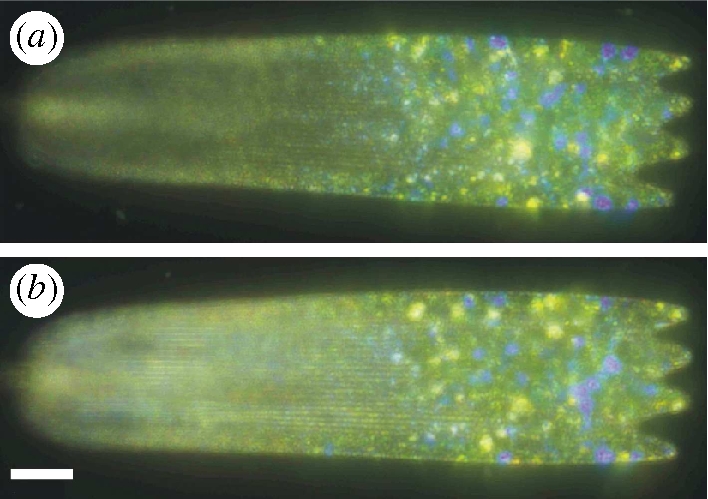
Optical micrograph of a single ventral wing scale taken in reflection. (a) Illumination with linearly polarized white light while the image was captured through a crossed linear analyser; (b) same as in (a) but both polarizer and analyser were rotated by 90°. Scale bar, 20 µm.
Figure 8.
FDTD simulation results for the reflectivity of various domains denoted by the Miller indices (h k l), exposed to light with the angle of incidence [θ, ϕ] and with TM or TE linear polarization, denoted by filled or open symbols, respectively. Circles: (0 0 1), [0°, 0°]; upward triangles: (0 0 1), [15°, 0°]; squares: (0 1 1), [0°, 0°]; downward triangles: (0 1 1), [15°, 0°]; diamonds: (1 4 5), [15°, 180°].
More details about the polarization of the reflected light are obtained by calculating the Stokes parameters and using the Poincaré sphere representation (Born & Wolf 2005). The FDTD data reveal that the light scattered from various domains is left- or right-handed elliptically polarized whereby the azimuthal angle can be as large as ±20°. We emphasize here that these ultraviolet and polarization effects are invisible to a human observer but may well have a function in the butterfly mating process (Doucet & Meadows 2009). The visual sense cells of the butterfly eyes are generally polarization sensitive (Bandai et al. 1992; Kinoshita et al. 1997) and polarization vision is used in oviposition, feeding (Kelber et al. 2001) and mate recognition (Sweeney et al. 2003). Sensory orientation to polarized sunlight has also been shown to be of importance in the perching behaviour of two Callophrys species (Johnson & Borgo 1976).
4. Summary
By comparing the computer simulation data of gyroid nanostructures with optical measurements (reflectivity spectra and scattering diagrams) of ventral wing scales of C. rubi, we have demonstrated that the camouflaging omnidirectional green coloration arises from the gyroid cuticular structure grown in the domains of different orientation. Our simulation data also show that light scattered from the various domains is elliptically polarized, an optical effect that might provide additional visual information to polarization-sensitive receivers, usually conspecifics. We suggest that C. rubi may respond to polarized (sun) light similar to the lycaenid M. gryneus for perching and that they may use polarization signals for mate finding.
Acknowledgements
We thank Bodo Wilts and Hein Leertouwer for the collaboration, AFOSR/EOARD for the financial support (grant no. FA8655-08-1-3012), and Z. Bálint, P. Vukusic and H. Ghiradella for reading this manuscript.
References
- Asher J., Warren M., Fox R., Harding P., Jeffcoate G., Jeffcoate S. 2001. The millennium atlas of butterflies in Britain and Ireland. Oxford, UK: Oxford University Press. [Google Scholar]
- Babin V., Garstecki P., Hołyst R. 2002. Photonic properties of multicontinuous cubic phases. Phys. Rev. B 66, 235120 ( 10.1103/PhysRevB.66.235120) [DOI] [Google Scholar]
- Bandai K., Arikawa K., Eguchi E. 1992. Localization of spectral receptors in the ommatidium of butterfly compound eye determined by polarization sensitivity. J. Comp. Physiol. A 171, 289–297. ( 10.1007/BF00223959) [DOI] [Google Scholar]
- Born M., Wolf E. 2005. Principles of optics. Cambridge, UK: Cambridge University Press. [Google Scholar]
- Doucet S. M., Meadows M. G. 2009. Iridescence: a functional perspective. J. R. Soc. Interface 6, S115–S132. ( 10.1098/rsif.2008.0395.focus) [DOI] [PMC free article] [PubMed] [Google Scholar]
- Gaillot D. I., Deparis O., Welch V., Wagner B. K., Vigneron J. P., Summers C. J. 2008. Composite organic–inorganic butterfly scales: production of photonic structures with atomic layer deposition. Phys. Rev. E 78, 031922 ( 10.1103/PhysRevE.78.031922) [DOI] [PubMed] [Google Scholar]
- Ghiradella H., Radigan W. 1976. Development of butterfly scales. II. Struts, lattices and surface tension. J. Morph. 150, 279–298. ( 10.1002/jmor.1051500202) [DOI] [PubMed] [Google Scholar]
- Huang J., Wang X., Wang Z. L. 2006. Controlled replication of butterfly wings for achieving tunable photonic properties. Nano. Lett. 6, 2325–2331. ( 10.1021/nl061851t) [DOI] [PubMed] [Google Scholar]
- Hyde S. T., O'Keeffe M., Proserpio D. M. 2008. A short history of an elusive yet ubiquitous structure in chemistry, materials, and mathematics. Angew. Chem. Int. Ed. 47, 7996–8000. ( 10.1002/anie.200801519) [DOI] [PubMed] [Google Scholar]
- Johnson K., Borgo P. M. 1976. Patterned perching behavior in two Callophrys (Mitoura) (Lycaenidae). J. Lepid. Soc. 30, 169–183. [Google Scholar]
- Jones R. W., Tilley R. J. D. 1999. A light and electron microscope study of the green scales on the underside of the wings of the butterflies Callophrys rubi (Linnaeus 1758) and C. avis (Chapman 1909) (Lepidoptera: Lycaenidae). Entomol. Gazette 50, 39–47 [Google Scholar]
- Kelber A., Thunell C., Arikawa K. 2001. Polarisation-dependent colour vision in Papilio butterflies. J. Exp. Biol. 204, 2469–2480. [DOI] [PubMed] [Google Scholar]
- Kertész K., Bálint Z., Vértesy Z., Márk G. I., Lousse V., Vigneron J. P., Rassart M., Biró L. P. 2006. Gleaming and dull surface textures from photonic-crystal-type nanostructures in the butterfly Cyanophrys remus. Phys. Rev. E 74, 021922 ( 10.1103/PhysRevE.74.021922) [DOI] [PubMed] [Google Scholar]
- Kinoshita M., Sato M., Arikawa K. 1997. Spectral receptors of nymphalid butterflies. Naturwissenschaften 84, 199–201. ( 10.1007/s001140050377) [DOI] [Google Scholar]
- Kinoshita S., Yoshioka S., Miyazaki J. 2008. Physics of structural colors. Rep. Prog. Phys. 71, 076401 ( 10.1088/0034-4885/71/7/076401) [DOI] [Google Scholar]
- Maldovan M., Urbas A. M., Yfa N., Cartner W. C., Thomas E. L. 2002. Photonic properties of bicontinuous cubic microphases. Phys. Rev. B 65, 165123 ( 10.1103/PhysRevB.65.165123) [DOI] [Google Scholar]
- Martín-Moreno L., García-Vidal F. J., Somoza A. M. 1999. Self-assembled triply periodic minimal surfaces as molds for photonic band gap materials. Phys. Rev. Lett. 83, 73–75. ( 10.1103/PhysRevLett.83.73) [DOI] [Google Scholar]
- Michielsen K., Kole J. S. 2003. Photonic band gaps in materials with triply periodic surfaces and related tubular structures. Phys. Rev. B 68, 115107 ( 10.1103/PhysRevB.68.115107) [DOI] [Google Scholar]
- Michielsen K., Stavenga D. G. 2008. Gyroid cuticular structures in butterfly wing scales: biological photonic crystals. J. R. Soc. Interface 5, 85–94. ( 10.1098/rsif.2007.1065) [DOI] [PMC free article] [PubMed] [Google Scholar]
- Morris R. B. 1975. Iridescence from diffraction structures in the wing scales of Callophrys rubi, the Green Hairstreak. J. Entomol. (A) 49, 149–154. [Google Scholar]
- Onslow H. 1923. On a periodic structure in many insect scales, and the cause of their iridescent colours. Phil. Trans. R. Soc. Lond. B 211, 1–74. ( 10.1098/rstb.1923.0001) [DOI] [Google Scholar]
- Parker A. R., Townley H. E. 2007. Biomimetics of photonic nanostructures. Nature Nanotechnol. 2, 347–353. ( 10.1038/nnano.2007.152) [DOI] [PubMed] [Google Scholar]
- Poladian L., Wickham S., Lee K., Large M. C. J. 2009. Iridescence from photonic crystals and its suppression in butterfly scales. J. R. Soc. Interface 6, S233–S242. ( 10.1098/rsif.2008.0353.focus) [DOI] [PMC free article] [PubMed] [Google Scholar]
- Stavenga D. G., Leertouwer H. L., Pirih P., Wehling M. 2009. Imaging scatterometry of butterfly wing scales. Opt. Express 17, 193–202. ( 10.1364/OE.17.000193) [DOI] [PubMed] [Google Scholar]
- Sweeney A., Jiggins C., Johnsen S. 2003. Insect communication: polarized light as a butterfly mating signal. Nature 423, 31–32. ( 10.1038/423031a) [DOI] [PubMed] [Google Scholar]
- Taflove A., Hagness S. C. 2005. Computational electrodynamics: the finite-difference time-domain method, 3rd edn Norwood, MA: Artech House. [Google Scholar]
- Tilley R. J. D. 2000. Further considerations of the colour of the green scales on the underside of the wings of the butterflies Callophrys rubi (Linnaeus 1758) and C. avis (Chapman 1909). Entomol. Gazette 51, 191–193. [Google Scholar]
- Vukusic P., Sambles J. R. 2001. Shedding light on butterfly wings. Proc. SPIE 4438, 85–95. ( 10.1117/12.451481) [DOI] [Google Scholar]
- Vukusic P., Sambles J. R. 2003. Photonic structures in biology. Nature 424, 852–855. ( 10.1038/nature01941) [DOI] [PubMed] [Google Scholar]
- Vukusic P., Stavenga D. G. 2009. Physical methods for investigating structural colours in biological systems. J. R. Soc. Interface 6, S133–S148. ( 10.1098/rsif.2008.0386.focus) [DOI] [PMC free article] [PubMed] [Google Scholar]
- Vukusic P., Sambles J. R., Lawrence C. R., Wootton R. J. 1999. Quantified interference and diffraction in single Morpho butterfly scales. Proc. R. Soc. Lond. B 266, 1403–1411. ( 10.1098/rspb.1999.0794) [DOI] [Google Scholar]
- Wilts B. D., Leertouwer H. L., Stavenga D. G. 2009. Imaging scatterometry and microspectrophotometry of lycaenid butterfly wing scales with perforated multilayers. J. R. Soc. Interface 6, S185–S192. ( 10.1098/rsif.2008.0299.focus) [DOI] [PMC free article] [PubMed] [Google Scholar]


