Abstract
This paper provides the first analysis of the three-dimensional state of residual stress and stretch in an artery wall consisting of three layers (intima, media and adventitia), modelled as a circular cylindrical tube. The analysis is based on experimental results on human aortas with non-atherosclerotic intimal thickening documented in a recent paper by Holzapfel et al. ( Holzapfel et al. 2007 Ann. Biomed. Eng. 35, 530–545 (doi:10.1007/s10439-006-9252-z)). The intima is included in the analysis because it has significant thickness and load-bearing capacity, unlike in a young, healthy human aorta. The mathematical model takes account of bending and stretching in both the circumferential and axial directions in each layer of the wall. Previous analysis of residual stress was essentially based on a simple application of the opening-angle method, which cannot accommodate the three-dimensional residual stretch and stress states observed in experiments. The geometry and nonlinear kinematics of the intima, media and adventitia are derived and the associated stress components determined explicitly using the nonlinear theory of elasticity. The theoretical results are then combined with the mean numerical values of the geometrical parameters and material constants from the experiments to illustrate the three-dimensional distributions of the stretches and stresses throughout the wall. The results highlight the compressive nature of the circumferential stress in the intima, which may be associated with buckling of the intima and its delamination from the media, and show that the qualitative features of the stretch and stress distributions in the media and adventitia are unaffected by the presence or absence of the intima. The circumferential residual stress in the intima increases significantly as the associated residual deformation in the intima increases while the corresponding stress in the media (which is compressive at its inner boundary and tensile at its outer boundary) is only slightly affected. The theoretical framework developed herein enables the state of residual stress to be calculated directly, serves to improve insight into the mechanical response of an unloaded artery wall and can be extended to accommodate more general geometries, kinematics and states of residual stress as well as more general constitutive models.
Keywords: residual stress, residual deformation, artery layers, arterial wall mechanics, finite elasticity
1. Introduction
In the last few years, the important influence of residual stresses, even with small magnitude, in arteries on the transmural stress distributions in the physiological state has been well documented (e.g. Holzapfel et al. 2000; Humphrey 2002, ch. 7; 2003). Mathematical models that embody the residual stress are needed to better predict, for example, biomechanical responses such as changes in wall stress during the cardiac cycle, and mechanobiological responses such as growth, remodelling, adaptation and repair. Such models must be based on anatomical data (geometry) and a comprehensive set of experimental data. Following Chuong & Fung (1986), calculations of residual stresses, however, have typically been based on mathematical and/or computational formulations of boundary-value problems associated with the opening of an artery ring without accounting for the effect of the axial direction (e.g. Rachev 1997; Rachev & Hayashi 1999; Holzapfel et al. 2000; Humphrey 2002, ch. 7; Raghavan et al. 2004; Ohayon et al. 2007). Similar comments apply to the work of Olsson et al. (2006), who considered a single homogeneous layer of neo-Hookean material, although they did determine the dependence of the axial stress on the radius. There are also many experimental papers that examine the opening angle of an arterial ring, which provides essentially two-dimensional information, but we have not referred to these since they are not relevant to the three-dimensional analysis we are concerned with here. The interested reader is referred to Humphrey (2002) for discussion of the opening-angle experiment.
In a previous study, we have obtained novel experimental results on human aortas with non-atherosclerotic intimal thickening that demonstrate distinct layer-specific three-dimensional residual deformations (Holzapfel et al. 2007). These results indicate that the above-mentioned opening angle method, which is essentially two dimensional, is unable to capture the three-dimensional residual stress distributions, as both bending and stretching in the axial and the circumferential directions have a strong influence. Indeed, before this study, essentially the only results available concerning residual deformations were those based on the opening angle of an unseparated ring sector, which, although simple, just provides qualitative information of the two-dimensional residual deformation state of a sector cross section (Vossoughi 1992). Also, little quantitative information about the axial in situ stretches of human arteries has been reported in the literature. However, there are some data on the axial in situ stretch, as exemplified in work concerning aged human iliac arteries (e.g. Schulze-Bauer et al. 2003). Qualitative and quantitative data on the residual deformation in the axial direction are scarce, although a systematic study has been published in Holzapfel et al. (2007).
The study by Holzapfel et al. (2007) documents measurements of kinematical quantities characterizing the layer-specific three-dimensional residual deformations of arteries, and focuses on human tissue. Therein it was shown that the inner layer of the artery (the intima) has a significant thickness when compared with the other two layers (the media and adventitia). Residual deformations (stretching and bending) were determined for circumferential and axial strips from intact aortic tissue, and the corresponding deformations were recorded for the three separate layers in both the circumferential and axial directions and quantified using image analysis. It is important to include the three-dimensional residual deformations in human aged arteries within a model that incorporates the properties of the three individual layers of the arterial wall.
The purpose of the present paper is to develop a mathematical model of arterial wall tissue that encompasses the three-dimensional residual deformation data documented in Holzapfel et al. (2007), and which can be used to predict (i) the layer-specific residual stresses in human arterial walls, especially aortas, and (ii) the mechanical response of arteries under a variety of loading conditions. While based on the data from aortas, the model can in principle be used for other arteries when suitable data become available. Such data can be obtained using the approach described in, for example, Holzapfel et al. (2007).
In §2, we begin by reviewing some recent experimental data on residual deformations obtained from human aortas, which motivates the subsequent mechanical model and the associated numerical computations, while §3 details the geometry and kinematics of the separated arterial layers and the intact cylindrical tube which they constitute in the unloaded configuration. Stress analysis based on the kinematics and the neo-Hookean constitutive model is then described in §4, wherein explicit expressions for the radial, circumferential and axial stress components are derived for the individual layers. In §5, we summarize the material and geometrical data used for the representative numerical examples, outline the solution procedure and illustrate and discuss the results obtained for the residual stretch and stress distributions. Finally, in §6, we summarize the key features of the paper and the advantages and possible extensions of the approach adopted.
2. Background on Three-Dimensional residual deformations
2.1. Materials and methods
In Holzapfel et al. (2007), a detailed description of the experimental method is provided. As an important background to the modelling, we now review briefly the key features of the experimental protocol.
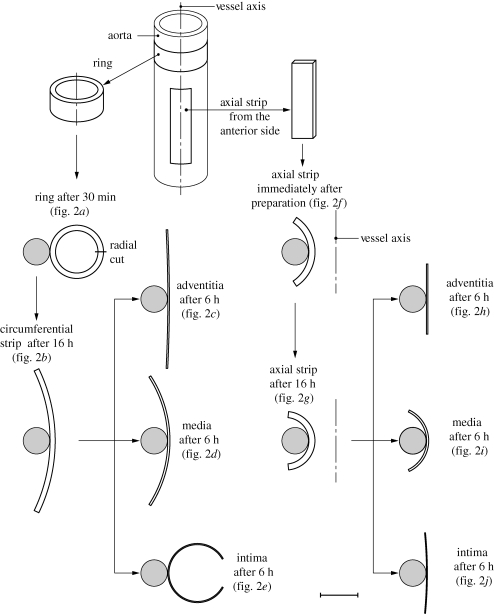
The study was based on specimens taken from 11 human abdominal aortas that were free from atherosclerotic plaques. The in situ and ex situ lengths of the aortas were measured, and the axial in situ stretch was then determined. A ring was cut from each aorta, and an axial strip was cut from the anterior site of each aorta (a schematic illustration of the protocol of specimen preparation is provided in figure 1). The specimens were then placed in a temperature-controlled tissue bath of calcium-free physiological saline solution at 37°C. After equilibration of 30 min, each ring was glued pointwise with adhesive on to a cylindrical plastic tube so as to provide load-free suspension of the specimen. For each ring (referred to as a circumferential strip), a radial cut through the wall was made, thereby releasing residual stresses. After 16 h, digital images were taken of each specimen in order to determine the change in geometry from which the residual deformations were deduced. Next, the intima, media and adventitia layers were separated, and six strips obtained, two for each layer from each orientation. The strips were glued on cylindrical plastic tubes, and images were taken after 6 h. The axial strips were treated similarly. The final geometries of the separated layer-specific strips so obtained were then assumed to be stress free.
Figure 1.
Schematic of the procedure for specimen preparation showing: ring and axial strip specimens from the aorta, after 30 min of equilibration and immediately after preparation; circumferential and axial strips after 16 h of equilibrium; circumferential and axial strips from the separated intima, media and adventitia after 6 h of equilibrium. Each specimen was glued to a plastic tube. The various configurations are shown to the correct scale. Scale bar: 10 mm. Adapted from fig. 2 of Holzapfel et al. (2007) with kind permission of Springer Science and Business Media.
Vessel parameters such as diameter, thickness, length and curvature were obtained using image processing. NURBS (non-uniform rational B-splines) were used for the accurate computation of the geometrical parameters required. The mean curvatures for each specimen were then computed. Mean values of the diameter, length, pre-stretch and curvature of each specimen were determined by averaging the values for the inner and outer boundaries, and a set of vessel parameters (diameter, length, pre-stretch and curvature) was obtained by computing the mean values for all the specimens based on the corresponding mean values for the inner and outer boundaries of each specimen. Together with the thickness, this set provides the definitive parameters for purposes of modelling.
2.2. Results
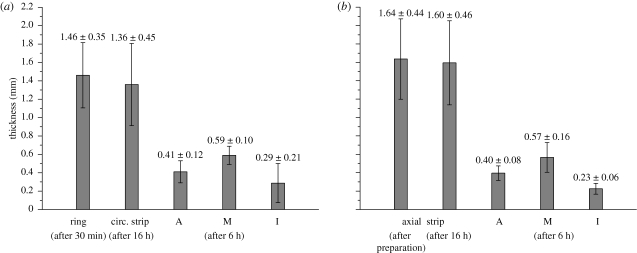
Typical specimen dimensions were 15 × 5 mm (diameter × height) for the rings and 20 × 5 mm (length × width) for the axial strips. After 30 min of equilibration, the mean inner and outer diameters of the aortic ring segments were determined to be 11.22 ± 2.18 and 14.09 ± 1.92 mm (mean ± s.d.), respectively. The mean ratio of the wall thickness of the ring to its outer diameter for all specimens was 0.106 ± 0.034 (mean ± s.d.). Figure 2 shows column plots of the thickness values of the rings, the strips and the separated layers (A, M and I) oriented in the circumferential and axial directions. The thickness ratios adventitia : media : intima oriented in the circumferential direction were calculated as 32∶46∶22, and for the axial direction 33∶48∶19. The axial in situ stretch was found to be 1.196 ± 0.084 (mean ± s.d.).
Figure 2.
Column plots (mean values and s.d.) of aortic wall thicknesses and of the separated layer thicknesses (A, adventitia; M, media; I, intima) from (a) the circumferential and (b) the axial directions. The error bars indicate s.d. Adapted from fig. 9 of Holzapfel et al. (2007) with kind permission of Springer Science and Business Media.
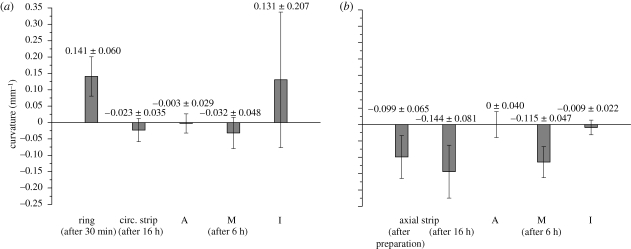
In figure 3, the curvatures of the individual specimens are shown as column plots. The adventitia strips are relatively flat in both directions, while strips from the media have negative curvatures in both directions. For the intima, the circumferential strips have significant positive curvatures, whereas the axial strips are almost flat.
Figure 3.
Column plots (mean values and s.d.) of the curvature of the aortic ring, the circumferential strips and the separated layers (A, adventitia; M, media; I, intima) oriented in the (a) circumferential direction; the axial strip and the separated layers (A, M, I) oriented in the (b) axial direction. The error bars represent s.d. Adapted from fig. 12 of Holzapfel et al. (2007) with kind permission of Springer Science and Business Media.
3. Deformation of the separated arterial layers into a circular cylindrical tube
For purposes of modelling, we consider the intact arterial wall to be a circular cylindrical tube consisting of three layers of uniform thickness, the intima, media and adventitia, with relevant geometrical and material parameters distinguished by the superscripts (I), (M) and (A), respectively. The material in each layer is assumed to be incompressible. For the relevant background and notation of nonlinear continuum kinematics, see, for example, Ogden (1997) and Holzapfel (2000).
3.1. Intimal layer
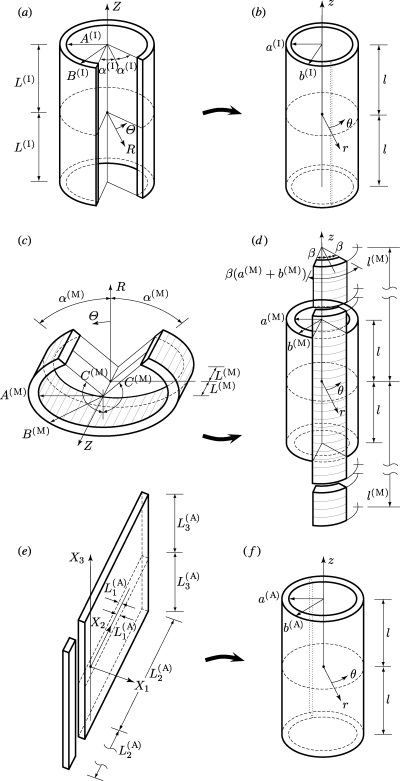
For the intima, the axial strip essentially remains straight and the ring opens up by an angle which we denote by 2α(I). The geometry of the reference configuration can therefore be taken as the opened sector of a circular cylindrical tube, as depicted in figure 4a. With reference to cylindrical polar coordinates R, Θ and Z in this configuration, the geometry is defined by
 |
3.1 |
where A(I) and B(I) are the internal and external radii of the intimal tube, respectively, and 2L(I) is the length of the tube.
Figure 4.
Coordinate systems and related geometries of intimal, medial and adventitial layers in their (a,c,e) unstressed reference configurations, respectively, and (b,d,f) intact unloaded configurations, respectively.
The corresponding intact cylindrical geometry, depicted in figure 4b, is defined by cylindrical polar coordinates r, θ and z, so that
| 3.2 |
where l refers to half the height of a circumferential ring.
Since the material is assumed to be incompressible, the deformation is isochoric and defined by the equations
 |
3.3 |
where
| 3.4 |
and λz(I) is uniform.
The cylindrical polar axes are principal axes of the deformation, and the matrix of components of the deformation gradient is diagonal with entries
 |
3.5 |
These are the principal stretches that satisfy the incompressibility constraint λr(I) λθ(I) λz(I) = 1 and which correspond to the radial, circumferential and axial directions, respectively. An expression for the matrix of components of the deformation gradient in cylindrical polar coordinates may be found in, for example, Humphrey (2002) or Taber (2004).
3.2. Medial layer
The overall mechanical behaviour of the medial layer is very similar to that of the unseparated specimen, as can be appreciated from figure 1. Although the circumferential specimen has some curvature, for simplicity, we assume that the circumferential specimen is straight in order to enable a tractable analysis. This simplification, together with the assumption that the intact wall is a circular cylindrical tube, leads to axial stress components that depend on the radius, which therefore generate axial loads on the ends of the tube. The implications of this will be discussed in §4.2.
The reference and unloaded geometries of the medial layer are depicted in figure 4c,d, respectively. With reference to cylindrical polar coordinates R, Θ and Z in the reference configuration the geometry is defined by
 |
3.6 |
The corresponding intact cylindrical geometry in the unloaded configuration is defined by cylindrical polar coordinates r, θ and z according to
 |
3.7 |
where l(M) is half the length of an axial medial strip in the deformed configuration, as shown in figure 4d. Note that C(M) = (π − α(M))R is half the corresponding (curved) sector length in the reference configuration, as shown in figure 4c. Because of the incompressibility condition, the deformation can be described by the equations
 |
3.8 |
where
| 3.9 |
Note, in particular, that r depends on R, but θ depends on Z and z depends on Θ; see figure 4c,d for the related geometry. In addition, note that β(a(M) + b(M)) defines the width of the axial medial strip in the current configuration (figure 4d). We emphasize that the inner surface of this configuration becomes the outer surface of the deformed configuration, which explains the minus sign in equation (3.8)1.
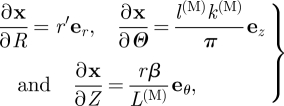
Let x = rer + zez denote the position vector of a point in the deformed configuration of the media referred to cylindrical polar axes. We can calculate the deformation gradient F = Grad x using
| 3.10 |
with
 |
3.11 |
where r′ = dr/dR and ER, EΘ and EZ and er, eθ and ez are unit basis vectors associated with R, Θ and Z and r, θ and z, respectively. This yields
| 3.12 |
and hence
 |
3.13 |
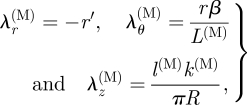
where B = FFT denotes the left Cauchy–Green tensor. The principal directions are again the r, θ and z directions, and the corresponding principal stretches are then seen to be
 |
3.14 |
with
| 3.15 |
Note that λθ(M) is the ratio of the curved width of the axial strip in the deformed configuration to its width in the corresponding reference configuration, while λz(M) = l(M)/C(M) is the ratio of the deformed axial length of the medial strip to the length of the corresponding curved sector in the reference configuration.
3.3. Adventitial layer
For the adventitia, the axial strip remains straight and the ring deforms into a plane sheet. We therefore define the reference geometry in terms of rectangular Cartesian coordinates by
 |
3.16 |
and the cylindrical geometry in the deformed configuration is again expressed in terms of cylindrical polar coordinates r, θ and z, similar to the intima but with
| 3.17 |
The unstressed reference and the unloaded intact cylindrical configurations are shown in figure 4e,f, respectively.
The deformation is then defined by the expressions
 |
3.18 |
where the incompressibility condition was again used. The cylindrical polar axes are principal axes corresponding to the principal stretches
 |
3.19 |
λz(A) being uniform and λr(A) λθ(A) λz(A) = 1.
3.4. Interface radii matching
The overall objective is to calculate the residual stress distribution in the complete intact wall, which requires that the geometries of the three layers are compatible, i.e. the lengths of the individual layers are the same, the inner radius of the adventitia matches the outer radius of the media and the inner radius of the media matches the outer radius of the intima.
From equation (3.3)1 we have the connection
 |
3.20 |
where λz(I) is given by equation (3.4)2.
Similarly, from equation (3.8)1, we have
 |
3.21 |
Finally, for the adventitia, from equation (3.18)1, we obtain
 |
3.22 |
where λz(A) is given by equation (3.19)3.
In the deformed configuration, the three cylindrical tubes are fitted together, which means that the following connections between the radii must hold:
| 3.23 |
3.5. Geometrical parameters
In total, there are 16 geometrical parameters that need to be determined. These are, for the intima, the radii A(I), B(I), the (half) length L(I) and the angle α(I); for the media, A(M), B(M), L(M) and α(M); and for the adventitia L1(A), L2(A) and L3(A) and two of a(I), b(I), a(M), b(M), a(A) and b(A). If two of the latter six are known, then the others are determined in terms of them and the remaining constants by equations (3.20) and (3.22). In addition, the half height l of the intact circumferential ring is needed, together with the two parameters β and l(M) relating to the axial media strip in the intact configuration. These are determined indirectly, as shown later in §5.2. Note that the product βl(M) is obtained from equation (3.21) when a(M) and b(M) are found.
By enforcing the continuity of traction (i.e. of the radial stress) between the intima and media and the media and the adventitia, and by using zero traction conditions on the inner and outer layers, we obtain four conditions with one arbitrary constant coming from the differential equation for each layer. This provides an additional connection that enables β and l(M) to be determined when k(M) is known.
4. Stress analysis
In this section, we provide the relevant constitutive and equilibrium equations, together with their application to the neo-Hookean material model for each of the three layers. The details of the appropriate stress analysis and elasticity theory may be found in the books by Ogden (1997) and Holzapfel (2000).
4.1. Constitutive law for an incompressible isotropic elastic material
We assume that the material is elastic and characterized by a strain–energy function Ψ (F), which depends on the deformation gradient F. Since we are considering the material to be incompressible the associated Cauchy stress tensor σ is given by
| 4.1 |
where p is the Lagrange multiplier associated with the incompressibility constraint det F = 1, and I is the identity tensor.
As a first step and in order to illustrate the approach, we consider the material to be isotropic. This is certainly appropriate when the range of deformations and stresses is not too large, in which case the load is carried primarily by the non-collagenous matrix material (Roach & Burton 1957). For larger deformations and stresses, it would in general be necessary to consider an anisotropic model that accounts for the collagen fibre orientations, but the associated analysis would be much more complicated and could only be conducted numerically. Thus, here we restrict attention to an incompressible isotropic material model for which Ψ depends on F only through the two principal invariants of C. These are defined by
| 4.2 |
or in terms of the principal stretches as
| 4.3 |
In this case the Cauchy stress tensor becomes
| 4.4 |
where the abbreviations ψ1 = ∂Ψ/∂I1 and ψ2 = ∂Ψ/∂I2 have been introduced.
4.2. Equilibrium equations
For each arterial layer, the principal directions of the Cauchy stress coincide with the principal directions of the left Cauchy–Green tensor, i.e. the cylindrical polar coordinate directions, since the material is isotropic. Then the normal components of σ are σθθ, σzz and σrr, and the shear components are zero. Moreover, the deformation depends only on r, and the equilibrium equation, therefore, reduces to the radial equation
| 4.5 |
The mean axial stress, denoted by  and calculated from σzz(i), i = I, M, A, is given by
 |
4.6 |
which is non-zero under the considered assumptions. Therefore, we adjust the axial stress to force the mean to vanish so that the resulting axial load on the ends of the artery vanishes. The adjusted axial stress components are then  . This gives an approximate measure of the residual axial stress in each layer.
4.3. Application to the neo-Hookean material
For purposes of illustration, we consider a simple isotropic model. Specifically, we use the neo-Hookean material model, for which Ψ is given by
| 4.7 |
where μ is the shear modulus of a material in the reference configuration, and the Cauchy stress tensor σ simplifies to
| 4.8 |
For this model, the radial equilibrium equation (4.5) reduces to
| 4.9 |
which holds throughout the layers. The radial stress is subject to the traction continuity conditions
 |
4.10 |
and
 |
4.11 |
where here and henceforth the superscripts (I), (M) and (A) attached to the stress components refer to the intima, media and adventitia, respectively. This convention will also be applied to μ. Once σrr is calculated from equation (4.9) in each layer, we can obtain
 |
4.12 |
also for each layer, where σzz is adjusted for the mean, as indicated above, using equation (4.6).
The constitutive law involves just one parameter, μ, which is different for each layer. The values of μ for the different layers are obtained from experimental data.
4.3.1. Intimal layer.
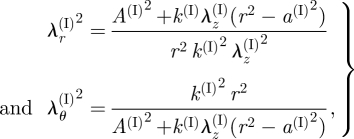
For the intima, the principal stretches λr(I) and λθ(I) are given by equation (3.5)1,2. By using equation (3.3)1, we may write
 |
4.13 |
while λz(I) = (λr(I) λθ(I))−1. The equilibrium equation (4.9) together with boundary condition (4.10)1 leads to
 |
4.14 |
4.3.2. Medial layer.
For the media, the principal stretches λr(M) and λθ(M) follow from equation (3.14)1,2. By using equation (3.8)1, we arrive at
 |
4.15 |
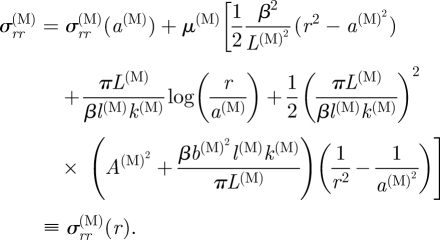
while λz(M) = (λr(M) λθ(M))−1. The equilibrium equation (4.9) yields the solution for σrr(M) given by
 |
4.16 |
Continuity of the radial stress σrr requires
| 4.17 |
with a(M) = b(I), which determines σrr(M)(a(M)).
4.3.3. Adventitial layer.
The principal stretches λr(A), λθ(A) and λz(A) for the adventitia are given via equation (3.19). The equilibrium equation (4.9) together with boundary condition (4.11)2 gives
 |
4.18 |
with σrr(A)(b(A)) = 0. Continuity of the radial stress σrr requires
| 4.19 |
with b(M) = a(A).
5. Numerical analysis
In this section, we illustrate the potential of the model proposed above by calculating residual stretches and stresses using measured data. We begin by summarizing the relevant material and geometric data, continue by describing the solution procedure and finally document a selection of numerical results.
5.1. Summary of available material and geometric data
We use the geometrical parameters described in §3.5 together with the material constants whose values are summarized in table 1. As far as layer-specific data of aortic tissues are concerned, we have used values of the shear modulus μ for each layer of a single specimen of an abdominal aorta from a human cadaver (female 80 years) documented in Holzapfel (2006). These values are summarized in the first row of table 1. As far as we know, there are no other data available for each of the intima, media and adventitia of human aortas. However, some layer-specific data are available for other types of arteries, including coronary arteries based on systematic studies with multiple specimens (Holzapfel et al. 2005). Such data are inappropriate for the present study, because they are obtained from a different type of artery.
Table 1.
Material and geometrical data for the intima, media and adventitia of human aortas required for the model: except for the values of μ the data are obtained directly from Holzapfel et al. (2007) or calculated using data from the same study, from which we also obtained l = 2.48 mm. The values of μ are from Holzapfel (2006).
| intima | media | adventitia | |
|---|---|---|---|
| shear modulus | μ(I) = 39.8 kPa | μ(M) = 31.4 kPa | μ(A) = 17.3 kPa |
| reference geometry | A(I) = 7.504 mm | A(M) = 8.406 mm | — |
| B(I) = 7.764 mm | B(M) = 8.986 mm | — | |
| L(I) = 2.5805 mm | L(M) = 2.52 mm | L1(A) = 0.205 mm | |
| k(I) = 1.191 | k(M) = 2.785 | L2(A) = 18.3465 mm | |
| L3(A) = 2.288 mm | |||
| deformed geometry | a(I) = 5.61 mm | — | b(A) = 7.045 mm |
Rows 2–6 of table 1 list the geometrical data for the reference configurations of the three layers that are required for the model. The second and third rows give values of the inner and outer radii A and B, respectively, for the intima and media. These values are computed from the mean radius in each case, which are obtained from mean values of the curvatures given in figure 3 coupled with the mean thicknesses from figure 2. In rows 4–6, Li(I), Li(M) and Li(A), i = 1, 2, 3, are mean values obtained from the specimens tested in Holzapfel et al. (2007), while k(I) and k(M) are computed from equations (3.4)1 and (3.9) using the opening angles α(I) and α(M) computed from data documented in Holzapfel et al. (2007). The final row of table 1 provides mean value data for the deformed inner radius a(I) of the intima and outer radius b(A) of the adventitia, which were given in Holzapfel et al. (2007). The value of the half height of the ring is obtained similarly as l = 2.48 mm.
5.2. Solution procedure
To obtain the remaining dimensions, we make use of equations (3.4)2, (3.19)3 and (3.23), which enable b(I) = a(M) to be calculated from equation (3.20) and b(M) = a(A) from equation (3.22). The stretches in the intima and adventitia then follow from equations (4.13) and (3.19), respectively, and hence the corresponding radial stresses are obtained from equations (4.14) and (4.18) using the boundary conditions σrr(A)(b(A)) = σrr(I)(a(I)) = 0. The stretch and stress distributions in the media require values of β and l(M). First, the product βl(M) is obtained from equation (3.21) explicitly and then the value of β (and hence l(M)) is determined by using the traction continuity conditions (4.17) and (4.19) on the interfaces r = a(M) and r = b(M) together with expressions (4.14), (4.16) and (4.18) for the radial stresses. Numerical values of β and l(M) are easily obtained. This allows the radial stress distribution through the media layer to be computed. The azimuthal stresses are then given by equation (4.12)1 using the appropriate values of σrr and the stretches for each layer. Similarly to the azimuthal stress, the axial stress distribution is obtained from equation (4.12)2, and we emphasize that this is adjusted to yield a zero mean distribution through the wall thickness by means of equation (4.6).
5.3. Numerical results and discussion
In this section, we present the three-dimensional residual stretch and stress distributions through the arterial wall based on the data displayed in table 1 using the software package Mathematica (Wolfram 2009). We shall also examine the effect of the absence of the intimal layer on the residual stretches and stresses in the media and adventitia. Finally, the influence of the opening angle α(I) on the circumferential stress at the inner boundary of the intima, the interface between the intima and media (where there is a discontinuity) and the outer boundary of the media is investigated.
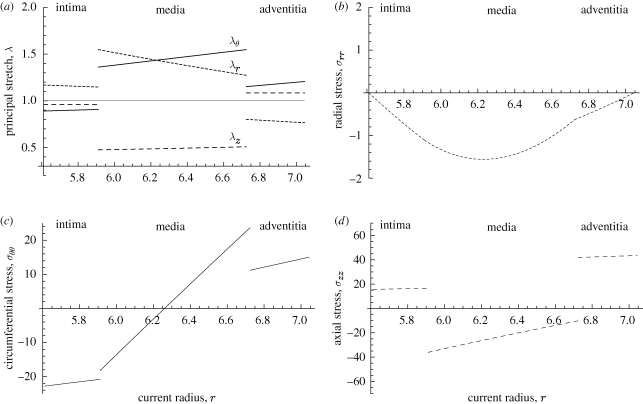
Figure 5a shows the distribution of the principal stretches λr, λθ and λz for each of the layers in the intact configuration as functions of the radius r through the thickness. We note that the circumferential stretches in the media and adventitia are tensile and also linear in r, while that in the intima is compressive, but it is not strictly linear, although the curve looks like a straight line. The axial stretch is constant in both the intima and adventitia and varies slowly through the medial layer. The value of the radial stretch in each layer is dictated by the incompressibility condition.
Figure 5.
Residual stretch and stress distributions through the intima, media and adventitia of the artery wall as functions of the radial coordinate r based on the data from table 1. The solid, long-dashed and short-dashed curves correspond to the circumferential, axial and radial quantities, respectively: (a) principal stretches λr, λθ and λz; (b) radial stress σrr; (c) circumferential stress σθθ; (d) axial stress σzz. The interface between the intima and media is at r = 5.911 and between the media and adventitia at r = 6.724. The units of the stresses are in kilopascals.
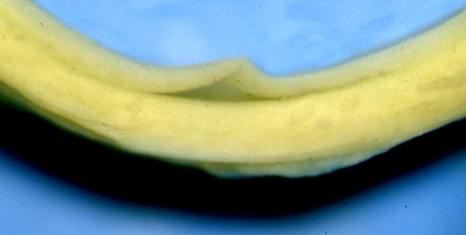
Figure 5b–d exhibit the corresponding stresses σrr, σθθ and σzz through the wall thickness. It is interesting to note that, although small, σrr is compressive throughout and continuous, while the circumferential stress is compressive in the intima and the inner part of the media and tensile in the adventitia and the outer part of the media and is discontinuous across the interfaces. The sign change of σθθ through the wall thickness had been found in the calculations of Chuong & Fung (1986), who seem to have been the first to compute residual stresses using a constitutive model. Their analysis, however, was based on the two-dimensional opening-angle geometry using a single-layer ring of an artery, and the magnitudes of the residual stresses they found were significantly smaller than determined in the present work. The recent work by Alford et al. (2008), based on a two-layer model, found residual circumferential stresses of the same order as documented herein. The compressive circumferential stress in the inner part of the wall is responsible for the buckling and delamination of the intima from the media, as can be seen in experiments (see figure 6; although this sample is from a human iliac artery, rather than an aorta, the phenomenon can easily be appreciated). We recall that the mean axial stress σ¯zz, here calculated as −33.27 kPa, has been subtracted from the axial stress values in each layer in order to ensure that the axial load on the ends of the artery is zero. From table 1, we see that the deformed wall thickness is b(A) − a(I) = 1.435 mm. The separate thicknesses of the intima, media and adventitia are 0.301, 0.813, 0.321 mm, respectively, which are obtained from equations (3.20) and (3.22).
Figure 6.
Part of a ring of a fresh human iliac artery showing local delamination and buckling of the intimal layer from the media. This indicates that in the unloaded configuration the ring bears compressive circumferential stress in the inner part of the wall.
Our calculations show that the qualitative features of the plots are essentially unchanged when the value of μ(M) is changed over quite a range of values except that, as the value of μ(M) is decreased to a certain level, the sign of σzz in the intima switches from positive to negative. Another observation is that the gradient of σθθ in the media layer increases with the value of μ(M). For small values of μ(M), the gradient decreases and in the limit μ(M) → 0 becomes zero (as it should since the material then bears no stress).
The aortas under consideration were aged human aortas with non-atherosclerotic intimal thickening with relatively stiff intimas. By contrast, the intimas in young healthy arteries are insignificant from the solid mechanics point of view, and it is therefore of interest to evaluate the residual stretch and stress distributions in the wall when the intima is neglected. Calculations on this basis are illustrated in figure 7. We have again used the values of the shear modulus for the media and adventitia given in table 1. For the geometrical parameters we have assumed that the media and adventitia have the same thicknesses in the intact configuration, as in the previous example. The radius of the deformed interface is again calculated as r = 6.724 mm.
Figure 7.
As in figure 5 but without the intima, representing a young, healthy aorta. The inner boundary of the media is at r = 5.911 and the interface between the media and adventitia is at r = 6.724. The units of the stresses are in kilopascals.
Note that the circumferential stretch λθ is linear. Figure 7a shows that it is under extension throughout the wall, while the axial stretch λz is under compression in the media and under small constant extension in the adventitia. The radial stretch λr, which is determined by the incompressibility condition, is under extension in the media and compression in the adventitia. The pattern here is very similar to that in the media and adventitia shown in figure 5a except that the numerical values of the stretches in the media are somewhat different. In particular, the values of λθ and λr are larger. With reference to figure 7b we see that these differences are reflected in the significant increase in the compressive circumferential stress σθθ on the inner boundary due to the absence of the intima. The gradient of σθθ through the media is also increased. In this case, the mean axial stress is −57.42 kPa, which has been subtracted from the actual axial stress, and leads to the high axial stress in the adventitia.
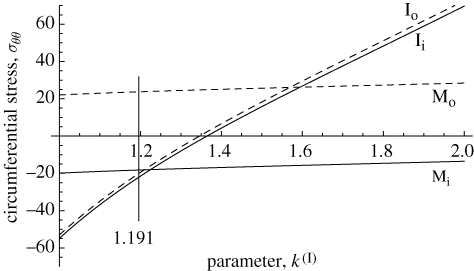
Returning to the example with three layers, we now illustrate in figure 8 the influence of the opening angle α(I), through the parameter k(I) ≥ 1 given in equation (3.4)1, on the circumferential stress σθθ at four key points: the inner and outer boundaries of each of the intima and media. Note that k(I) = 1 corresponds to zero opening angle. We have not considered k < 1 here, which is possible and would correspond to self overlapping of the intima since this was rarely observed in the experiments. The value k(I) = 1.191 given in table 1 is the mean value determined from 16 specimens (see Holzapfel et al. 2007 for further details). It can be seen that the difference between the values of σθθ at the inner and outer boundaries of the intima is very small. When there is no opening angle σθθ is compressive and its value is relatively large, but as the opening angle increases from zero, σθθ increases monotonically and nonlinearly and changes sign from negative to positive. Positive values would seem to be unrealistic and therefore suggest that the opening angle, and hence k(I), is confined to relatively small values, which is what has indeed been observed. The change in σθθ with k(I) is very slight. It does not change sign for the considered range of parameters and is compressive (tensile) at the inner (outer) boundaries of the media.
Figure 8.
Illustration of the influence of the opening angle α(I) expressed through the parameter k(I) = π/(π − α(I)) on the residual circumferential stress σθθ (kPa) at the inner and outer boundaries of the intima and media. The value k(I) = 1.191 is the mean value identified in table 1, which was used in the plots shown in figures 5 and 7. Mi, inner boundary of media; Mo, outer boundary of media; Ii, inner boundary of intima; Io, outer boundary of intima.
A similar analysis conducted by varying k(M) is not so straightforward since in the expressions for the stresses k(M) always appears in the product k(M)l(M), which is determined from the combination of equations (3.20)–(3.22) in terms of k(I) and the other geometrical parameters. Thus, k(M) and k(I) are intimately related through the geometry and also the prevailing residual stresses in the unloaded configuration.
6. Summary and conclusions
In the present work, within the framework of nonlinear elasticity theory, we have conducted the first analysis of the three-dimensional state of residual stress and stretch in a layered artery wall, taking account of bending and stretching in both the axial and circumferential directions for the separate layers. This contrasts with the essentially two-dimensional analysis in previous work. Our analysis was motivated by the detailed experimental data in Holzapfel et al. (2007), which documents three-dimensional residual deformations for intact strips and their separate layers from human abdominal aortas in their passive state. These data make it clear that the opening-angle method, as used previously, is far from adequate for determining the three-dimensional state of residual stress.
Based on the mean values of the geometries in their unstressed configurations, we have derived the deformations and associated stretches required to reconstruct the original intact three-layer arterial segment from the separate intimal, medial and adventitial layers. This involved matching the radii at the interfaces in the intact configuration and imposing continuity of the radial stress across the interfaces in order to force the intact configuration to be circular cylindrical. The analysis was made tractable by the simplifying assumption that the medial layer cut from the circumferential specimen was straight after separation, which is an approximation justified by noting that the mean curvature of the opened media ring is very small (figure 3a). This approach leaves just a single component of the equilibrium equation, the radial component. Using the neo-Hookean material model, this equation has been solved explicitly for each layer to obtain closed-form expressions for the radial, circumferential and axial stress components. The solution procedure outlined in §5.2 is straightforward to implement and enables the stress and stretch values in the radial, circumferential and axial directions for each layer to be determined and exhibited in the figures provided. Their characteristics have been highlighted in §5.3.
A merit of the present approach is that it leads to analytical expressions that are general in the sense that any vessel wall can be studied provided the geometrical properties and material parameters are given, as in table 1. Hence, this framework allows direct prediction of the state of residual stress, which contributes to improved insight into the structure of residual stresses. In addition, it provides a basis for understanding the influences of certain parameters on the overall mechanical response, including the stiffnesses of individual layers. This approach can also help to guide finite element studies of boundary-value problems involving more complicated geometries. Another point to make is that the approach is not restricted to the neo-Hookean model or indeed to isotropy, and the neo-Hookean model can be replaced by, for example, a structural model that embodies fibre directions, although in such cases the stresses would have to be calculated numerically.
The proposed framework can be adapted to allow for shear stresses and strains, which would require use of one or two more components of the equilibrium equation. In this case, the intact artery cannot be circular cylindrical in its unloaded configuration, but the zero axial stress boundary conditions on the ends of the wall can be met. Then, however, it will certainly not be possible to have the advantage of analytical expressions for either the deformation or the stresses. Of course, the very existence of residual stresses begs the question of how they arise. This is not within the scope of the paper but we do mention here the recent works by Azeloglu et al. (2008) and Cardamone et al. (in press) and references therein which suggest mechanisms of residual stress development.
Acknowledgements
Financial support for this research was partly provided through an International Joint Project grant from the Royal Society of London. This support is gratefully acknowledged.
References
- Alford P. W., Humphrey J. D., Taber L. A. 2008. Growth and remodeling in a thick-walled artery model: effects of spatial variations in wall constituents. Biomech. Model. Mechanobiol. 7, 245–262. ( 10.1007/s10237-007-0101-2) [DOI] [PMC free article] [PubMed] [Google Scholar]
- Azeloglu E. U., Albro M. B., Thimmappa V. A., Ateshian G. A., Costa K. D. 2008. Heterogeneous transmural proteoglycan distribution provides a mechanism for regulating residual stresses in the aorta. Am. J. Physiol. Heart Circ. Physiol. 294, H1197–H1205. ( 10.1152/ajpheart.01027.2007) [DOI] [PubMed] [Google Scholar]
- Cardamone L., Valentín A., Eberth J. F., Humphrey J. D. In press Origin of axial prestretch and residual stress in arteries. Biomech. Model. Mechanobiol. ( 10.1007/s10237-008-0146-x) [DOI] [PMC free article] [PubMed] [Google Scholar]
- Chuong C. J., Fung Y. C. 1986. On residual stress in arteries. J. Biomech. Eng. 108, 189–192. ( 10.1115/1.3138600) [DOI] [PubMed] [Google Scholar]
- Holzapfel G. A. 2000. Nonlinear solid mechanics. A continuum approach for engineering. Chichester, UK: Wiley. [Google Scholar]
- Holzapfel G. A. 2006. Determination of material models for arterial walls from uniaxial extension tests and histological structure. J. Theor. Biol. 238, 290–302. ( 10.1016/j.jtbi.2005.05.006) [DOI] [PubMed] [Google Scholar]
- Holzapfel G. A., Gasser T. C., Ogden R. W. 2000. A new constitutive framework for arterial wall mechanics and a comparative study of material models. J. Elasticity 61, 1–48. ( 10.1023/A:1010835316564) [DOI] [Google Scholar]
- Holzapfel G. A., Sommer G., Gasser T. C., Regitnig P. 2005. Determination of the layer-specific mechanical properties of human coronary arteries with non-atherosclerotic intimal thickening, and related constitutive modelling. Am. J. Physiol. Heart Circ. Physiol. 289, H2048–H2058. ( 10.1152/ajpheart.00934.2004) [DOI] [PubMed] [Google Scholar]
- Holzapfel G. A., Sommer G., Auer M., Regitnig P., Ogden R. W. 2007. Layer-specific three-dimensional residual deformations of human aortas with non-atherosclerotic intimal thickening. Ann. Biomed. Eng. 35, 530–545. ( 10.1007/s10439-006-9252-z) [DOI] [PubMed] [Google Scholar]
- Humphrey J. D. 2002. Cardiovascular solid mechanics. Cells, tissues, and organs. New York, NY: Springer. [Google Scholar]
- Humphrey J. D. 2003. Native properties of cardiovascular tissues: guidelines of functional tissue engineering. In Functional tissue engineering (eds Guilak F., Butler D. L., Goldstein St A., Mooney D. J.), pp. 35–45. New York, NY: Springer. [Google Scholar]
- Ogden R. W. 1997. Non-linear elastic deformations. New York, NY: Dover Publications. [Google Scholar]
- Ohayon J., Dubreuil O., Tracqui P., Le Floc'h S., Rioufol G., Chalabreysse L., Thivolet F., Pettigrew R. I., Finet G. 2007. Influence of residual stress/strain on the biomechanical stability of vulnerable coronary plaques: potential impact for evaluating the risk of plaque rupture. Am. J. Physiol. Heart Circ. Physiol. 293, H1987–H1996. ( 10.1152/ajpheart.00018.2007) [DOI] [PubMed] [Google Scholar]
- Olsson T., Stålhand J., Klarbring A. 2006. Modeling initial strain distribution in soft tissues with application to arteries. Biomech. Model. Mechanobiol. 5, 27–38. ( 10.1007/s10237-005-0008-8) [DOI] [PubMed] [Google Scholar]
- Rachev A. 1997. Theoretical study of the effect of stress-dependent remodeling on arterial geometry under hypertensive conditions. J. Biomech. 30, 819–827. ( 10.1016/S0021-9290(97)00032-8) [DOI] [PubMed] [Google Scholar]
- Rachev A., Hayashi K. 1999. Theoretical study of the effects of vascular smooth muscle contraction on strain and stress distributions in arteries. Ann. Biomed. Eng. 27, 459–468. ( 10.1114/1.191) [DOI] [PubMed] [Google Scholar]
- Raghavan M. L., Trivedi S., Nagaraj A., McPherson D. D., Chandran K. B. 2004. Three-dimensional finite element analysis of residual stress in arteries. Ann. Biomed. Eng. 32, 257–263. ( 10.1023/B:ABME.0000012745.05794.32) [DOI] [PubMed] [Google Scholar]
- Roach M. R., Burton A. C. 1957. The reason for the shape of the distensibility curve of arteries. Can. J. Biochem. Physiol. 35, 681–690. [PubMed] [Google Scholar]
- Schulze-Bauer C. A. J., Mörth C., Holzapfel G. A. 2003. Passive biaxial mechanical response of aged human iliac arteries. J. Biomech. Eng. 125, 395–406. ( 10.1115/1.1574331) [DOI] [PubMed] [Google Scholar]
- Taber L. A. 2004. Nonlinear theory of elasticity. Applications in biomechanics. Singapore: World Scientific. [Google Scholar]
- Vossoughi J. 1992. Longitudinal residual strains in arteries. In Proc. 11th Southern Biomedical Engineering Conf., Memphis, TN, pp. 17–19. [Google Scholar]
- Wolfram S. 2009. Mathematica, v. 7.01. Wolfram Research Inc., Champaign, IL. See www.wolfram.com.


