

Abstract
We have established two complementary strategies for purifying naturally occurring regulatory T cells (Tregs) from rhesus macaques in quantities which would be sufficient for use as an in vivo cellular therapeutic. The first identified Tregs based on their being CD4+/CD25bright. The second incorporated CD127, and purified Tregs based on their expression of CD4 and CD25 and their low expression of CD127. Using these purification strategies, we were able to purify as many as 1×10⁶ Tregs from 120cc of peripheral blood. Culture of these cells with anti-CD3, anti-CD28 and IL-2 over 21 days yielded as much as 450-fold expansion, ultimately producing as many as 4.7×10⁸ Tregs. Expanded Treg cultures potently inhibited alloimmune proliferation as measured by a CFSE-MLR assay even at a 1:100 ratio with responder T cells. Furthermore, both responder-specific and third-party Tregs downregulated alloproliferation similarly. Both freshly isolated and cultured Tregs had gene expression signatures distinguishable from concurrently isolated bulk CD4+ T cell populations, as measured by single-plex RT-PCR and gene array. Moreover, an overlapping yet distinct gene expression signature seen in freshly isolated compared to expanded Tregs identifies a subset of Treg genes likely to be functionally significant.
Introduction
Despite dramatic reductions in acute rejection rates, long-term transplant survival rates have changed little during the last decade. (1) This underscores the pressing need for new T-cell directed immunomodulation strategies that focus on improving long-term success, rather than focusing solely on short-term outcomes. (2-4) To defend against an ever-changing array of pathogens, the mammalian immune system has evolved the capacity to generate an extraordinarily diverse repertoire of T cells bearing receptors capable of discriminating foreign peptides presented in the context of self-MHC. (5-7). While the immune system did not evolve to reject transplanted tissues per se, it is nonetheless apparent that immune responses against tissues from non-genetically identical individuals within a species are particularly potent as these tissues are recognized either as a foreign invader or damaged tissues by the host immune system. This is due, at least in part, to the high frequency of T cells that respond to this allogeneic stimulus: In experimental systems, 0.1-10% of a naive individual’s T cell repertoire is capable of reacting with alloantigens expressed by a given fully MHC-disparate donor (8-10). Thus, the response to pathogens and transplants are initiated from fundamentally different ranges of initial precursor frequencies, which may require adjunctive, possibly cellular, therapies to induce successful tolerance to allogeneic tissues. (4, 11-14) There is currently a growing interest in the potential efficacy of selected T cell subpopulations, which may have significant pro-tolerogenic effects, especially during transplantation that crosses MHC barriers. CD4+/CD25bright/FoxP3+ regulatory T cells (Treg cells) have been shown to have powerful immunomodulatory capacity (4, 11-13), and as such, there has been extensive interest in the transfer of these cells after transplantation. In murine models, the transfer of Tregs has been shown to promote tolerance to both bone arrow and solid organ allografts and to protect against graft-versus-host disease. (11, 15-21) Furthermore, emerging studies demonstrate that active regulatory approaches may be as important in primate transplantation models as they have proven to be in rodents. (22,23)
Although the impact of CD4+CD25bright/FoxP3+ Tregs on the immune response after transplantation is gaining wide attention, there have been few published accounts of their characterization from NHP (24), and no accounts of their molecular analysis, despite the importance of both these regulatory cells, and of the NHP preclinical model to the development of clinically relevant immunomodulation strategies. Moreover, given the small number of naturally-occurring Tregs present in peripheral blood of potential donors and the increased potency of Tregs after activation, it is thought that for therapeutic use of Tregs, their expansion ex vivo would be required. Here, we report on two complementary strategies for the expansion of non-human primate Tregs, as well as their functional and genetic characterization.
Methods
Treg Isolation
Peripheral blood mononuclear cells (PBMC) were isolated from rhesus macaques and CD4+ T cells were enriched by negative selection using a human T cell CD4 subset column (R and D systems, Minneapolis, MN). Surface staining for CD4 PerCP cy5.5 (clone L200, BD Biosciences, San Jose, CA) and CD25 APC (clone 3G10, BD Biosciences) was performed and the cells were sorted on a BD FacsAria into populations of CD4+CD25bright (top 1-2% of CD4+CD25+ cells) and CD4+CD25negative cells. In additional experiments, the enriched CD4+ cell population was also stained with CD127 PE (clone M21, BD Biosciences) and the cells were sorted into pure populations of CD4+CD25+CD127lo/− and CD4+CD25−CD127+ cells. Post-sort flow cytometry was performed in order to ensure purity.
Cell Culture and Expansion
Sorted populations of regulatory T cells (CD4+CD25bright or CD4+CD25+CD127low) and bulk CD4+ T cells (CD4+CD25− or CD4+CD25−CD127+) were cultured separately at a concentration of 1 × 10⁶ cells/ml. Cultures took place in X-vivo 15 culture media (Cambrex, East Rutherford, NJ) supplemented with 5% human serum (Irvine Scientific, Santa Ana, CA), N-acetyl cysteine, hepes, penicillin/streptomycin, and gentamicin (all from Sigma, St. Louis, MO). Exogenous human IL-2 (Proleukin; BD Biosciences, San Diego CA) was added to the culture media at a concentration of 2000 units/ml. Rhesus-specific anti-CD3 (FN-18) and anti-CD28 (XR-CD28) combination microbeads (Invitrogen, Carlsbad, CA) were initially added to each culture well at a ratio of 2 beads per cultured cell (24, 25) The cultured cells were split as necessary, based on media color and cell confluency.
Phenotypic Analysis
Flow cytometric analysis was performed at days 0, 7, 14, and 21 of culture using CD4-PerCPCy5.5 (clone L200), CD27 PE (clone M-T271), CD127 PE (clone M21), and CD62L PE (clone SK11) (all antibodies obtained from BD Biosciences). CD25 APC (clone 3G10) was obtained from Caltag/Invitrogen (Carlsbad, CA). Intra-cellular staining for Foxp3 (clone 206D) was performed using a kit purchased from BioLegend (San Diego, CA). Cells analyzed after each of these time-points retained their purity, being 96 +/− 4% CD4+/CD8- (data not shown). The most prominent other cells in the culture were CD4+/CD8+ cells (2%), with CD4-dim/CD8- representing the remaining (<2%) contaminating cells. To analyze for cell-surface and intra-cellular staining, a CD4+ gate was applied prior to gating for other markers (including CD27, CD127, CD62L, CD25 and FoxP3). Analysis of flow cytometry samples was performed either on FACSCalibur (BD Biosciences) or FacsAria (BD Biosciences) cytometers and all data was analyzed using Flowjo cytometry analysis software (Ashland, OR).
Molecular Analyses
RNA preparation
RNA was extracted using RNeasy PLUS Mini kit (Qiagen, Valencia, CA), quantified using a NanoDrop microspectrophotometer (Wilmington, DE) and quality assessed using an Agilent Bioanalyzer 2100 capillary electrophoresis instrument (Agilent Biotechnologies, Palo Alto, CA). RNA integrity numbers were greater than 9.2 in all samples.
Quantitative PCR assays
TaqMan assays for real-time amplification of human sequences were purchased from Applied Biosystems (Foster City, CA) and tested for their ability to amplify Rhesus macaque sequences. TaqMan PCR assays used 25 ng converted RNA per 20 μl amplification reaction. Amplification was detected with an Applied Biosystems 7900HT Sequence Detection System. Data were reported as threshold cycle. Comparisons were made between cell types using the 2−ΔΔCT method (26)
GeneChip© analysis
RNA was amplified and labeled with biotinylated nucleotides using a MessageAmp II kit (Ambion, Inc., Austin, TX) for cultured cells and a Two-Cycle Target Labeling kit from Affymetrix (Santa Clara, CA) for freshly-sorted cells. An Affymetrix cleanup module was used to recover the in vitro transcribed, labeled antisense RNA. Biotinylated aRNA preparations were fragmented and hybridized to Rhesus Macaque Genome microarray chips (Affymetrix, Santa Clara, CA) according to manufacturer’s protocols. Signals were developed and amplified using phycoerythrin-labeled streptavidin according to manufacturer’s recommendations. Microarrays were washed and stained in an Affymetrix fluidics station and scanned on a GeneChip Scanner 3000 (Affymetrix). Data were analyzed using GeneSpring GX 7.0 (Agilent, Palo Alto, CA) following robust multiarray analysis (RMA) normalization (27). Data were analyzed in parallel with SAM, using a delta value of 1.25 with a false discovery rate of 11% for cultured cells and a delta value of 1.35 with a false discovery rate of 1.85% for freshly-isolated cells.
MHC typing
Animals were MHC-typed for 6 MHC class I and 8 MHC class II genes by Taqman RT PCR (Applied Biosystems). (28) These included the Rhesus MHC class I alleles A01, A03, A04, A06, A08, and B01 and the Rhesus MHC Class II alleles DR10303, DR10305, DR10309, DR10403, DR11005, DR30403, DR50301, DR60101, DR60103, DR60104, DRW101, DRW201.
Assays for Treg Suppressive Activity
CFSE-mixed lymphocyte reactions (CFSE-MLR) were performed by preparing the ‘recipient’ T cells by depletion of CD20 and HLA-DR expressing cells using negative selection pan IgG beads (Dynal/Invitrogen, Carlsbad CA) and then labeling with 5μmolar CFSE for 10 minutes at 37°C. Stimulator PBMC (equivalent to ‘donor’ cells in vivo) were irradiated to 3500cGy. 2×10⁵ T-enriched recipient cells along with an equal number of stimulator cells were added to each well in a 96-well plate (Corning). Expanded Treg cells (having been harvested at day 21 of culture) were then added to the experimental wells at varying ratios to the recipient responder cells (1:1, 1:10, 1:100, 1:500). These cells were either termed “recipient”, if they were derived from the same animal as the ‘recipient’ responder T cells, or termed “third-party” if they were derived from a third animal, different from both the ‘recipient’ or the ‘donor’ animal. Expanded bulk CD4+ cells were also added to the control wells at varying ratios to responder cells (1:1, 1:10). The cells were incubated at 37°C for 5 days in X-vivo-15 medium (BioWhitaker, Walkersville, MD) supplemented with 10% human serum (Irvine Scietific, Santa Ana, CA) and then harvested for flow cytometric analysis. T cell proliferation kinetics were analyzed with FlowJo software. For each analysis, proliferation platform curves were generated and two outcomes reported: “percent divided” (percent of all T-cells in the parent generation undergoing division) and “division index” (average number of divisions undertaken by all T-cells in the parent generation.)
Results
CD25bright regulatory cells compromise between ~1 and 2% of CD4+ T cells in Rhesus macaque peripheral blood
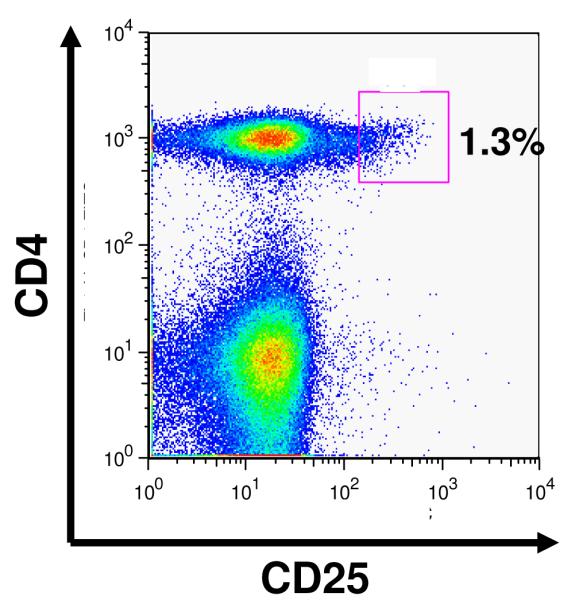
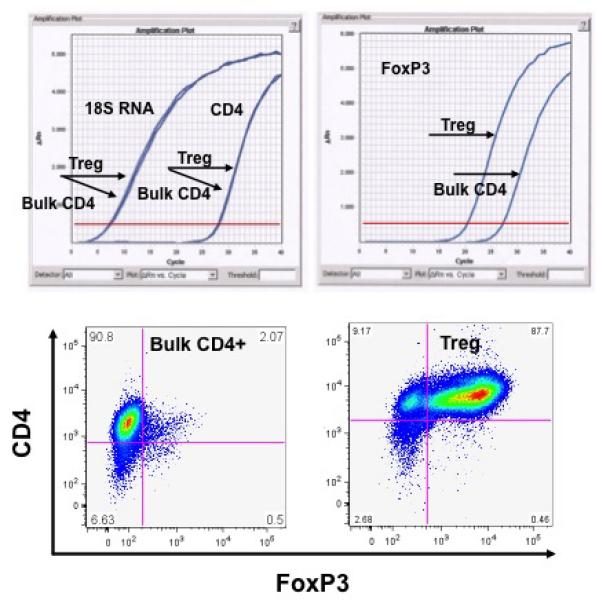
As shown in Figure 1A, and similar to previously published findings with human Tregs (29,30) peripheral blood from Rhesus macaques contain a reproducible population of CD4+CD25bright (Treg) cells which compromise 1.28 ± 0.4 % of the total CD4+ T cell compartment (n= 16). Highly enriched populations of CD4+CD25bright (putative Treg) and CD4+CD25negative (bulk CD4+ T cells) were sorted from an enriched CD4+ lymphocyte population (Figure 1B). Starting with 5.5 ± 2.7×10⁷ enriched CD4+ lymphocytes, the sorting process yielded a median of 2.3 ± 0.6 ×10⁵ putative Treg cells and 7 ± 1 ×10⁶ bulk CD4+ T cells (n = 4), with both populations showing >90% purity on post-sort analysis. The freshly sorted lymphocyte populations were then analyzed for their intracellular expression of Foxp3. The vast majority of the CD4+/Cd25bright cells were Foxp3 positive (85%, ± 5%), in contrast to <5% of the CD4+/CD25- cells Figure 1C).
Figure 1.

Purification of Tregs from Rhesus macaques:
A: Flow cytometric analysis of CD4 cells from rhesus macaques reveals a continuum of CD25 expression, such that ~1% of CD4+ cells can be identified as CD25bright, just has been shown previously for human samples (2h)
B: Representative flow cytometric plots of CD4+/CD25- cells (left panel) and CD4+/CD25bright cells (right panel) after sorting using a FACSAria cell sorter.
C: Representative analysis of FoxP3 expression in either purified bulk CD4 cells or CD4+/CD25bright putative Tregs. Top left panel: RT PCR analysis of control RNAs (18s and CD4) shows no difference in expression between bulk CD4 cells and putative Tregs. RT PCR analysis of FoxP3 (top right panel) shows significantly more FoxP3 message in putative Tregs compared to bulk CD4 cells. Bottom panels: FoxP3 expression as measured by intracellular flow cytometric analysis reveals minimal expression on Bulk CD4 cells but high expression on Tregs.
Robust polyclonal expansion of Rhesus macaque Treg can be accomplished with anti-CD3/anti-CD28 and IL-2
We utilized a polyclonal ex-vivo stimulation strategy in which supramagnetic beads coated with stimulating antibodies to CD3 and CD28 were added to the cultured cells along with 2000U/ml of recombinant human IL-2. As can be seen in Figure 2, Treg cells expanded as much as 450-fold (mean =375-fold; range: 290-fold to 450-fold expansion) over the 3-4 week culture period (n = 9 cultures, four representative cultures are shown). The Treg cells were noted to have a slower proliferative response over the first 5 days of the culture when compared to bulk CD4+ cells, followed by significant expansion for the remaining 3 weeks. Due to their early burst of proliferation, cultured bulk CD4+ T cells increased by as much as 900-fold over the same time period (mean = 800-fold, range = 750 to 900-fold, n= 4). Starting with ~2×10⁵ Treg cells, the culture process routinely resulted in a final yield of ~9×10⁷ cells.
Figure 2.

Both Treg and Bulk CD4 cells exhibit significant expansion when placed in culture conditions as described in Methods.
Sorting primate CD4+ cells by their expression of CD25 and CD127 allows for a up to a 4.5-fold increase in the ex-vivo expanded Treg cells
Recent reports have shown that sorting CD4+ T cells based on their low or negative expression of the IL-7 receptor (CD127) combined with a broader CD25+ gate (capturing all CD25+cells rather than just CD25bright cells) can result in a significant increase in the recovery of Foxp3+ Treg cells from the peripheral blood (29). The increase in the number of Treg cells collected using this technique stems from the fact that a small, but considerable, number of Foxp3+ cells have lower surface expression of CD25 and are therefore lost when isolation is based solely on bright CD25 expression on Tregs (30). We therefore examined rhesus blood for this CD127low and CD25+ population of CD4+ T cells (30, 31). As shown in Figure 3, flow cytometric analysis revealed that a distinct population of CD4+CD25+CD127low could be identified from the peripheral blood; this population represents 7-10% of the CD4+ lymphocytes, compared to 1-2% of the CD4+ T cells that are CD4+CD25bright. Thus, sorting of this distinct population resulted in up to a 5-fold increase in the number of starting cells compared to our previous CD4+CD25bright gating strategy (yielding a mean of 7.8×10⁵ using the CD127-based strategy versus a mean of 2.3×10⁵ using the CD25bright strategy). This increased yield translated into a greater number of Tregs that could be obtained after ex vivo expansion with as many as 4.7×10⁸ Tregs generated over the three week culture period (mean, 3.8×10⁸, range, 2.6-4.7×10⁸, n= 4, Figure 3).
Figure 3.

Sorting putative Tregs on the basis of their low expression CD127 also yields cells with high level expression of FoxP3.
To differentiate the expanded Treg and bulk CD4+ T cell populations, flow-cytometric analysis was performed for cell surface and intracellular expression of marker proteins (Figure 4). Treg cells showed high Foxp3 expression (Figure 4 A,B,C). In addition, surface expression of CD27, a co-stimulatory molecule known to be constitutively expressed on Treg cells with increased suppressive ability (32, 33), remained high on the Treg cells at all culture time points. In contrast, the bulk CD4+ T cells showed a transient increase in surface expression of CD27, which then was downregulated to baseline levels after 10-14 days in culture (Figure 4 A,C). Similarly, CD25 expression in both cell populations was high at day 7 but was sustained at high levels only in the Treg population after 3 weeks of culture (Figure 4 A,C). L-selectin (CD62L) staining was more variable during culture. Both Treg and bulk CD4+ T cells had a bimodal pattern of CD62L expression.
Figure 4.

Flow cytometric analysis of phenotype of either Bulk CD4 cells or Tregs.
A: Representative flow plots showing CD25, FoxP3, CD27 and CD62L expression in either Treg cultures (blue), bulk CD4 cultures (red) or in Treg cultures treated with isotype control antibodies (green). Shown are histograms created after first gating on CD4+ cells. Expression patterns were measured at day 0, day 7, day 14 and day 21 after flow cytometric sorting.
B: Representative dot-plot showing high level of expression of FoxP3 on Treg cultures and low level expression on Bulk CD4 cells. FoxP3 was measured after first gating on CD4+ cells.
C: Representative data depicting the % of positive cells (red) and the mean fluorescence intensity (MFI, black) for CD25, FoxP3, CD27 and CD62L for both Treg and Bulk CD4 cultures measured at 21 days after culturing.
Significant in vitro suppressive ability of expanded Treg
CFSE-MLR assays showed that the addition of autologous Treg cells at a 1:1 ratio to responder lymphocytes resulted in strong inhibition of both CD4 and CD8 lymphocyte proliferation (Figure 5). Titration of the ability of Tregs to suppress allo-proliferation is also shown in Figure 5. As shown for one of three representative experiments, Tregs were able to suppress proliferation of both CD4+ T cells and CD8+ T cells. The suppression of the two subpopulations was equivalent at high ratios of Tregs to responder T cells [~1% of both CD8+ and CD4+ cells divided at Treg:responder T cell ratios of 1:1 and 1:10 (compared to 16% CD8+ T cells divided and 6% CD4+ T cells divided in the absence of Tregs)]. However, at lower Treg:responder T cell ratios the addition of Tregs had more profound inhibitory activity against CD4+ T cells compared to CD8+ T cells. Thus, at a 1:100 ratio, 5.7% of CD8+ T cells divided compared to 0.6% of CD4+ T cells and at a 1:500 ratio, 10.6% of CD8+ T cells divided compared to 3.9% of CD4+ T cells. This experiment was repeated on three separate occasions, with three separate responder:stimulator pairings, with identical results.
Figure 5.

CFSE MLR analysis reveals in vitro suppressive activity of cultured Tregs. Representative CD4+ and CD8+ T-cell proliferation kinetics in MLR in the presence of varying ratios of Tregs to responder T cells are shown. Flowjo analysis was performed and “percent divided” (upper left corner of each panel) and “division index” (upper right corner of each panel) are indicated for each Treg:responder T cell ratio.
Treg-mediated suppression of MLR also occurred with third-party Tregs
We also tested the suppressive ability of expanded Treg cells from a ‘third party’, unrelated animal (also MHC Class I and Class II disparate, and different from both the ‘recipient’ animal, from which the proliferating T cells were derived and the ‘donor’ animal, from which the stimulator cells were derived). At a Treg:Teffector ratio of both 1:1 (Figure 6) and 1:10 (not shown), the suppressive ability of the Treg cells was equally robust when the regulatory cells were derived from these 3rd party animals. As with the responder-specific Tregs, this experiment was repeated on three separate occasions, with identical results
Figure 6.

Representative CD4+ and CD8+ T-cell proliferation kinetics in MLR with and without recipient-specific or third-party Treg influence, showing “percent divided” (upper left corner of each panel) and “division index” (upper right corner of each panel).
NHP Treg have a unique molecular fingerprint when compared to bulk CD4+ T cells
The gene expression profiles of the Treg and bulk CD4+ T cells were assessed by transcript analysis using Affymetrix GeneChips containing over 52,000 probesets covering the M. mulatta genome. Analysis of the data in GeneSpring identified 387 genes with at least two-fold difference in expression between expanded CD25bright and CD25- cells, with a significance of p<0.05. Cluster analysis of these genes showed distinct expression patterns for the expanded Tregs as well as freshly sorted Tregs, each compared to either cultured or freshly-sorted bulk CD4+ T cells (Figures 7,8). SAM analysis with a delta value of 1.25 identified 60 genes that were significantly different between the CD25bright and CD25- RNA preparations. As expected and in agreement with preliminary RT-PCR results (not shown), messages found at increased levels in the cultured Tregs relative to cultured bulk CD4+ T cells included CD25, FoxP3, CD27 and IL-10, and transcripts found in lower amounts included annexin 1, TNF-α, and prostaglandin receptor E2. Tables 1A and 1B show the genes with the greatest differences in expression levels between cultured CD25bright and CD25- cells, as identified by GeneChip analysis. These genes include prepronociceptin (PNOC), and legumain. PNOC is a natural agonist of the opioid receptor-like ORL1(34,35) which has been found to be expressed in T lymphocytes but not previously identified as Treg-specific. Legumain is an asparaginyl endopeptidase which was reported to be expressed at higher level in B lymphocytes (36) and in a γδ T cell clone (37) but has not been identified as Treg specific.
Figure 7.

Cluster diagram of GeneChip results from cultured CD4+/CD25bright and CD4+/CD25- cells. Expression levels were measured in three replicate cultures of each cell type. Significant changes were evaluated following RMA normalization and analysis in GeneSpring. The 387 genes selected were clustered to reveal similarity patterns. Both gene tree and the condition tree were created by unsupervised analysis. Expression levels are shown relative to the average fluorescence intensity of all genes (shown as yellow). Colorbar estimates relative expression levels: Blue indicates lower than average expression, red indicates higher than average expression.
Figure 8.

Cluster diagram of GeneChip results from freshly-sorted CD4+/CD25bright and CD4+/CD25- cells. Expression levels were measured in four replicate preparations of each cell type. The 221 genes that met cutoff criteria (2.5-fold different levels between groups, and p<0.05) were used to create the cluster diagram. Both gene tree and condition tree were generated by unsupervised analysis. Colorbar estimates relative expression levels: Blue indicates lower than average expression, red indicates higher than average expression.
Table 1.
Genes expressed at higher and lower levels in CD4+CD25bright cells (Tregs) compared with CD4+CD25− cells (Bulk CD4+ T cells) following in vitro culture. Results are from GeneChip analysis.
A. Higher expression in cultured CD4+CD25bright cells (Tregs) compared with CD4+CD25− cells (bulk CD4+ T cells)
| Gene name | Fold increase |
Description |
|---|---|---|
| Prepronociceptin | 85 | agonist of opioid-receptor-like receptor (ORL- 1), expressed in T cells |
| Legumain | 44 | asparaginyl endopeptidase, increased on tumor-associated macrophages |
| CTLA-4 | 34 | binds to B7 receptors, important in control of immune responses |
| Thrombospondin-4 | 20 | adhesive glycoprotein, mediates various cell- cell interactions |
| IL-1R type 1 | 12 | type 1 interleukin-1 receptor involved in inflammation, immune responses |
| IL-1R type 2 | 11.6 | decoy receptor for interleukin-1; IL-4 increases its expression |
| IRF6 | 8 | transcription factor; increased levels correlate with response to β-IFN treatment in MS |
| IL-10 | 7.9 | interleukin 10 |
| CCR7 | 6.5 | chemokine receptor, critical for exit of T cells from peripheral tissues |
| LAG3 | 5.5 | activates antigen presenting cells through MHC class 2 signaling |
| IL-28 R | 4.6 | type 1 interferon λ receptor; binds IL-28α, IL- 28β, IL-29 (all IFNλs) |
| FoxP3 | 3.2 | transcription factor found in and required for activity of Tregs |
| CD25 | 3.9 | Interleukin 2 receptor alpha chain |
| CD27 | 2.8 | TNFRSF7, increased on activation |
| SOCS 3 | 3.2 | cytokine-inducible negative regulator of cytokine signaling |
| SOCS 7 | 2.4 | cytokine-inducible negative regulator of cytokine signaling |
B. Lower expression in cultured CD4+CD25bright cells (Tregs) compared with CD4+CD25- cells (Bulk CD4+ T cells)
| Gene name | Fold decrease |
Description |
|---|---|---|
| Annexin 1 | 47 | modulates activation, differentiation in T cells |
| prostaglandin receptor E2 |
17 | possible association with in vivo immunosuppression, activation induced cell death |
| serpin | 14 | serine-protease inhibitor, possible association with inflammatory diseases |
| myotilin | 6.5 | cytoskeleton organization |
We used quantitative RT-PCR to confirm the differential levels of transcripts for several genes which had been identified using GeneChip analysis. Table 2 shows the threshold cycle for each gene and the estimated fold-difference (2−(ΔΔCT)) comparing the two sets of cells. Supporting the GeneChip results, RT-PCR confirmed the much higher levels of expression in CD25bright cells of mRNA specific for FoxP3, CTLA4, IL-10, IL-1 receptor types 1 and 2, Lag3, legumain, prepronociceptin, and thrombospondin 4.
Table 2.
RT-PCR results. Ratios were calculated by the 2-ΔΔCT method to compare fold differences between the cultured or freshly-isolated preparations of CD4+ CD25+ vs. CD4+CD25- cells. The number shown is the geometric mean of calculated fold differences. Threshold cycles are shown for all four cell preparations and are an average of three determinations from cultured cells and two from freshly-isolated cells. A higher threshold cycle indicates a smaller amount of message in the starting material. The maximum cycle number was 40; ND, no signal detected at 40 cycles.
| Gene | Ratio CD25bright:CD25- | Threshold cycle, CD25bright |
Threshold cycle, CD25- |
|||
|---|---|---|---|---|---|---|
| Cultured | Fresh | Cultured | Fresh | Cultured | Fresh | |
| FoxP3 | 80.6 | 79.9 | 23.0 | 23.0 | 29.3 | 29.4 |
| CTLA4 | 50.8 | 5.9 | 21.0 | 26.0 | 26.7 | 28.6 |
| IL-10 | 161.3 | 3.0 | 26.3 | 28.5 | 32.3 | 30.0 |
| CCR7 | 10.1 | 1.2 | 22.0 | 22.0 | 25.3 | 22.2 |
| IL1R1 | 20.2 | 11.9 | 22.0 | 25.7 | 26.3 | 29.3 |
| IL1R2 | 101.6 | 11.1 | 27.7 | 30.4 | 34.3 | 33.9 |
| LAG3 | 10.1 | 1.0 | 25.0 | 29.7 | 28.3 | 29.7 |
| TSP4 | 32.0 | 44.3 | 23.3 | 30.5 | 28.3 | 36.0 |
| LGMN | >80 | 3.9 | 33.7 | 37.0 | ND | 39.0 |
| PNOC | >100 | -- | 33.3 | ND | ND | ND |
| 18S control | 1.1 | 1.0 | 7.1 | 7.0 | 7.1 | 7.0 |
In addition to the analysis of Treg cultures, we also carried out an identical analysis of freshly sorted Treg populations (Figure 8, Table 1C,D). The genes found to be differentially expressed in both the cultured and the freshly-isolated CD25bright cells included CTLA4 and FoxP3, as expected, as well as legumain, interleukin 1 receptors types 1 and 2, adenylate cyclase, and a pleckstrin homology domain, which may be involved in signal transduction as a substrate for protein kinase C. Surprisingly, the two genes with the greatest differential in transcript levels in the freshly-isolated cells encode the alpha chain of the glycoprotein hormones FSH and LH. This gene is usually associated with the pituitary cells known as thyrotropes, which are multifunctional basophilic cells (38), but we have not found references to any T cell synthesis of FSH or LH. CD9 was also differentially expressed between freshly isolated Tregs and bulk CD4+ T cells. This gene has been shown to be expressed on pre-B cells, eosinophils, basophils, and platelets, but there are no previous reports of its expression on any T lymphocyte subsets.
C. Higher expression in freshly-isolated CD4+CD25bright cells (Tregs) compared with CD4+CD25− cells (Bulk CD4+ T cells)
| Gene name | Fold increase |
Description |
|---|---|---|
| FSH-LH □ | 54 | anterior pituitary glycoprotein hormones common alpha subunit |
| MRC1 | 18 | Mannose receptor C, type 1 |
| CD86 | 9.6 | CD28 ligand, lymphocyte costimulatory signaling |
| CD9 | 7.5 | Leukocyte antigen MIC3, motility-related protein |
| IL-17B receptor | 5.7 | interleukin-17B receptor involved in inflammation, immune responses |
| IL-1R type 2 | 5 | decoy receptor for interleukin-1; IL-4 increases its expression |
| CTLA-4 | 4 | binds to B7 receptors, important in control of immune responses |
| FoxP3 | 2.4 | transcription factor found in and required for activity of Tregs |
| Thrombospondin-4 | 2.6 | adhesive glycoprotein, mediates various cell- cell interactions |
D. Lower expression in freshly-isolated CD4+CD25bright cells (Tregs) compared with CD4+CD25− cells (Bulk CD4+ T cells)
| Gene name | Fold decrease |
Description |
|---|---|---|
| CX3CR1 | 47 | chemokine receptor, C-X3-C motif |
| Granzyme H | 30 | serine protease released by cytotoxic T cells and NK cells |
| KLRF1 | 25.3 | killer cell lectin-like subfamily F |
| Granzyme K | 19.6 | serine protease released by cytotoxic T cells and NK cells |
| NKG7 | 15.9 | Natural killer cell protein, G-CSF induced |
| Granzyme B | 14.5 | serine protease released by cytotoxic T cells and NK cells |
| IFNγ | 13.0 | Interferon-gamma |
| CCL4L1 | 9.0 | Chemokine (C-C motif) ligand 4-like 1 |
| NKG2D | 7.8 | activating receptor expressed by T, NK cells; on T, transmits co-stimulatory signal |
Discussion
We have established a strategy for large-scale expansion of rhesus macaque Tregs and have undertaken both a phenotypic and functional analysis of these cells. Our results support not only the feasibility of preparation of in vivo quantities of purified Tregs for possible use as a cellular therapeutic for transplantation, but also in the ability of these cells to dampen alloreactivity, as measured by MLR.
We initially sorted putative Tregs based on the fact that a majority of these cells express high levels of CD25 (CD25bright). However, as previously observed, if FoxP3 expression is used as a ‘gold-standard’ of Treg identity (39) then this method of Treg purification, while quite specific, lacked sensitivity, as a significant proportion of cells expressing lower levels of CD25 (which are excluded in the sort) also were FoxP3-positive. (30,31) By including CD127 in the identification strategy for Tregs, we were able to increase the yield of these cells while not compromising specificity. Given the projected need for large quantities of these cells for adoptive therapy, this increased yield of Tregs after flow cytometric purification may increase the feasibility of using them as a cellular therapeutic.
We used GeneChip analysis to look for expression differences between the Treg and bulk CD4+ T cell populations. After several weeks in culture, we obtained high levels of RNA, as expected from actively proliferating cells. However, the number of differences in expressed genes between the CD25- and CD25bright populations was less dramatic after the culture period than when cells were analyzed directly after isolation from the animals, even though the cultured CD25 bright cells showed strong inhibitory activity in MLR cultures. Since both the freshly isolated and the cultured Treg cell populations display similar inhibitory functions, this analysis serves to identify a subset of Treg-specific genes that have a high likelihood of functional significance vis a vis the regulatory capacity of these cells.
Gene array analysis revealed several important differences among the four cell populations we analyzed (freshly isolated Tregs, freshly isolated bulk CD4+ T cells, cultured Tregs, cultured bulk CD4+ T cells). Comparing the analysis of the two freshly-isolated cells with the two cultured populations, we note that there are many more differentially expressed genes in freshly-isolated cells, as assessed by microarray and SAM analysis, but the magnitude of the differences was much smaller in general. RT-PCR assays suggested that the ratio of message levels was ten-fold or more higher in the cultured cells (cultured CD25 bright vs. cultured CD25-) compared with the ratios observed in the freshly-isolated cells (fresh CD25 bright vs. fresh CD25-) for most of the genes we tested. One exception was Foxp3, for which a ratio of about 80 was observed between the CD25 bright and CD25- cells in both cultured and fresh cells. The difference suggests that the culture period amplifies the differences in essential functional markers that distinguish Tregs from bulk CD4+ T cells, while equally activating many genes involved in cell division and survival in culture. Exposure to IL-2 in culture is one important factor.
Gene expression patterns in CD4+CD25+ Treg cells have been studied in other species. Aside from expression of the defining cell surface molecules and of FoxP3, molecular characterization of Tregs has been elusive, with “signatures” including genes from many different signaling and metabolic pathways. Differences have been noted depending on the site from which cells are derived, activation state of the cells, and perhaps other factors. Early studies in mice showed a fairly wide and diverse array of genes whose expression was increased or decreased in Tregs when compared with bulk CD4+ T cells (40,41), but no unambiguous generalized gene signature has been found that applies to all Tregs. Several factors including Foxp3, activation state of the cells, IL-2 and TGF-β signals all influence the transcriptional signature of these cells (42). Cells isolated from a site of inflammation showed a different array of genes expressed compared with Tregs in lymph nodes (43). Our studies identify several genes also reported to be expressed at increased levels in Tregs in mice: Foxp3, CD25, CTLA-4, and IL-1R type 2 were all found to be increased in both fresh and cultured Tregs, and LAG-3 was also increased in the cultured Treg cells. However, peripheral Tregs from an animal not intentionally vaccinated or activated are likely to have a different molecular phenotype than are activated Tregs derived from a site of inflammation or other immune reaction. The ability to suppress immune responses must be tightly regulated so that this activity occurs only when it is physiologically beneficial to the host.
The analysis of the divergent gene expression patterns between the different cell populations was hindered by the poor annotation of the genes corresponding to each of the probesets on the Rhesus GeneChip©. Many genes are identified cautiously as “similar to” human genes with known function, and there is very limited gene ontology associated with many transcripts, presenting a challenge to interpretation. Several genes are represented by multiple probe sets, which in some cases showed different results, further confounding the interpretation. Even so, we were able to identify many genes which encode molecules with known functions in the immune response which are more highly expressed in the CD25+ Treg cells. However, many of the more highly expressed genes appear to be related to signal transduction pathways which remain poorly defined in the Rhesus genome.
In addition to their phenotypic characterization, we have also begun a functional analysis of in vitro expanded Treg cultures, in order to establish the parameters by which to use these cells as a cellular therapeutic. As shown in Figure 5, expanded Tregs could potently down-regulate allo-proliferation, and were capable of doing so even when present at 1:100 Treg:Teffector ratios. Given an estimate of approximately 1×10¹⁰ T cells/kg in primates, a ratio of 1:100 predicts that approximately 1×10⁸ Tregs/kg would be required for adoptive immunotherapy—as shown in Figures 1-3, this number of Tregs may be practically feasible to achieve with the in vitro expansion strategy that we have developed. As shown in Figure 5, when present at low Treg:Teffector ratios, Tregs were more efficient at inhibiting the allo-stimulated proliferation of CD4+ T cells compared to CD8+ T cells. To our knowledge, this is the first demonstration of a preferential inhibitory capacity of these cells, since previous allo-proliferation assays have used the 3H-thymidine technique, which does not distinguish between CD4+ and CD8+ T cells (44, 45). This preferential activity against CD4+ T cells may have important implications for their potency and specificity in vivo. While these in vitro studies and ratios of effectiveness of Treg:responder T cells certainly will inform in vivo infusion protocols, several issues still exist. These include, most prominently, the following: (1) the fact that Tregs may expand in vivo, making lower numbers necessary than if in vivo proliferation does not occur; (2) that the survival of ex vivo-expanded Tregs has not been determined, thus, if survival is problematic, greater numbers of infused cells may be necessary and (3) homing may be critical for the biological effect of Tregs. Each of these potential confounders, in addition to any enhanced or diminished in vivo preference for targeting CD4 versus CD8 T cells, will require detailed in vivo experiments, to determine the extent to which they impact the efficacy of Treg infusion to down-regulate alloreactivity during transplantation.
There have been previous reports in murine models that Tregs can exhibit their inhibitory effects without regard to their source. (19) The concept of “off-the shelf” Tregs for adoptive immunotherapy has many potentially important clinical implications, as the ability to mass-produce and quality-control Tregs may increase their utility as a cellular therapeutic. However, until this study, the extension of the murine results to primate Tregs had not been established. Our results raise the possibility that this lack of antigen specificity may indeed translate to primate Treg function, as, at least by measured by MLR, third party Treg cultures were capable of inhibiting allo-proliferation. The extent to which increased MHC disparity between Tregs and either responder or stimulator T cells may impact the potency of these “third-party” regulators has not been addressed in this study, nor has the impact of Treg origin on suppression of alloreactivity in vivo.
If Tregs are to be used in patients as a targeted cellular therapeutic capable of down-regulating unwanted immune activation a number of requirements must be met: (1) They must be able to be purified in large quantities from peripheral blood, capable of starting long-term cultures for expansion to clinically-significant numbers. (2) They must be able to be expanded in vitro to levels sufficient for use as an adoptive cellular therapeutic. (3) They must retain their functional integrity throughout the culture period and (4) They must be potent down-regulators of immune responses, so that the numbers of Tregs required for clinical application will be practically feasible. In this report, we have shown that all of these requirements are feasible when the use of Tregs is translated from mice to a non-human primate model.
Acknowledgements and Grant support
The authors gratefully acknowledge the veterinary assistance of Dr. Jack Orkin and the veterinary and animal-care staff at the Yerkes National Primate Research Center.
LSK is supported by an NIH K08 Award #1K08AI065822-01A1, by a Burroughs Wellcome Fund Career Award in the Biomedical Sciences, by the McKelvey Lung Transplant Center, The AFLAC Cancer Center and Blood Disorders Service and an NIH Pediatric Loan Repayment Award. BR is supported in part by National Institutes of Health Grants R01 AI 34495, CA72669, and P01 AI056299, CPL is supported by the Carlos and Marguerite Mason Trust and by the McKelvey Lung Transplant Center. AA, CM, RH,LS, WM, KH, MR, TCP, CPL and LSK are supported by the following NIH grants: #5P01-AI044644-07, 5U19-AI051731-02 and 5R01-AI40519-07. This work was also funded by an NIH Base Grant to the Yerkes National Primate Research Center #P51-RR000165-45.
References
- 1.Meier-Kriesche HU, Schold JD, Kaplan B. Long-Term Renal Allograft Survival: Have we Made Significant Progress or is it Time to Rethink our Analytic and Therapeutic Strategies? Am J Transplant. 2004;4:1289–1295. doi: 10.1111/j.1600-6143.2004.00515.x. [DOI] [PubMed] [Google Scholar]
- 2.Newell KA, Larsen CP, Kirk AD, Newell KA, Larsen CP, Kirk AD. Transplant tolerance: converging on a moving target. Transplantation. 2006 Jan 15;81(1):1–6. doi: 10.1097/01.tp.0000179149.12979.13. [DOI] [PubMed] [Google Scholar]
- 3.Newell KA, Larsen CP. Toward transplantation tolerance: a large step on a long road. Am J Transplant. 2006 Sep;6(9):1989–90. doi: 10.1111/j.1600-6143.2006.01481.x. [DOI] [PubMed] [Google Scholar]
- 4.Kean LS, Gangappa S, Pearson TC, Larsen CP. Transplant tolerance in non-human primates: progress, current challenges and unmet needs. Am J Transplant. 2006 May;6(5 Pt 1):884–93. doi: 10.1111/j.1600-6143.2006.01260.x. [DOI] [PubMed] [Google Scholar]
- 5.Nikolich-Zugich J, Slifka MK, Messaoudi I. The many important facets of T-cell repertoire diversity. Nat Rev Immunol. 2004;4:123–132. doi: 10.1038/nri1292. [DOI] [PubMed] [Google Scholar]
- 6.Blattman JN, Antia R, Sourdive DJ, Wang X, Kaech SM, Murali-Krishna K, Altman JD, Ahmed R. Estimating the precursor frequency of naive antigen-specific CD8 T cells. J Exp Med. 2002;195:657–664. doi: 10.1084/jem.20001021. [DOI] [PMC free article] [PubMed] [Google Scholar]
- 7.Whitmire JK, Benning N, Whitton JL. Precursor Frequency, Nonlinear Proliferation, and Functional Maturation of Virus-Specific CD4+ T Cells. J Immunol. 2006;176:3028–3036. doi: 10.4049/jimmunol.176.5.3028. [DOI] [PubMed] [Google Scholar]
- 8.Suchin EJ, Langmuir PB, Palmer E, Sayegh MH, Wells AD, Turka LA. Quantifying the frequency of alloreactive T cells in vivo: new answers to an old question. J Immunol. 2001;166:973–981. doi: 10.4049/jimmunol.166.2.973. [DOI] [PubMed] [Google Scholar]
- 9.Matesic D, Valujskikh A, Pearlman E, Higgins AW, Gilliam AC, Heeger PS. Type 2 immune deviation has differential effects on alloreactive CD4+ and CD8+ T cells. J Immunol. 1998;161:5236–5244. [PubMed] [Google Scholar]
- 10.Lindahl KF, Wilson DB. Histocompatibility antigen-activated cytotoxic T lymphocytes. II. Estimates of the frequency and specificity of precursors. Journal of Experimental Medicine. 1977;145:508–522. doi: 10.1084/jem.145.3.508. [DOI] [PMC free article] [PubMed] [Google Scholar]
- 11.June CH, Blazar BR. Clinical application of expanded CD4+25+ cells. Semin Immunol. 2006 Apr;18(2):78–88. doi: 10.1016/j.smim.2006.01.006. [DOI] [PubMed] [Google Scholar]
- 12.Kang SM, Tang Q, Bluestone JA. CD4+CD25+ regulatory T cells in transplantation: progress, challenges and prospects. Am J Transplant. 2007 Jun;7(6):1457–63. doi: 10.1111/j.1600-6143.2007.01829.x. [DOI] [PubMed] [Google Scholar]
- 13.Masteller EL, Tang Q, Bluestone JA. Antigen-specific regulatory T cells--ex vivo expansion and therapeutic potential. Semin Immunol. 2006 Apr;18(2):103–10. doi: 10.1016/j.smim.2006.01.004. [DOI] [PubMed] [Google Scholar]
- 14.Bluestone JA, Thomson AW, Shevach EM, Weiner HL. What does the future hold for cell-based tolerogenic therapy? Nat Rev Immunol. 2007 Aug;7(8):650–4. doi: 10.1038/nri2137. [DOI] [PubMed] [Google Scholar]
- 15.Tao R, Hancock WW. Regulating regulatory T cells to achieve transplant tolerance. Hepatobiliary Pancreat Dis Int. 2007 Aug;6(4):348–57. [PubMed] [Google Scholar]
- 16.Oliveira V, Agua-Doce A, Duarte J, Soares MP, Graca L. Regulatory T cell maintenance of dominant tolerance: induction of tissue self-defense? Transpl Immunol. 2006 Dec;17(1):7–10. doi: 10.1016/j.trim.2006.09.028. [DOI] [PubMed] [Google Scholar]
- 17.Edinger M, Hoffmann P, Ermann J, Drago K, Fathman CG, Strober S, Negrin RS. CD4+CD25+ regulatory T cells preserve graft-versus-tumor activity while inhibiting graft-versus-host disease after bone marrow transplantation. Nat Med. 2003;9:1144–1150. doi: 10.1038/nm915. [DOI] [PubMed] [Google Scholar]
- 18.Steiner D, Brunicki N, Bachar-Lustig E, Taylor PA, Blazar BR, Reisner Y. Overcoming T cell-mediated rejection of bone marrow allografts by T-regulatory cells: synergism with veto cells and rapamycin. Exp Hematol. 2006;34:802–808. doi: 10.1016/j.exphem.2006.02.017. [DOI] [PubMed] [Google Scholar]
- 19.Steiner D, Brunicki N, Blazar BR, Bachar-Lustig E, Reisner Y. Tolerance induction by third-party “off-the-shelf” CD4+CD25+ Treg cells. Exp Hematol. 2006;34:66–71. doi: 10.1016/j.exphem.2005.10.011. [DOI] [PubMed] [Google Scholar]
- 20.Rezvani K, Mielke S, Ahmadzadeh M, Kilical Y, Savani BN, Zeilah J, Keyvanfar K, Montero A, Hensel N, Kurlander R, Barrett AJ. High donor FOXP3-positive regulatory T-cell (Treg) content is associated with a low risk of GVHD following HLA-matched allogeneic SCT. Blood. 2006;108:1291–1297. doi: 10.1182/blood-2006-02-003996. [DOI] [PMC free article] [PubMed] [Google Scholar]
- 21.Porter SB, Liu B, Rogosheske J, Levine BL, June CH, Kohl VK, Wagner JE, Miller JS, Blazar BR. Suppressor function of umbilical cord blood-derived CD4+CD25+ T-regulatory cells exposed to graft-versus-host disease drugs. Transplantation. 2006;82:23–29. doi: 10.1097/01.tp.0000225824.48931.af. [DOI] [PubMed] [Google Scholar]
- 22.Torrealba JR, Katayama M, Fechner JH, Jr., Jankowska-Gan E, Kusaka S, Xu Q, Schultz JM, Oberley TD, Hu H, Hamawy MM, Jonker M, Wubben J, Doxiadis G, Bontrop R, Burlingham WJ, Knechtle SJ. Metastable tolerance to rhesus monkey renal transplants is correlated with allograft TGF-beta 1+CD4+ T regulatory cell infiltrates. J Immunol. 2004;172:5753–5764. doi: 10.4049/jimmunol.172.9.5753. [DOI] [PubMed] [Google Scholar]
- 23.Bashuda H, Kimikawa M, Seino K, Kato Y, Ono F, Shimizu A, Yagita H, Teraoka S, Okumura K. Renal allograft rejection is prevented by adoptive transfer of anergic T cells in nonhuman primates. J Clin Invest. 2005;115:1896–1902. doi: 10.1172/JCI23743. [DOI] [PMC free article] [PubMed] [Google Scholar]
- 24.Judy Thomas, Gansuvd B, Asiedu CK, Goodwin J, Jargal U, Deckard LA, Andrades P, Guarcello V, Thomas JM. In vitro expanded human CD4+CD25+ regulatory T cells suppress effector T cell proliferation. Clin Immunol. 2005 Apr;115(1):3–9. doi: 10.1016/j.clim.2005.03.007. treg ref. [DOI] [PMC free article] [PubMed] [Google Scholar]
- 25.Ring S, Thome M, Pretsch L, Enk AH, Mahnke K. Expanded murine regulatory T cells: analysis of phenotype and function in contact hypersensitivity reactions. J Immunol Methods. 2007 Sep 30;326(1-2):10–21. doi: 10.1016/j.jim.2007.06.007. [DOI] [PubMed] [Google Scholar]
- 26.Livak KJ, Schmittgen TD. Analysis of relative gene expression data using real-time quantitative PCR and the 2ΔΔC (T) method. Methods. 2001 Dec;25(4):402–408. doi: 10.1006/meth.2001.1262. [DOI] [PubMed] [Google Scholar]
- 27.Irizarry RA, Hobbs B, Collin F, Beazer-Barclay YD, Antonellis KJ, Scherf U, Speed TP. Exploration, normalization, and summaries of high density oligonucleotide array probe level data. Biostatistics. 2003 Apr;4(2):249–64. doi: 10.1093/biostatistics/4.2.249. [DOI] [PubMed] [Google Scholar]
- 28.Kean LS, Adams AB, Strobert E, Hendrix R, Gangappa S, Jones TR, Shirasugi N, Rigby MR, Hamby K, Jiang J, Bello H, Anderson D, Cardona K, Durham MM, Pearson TC, Larsen CP. Induction of chimerism in rhesus macaques through stem cell transplant and costimulation blockade-based immunosuppression. Am J Transplant. 2007 Feb;7(2):320–35. doi: 10.1111/j.1600-6143.2006.01622.x. [DOI] [PubMed] [Google Scholar]
- 29.Earle KE, Tang Q, Zhou X, Liu W, Zhu S, Bonyhadi ML, Bluestone JA. In vitro expanded human CD4+CD25+ regulatory T cells suppress effector T cell proliferation. Clin Immunol. 2005 Apr;115(1):3–9. doi: 10.1016/j.clim.2005.03.007. [DOI] [PMC free article] [PubMed] [Google Scholar]
- 30.Liu W, Putnam AL, Xu-Yu Z, Szot GL, Lee MR, Zhu S, Gottlieb PA, Kapranov P, Gingeras TR, de St Groth B Fazekas, Clayberger C, Soper DM, Ziegler SF, Bluestone JA. CD127 expression inversely correlates with FoxP3 and suppressive function of human CD4+ T reg cells. J Exp Med. 2006 Jul 10;203(7):1701–11. doi: 10.1084/jem.20060772. [DOI] [PMC free article] [PubMed] [Google Scholar]
- 31.Hartigan-O’Connor DJ, Poon C, Sinclair E, McCune JM. Human CD4+ regulatory T cells express lower levels of the IL-7 receptor alpha chain (CD127), allowing consistent identification and sorting of live cells. J Immunol Methods. 2007 Jan 30;319(1-2):41–52. doi: 10.1016/j.jim.2006.10.008. [DOI] [PubMed] [Google Scholar]
- 32.Koenen HJ, Fasse E, Joosten I. CD27/CFSE-based ex vivo selection of highly suppressive alloantigen-specific human regulatory T cells. J Immunol. 2005 Jun 15;174(12):7573–83. doi: 10.4049/jimmunol.174.12.7573. [DOI] [PubMed] [Google Scholar]
- 33.Duggleby RC, Shaw TN, Jarvis LB, Kaur G, Gaston JS. CD27 expression discriminates between regulatory and non-regulatory cells after expansion of human peripheral blood CD4+ CD25+ cells. Immunology. 2007 May;121(1):129–39. doi: 10.1111/j.1365-2567.2006.02550.x. [DOI] [PMC free article] [PubMed] [Google Scholar]
- 34.Wick MJ, Minnerath SR, Roy S, Ramakrishnan S, Loh HH. Differential expression of opioid receptor genes in human lymphoid cell lines and peripheral blood lymphocytes. J. Neuroimmunol. 1996;64(1):29–36. doi: 10.1016/0165-5728(95)00144-1. [DOI] [PubMed] [Google Scholar]
- 35.Waits PS, Purcell WM, Fulford AJ, McLeod JD. Nociceptin/orphanin FQ modulates human T cell function in vitro. J. Neuroimmunol. 2004;149(1-2):110–120. doi: 10.1016/j.jneuroim.2003.12.018. [DOI] [PubMed] [Google Scholar]
- 36.Manoury B, Hewitt EW, Morrice N, Dando PM, Barrett AJ, Watts C. An Asparaginyl endopeptidase processes a microbial antigen for class II MHC presentation. Nature. 1998;396(6712):695–699. doi: 10.1038/25379. [DOI] [PubMed] [Google Scholar]
- 37.Lahmers KK, Hedges JF, Jutila MA, Deng M, Abrahamsen MS, Brown WC. Comparative gene expression by WC1+ γδ and CD4+ αβ T lymphocytes, which respond to Anaplasma marginale, demonstrates higher expression of chemokines and other myeloid cell-associated genes by WC1+ γδ cells. J. Leukocyte Biol. 2006;80:939–952. doi: 10.1189/jlb.0506353. [DOI] [PubMed] [Google Scholar]
- 38.Villalobos C, Núñez L, Garcia-Sancho J. Anterior pituitary thyrotropes are multifunctional cells. American Journal of Physiology Endocrinology and Metabolism. 2004;287(6):E1166–1170. doi: 10.1152/ajpendo.00194.2004. [DOI] [PubMed] [Google Scholar]
- 39.Tang Q, Bluestone JA. The Foxp3+ regulatory T cell: a jack of all trades, master of regulation. Nat Immunol. 2008 Mar;9(3):239–44. doi: 10.1038/ni1572. Review. [DOI] [PMC free article] [PubMed] [Google Scholar]
- 40.McHugh RS, Whitters MJ, Piccirillo CA, Young DA, Shevach EM, Collins M, Byrne MC. CD4(+)CD25(+) immunoregulatory T cells: gene expression analysis reveals a functional role for the glucocorticoid-induced TNF receptor. Immunity. 2002 Feb;16(2):311–23. doi: 10.1016/s1074-7613(02)00280-7. [DOI] [PubMed] [Google Scholar]
- 41.Gavin MA, Clarke SR, Negrou E, Gallegos A, Rudensky A. Homeostasis and anergy of CD4(+)CD25(+) suppressor T cells in vivo. Nat Immunol. 2002 Jan;3(1):33–41. doi: 10.1038/ni743. [DOI] [PubMed] [Google Scholar]
- 42.Hill JA, Feuerer M, Tash K, Haxhinasto S, Perez J, Melamed R, Mathis D, Benoist C. Foxp3 transcription-factor-dependent and -independent regulation of the regulatory T cell transcriptional signature. Immunity. 2007 Nov;27(5):786–800. doi: 10.1016/j.immuni.2007.09.010. [DOI] [PubMed] [Google Scholar]
- 43.Chen Z, Herman AE, Matos M, Mathis D, Benoist C. Where CD4+CD25+ T reg cells impinge on autoimmune diabetes. J Exp Med. 2005 Nov 21;202(10):1387–97. doi: 10.1084/jem.20051409. [DOI] [PMC free article] [PubMed] [Google Scholar]
- 44.Godfrey WR, Spoden DJ, Ge YG, Baker SR, Liu B, Levine BL, June CH, Blazar BR, Porter SB. Cord blood CD4(+)CD25(+)-derived T regulatory cell lines express FoxP3 protein and manifest potent suppressor function. Blood. 2005 Jan 15;105(2):750–8. doi: 10.1182/blood-2004-06-2467. [DOI] [PubMed] [Google Scholar]
- 45.Li L, Godfrey WR, Porter SB, Ge Y, June CH, Blazar BR, Boussiotis VA. CD4+CD25+ regulatory T-cell lines from human cord blood have functional and molecular properties of T-cell anergy. Blood. 2005 Nov 1;106(9):3068–73. doi: 10.1182/blood-2005-04-1531. [DOI] [PMC free article] [PubMed] [Google Scholar]