

Abstract
An early response to mechanical stimulation of bone cells in vitro is an increase in intracellular calcium concentration ([Ca2+]i). This study analyzed the [Ca2+]i wave area, magnitude, duration, rise time, fall time, and time to onset in individual osteoblasts for two identical bouts of mechanical stimulation separated by a 30-min rest period. The area under the [Ca2+]i wave increased in the second loading bout compared to the first. This suggests that rest periods may potentiate mechanically induced intracellular calcium signals. Furthermore, many of the [Ca2+]i wave parameters were strongly, positively correlated between the two bouts of mechanical stimulation. For example, in individual primary osteoblasts, if a cell had a large [Ca2+]i wave area in the first bout it was likely to have a large [Ca2+]i wave area in the second bout (r2 = 0.933). These findings support the idea that individual bone cells have “calcium fingerprints” (i.e., a unique [Ca2+]i wave profile that is reproducible for repeated exposure to a given stimulus).
1 Introduction
The ability of bone to remodel its mass and geometry in response to varying mechanical stimuli is a well-known phenomenon, but the cellular mechanisms that drive this phenomenon are poorly understood. Bone formation, mineral content, and bone matrix protein production decline when forces on bones are reduced in microgravity during space flight (Landis et al. 2000; Lang et al. 2004). Unloading of bone due to spinal cord injury causes lower extremity diaphyseal cortices to thin and increases fracture incidence (Modlesky et al. 2005). On the other hand, bone overloading during such activities as high impact sports results in an increase in bone mineral density (Andreoli et al. 2001) and cross-sectional properties (Krahl et al. 1994). Elucidating the cellular responses to mechanical stimulation is important for understanding the mechanisms underlying bone adaptation to mechanical loading.
Mechanotransduction is the cellular event that converts mechanical stimuli into biochemical signals, and it is believed to mediate tissue adaptation (Banes et al. 1995; Bloomfield 2001; Burger and Klein-Nulend 1999; Duncan and Turner 1995). When bones are mechanically loaded in vivo, fluid flow in the porous spaces of bone increases (Knothe Tate and Knothe 2000; Knothe Tate et al. 2000). This may mediate adaptation by providing bone cells with physical stimulation and information on the stresses acting on the whole bone. When a physical stimulus is applied to bone cells, the cells respond with numerous biological signaling events; one of the earliest is an increase in intracellular calcium concentration ([Ca2+]i) (Banes et al. 1995). An increase in intracellular calcium is believed to be an important biochemical signal for bone adaptation because it is involved in mechanically induced prostaglandin release in osteocytes (Ajubi et al. 1999) and gene expression in osteoblasts (Ajubi et al. 1999; You et al. 2001). A rest period of 15 min between bouts of mechanical stimulation is required for two initial shear stress induced [Ca2+]i waves in osteoblasts to have the same magnitude (Donahue et al. 2003). Additionally, short rest periods (10-15 s) during oscillating fluid flow stimulation allows multiple [Ca2+]i waves in individual osteoblastic cells, increased [Ca2+]i response magnitudes, and increased overall percent of cells responding compared to uninterrupted flow (Batra et al. 2005). These findings suggest that bone cells have a refractory period, during which they are less sensitive to additional mechanical stimuli. Interestingly, in vivo studies also suggest that refractory periods exist for bone cell mechanotransduction. In vivo, a rest period inserted between consecutive loading bouts enhances bone formation (Robling et al. 2000).
It was qualitatively observed that the overall shape, size, and duration of multiple [Ca2+]i waves in individual bone cells showed remarkable similarity when the rest period between two bouts of mechanical stimulation was 15-30 min in duration (Donahue et al. 2003). The magnitude, duration, and frequency of calcium waves have been hypothesized to code for different cellular events (Dolmetsch et al. 1998). These parameters have been implicated in the regulation of downstream biological events such as gene expression, differentiation, and apoptosis in many cell types (Berridge et al. 1998). It has been hypothesized that [Ca2+]i wave patterns in individual cells are unique for different agonists (Huang et al. 2000; Larsson-Nyren et al. 2002; Prentki et al. 1988; Toescu 1995). The pattern is called a “calcium finger-print” (Prentki et al. 1988). In other words, the [Ca2+]i waves of individual cells have a unique profile that is reproducible for repeated exposure to an identical stimulus. Calcium fingerprints are believed to be the result of several morphological parameters, such as size and shape of the cell body and nucleus, the amount and distribution of the calcium stores, and the subcellular location of the inositol (1,4,5)-trisphosphate (IP3)-generating apparatus (Kraus and Wolf 1996). We hypothesized that calcium fingerprints exist in bone cell mechanotransduction. The aim of this study was to analyze the [Ca2+]i wave area, magnitude, duration, rise time, fall time, and time to onset in individual osteoblastic cells for two bouts of mechanical stimulation separated by a 30-min rest period. We found that “calcium fingerprints” exist in both primary and clonal osteoblastic cells.
2 Materials and methods
2.1 Bone cells
The mouse calvarial osteoblast cell line MC3T3-E1 subclone 14 (ATCC, Manassas, VA) was used in this study. MC3T3 display markers of the osteoblast phenotype including high alkaline phosphatase, type I collagen, and osteocalcin expression (Franceschi and Iyer 1992). We found similar ascorbic acid-induced changes in gene expression in MC3T3-E1 subclone 14. The culture medium consisted of 10% fetal bovine serum (FBS; HyClone-Logan, UT), 1% penicillin/streptomycin (cellgro® by Mediatech, Inc., Herndon, VA, USA), and 89% Minimum Essential Medium Alpha (MEMα) with phenol red (Invitrogen-Carlsbad, CA, USA). We also used primary rat osteoblastic cells (ROBs), which were isolated from the humeri, tibiae, and femora of 4-month-old male Fisher 344 rats as described previously (Donahue et al. 2003). These cells may contain a heterogeneous population, but they display abundant alkaline phosphatase staining characteristic of the osteoblastic phenotype (Donahue et al. 2001). The ROBs were cultured in 79% Dulbecco’s Modified Eagle Medium (DMEM, Gibco, Gaithersburg, MD, USA), 20% FBS, and 1% penicillin/streptomycin. Cells were plated on quartz microscope slides at a density of 75,000-80,000 cells per slide. Both cell types were cultured to 70-80% confluency on the day of experimentation. The culture time after plating was 36 h for the MC3T3 cells and 72 h for the primary cells. The cells were incubated at 37°C with 10 μM of the fluorescent dye Fura-2 for 30 min prior to fluid flow.
2.2 Fluid flow system
Following incubation with Fura-2, the slides were mounted into a parallel plate flow chamber on the stage of a fluorescent microscope, as previously described (Jacobs et al. 1998). Flow media was introduced and the cells were undisturbed for 30 min. The flow media consisted of MEMα without phenol red and 2% FBS. A linear actuator (LinMot, Delavan, WI, USA) was used to pump a 250 μL syringe, which was in series with rigid wall tubing and a flow meter (Transonic Systems Inc., Ithaca, NY, USA), driving fluid through the flow chamber. The system produced laminar fluid flow in the chamber with an oscillatory flow profile. The shear stresses are dependent on the rate of fluid flow and chamber dimensions (Hung et al. 1995), so we were able to produce shear stresses on the cells with magnitudes within the range of what they are predicted to experience in vivo (Weinbaum et al. 1994). The sinusoidal flow produced a peak shear stress of 2 Pa (i.e., 20 dynes/cm2) at a frequency of 1Hz.
2.3 Calcium imaging
Real-time [Ca2+]i was quantified using ratiometric dye methodology. The maximum absorption wavelength of Fura-2 shifts from 363 nm for Ca2+-free Fura-2 to 335 nm for Ca2+-bound Fura-2 (Takahashi et al. 1999). In practice, wavelengths of 340 and 380 nm are used for ratio-metric measurements. The emission peak is near 510 nm for both Ca2+-free and Ca2+-bound Fura-2. All cell types were illuminated at wavelengths of 340 and 380 nm; emitted light was passed through a 510 nm filter and images were collected with a CCD camera. Images of fluorescence intensities were collected every 2 s for MC3T3 and every 5 s for the ROBs. Images were collected for a 1-min no flow period (baseline) prior to fluid flow, during the first 2-min bout of oscillating fluid flow, and 5 min following fluid flow. Following a 30-min rest period, images were collected for another 1-min baseline period, the second 2-min bout of fluid flow, and 5 min post-flow. [Ca2+]i was determined from the ratio of the two emission intensities using calibrated standards and image analysis software (Metaflour, West Chester, PA, USA). Temporal [Ca2+]i profiles were determined for at least 25 individual cells for each slide; cells were defined as regions of interest by the user and ratio values were generated for each cell. Seven slides of MC3T3 cells were examined, and two slides were used for the ROBs. We defined a cellular response as oscillatory when the [Ca2+]i during the flow period was 1.25 times the [Ca2+]i at end of the the baseline period, remained this high for 15 s or more, and eventually returned below 1.25 times the baseline [Ca2+]i.
2.4 Data analysis
The [Ca2+]i waves of the MC3T3 cells and ROBs were analyzed with engineering analysis software (DADiSP, Newton, MA, USA). For each we [Ca2+]i response curve we calculated the magnitude (i.e., maximum concentration), duration, rise and fall time, the time to onset, and area under the curve of the [Ca2+]i versus time profile for both flow periods. The rise and fall time were determined by the differences between the time point of maximal [Ca2+]i and the start and end of the response. Subtracting the first time point considered responsive (1.25 times greater than the end of the baseline period) from the time of the start of flow determined the time to onset value. Paired t tests were used to compare the [Ca2+]i wave parameters in the two flow periods. Linear regressions were performed to determine the relationship between the responses of the individual [Ca2+]i wave characteristics during the first and second flow period. Stepwise regressions were performed to determine the influence of the wave magnitude, duration, rise and fall time, and the time to onset on the area under the curve. All statistical analyses were performed at a significance level of 0.05 using Statview software (SAS Institute, San Francisco, CA, USA).
3 Results
3.1 MC3T3
For a given group of cells, the [Ca2+]i waves were quite heterogeneous. However, for an individual cell, multiple [Ca2+]i waves were relatively homogeneous, even by visual inspection (Fig. 1). This was true for both cell types. Of the 259 individual MC3T3 cells analyzed, 206 responded to both the first and second flow stimuli. Of the remaining 53 cells, 10 responded in the first flow period but not the second, 20 cells responded in the second flow period but not the first, and 23 cells did not respond at all. There was no significant (p > 0.26) difference in duration, time to onset of the waves, and the rise and fall time of the waves when comparing the responses in the first and second flow periods (Table 1). The magnitude (p < 0.0001) and area under the curve (p < 0.0001) were significantly higher during the second flow period.
Fig. 1.
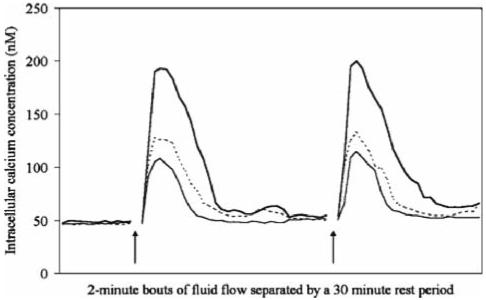
Representative cytosolic calcium concentration ([Ca2+]i) profiles of three individual primary rat osteoblastic cells (dashed and solid lines) for two 2-min bouts of oscillating flow. The bouts of fluid flow were separated by a 30-min rest period. Arrows indicate the onset of flow. For clarity, data during the 30-min rest period is not presented on the graph. The data is from the 1-min baseline and 2-min flow periods. Note the similarity in the [Ca2+]i profiles within the individual cells. Originally published in the Journal of Biomechanics (Donahue et al. 2003)
Table 1.
Mean values (with standard deviations in parentheses) of the [Ca2+]i response parameters for the two cell types
| Duration (s) | Onset (s) | Rise (s) | Fall (s) | Magnitude (nM) | Area (nM s) | |
|---|---|---|---|---|---|---|
| MC3T3-E1 SC-14 loading period 1 | 50.2 (17.6) | 18.7 (7.5) | 11.5 (8.2) | 38.7 (15.4) | 240 (155) | 8,698 (4,305) |
| MC3T3-E1 SC-14 loading period 2 | 51.7 (19.2) | 17.9 (9.2) | 11.6 (8.4) | 40.1 (16.6) | 391 (286) | 11,881 (6,379) |
| p value | <0.0001 | <0.0001 | ||||
| Rat Osteoblastic Cells Loading Period 1 | 75.3 (32.5) | 8.1 (2.8) | 8.2 (5.3) | 67.1 (30.1) | 129 (37) | 6,706 (2,934) |
| Rat Osteoblastic Cells Loading Period 2 | 75.5 (33.2) | 8.1 (2.7) | 8.3 (9.4) | 67.1 (31.8) | 123 (35) | 6,941 (2,851) |
| p value | 0.007 | 0.058 |
For a given cell type, significant differences between the two flow periods are indicated by the p values
The [Ca2+]i wave magnitude (R2 = 0.5259) and area (R2 = 0.5231) were the most strongly correlated parameters between the two flow periods (Fig. 2). The duration, onset, rise, and fall times showed little correlation between loading periods. Stepwise regression showed that the area under the [Ca2+]i wave curve was dependent on the duration and magnitude of the [Ca2+]iwave (Table 2).
Fig. 2.

Linear regressions for the [Ca2+]i wave parameters of MC3T3-E1 SC-14 (n = 206 cells)
Table 2.
Stepwise regression results for the two cell types
| Cell type | Equation |
|---|---|
| MC3T3-E1 SC-14 | Area = -1, 558 + 118 × Duration + 18.534 × Peak |
| R2 = 0.801 | |
| p < 0.0001 | |
| Rat osteoblastic cells | Area = -1, 476 + 22.0 × Duration -269 × Onset + 46.9 × Peak |
| R2 = 0.674 | |
| p < 0.0001 |
3.2 Primary ROB cells
Out of 50 cells, 48 responded to both the first and second flow stimulus. One cell responded in the first flow period but not the second. One cell failed to respond in either flow period. There was no significant difference (p > 0.8755) between the loading periods for the temporal characteristics (Table 1). The area was close to being significantly (p = 0.0578) greater in the second wave than in the first. The magnitude was significantly (p = 0.0079) lower in the second wave than in the first.
The [Ca2+]i wave area (R2 = 0.9327), duration (R2 = 0.9241), magnitude (R2 = 0.87), and fall time (R2 = 0.8426) were the most strongly correlated parameters between the two flow periods (Fig. 3). The onset time was not as strongly correlated (R2 = 0.4234), and the rise time showed little correlation between the two loading periods. Stepwise regressions showed that the area of the wave curve was dependent on the time to onset, duration, and magnitude of the wave (Table 2).
Fig. 3.

Linear regressions for the [Ca2+]i wave parameters of primary rat osteoblastic cells (n = 48 cells)
4 Discussion
The fact that the [Ca2+]i wave area, magnitude, and duration in individual cells were highly correlated for two bouts of mechanically induced [Ca2+]i waves demonstrates the existence of certain predictable characteristics in individual bone cells (“calcium fingerprints”) during mechanotransduction (Figs. 2, 3). The term calcium fingerprint was first coined when characteristic and reproducible patterns of [Ca2+]i waves were observed in insulinoma cells given repetitive stimulation with carbamycholine (Prentki et al. 1988). Evidence has suggested that elevations of [Ca2+]i may play a role in regulating the biological behavior of cells. The spatial and temporal characteristics of the oscillation may be influential in driving biological processes such as transcriptional activation, gene expression, and protein activation (Berridge 1997). In B-lymphocytes, the amplitude and duration of calcium signals influenced transcriptional regulator activation (Dolmetsch et al. 1997). NF-κB and c-Jun N-terminal kinase were activated by large [Ca2+]i waves, while NFAT was activated by low and sustained [Ca2+]i plateaus. Release of calcium from intracellular stores is required for mechanically induced gene expression; the upregulation of osteopontin mRNA in response to fluid flow induced shear stress requires [Ca2+]i waves in MC3T3-E1 cells (You et al. 2001). We found that the area of the [Ca2+]i response was dependent upon the magnitude and duration (Table 2). These characteristics of the [Ca2+]i wave may influence the behavior of calcium-dependent proteins, such as calcineurin and calcium-calmodulin-dependent protein kinase type 2 (CaMKII). The activity of CaMKII is a function of the amplitude and duration of individual spikes in [Ca2+]i (De Koninck and Schulman 1998). CaMKII is more readily activated by transient spikes in calcium (Soderling et al. 2001), while calcineurin is more strongly activated by extended elevated plateaus in [Ca2+]i (Crabtree 2001). We found that the area, magnitude, and duration of [Ca2+]i responses are strongly correlated between two identical loading periods (Figs. 2, 3). Thus, these parameters may be important in mechanotransduction events (e.g., CaMKII activation), which may be important for bone adaptation to mechanical loading in vivo.
There are some limitations with our experiments which require consideration. The sampling frequency for the MC3T3 cells was higher than for the ROBs. Data was collected every 5 s for the ROBs; this interval was decreased to 2 s for the subsequent experiments with MC3T3 cells to better determine the temporal characteristics. However, the results from the ROBs are helpful for understanding mechanically induced [Ca2+]i waves and allow for a comparison between the cell line and primary cell. The primary rat osteoblasts (ROBs) showed stronger correlations in the Ca[2+]i wave parameters between multiple mechanically induced waves. Others have also demonstrated differences between primary and clonal cells in their calcium responsiveness to fluid flow (Allen et al. 1996), although the reason for the differences is unknown.
Rest periods are important for producing repetitive stimulation of in vitro [Ca2+]i responses (Donahue et al. 2003; Larsson-Nyren et al. 2002; Pakhtusova et al. 2003; Prentki et al. 1988). MC3T3 (Fig. 2) and ROBs (Fig. 3) show strong positive correlations for the [Ca2+]i wave area and peak magnitude in two identical mechanical loading bouts separated by a rest period. It is interesting to note that the MC3T3 [Ca2+]i wave area in the second wave is larger than the area in the first bout (Table 1). The cells may have been conditioned by the first bout of fluid flow, allowing a more robust response during the second bout. A possible explanation for this conditioning is increased sensitivity of IP3 and ryanodine receptors due to the increase in [Ca2+]i. The endoplasmic reticulum is the internal source of calcium for calcium-dependent biological processes. Both the IP3 and ryanodine receptor are critical channels controlling calcium release from the endoplasmic reticulum, and one of the main activators of these channels is cytosolic calcium levels (Berridge 1993; Clapham 1995). Increasing the levels of Ca2+ has been shown to increase the sensitivity of ryanodine receptors for calcium and the same may be true for the IP3 receptor (Berridge et al. 2000). A higher sensitivity of these calcium channels could result in a more robust [Ca2+]i wave during the second loading bout, which could cause an increase in the activation (or inactivation) of calcium-dependent targets such as calcineurin and CaMKII. This could result in alterations in gene expression, which may help explain how rest periods between mechanical loading bouts enhance the bone formation response in vivo (Robling et al. 2000, 2001, 2002a,b). Indeed, calcium has been shown to regulate osteoblastic gene expression by acting on calcineurin (Mitsuyama et al. 2004).
Calcium is integral in many cellular processes, from protein activation to gene expression. The characteristics of calcium waves regulate other biological responses (De Koninck and Schulman 1998). When cells are allowed a rest period between two identical loading bouts, the calcium release is more robust, indicating a possible conditioning mechanism for cell responses to consecutive bouts of mechanical stimuli. In conclusion, this study demonstrated evidence for calcium fingerprints for identical mechanical loading bouts in that the magnitude and area of the calcium waves are strongly correlated between two identical bouts of mechanical stimulation. These characteristics of the fingerprints may help predict mechanically induced changes in the expression and activation/inactivation of downstream proteins. Understanding the behavior of [Ca2+]i waves could lead to a better understanding of the downstream signaling events in bone cell mechanotransduction. It may also increase our understanding of how rest periods enhance mechanically induced bone formation in vivo.
Acknowledgments
This work was supported by National Institutes of Health Grants AR45989, AG13087, AG00811, and AG17021, and US Army Grant DAMD 17-98-1-8509.
Contributor Information
Lindsay M. Godin, Department of Mechanical Engineering-Engineering Mechanics, Michigan Technological University, Houghton, MI 49931, USA
Sakiko Suzuki, Department of Biomedical Engineering, Michigan Technological University, 309 Min and Mat Eng Bldg, 1400 Townsend Drive, Houghton, MI 49931, USA.
Christopher R. Jacobs, Biomechanical Engineering Division, Stanford University, Stanford, CA 94305, USA
Henry J. Donahue, Musculoskeletal Research Laboratory, Pennsylvania State University, Hershey, PA 17033, USA
Seth W. Donahue, Department of Mechanical Engineering-Engineering Mechanics, Michigan Technological University, Houghton, MI 49931, USA & Department of Biomedical Engineering, Michigan Technological University, 309 Min and Mat Eng Bldg, 1400 Townsend Drive, Houghton, MI 49931, USA
References
- Ajubi NE, Klein-Nulend J, Alblas MJ, Burger EH, Nijweide PJ. Signal transduction pathways involved in fluid flow-induced pge2 production by cultured osteocytes. Am J Physiol. 1999;276:E171–E178. doi: 10.1152/ajpendo.1999.276.1.E171. [DOI] [PubMed] [Google Scholar]
- Allen FD, Hung CT, Pollack SR, Brighton CT. Comparison of the ca2+ response to fluid flow of mc3tc-e1, ros 17/2.8, and cultured primary osteoblast-like cells to fluid flow. J Cell Eng. 1996;1:117–124. [Google Scholar]
- Andreoli A, Monteleone M, Van Loan M, Promenzio L, Tarantino U, De Lorenzo A. Effects of different sports on bone density and muscle mass in highly trained athletes. Med Sci Sports Exerc. 2001;33:507–511. doi: 10.1097/00005768-200104000-00001. [DOI] [PubMed] [Google Scholar]
- Banes AJ, Tsuzaki M, Yamamoto J, Fischer T, Brigman B, Brown T, Miller L. Mechanoreception at the cellular level: the detection, interpretation, and diversity of responses to mechanical signals. Biochem Cell Biol. 1995;73:349–365. doi: 10.1139/o95-043. [DOI] [PubMed] [Google Scholar]
- Batra NN, Li YJ, Yellowley CE, You L, Malone AM, Kim CH, Jacobs CR. Effects of short-term recovery periods on fluid-induced signaling in osteoblastic cells. J Biomech. 2005;38:1909–1917. doi: 10.1016/j.jbiomech.2004.08.009. [DOI] [PubMed] [Google Scholar]
- Berridge MJ. Inositol trisphosphate and calcium signalling. Nature. 1993;361:315–325. doi: 10.1038/361315a0. [DOI] [PubMed] [Google Scholar]
- Berridge MJ. The am and fm of calcium signalling. Nature. 1997;386:759–760. doi: 10.1038/386759a0. [DOI] [PubMed] [Google Scholar]
- Berridge MJ, Bootman MD, Lipp P. Calcium - a life and death signal. Nature. 1998;395:645–648. doi: 10.1038/27094. [DOI] [PubMed] [Google Scholar]
- Berridge MJ, Lipp P, Bootman MD. The versatility and universality of calcium signalling. Nat Rev Mol Cell Biol. 2000;1:11–21. doi: 10.1038/35036035. [DOI] [PubMed] [Google Scholar]
- Bloomfield SA. Cellular and molecular mechanisms for the bone response to mechanical loading. Int J Sport Nutr Exerc Metab. 2001;11(Suppl):S128–S136. doi: 10.1123/ijsnem.11.s1.s128. [DOI] [PubMed] [Google Scholar]
- Burger EH, Klein-Nulend J. Mechanotransduction in bone - role of the lacuno-canalicular network. Faseb J. 1999;13(Suppl):S101–S112. [PubMed] [Google Scholar]
- Clapham DE. Calcium signaling. Cell. 1995;80:259–268. doi: 10.1016/0092-8674(95)90408-5. [DOI] [PubMed] [Google Scholar]
- Crabtree GR. Calcium, calcineurin, and the control of transcription. J Biol Chem. 2001;276:2313–2316. doi: 10.1074/jbc.R000024200. [DOI] [PubMed] [Google Scholar]
- De Koninck P, Schulman H. Sensitivity of cam kinase ii to the frequency of ca2+ oscillations. Science. 1998;279:227–230. doi: 10.1126/science.279.5348.227. [DOI] [PubMed] [Google Scholar]
- Dolmetsch RE, Lewis RS, Goodnow CC, Healy JI. Differential activation of transcription factors induced by ca2+ response amplitude and duration. Nature. 1997;386:855–858. doi: 10.1038/386855a0. [DOI] [PubMed] [Google Scholar]
- Dolmetsch RE, Xu K, Lewis RS. Calcium oscillations increase the efficiency and specificity of gene expression. Nature. 1998;392:933–936. doi: 10.1038/31960. [DOI] [PubMed] [Google Scholar]
- Donahue SW, Jacobs CR, Donahue HJ. Flow-induced calcium oscillations in rat osteoblasts are age, loading frequency, and shear stress dependent. Am J Physiol Cell Physiol. 2001;281:C1635–C1641. doi: 10.1152/ajpcell.2001.281.5.C1635. [DOI] [PubMed] [Google Scholar]
- Donahue SW, Donahue HJ, Jacobs CR. Osteoblastic cells have refractory periods for fluid-flow-induced intracellular calcium oscillations for short bouts of flow and display multiple low-magnitude oscillations during long-term flow. J Biomech. 2003;36:35–43. doi: 10.1016/s0021-9290(02)00318-4. [DOI] [PubMed] [Google Scholar]
- Duncan RL, Turner CH. Mechanotransduction and the functional response of bone to mechanical strain. Calcif Tissue Int. 1995;57:344–358. doi: 10.1007/BF00302070. [DOI] [PubMed] [Google Scholar]
- Franceschi RT, Iyer BS. Relationship between collagen synthesis and expression of the osteoblast phenotype in mc3t3-e1 cells. J Bone Miner Res. 1992;7:235–246. doi: 10.1002/jbmr.5650070216. [DOI] [PubMed] [Google Scholar]
- Huang TY, Chu TF, Chen HI, Jen CJ. Heterogeneity of [Ca2+]i signaling in intact rat aortic endothelium. Faseb J. 2000;14:797–804. doi: 10.1096/fasebj.14.5.797. [DOI] [PubMed] [Google Scholar]
- Hung CT, Pollack SR, Reilly TM, Brighton CT. Real-time calcium response of cultured bone cells to fluid flow. Clin Orthop Relat Res. 1995;(313):256–269. [PubMed] [Google Scholar]
- Jacobs CR, Yellowley CE, Davis BR, Zhou Z, Cimbala JM, Donahue HJ. Differential effect of steady versus oscillating flow on bone cells. J Biomech. 1998;31:969–976. doi: 10.1016/s0021-9290(98)00114-6. [DOI] [PMC free article] [PubMed] [Google Scholar]
- Knothe Tate ML, Knothe U. An ex vivo model to study transport processes and fluid flow in loaded bone. J Biomech. 2000;33:247–254. doi: 10.1016/s0021-9290(99)00143-8. [DOI] [PubMed] [Google Scholar]
- Knothe Tate ML, Steck R, Forwood MR, Niederer P. In vivo demonstration of load-induced fluid flow in the rat tibia and its potential implications for processes associated with functional adaptation. J Exp Biol. 2000;203:2737–2745. doi: 10.1242/jeb.203.18.2737. [DOI] [PubMed] [Google Scholar]
- Krahl H, Michaelis U, Pieper HG, Quack G, Montag M. Stimulation of bone growth through sports. A radiologic investigation of the upper extremities in professional tennis players. Am J Sports Med. 1994;22:751–757. doi: 10.1177/036354659402200605. [DOI] [PubMed] [Google Scholar]
- Kraus M, Wolf B. Crosstalk between cellular morphology and calcium oscillation patterns. Insights from a stochastic computer model. Cell Calcium. 1996;19:461–472. doi: 10.1016/s0143-4160(96)90055-x. [DOI] [PubMed] [Google Scholar]
- Landis WJ, Hodgens KJ, Block D, Toma CD, Gerstenfeld LC. Spaceflight effects on cultured embryonic chick bone cells. J Bone Miner Res. 2000;15:1099–1112. doi: 10.1359/jbmr.2000.15.6.1099. [DOI] [PubMed] [Google Scholar]
- Lang T, LeBlanc A, Evans H, Lu Y, Genant H, Yu A. Cortical and trabecular bone mineral loss from the spine and hip in long-duration spaceflight. J Bone Miner Res. 2004;19:1006–1012. doi: 10.1359/JBMR.040307. [DOI] [PubMed] [Google Scholar]
- Larsson-Nyren G, Pakhtusova N, Sehlin J. Isolated mouse pancreatic beta-cells show cell-specific temporal response pattern. Am J Physiol Cell Physiol. 2002;282:C1199–C1204. doi: 10.1152/ajpcell.00009.2001. [DOI] [PubMed] [Google Scholar]
- Mitsuyama H, Kambe F, Murakami R, Cao X, Ishiguro N, Seo H. Calcium signaling pathway involving calcineurin regulates interleukin-8 gene expression through activation of nf-kappab in human osteoblast-like cells. J Bone Miner Res. 2004;19:671–679. doi: 10.1359/JBMR.0301256. [DOI] [PubMed] [Google Scholar]
- Modlesky CM, Slade JM, Bickel CS, Meyer RA, Dudley GA. Deteriorated geometric structure and strength of the midfemur in men with complete spinal cord injury. Bone. 2005;36:331–339. doi: 10.1016/j.bone.2004.10.012. [DOI] [PubMed] [Google Scholar]
- Pakhtusova N, Zaostrovskaya L, Lindstrom P, Larsson-Nyren G. Cell-specific [Ca2+] responses in glucose-stimulated single and aggregated beta-cells. Cell Calcium. 2003;34:121–129. doi: 10.1016/s0143-4160(03)00027-7. [DOI] [PubMed] [Google Scholar]
- Prentki M, Glennon MC, Thomas AP, Morris RL, Matschinsky FM, Corkey BE. Cell-specific patterns of oscillating free [Ca2+] in carbamylcholine-stimulated insulinoma cells. J Biol Chem. 1988;263:11044–11047. [PubMed] [Google Scholar]
- Robling AG, Burr DB, Turner CH. Partitioning a daily mechanical stimulus into discrete loading bouts improves the osteogenic response to loading. J Bone Miner Res. 2000;15:1596–1602. doi: 10.1359/jbmr.2000.15.8.1596. [DOI] [PubMed] [Google Scholar]
- Robling AG, Burr DB, Turner CH. Recovery periods restore mechanosensitivity to dynamically loaded bone. J Exp Biol. 2001;204:3389–3399. doi: 10.1242/jeb.204.19.3389. [DOI] [PubMed] [Google Scholar]
- Robling AG, Hinant FM, Burr DB, Turner CH. Improved bone structure and strength after long-term mechanical loading is greatest if loading is separated into short bouts. J Bone Miner Res. 2002a;17:1545–1554. doi: 10.1359/jbmr.2002.17.8.1545. [DOI] [PubMed] [Google Scholar]
- Robling AG, Hinant FM, Burr DB, Turner CH. Shorter, more frequent mechanical loading sessions enhance bone mass. Med Sci Sports Exerc. 2002b;34:196–202. doi: 10.1097/00005768-200202000-00003. [DOI] [PubMed] [Google Scholar]
- Soderling TR, Chang B, Brickey D. Cellular signaling through multifunctional ca2+/calmodulin-dependent protein kinase ii. J Biol Chem. 2001;276:3719–3722. doi: 10.1074/jbc.R000013200. [DOI] [PubMed] [Google Scholar]
- Takahashi A, Camacho P, Lechleiter JD, Herman B. Measurement of intracellular calcium. Physiol Rev. 1999;79:1089–1125. doi: 10.1152/physrev.1999.79.4.1089. [DOI] [PubMed] [Google Scholar]
- Toescu EC. Temporal and spatial heterogeneities of [Ca2+] signaling: mechanisms and physiological roles. Am J Physiol. 1995;269:G173–G185. doi: 10.1152/ajpgi.1995.269.2.G173. [DOI] [PubMed] [Google Scholar]
- Weinbaum S, Cowin SC, Zeng Y. A model for the excitation of osteocytes by mechanical loading-induced bone fluid shear stresses. J Biomech. 1994;27:339–360. doi: 10.1016/0021-9290(94)90010-8. [DOI] [PubMed] [Google Scholar]
- You J, Reilly GC, Zhen X, Yellowley CE, Chen Q, Donahue HJ, Jacobs CR. Osteopontin gene regulation by oscillatory fluid flow via intracellular calcium mobilization and activation of mitogen-activated protein kinase in mc3t3-e1 osteoblasts. J Biol Chem. 2001;276:13365–13371. doi: 10.1074/jbc.M009846200. [DOI] [PubMed] [Google Scholar]