

Abstract
In previous studies, microarray analysis of livers from mice fed diethyl-1,4-dihydro-2,4,6-trimethyl-3,5-pyridine decarboxylate (DDC) for 10 weeks followed by 1 month of drug withdrawal (drug-primed mice) and then 7 days of drug refeeding showed an increase in the expression of numerous genes referred to here as the molecular cellular memory. This memory predisposes the liver to Mallory Denk body formation in response to drug refeeding. In the current study, drug-primed mice were refed DDC with or without a daily dose of S-adenosylmethionine (SAMe; 4 g/kg of body weight). The livers were studied for evidence of oxidative stress and changes in gene expression with microarray analysis. SAMe prevented Mallory Denk body formation in vivo. The molecular cellular memory induced by DDC refeeding lasted for 4 months after drug withdrawal and was not manifest when SAMe was added to the diet in the in vivo experiment. Liver cells from drug-primed mice spontaneously formed Mallory Denk bodies in primary tissue cultures. SAMe prevented Mallory Denk bodies when it was added to the culture medium.
Conclusion
SAMe treatment prevented Mallory Denk body formation in vivo and in vitro by preventing the expression of a molecular cellular memory induced by prior DDC feeding. No evidence for the involvement of oxidative stress in induction of the memory was found. The molecular memory included the up-regulation of the expression of genes associated with the development of liver cell preneoplasia.
Mallory bodies (MBs) are an important component of chronic progressive liver injury.1–5 MBs have been renamed Mallory Denk bodies (MDBs) in recognition of Dr. Denk’s important contributions to the understanding of MBs.1 Because S-adenosylmethionine (SAMe) is effective in attenuating alcoholic and nonalcoholic liver disease experimentally,6 it has been postulated that SAMe treatment would attenuate MDB formation with the drug-primed mouse model.
The questions are as follows: what is the role of molecular cellular memory and oxidative stress in the induction of MDB formation in drug-primed mice and how does SAMe treatment affect these two parameters? In the drug-primed mouse, MDB formation is induced in 7 days of drug refeeding or in 6 days of primary liver cell culture.7–10 Microarray analysis performed on livers from drug-primed or drug-refed mice showed that the expression of a large number of genes was changed when MDBs were formed.11 Experiments in which signal transduction cascades involving extracellular signal-regulated kinase 1/2, nuclear factor kappa B (NFκB), or p38 pathways were blocked by chemical inhibitors showed that inhibition of each pathway prevented MB formation in vitro.7,8 The latter results suggest that oxidative stress, followed by signaling that leads to changes in gene expression, may be the initiating factor. However, microarray data12 on the livers of drug-primed mice indicate that molecular cellular memory may also be involved in MDB formation because naïve mice fed the drug do not form MDBs in 7 days. MDBs form in livers of mice only after 10 weeks of feeding the drug.10 After the drug is withdrawn for 1 month and the liver cells are grown in primary tissue culture for 6 days, the cells form MDBs spontaneously,7–9,11,12 and this indicates that the stress of the tissue culture environment is enough to trigger MDB formation by the drug-primed liver cells. In fact, microarrays performed at 3 hours of primary culture of primed liver cells were already changed, and this indicates that their molecular cellular memory was already initiated during the liver cell isolation procedure.7 These results indicate that the diethyl-1,4-dihydro-2,4,6-trimethyl-3,5-pyridine decarboxylate (DDC)–primed hepatocytes acquired a memory that predisposed them to form MDBs both in vivo and in vitro. It is possible that the mechanism that could account for this memory is epigenetic in nature to support this concept. Prior studies on the livers of drug-primed and drug-refed mice showed that the expression of 649 genes was changed in the drug-primed and drug-refed mice livers.11 The expression of ubiquitin D (UBD; FAT10 diubiquitin in man), alpha fetoprotein (Afp), connective tissue growth factor, integrin beta 2, DNA methyl transferase 3a, and DNA damage-inducible 45 gamma was markedly increased in the livers of the drug-primed mice. DNA methyl transferase 3b was down-regulated, as was CREB binding protein (Cbp)/p300. Following the refeeding of DDC to the drug-primed mice, microarray analysis was performed. This showed that DNA methyl transferase and histone deacetylase were up-regulated. Histone 3 lysine 9 acetylation was increased by DDC feeding and DDC refeeding. These data support the concept that epi-genetic cellular memory explains the quick MDB formation response seen when DDC is refed to drug-primed mice, in which the gene expression response is altered by changes in histone acetylation and methylation as well as DNA methylation.
The molecular basis for the DDC-primed mouse cellular memory may involve gene expression changes as the result of DNA or histone methylation. For instance, gene silencing due to heterochromatin formation results when enzyme activity leads to trimethylation of histone 3 lysine 9.13 On the other hand, trimethylation of histone 3 lysine 4 is associated with euchromatin and transcriptional activation.14 Both mechanisms may act in concert to provide stability to the changed gene expression in an epigenetic way, which could explain the genetic memory seen in the DDC-withdrawn mouse model of MDB formation.
To test this possibility, mice withdrawn from DDC for 9 weeks, 11 weeks, or 4 months were refed DDC for 7 days with or without SAMe as a methyl donor to see if methylation would affect the formation of MDBs. The livers were also studied by microarray analysis, and evidence for oxidative stress was sought.11 It is postulated that hypermethylation may alter the epigenetic memory of gene expression in the drug-primed hepatocytes and, as a result, prevent MDB formation in vivo. When drug-primed mouse hepatocytes were cultured for 6 days, they spontaneously formed MDBs in vitro. SAMe was added to some of the cultures to see whether SAMe-induced hypermethylation in vitro would affect MDB formation.
Materials and Methods
Animals
In control group 1, three 1-month-old C3H male mice (Harlan Sprague-Dawley, San Diego, CA) were fed a protein-rich, semisynthetic, complete standard control diet (Teklad, Madison, WI).9 In group 2, 10 mice were fed the control diet with 0.1% DDC (Aldrich, St Louis, MO) for 10 weeks to induce MDB formation in vivo. They were then withdrawn from DDC for 9 weeks (2 mice), 11 weeks (4 mice), or 4 months (4 mice), at which times the MDBs had mostly disappeared. They were then refed DDC with or without SAMe (4 g/kg of body weight daily by gavage) for 7 days. At this time, they were anesthetized with 33% ketamine, and their livers were fast-frozen with liquid nitrogen. A portion of liver was fixed in 10% buffered zinc formalin for histologic studies. In some studies, fast frozen livers stored at −80°C from control and DDC-fed mice from previous studies were used.5 All mice were treated in accordance with animal legislation, and their treatment was approved by the Animal Care Committee at Harbor-UCLA LA Biomed Research Institute according to the guidelines of the National Academy of Science.
Liver Cell Isolation and Tissue Cultures
Three drug-primed mice, withdrawn from DDC, were used to test SAMe’s ability to inhibit MB formation in vitro. The mice were anesthetized with 33% ketamine (Phoenix, St. Joseph, MO). Surgery was performed to insert a catheter into the hepatic vein. The livers were then perfused in a retrograde manner with phosphate-buffered saline containing 100 U/mL collagenase type 1 (Sigma, St. Louis, MO) and 0.1 U/mL elastase (Worthington, Lakewood, NJ). After perfusion, the livers were removed, and the cells were dispersed in William’s E serum-free medium (Sigma) containing fatty acid free bovine serum albumin (5 mg/mL), insulin (2.4 u/L), dexamethasone (3.9 μg/mL), ornithine (67 μg/mL), and streptomycin/penicillin (10 mL/L). The hepatocytes were plated at a density of 105 per well on six-well plates containing fibronectin-coated glass coverslips. Three wells contained SAMe (2 mM; Sigma Chemical Co), and three wells were SAMe-free. The media and SAMe were changed on day 4 of the culture, and the cultures were stopped at day 6. The cells on the coverslips were fixed with 100% ethanol and then double-stained for ubiquitin (Ub) and keratin 8 (K8). The experiment was repeated 3 times for a total of 9 coverslips per treatment.
Microarray Analysis
Liver tissue from mice of each of the treatment groups was subjected to microarray analysis. Total liver RNAs were extracted with the Ultraspec RNA isolation system (Biotecx Laboratories, Houston, TX) and cleaned with Rneasy columns (Qiagen, Valencia, CA). Five micrograms of total RNA was used for preparing biotin-labeled complementary RNA (cRNA). Labeled and fragmented cRNA was subsequently hybridized to the Mouse Genome 430 2.0 Array (Affymetrix, Santa Clara, CA). Labeling, hybridization, image scanning, and initial data analysis were performed by the Microarray Core at the Los Angeles Biomedical Research Institute. Sample preparation and loading, hybridization, staining, and microarray data analysis were carried out.11
Quantitative Real-Time Reverse-Transcription Polymerase Chain Reaction (RT-PCR) Assay
Total liver RNAs were extracted with the Trizol plus RNA purification kit (Invitrogen, Carlsbad, CA). Synthesis of cDNAs was performed with 5 μg of total RNA and 50 ng of random hexamer primers with SuperScript III RNase H− reverse transcriptase (Invitrogen). Polymerase chain reaction (PCR) primers were designed with the assistance of Primer Express software (Applied Biosystems, Foster City, CA). The primers for mouse liver UBD and Kruppel-like factor-6 (KLF6) were as follows:
UBD: NM_023137, FmUBD, 5-GATTGACAAGGA-AACCACTATCCA
UBD: NM_023137, RmUBD, 5-ACAAGGGCAG-CTCTTCATCAC
KLF6: NM_011803.2, FmKLF6, 5-CTCGGACTC-CTGATCGTTCAC
KLF6: NM_011803.2, RmKLF6, 5-CCGTTTCGT-GCACAATCTGTA
Sense and Antisense
Quantitative PCR was achieved with the SYBR Green JumpStart Tag ReadyMix (Sigma) on an ABI-Prism 7700 sequence detector system (Applied Biosystems, Foster City, CA). The thermal cycling consisted of an initial step at 50°C for 2 minutes followed by a denaturation step at 95°C for 10 minutes and then 40 cycles at 95°C for 15 s and at 60°C for 1 minute. The single PCR product was confirmed with the heat dissociation protocol at the end of the PCR cycles. Quantitative values were obtained from the threshold PCR cycle number (Ct), at which point the increase in signal associated with exponential growth for the PCR product started to be detected. The target messenger RNA (mRNA) abundance in each sample was normalized to its 18S level as ΔCt = Cttarget gene − Ct18S. For each target gene, the highest ΔCt was assigned as ΔCtmax. The relative mRNA levels were calculated as 2ΔΔCt (ΔΔCt = ΔCtmax − ΔCt).
Cellular Fractionation
Rat liver homogenates were prepared by the homogenization of 100 mg of frozen liver tissue in 2 mL of a 20 mM trishydroxymethylaminomethane-HCl (pH 7.5), glycerol (10%), ethylene glycol tetraacetic acid (1 mM), dithiothreitol (1 mM), sodium fluoride (50 mM), and protease and phosphatase inhibitor cocktail (Sigma). The tissues were homogenized with the Ultra-Turrax T25 homogenizer. Protein concentrations were determined with the Bradford method.15
Carbonyl Protein Levels
Carbonyl protein was measured with the Oxyblot kit from Chemicon (Temecula, CA) with a primary rabbit antibody (Integrin, Purchase, NY). The carbonyl groups produced by oxidation were detected by derivatization to 2,4-dinitrophenylhydrazone by reaction with 2,4-dinitrophenylhydrasine.16 The dinitrophenyl-derivatized proteins were detected by western blots using a rabbit antibody.
Measurement of Liver Homogenate 4-Hydroxynonenal (4-HNE) and Malondialdehyde (MDA) Concentrations
4-HNE was measured in the liver homogenates with a lipid peroxidation kit (Oxford Biomedical Research, Oxford, MI). This assay is based on the reaction of a chromogenic reagent, N-methyl-2-phenylindole (R1), with MDA and 4-hydroxyalkenals at 45°C. One molecule of either MDA or 4-HNE reacts with two molecules of reagent R1 to yield a stable chromophore with maximal absorbance at 586 nm. MDA and 4-HNE were assessed at the same time in the samples, and the 4-HNE concentration was calculated by the subtraction of the reading of this measurement from the reading of the MDA concentration measurement. The 4-HNE concentration was determined with the standard for MDA, as recommended by the supplier.
Glutathione (GSH) Levels
GSH was measured in 12 mice livers (2 controls, 5 refed DDC, and 5 refed DDC plus SAMe) with the Cayman glutathione assay kit (Cayman Chemical Co., Ann Arbor, MI.). The Cayman kit is based on using glutathione reductase for quantitation of GSH. The sulfhydral group of GSH reacts with 5,5′-dithiobis-(2-nitrobenzoic acid) to produce a yellow color (2-nitro-5-mercaptobenzoic acid [TNB]). Glutathione reductase reduces concomitantly formed GSTNB (glutathione-nitrobenzoic acid) to form TNB. The rate of TNB production is directly proportional to GSH. All standards and samples were done in duplicate.
Western Blot Analysis
Proteins (50 μg) from liquid nitrogen–frozen stored livers were separated by sodium dodecyl sulfate–polyacrylamide gel electrophoresis gels and transferred to a polyvinylidene fluoride membrane (Bio-Rad, Hercules, CA) for 1 hour in 25 mM trishydroxymethylaminomethane-HCl (pH 8.3), 192 mM glycine, and 20% methanol. The membranes were stained with primary antibodies to the antigens. Appropriate species of antipolyclonal and monoclonal horseradish peroxidase– conjugated antibodies were used as the secondary antibodies. The membranes were subjected to chemiluminescence detection with luminal according to the manufacturer’s instructions (Amersham Pharmacia Biotech, Piscataway, NJ).
Immunohistochemistry
Liver sections, cell suspensions, and tissue cultures on coverslips were immunostained with primary antibodies. Liver tissue was fixed in 10% buffered zinc formalin. Cell suspensions were fixed in cold acetone for 10 minutes and then kept at −20°C until they were stained. Tissue cultures on coverslips were fixed in 100% ethanol and kept at 4°C. To begin staining, the cells were incubated with primary antibodies to Ub to stain MDB and to K8 to stain keratin filaments. This was done as a double stain with a mouse monoclonal antibody to K-8 (Fitzgerald, FDI, Concord, MA) and a rabbit polyclonal antibody to Ub (Dako, Carpinteria, CA). Texas red and fluorescein iso-thiocyanate (FITC)– conjugated secondary antibodies were used. 4′,6-Diamidino-2-phenylindole (DAPI) was used as the nuclear stain. The antibody to 5-methyl cytosine (Calbiochem, Darmstadt, Germany) was used to stain nuclear methylation. MDBs were quantitated morphometrically (MDB/mm2) with a Nikon 400 fluorescent microscope with an FITC filter cube and a triple-color-band filter cube to detect FITC-labeled and Texas red–labeled antibodies.
Statistical Analysis
P values were determined by analysis of variance and Student-Newman-Keuls for multiple group comparisons (Sigma-Stat Software, San Francisco, CA). Microarrays were analyzed with Wilcoxon’s signed rank test comparison analysis to derive biologically significant results from the raw probe cell intensities on expression arrays. For comparison analysis, each probe set on the experiment array was compared with its counterpart on the control array to calculate the change in the P value that was used to generate the difference call of increase (P < 0.04), marginal increase (P < 0.04 to P < 0.06), decrease (P > 0.997), marginal decrease (P > 0.992 to P > 0.997), or no change (P > 0.06 to P < 0.997). Comparison analysis was used to generate a signal log ratio for each probe prior to the experimental array to the corresponding probe pair on the control array. This strategy cancels out differences resulting from different probes binding coefficients. The signal log ratio was computed with a one-step Tukey bi-weight method from the mean of the log ratio of probe pair intensities across the two arrays.
Results
DDC-Primed Mouse Model
The microarray analysis of the livers of mice fed DDC, withdrawn from DDC, and refed DDC (drug-primed mouse model) was published previously.11 Mice fed the control diet without SAMe and a mouse fed the control diet with SAMe added (4 g/kg/day for 7 days) showed differences in gene expression. When the results were normalized, the gene expression of 40 genes was changed 1.6-fold or more (Fig. 1). Some of the affected genes of interest are listed in Table 1. When drug-primed mice were fed SAMe and DDC for 7 days, SAMe ingestion ameliorated the changes in gene expression induced by DDC (Fig. 1). This was true after 9 weeks, 11 weeks, and 4 months of DDC withdrawal. The data indicate that, even after 4 months of withdrawal from the drug, the mice livers were still primed to respond to the DDC challenge, and this response was blocked by SAMe.
Fig. 1.

Heat map showing the changes in gene expression when DDC was refed 7 days to mice withdrawn from DDC for 9 weeks, 11 weeks, and 4 months. 379 refers to 379 genes that were associated with MDB formation: the effect of SAMe. The blue lines are branches or nodes of the gene tree for clustering analysis of related genes. The green lines indicate a low level of gene expression. The yellow lines are an indication of average gene expression. The red lines are an indication of a high level of gene expression. The white lines are an indication of too low expression to be valid. The gene expression pattern was the same for each time period, that is, 9 weeks, 11 weeks, and 4 months, as indicated by the mostly red and green columns. This indicated that the cellular memory of the drug-primed mice was not diminished by 4 months’ withdrawal. DDC-refed mice for which SAMe was added to the diet failed to undergo the changes induced by DDC refeeding, as indicated by the mostly yellow columns, and this indicated that the SAMe treatment prevented the gene changes induced by DDC refeeding.
Table 1.
Microarray Analysis of Gene Expression of One Mouse Fed SAMe Compared to Two Mice Fed the Control Diet
| Gene Title | Gene Symbol | Average Ratio (Fold Change) |
|---|---|---|
| Activating transcription factor 3 | Atf3 | 2 |
| Proteosome (prosome, macropain) subunit, beta type 8 (large multifunctional peptidase 7) | Psmb8 | 1.74 |
| Caspase 12 | Casp12 | −1.62 |
| Interleukin 1 family, member 9 | Il1f9 | −1.87 |
| Guanylate nucleotide binding protein 2 | Gbp2 | −1.87 |
| Profilin 2 | Pfn2 | −1.87 |
| N-myc downstream regulated gene 1 | Ndrg1 | −2.07 |
| EGF-like module containing mucin-like, hormone receptor-like sequence 4 | Emr4 | −2.07 |
| Prostaglandin-endoperoxide synthase 1 | Ptgs1 | −2.07 |
| CD97 antigen | Cd97 | −2.07 |
| Histocompatibility 2, class II antigen E beta | H2-Eb1 | −2.38 |
| Interleukin 2 receptor, gamma chain | Il2rg | −2.64 |
| Kruppel-like factor 6 | Klf6 | −2.73 |
| Fibrinogen-like protein 2 | Fgl2 | −2.93 |
| Fc receptor, immunoglobulin G, high affinity I | Fcgr1 | −4.59 |
| Histocompatibility 28 | H28 | −5.46 |
| Alpha fetoprotein | Afp | −5.46 |
| Ribonuclease L (2′, 5′-oligoisoadenylate synthetase-dependent) | Rnasel | −14.42 |
One mouse fed SAMe (4 g/kg of body weight) for 7 days was compared with control mice. The microarrays showed predominantly down-regulation of the genes listed. Note that Klf6 and Afp were down-regulated (bold).
When the changes in gene expression induced by DDC refeeding were compared with the changes in gene expression when DDC was fed with SAMe with Kyoto Encyclopedia of Genes and Genomes (KEGG) functional pathway software, it was apparent that practically all the pathways were affected by DDC refeeding and most of these effects were reduced by SAMe feeding (Fig. 2). The KEGG results indicate that the number of genes in each pathway is the total number of genes in KEGG on this pathway, and the percentage means that 2%–20% of the genes were changed. For example, out of 147 cell adhesion genes studied on the microarray and available on KEGG, 16% were changed after SAMe treatment. Major pathways that were changed by DDC refeeding included cell adhesion molecules, toll-like receptors, apoptosis, vascular endothelial growth factor signaling pathways, mitogen-activated protein kinase signaling pathways, cytokine receptor interaction, wnt signaling pathway, Janus kinase–signal transducer and activator of transcription pathway, and regulation of actin cytoskeleton.
Fig. 2.

SAMe inhibited the changes in gene expression in the functional pathways up-regulated by DDC refeeding. The time period includes 4-month-withdrawal refed DDC and refed DDC and SAMe, 11-month-withdrawal refed DDC and refed DDC and SAMe, and 9-month-withdrawal refed DDC and SAMe. The functional pathway data illustrated were obtained by the use of the KEGG Web site (http://www.genome.jp/kegg/pathway.html) and by the blasting of the list of total changed genes combined from the pairs of DDC-withdrawn/refed mice. The Web site calculates the number of up-regulated and down-regulated genes for each pathway shown in the KEGG graph. To determine the percent gene change in each pathway, the number of changed genes present in each pathway was divided by the total number of genes in the same pathway. Most of the pathways up-regulated by DDC refeeding were down-regulated by SAMe treatment, as indicated by the increase in the percentage of genes down-regulated by SAMe. ABC indicates adenosine triphosphate– binding cassette; Jak-STAT, Janus kinase–signal transducer and activator of transcription; MAPK, mitogen-activated protein kinase; mTOR, mammalian target of rapamycin; PPAR, peroxisome proliferator-activated receptor; TNF-beta, transforming growth factor beta; and VEGF, vascular endothelial growth factor.
When the livers of all the mice in groups 1 and 2 (control mice and DDC-refed mice) were examined by hematoxylin-eosin (H&E) and immunohistochemistry, SAMe feeding with DDC was found to prevent MDB formation (Fig. 3A). MDBs were stained red with H&E (Fig. 3A, DDC, A), green with antibody to K8 (Fig. 3A, DDC, B), and yellow with the double stain for K8 and Ub (Fig. 3A, DDC, C). The cytoplasm of MDB-forming cells was stained red for Ub in livers of DDC-refed mice (Fig. 3A, DDC, C). Hepatocytes clustered with MDB-forming cells also stained red for Ub (Fig. 3A, DDC + SAMe, C) without forming MDBs in the livers of mice refed DDC with SAMe. Control mice livers did not form MDBs. There were residual MDBs in both the SAMe + DDC–treated mice livers and the untreated primed mice livers, but the number of residual MDBs was not different between the two groups (Fig. 3B). The number of MDBs per millimeter squared was increased by 7-fold (P ≤ 0.0018) in the livers of DDC-refed mice without SAMe (Fig. 3B).
Fig. 3.

(A) When the livers from the control and DDC-refed mice were stained with H&E and immunohistochemically, it was shown that SAMe fed with DDC prevented MDB formation. H&E stain (column A), K8 antibody (column B) and combined Ub/K8 antibody stain and DAPI nuclear stain (column C) are shown. The K8/Ub antibody stains are of the same cells: they stain green for K8 and yellow for colocalized Ub/CK8. MDBs (arrow) were stained yellow because they were both Ub-positive and K8-positive. The hepatocytes that stained red for Ub are potentially MDB-forming cells seen in DDC-withdrawn mice livers. The control and SAMe-treated livers stained with the K8 antibody showed prominent lysosomal granules in the cytoplasm. The deep red body is autofluorescent protoporphyrin. The liver histologic changes show that MDB formation in response to DDC and SAMe treatment prevented these changes (×840). (B) The number of MDBs was counted in the various treatment groups, showing that SAMe treatment prevented MDB formation. When the MDBs were counted in the livers of DDC-withdrawn mice, DDC-refed mice and DDC-refed mice fed SAMe were compared: DDC refeeding induced an increase in MB formation (Fig. 3B). When SAMe was added to the DDC diet in the combined data from 5 pairs of mice refed DDC, it prevented this induction (Fig. 3B). Ten random fields at 40× magnification were counted and blinded as to treatment (mean ± standard error; n for DDC-withdrawn = 3, n for DDC-withdrawn/refed + SAMe = 5, and n for DDC-withdrawn/refed = 5).
Because the 4-month-withdrawal drug-primed mice retained their ability to form MDBs in response to DDC refeeding, it is likely that their molecular cellular memory persisted for at least 4 months. In a previous study of griseofulvin-fed mice, MDBs were still present as small peripheral aggregates in the liver cells even after 4 months of withdrawal from the drug.17 In fact, it was also possible to identify the liver cells that had the potential to form MDBs (memory cells) because they had Ub-positive cytoplasm and cytomegaly features similar to those of the liver cells that contained MDBs (Fig. 3A, DDC, C). The Ub-positive liver cells were often found within the clusters of MDB-forming cells (Fig. 3A, DDC, C).
When liver sections were stained with an antibody to 5-methyl cytosine to assess methylation of DNA located within the hepatic cell nuclei, it was consistently observed that the staining of liver cells that had formed MDBs after DDC refeeding contained enlarged vesicular nuclei with minimal condensed chromatin. This chromatin stained more lightly (Fig. 4A) than neighboring and normal-appearing hepatocytes (Fig. 4B). This change was prevented by SAMe treatment in the DDC-refed mice (Fig. 4C). In the normal liver cell nuclei in the neighboring cells with cell cytoplasm that stained negative for Ub (Fig. 4A), the condensed nuclei stained strongly positive for 5-methyl cytosine. This was similar to control livers (Fig. 4B) and drug-primed livers (Fig. 4D). The reduced intensity of nuclear staining in MDB compared to normal neighboring cells is illustrated at lower magnifications (Fig. 4E,F).
Fig. 4.

Livers from the mice refed DDC with or without SAMe were double-stained with an antibody to S-methyl cytosine and Ub to assess the amount of DNA and histone methylation in the liver cell nuclei in normal and MDB-forming cells (arrows). (A) The cells that formed MDBs had enlarged vesicular nuclei with very little 5-methyl cytosine–positive staining (long arrow) compared to the normal hepatocyte and nonparenchymal nuclei, which were smaller and had condensed chromatin (short arrows). The nuclei that stained yellow were both 5-methyl cytosine–positive (green) and Ub-positive (red) and combined to give a fluorescent yellow color. (C) The nuclei in the livers of mice refed DDC with SAMe resembled (B) the normal controls and (D) the DDC-withdrawn controls (×840). (E) Liver sections from mice refed DDC had reduced methylation of nuclei in MDB-forming cells in comparison with the normal hepatocytes. Nuclei stained green for 5-methylcytosine. (A) Two large groups of hepatocytes that stained positive for Ub (red) and formed MDBs were separated by normal stained hepatocytes. (F) When the stain for 5-methyl cytosine was used, the nuclei of the normal hepatocytes stained bright green in comparison with the MB-forming cells, which only lightly stained green or were unstained. They were immunohistochemically double-stained for 5-methyl cytosine (green) and Ub (red; ×420).
When the expression of individual genes was compared by microarray analysis (DDC + SAMe–refed mice versus DDC-refed mice, n = 5), the expression of 840 identified genes was changed by SAMe refeeding. Noteworthy genes that were up-regulated by SAMe feeding were catenin alpha, cadherin 17, protein kinase C alpha, integrin beta 8, connective tissue growth factor, and heat shock proteins 70 a5 and 90 b1. Genes that were down-regulated by DDC-SAMe feeding were interleukin 9, glutathione peroxidase 2, gamma glutamyl transferase 1, UBD, glutathionine S-transferase mu 2 (GSTmu2), early growth response 2, KLF6, Afp, histone deacetylase 9 (Hdac9), sequestosome 1 (p62), glutathione synthetase, caspase 3, and mitogen-activated protein kinase kinase kinase 14 (Table 2). Of these changes in gene expression, p62 is the most interesting because p62 has been shown to be essential for MDB formation in vitro.18–20 Afp and GSTmu2 are important tumor markers of preneoplastic foci and tumors in mice.21,22 Heat shock proteins 70 and 90 are involved in MDB formation.3
Table 2.
Microarray Comparison of DDC-Refed + SAMe-Fed Mice with DDC-Refed Mice (n = 5; Fold Change)
| Gene Title | Gene Symbol | Average Ratio (Fold Change) |
|---|---|---|
| Catenin (cadherin associated protein), alpha 1 | Ctnna1 | 10.7 |
| Cadherin 17 | Cdh17 | 6.96 |
| Protein kinase C, alpha | Prkca | 3.61 |
| Connective tissue growth factor | Ctgf | 2.11 |
| Heat shock protein 90 kDa beta (Grp94), member 1 | Hsp90b1 | 1.8 |
| Heat shock 70kD protein 5 (glucose-regulated protein) | Hspa5 | 1.8 |
| Caspase 3 | Casp3 | −1.8 |
| Mitogen-activated protein kinase kinase kinase 14 | Map3k14 | −2.07 |
| Glutathione synthetase | Gss | −2.11 |
| Sequestosome 1 | Sqstm1 | −2.22 |
| Histone deacetylase 9 | Hdac9 | −2.55 |
| Alpha fetoprotein | Afp | −3.1 |
| Kruppel-like factor 6 | Klf6 | −3.14 |
| Early growth response 2 | Egr2 | −3.56 |
| Glutathione S-transferase, mu 2 | Gstm2 | −3.94 |
| Ubiquitin D | Ubd | −4 |
| Gamma-glutamyltransferase 1 | Ggt1 | −6.36 |
| Glutathione peroxidase 2 | Gpx2 | −7.21 |
SAMe feeding with DDC prevented the increase of expression of Afp, UBD, and KLF6 caused by DDC refeeding.
The expression of UBD (FAT10) was markedly increased (215-fold) by DDC feeding and after refeeding, and this increase was blocked by SAMe in the DDC + SAMe–fed mice. This was confirmed by quantitative RT-PCR (Fig. 5A). KLF6 expression was markedly increased after DDC feeding and after refeeding when MDBs formed. SAMe feeding inhibited this up-regulation by DDC (Fig. 5B) and also in the control fed SAMe.
Fig. 5.

(A) When the levels of UBD expression were accessed by RT-PCR and the differences between treatment groups were compared, there was an increase in all experimental groups compared to controls. However, the 3 SAMe-fed + DDC-refed mice, compared with DDC-withdrawal mice, were not different, indicating that SAMe prevented the increased expression caused by DDC refeeding (mean ± standard error of the mean; n = 3). The mice refed DDC + SAMe were withdrawn at 11 weeks or 4 months (n = 3). The mice refed DDC were withdrawn at 1 or 4 months (n = 3). (B) When the levels of KLF6 expression levels were assessed by RT-PCR and the differences between treatment groups were compared, there was an increase in all experimental groups compared with the controls. However, when the 3 SAMe-fed + DDC-refed mice were compared with DDC-withdrawn mice, there was no difference, and this indicated that SAMe prevented the increased expression caused by DDC refeeding (mean ± standard error; n = 3). The mice were withdrawn as in panel A.
When the expression of selected genes was up-regulated by DDC refeeding, as indicated by microarray analysis, it was shown that refeeding DDC–induced molecular memory was suppressed by SAMe feeding (Fig. 6). This was shown for UBD, KLF6, Afp, and GSTmu2 (Fig. 6), as also noted in Table 2. Afp and KLF6 were also reduced in the control fed SAMe (Table 1).
Fig. 6.

Microarray analysis of the expression of UBD, KLF6, Afp, and GSTmu2 showed that the DDC refeeding–induced cellular memory persisted after 9 and 11 weeks’ withdrawal and up to 4 months’ withdrawal. The response was blocked by SAMe feeding with DDC.
When gene expression of proteins that control methylation and acetylation of histones and methylation of DNA was determined by microarray analysis, a number of changes were observed (Table 3). Both DNA methyltransferase (cytosine-5) 1 and DNA methyltransferase 3A expressions were increased by DDC, but only the latter was inhibited by SAMe. Methionine adenosyltransferase II alpha was up-regulated by DDC, and this was not inhibited by SAMe. Two histone deacetylases were up-regulated by DDC, but only Hdac9 was inhibited by SAMe. CBP/p300, a histone acetyltransferase, was down-regulated by DDC, but SAMe did not prevent this change. Sirtuin 3, a histone deacetylase, was down-regulated by DDC, and this change was not affected by SAMe. Thus, SAMe feeding had selective effects on the expression of methylating and acetylating enzymes involved in gene regulation. The effect of SAMe feeding was primarily due to its methyl donor function (DNA methyltransferase 3A) and on Hdac9.
Table 3.
Effect of SAMe on Methylation and Acetylation Enzymes
| Average Ratio (Fold Change) |
|||
|---|---|---|---|
| Gene Title | Gene Symbol | DDC Versus Control | DDC 3 SAMe Versus DDC |
| DNA methylation | |||
| DNA methyltransferase (cytosine-5) 1 | Dnmt1 | 6.06 | No change |
| DNA methyltransferase 3A | Dnmt3a | 4.14 | −1.84 |
| Histone deacetylase | |||
| Histone deacetylase 9 | Hdac9 | 11.71 | −2.55 |
| Histone deacetylase 7A | Hdac7a | 2.22 | No change |
| Methionine adenosyltransferase | |||
| Methionine adenosyltransferase II, alpha | Mat2a | 2 | No change |
| CBP/p300 | |||
| p300/CBP-associated factor | Pcaf | −2.07 | No change |
| SIRT | |||
| Sirtuin 3 | Sirt3 | −1.93 | No change |
When mice were fed SAMe with DDC refeeding, Dnmt3a and Hdac9 were down-regulated in comparison with DDC-refed mice. Many of the genes involved in methylation of DNA and acetylation of histones were not down-regulated by SAMe feeding.
Parameters of oxidative stress were measured on the livers of DDC-withdrawn/refed mice. GSH levels were measured in the livers of mice refed DDC, with or without SAMe added to the diet. There was no difference between the two groups (DDC-refed and DDC-refed + SAMe) and the control livers (Fig. 7A), and this indicated that SAMe feeding did not prevent MDB formation by restoring GSH levels. To test the hypothesis that SAMe prevents MDB formation in DDC-fed mice by preventing oxidative stress, products of lipid peroxidation were also measured. When DDC was refed with SAMe, no change in 4-HNE or MDA was observed in comparison with the control mice, and this indicated that lipid peroxidation was not changed by either DDC or SAMe feeding (Fig. 7B). When carbonyl proteins were measured in liver homogenates as an indication of oxidative damage to proteins, no significant increase was found in mice fed DDC, withdrawn from DDC, and refed DDC again, and this supported the conclusion that oxidative stress was not a factor with DDC-induced MDB formation (Fig. 8). The standard error of the mean indicated some variability in the data that could mask small differences between the groups studied, except for the GSH and MDA data.
Fig. 7.
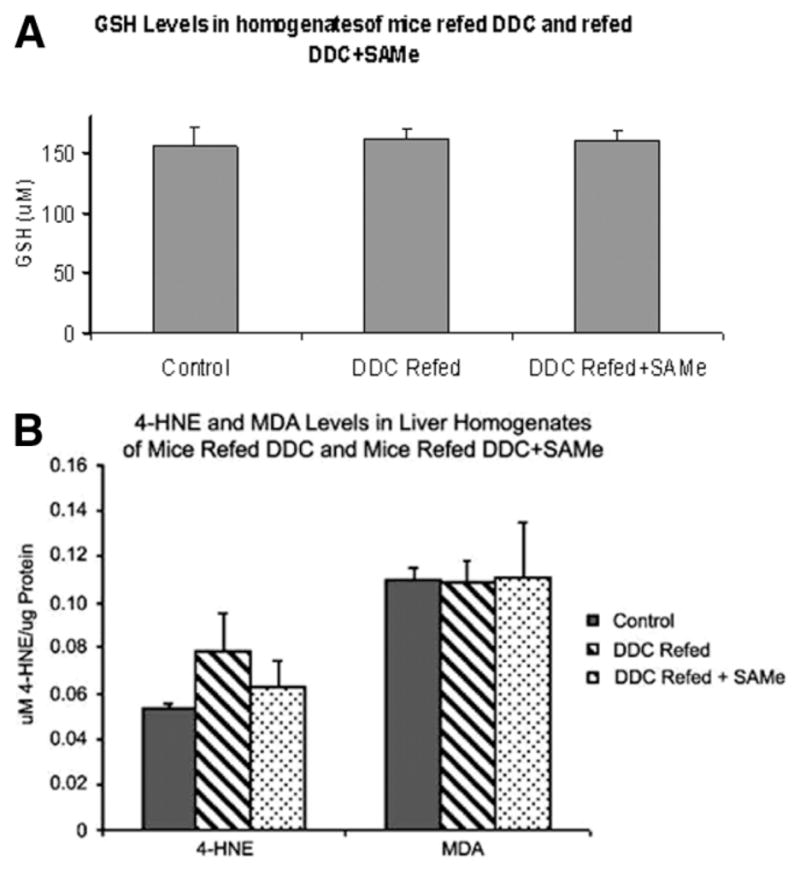
(A) Oxidative stress parameters were measured in the livers of DDC-withdrawn/refed mice. GSH was measured in the livers from mice refed DDC (n = 5), mice refed DDC with SAMe (n = 5), and controls (n = 2). This included 9-week, 11-week, and 4-month DDC-withdrawn/refed pairs of mice. There was no significant difference between groups (mean ± standard error of the mean). (B) 4-HNE and MDA levels in liver homogenates from mice refed DDC, with or without SAMe, were not significantly different from one another other or the controls. This included 9-week, 11-week, and 4-month DDC-withdrawn/refed pairs of mice (mean ± standard error of the mean; n = 5 for DDC with or without SAMe and n = 2 for controls).
Fig. 8.

There was no increase in protein carbonyl levels in the liver homogenates of mice refed DDC with or without SAMe when they were compared to one another and controls. This includes 9-week, 11-week, and 4-month refed pairs of mice (mean ± standard error of the mean; n = 5 for the control, n = 7 for DDC, n = 3 for DDC-withdrawal, n = 3 for DDC-refed, n = 4 for DDC-refed with SAMe, and n = 1 for SAMe-fed).
In Vitro Model
The effect of SAMe on DDC-primed mice liver cells in vitro was measured by a comparison of the induction of MDB formation in primary liver cell cultures from mice withdrawn from DDC for 1 month. The isolated cells from drug-primed livers underwent spontaneous cellular enlargement and multinucleation formation and formed numerous MDBs (Fig. 9C–F). The hepatocytes formed numerous keratin filaments, which stained green with the K8 antibody (Fig. 9D,F). The MDBs appeared yellow when viewed with the double stain for K8 and Ub, and this indicated that K8 and Ub were colocalized in the MDBs (Fig. 9C,E). However, when SAMe was added to the medium, the hepatocytes remained small, were poly-hydral in shape, and expressed minimal cytokeratin (Fig. 9A,B). They had single or double nuclei, and the nuclei were small with condensed chromatin in comparison with the nuclei seen in the hepatocytes in which no SAMe was added (Fig. 9C–F). MDBs were virtually absent in the cultures treated with SAMe (Fig. 9A,B). The MDB counts for the DDC-primed cell cultures and SAMe- treated cultures are given in Fig. 9G. Thus, it was concluded that SAMe prevented MDB formation in the in vitro model of spontaneous MDB formation, and this was accompanied by the development of cytomegaly and multinucleation of the MDB-forming hepatocytes.
Fig. 9.
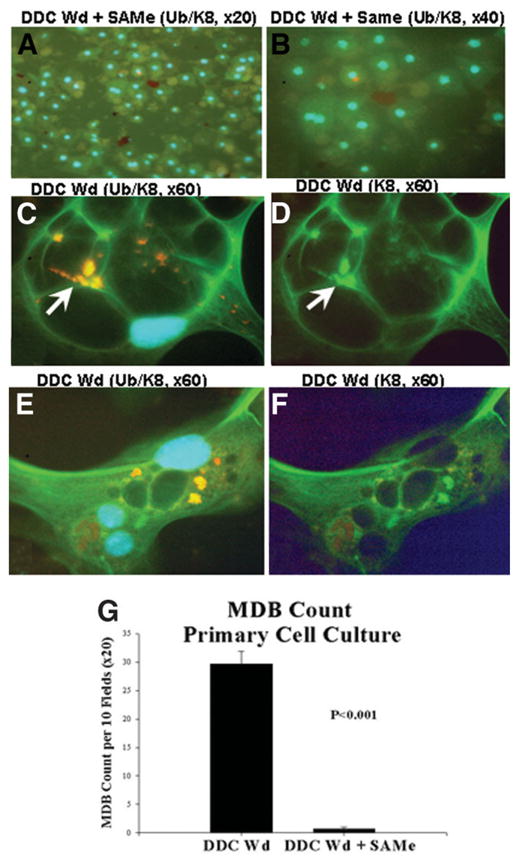
(A,B) MDB (arrows) formation by drug-primed hepatocytes was inhibited in vitro by the addition of SAMe to the medium (×420 and ×840, respectively) in comparison with (C–F) drug-primed hepatocytes without SAMe added (×1260). (D,F) The MDBs that formed had green fluorescence with the K8 antibody in comparison with (C,E) the same cells double-stained for Ub/K8, which showed that the MDBs fluoresced yellow because they stained positive with the antibodies to both Ub and K-8. The hepatocytes and their nuclei were much larger (C–F) in the MDB-forming cells in comparison with (A,B) the SAMe-treated cells. The antibodies used (double-stained) were anti-K8 (green) and anti-Ub (red). The nuclei stained blue with DAPI. (G) MDB counts were performed on tissue cultures of drug-withdrawn mice livers. All MDBs were counted that had irregular outlines per millimeter squared. Cultures of DDC-withdrawn/refed cells were compared with SAMe-treated cultures; 10 random fields (×20) were counted per well. MDBs were rarely found in the SAMe-treated cultures, whereas numerous MDBs were found in the control cultures (mean ± standard error of the mean; n = 9, P < 0.01).
Discussion
SAMe feeding prevented MDB formation by DDC-primed mouse livers in vivo and in vitro. The mechanism of prevention by SAMe most likely was due to an epigenetic phenomenon in which SAMe induced methylation of DNA and histones. The gene expression of a large number of genes was changed by DDC refeeding, and these changes were largely prevented by the feeding of SAMe with DDC. SAMe fed to a control mouse also caused changes in gene expression in comparison with two control mice, but the number of changed gene expressions was low. The expression of genes affected by SAMe feeding to the control mouse was different from that of the DDC-refed mice fed SAMe, except for KLF6 and Afp. SAMe also inhibited the expression of KLF6 and Afp induced by DDC refeeding.
Most remarkable was the observation that the hypothetical epigenetic memory of the DDC-primed liver was maintained for 4 months after DDC withdrawal. This phenomenon was manifest both in the formation of MDBs after DDC refeeding and by changes noted in microarray analysis. SAMe reversed this response to DDC refeeding at each withdrawal time interval. Of particular interest were the increase in the expression of UBD and KLF6 after DDC refeeding and the down-regulation of this response when SAMe was fed with DDC. The increase in UBD (FAT10) in response to DDC feeding and refeeding has been previously reported.7 FAT10 is over-expressed in 90% of hepatocellular carcinomas23 and is a tumor marker for that reason. FAT10 interacts with mitotic arrest deficient 2 (MAD2), a spindle checkpoint protein. When FAT10 is overexpressed, MAD2 is greatly reduced at the kinetochore during the prometaphase stage of the cell cycle, causing a high degree of variability in the chromosome number in in vitro studies.24 It has been concluded that high levels of FAT10 protein lead to increased mitotic nondisjunction and chromosome instability due to an abbreviated mitotic phase.24 This leads to multiple nucleation and aneuploidy, a key process in tumorigenesis.
KLF6 expression, like UBD, was increased after DDC refeeding, and SAMe reversed this effect. KLF6 is a zinc finger tumor suppressor gene that is frequently mutated in several types of human cancers and is involved in cellular differentiation and development, growth-related signal transduction, cell proliferation, apoptosis, and angiogenesis.25 It may play a role in the development of hepatocellular carcinogenesis (HCC) because it is up-regulated in the nonneoplastic livers that bear HCCs.25 In cell cultures derived from HCC (Hep G2), KLF6 is expressed, and RNA interference inhibition of KLF6 impairs cyclin D1 expression. KLF6 protects HCC-derived cells from apoptosis.26
It is possible that the SAMe effect on gene expression could be a result of its antioxidant effect, by which GSH synthesis is increased. GSH levels are increased in vitro in response to SAMe.27 SAMe also inhibits lipid peroxidation by Fe2+ chelation and inhibition of Fe2+ autoxidation in vitro.27 SAMe protects the liver at both the organ and cellular level by preventing activation of NFκB and by preventing the damage caused by lipid peroxidation.29 When GSH levels fall, oxidative stress can lead to DNA oxidative damage leading to decreased DNA methylation.30 Likewise, inhibition of histone deacetylase results in global and gene-specific DNA demethylation.31 Oxidative stress does not seem to be involved in the model of MDB formation studied here because 4-HNE, MDA, carbonyl formation, and GSH were not changed by DDC refeeding with or without SAMe feeding. However, anti-oxidants have not been tried to prevent MDB formation.
Because the overexpression of FAT10 and Afp is characteristic of human hepatocellular carcinomas and these cancer markers are up-regulated in livers where MDBs are formed, it is possible that MDBs are part of a constellation of changes that lead to tumor formation21,22 and that SAMe treatment may abort the progression to tumor formation. SAMe feeding prevented liver neoplasia in a chemical model of carcinogenesis by reconstituting the level of DNA methylation toward normal32 by allowing tumor suppression genes to be expressed. It may be that SAMe feeding will prevent liver neoplasia, which occurs late in the course of the drug-induced model of MDB formation21 studied here.
The present studies focused on the use of SAMe to increase methylation of DNA and histones to down-regulate gene expression associated with MDB formation. This could prevent keratin aggresome formation in response to toxic injury caused by alcohol and other liver diseases.11 Studies are ongoing to identify specific genes that might be involved in the changes in gene expression associated with MB formation. In this regard, enzymes involved in methylation of histones and DNA as well as acetylation of histones are being studied. Also, studies involving gene transfer and gene expression inhibition are underway with the tissue culture model of MDB formation and primed and normal control hepatocytes.
The question arises of what the significance is of MDBs induced by DDC feeding and refeeding. Are they related to the MDBs associated with human hepatitis, cirrhosis, alcoholic steatohepatitis, or nonalcoholic steatohepatitis, or are they more related to HCC MDBs because many of the up-regulated genes such as UBD, KLF6, Afp, and GSTmu2 are associated with HCC? It has been postulated that MDBs associated with liver disease represent a preneoplastic change in man and in the experimental mouse.21,22,34
Acknowledgments
Supported by a National Institutes of Health/National Institute on Alcohol Abuse and Alcoholism grant (8118) and by an Alcohol Center Grant on Liver and Pancreas and Morphologic Core (P50-011999).
Abbreviations
- 4-HNE
4-hydroxynonenal
- ABC
adenosine triphosphate– binding cassette
- Afp
alpha fetoprotein
- CBP
CREB binding protein
- cRNA
complementary RNA
- Ct
threshold polymerase chain reaction cycle number
- DAPI
4′,6-diamidino-2-phenylindole
- DDC
diethyl-1,4-dihydro-2,4,6-trimethyl-3,5-pyridine decarboxylate
- FITC
fluorescein isothiocyanate
- GSH
glutathione
- GSTmu2
glutathionine S-transferase mu 2
- H&E
hematoxylin-eosin
- HCC
hepatocellular carcinogenesis
- Hdac9
histone deacetylase 9
- Jak-STAT
Janus kinase–signal transducer and activator of transcription
- K8
keratin 8
- KEGG
Kyoto Encyclopedia of Genes and Genomes
- KLF6
Kruppel-like factor-6
- MAD2
mitotic arrest deficient 2
- MAPK
mitogen-activated protein kinase
- MB
Mallory body
- MDA
malondialdehyde
- MDB
Mallory Denk body
- mRNA
messenger RNA
- mTOR
mammalian target of rapamycin
- NFκB
nuclear factor kappa B
- PCR
polymerase chain reaction
- PPAR
peroxisome proliferator-activated receptor
- R1
N-methyl-2-phenylindole
- RT-PCR
reverse-transcription polymerase chain reaction
- SAMe
S-adenosylmethionine
- TNB
2-nitro-5-mercaptobenzoic acid
- TNF-beta
transforming growth factor beta
- Ub
ubiquitin
- UBD
ubiquitin D
- VEGF
vascular endothelial growth factor
Footnotes
Potential conflict of interest: Nothing to report.
References
- 1.Zatloukal K, French SW, Stumptner C, Strnad P, Harada M, Toivola DM, et al. From Mallory to Mallory-Denk bodies: what, how and why? Exp Cell Res. 2007;313:2033–2049. doi: 10.1016/j.yexcr.2007.04.024. [DOI] [PubMed] [Google Scholar]
- 2.French BA, van Leeuwen F, Riley NE, Yuan QX, Bardag-Gorce F, Lue YH. Aggresome formation in liver cells in response to different toxic mechanisms. Role of the ubiquitin-proteasome pathway and the frameshift mutant of ubiquitin. Exp Mol Pathol. 2001;71:241–246. doi: 10.1006/exmp.2001.2401. [DOI] [PubMed] [Google Scholar]
- 3.Riley NE, Li J, McPhaul L, Lue Y, French SW. Heat shock proteins and Mallory bodies (cytokeratin aggresomes) in human liver biopsies. Exp Mol Pathol. 2003;74:168–174. doi: 10.1016/s0014-4800(02)00020-5. [DOI] [PubMed] [Google Scholar]
- 4.Zhang-Gouillon ZQ, Yuan QX, Hu B, Gaal K, Marceau N, French SW. Alcohol induces Mallory body formation in drug-primed mice. Hepatology. 1998;27:116–122. doi: 10.1002/hep.510270119. [DOI] [PubMed] [Google Scholar]
- 5.Yuan Q, Nagao Y, Wan Y, Hu B, Gaal K, French BA, et al. Mechanisms of Mallory body formation induced by okadaic acid in drug primed mice. Exp Mol Pathol. 1998;65:87–103. doi: 10.1006/exmp.1998.2231. [DOI] [PubMed] [Google Scholar]
- 6.Purohit V, Abdelmalek MF, Barve S, Benevenga NJ, Halsted CH, Kaplowitz, et al. Role of S-adenosylinethione, folate, and betamine in the treatment of alcoholic liver disease: summary of a symposium. Am J Clin Nutr. 2007;86:14–24. doi: 10.1093/ajcn/86.1.14. [DOI] [PubMed] [Google Scholar]
- 7.Nan L, Dedes J, French BA, Bardag-Gorce F, Li J, Wu Y. Mallory body (cytokeratin aggresomes) formation is prevented in vitro by p38 inhibitor. Exp Mol Pathol. 2006;80:228–240. doi: 10.1016/j.yexmp.2006.01.003. [DOI] [PubMed] [Google Scholar]
- 8.Nan L, Wu Y, Bardag-Gorce F, Li J, French BA, Wilson LT. The p105/50 NF-κB pathway is essential for Mallory body formation. Exp Mol Pathol. 2005;78:198–206. doi: 10.1016/j.yexmp.2004.12.002. [DOI] [PubMed] [Google Scholar]
- 9.Wu Y, Nan L, Bardag-Gorce F, Li J, French BA, Wilson LT. The role of the laminin-integrated signaling in triggering MB formation. An in vivo and in vitro study. Exp Mol Pathol. 2005;79:1–8. doi: 10.1016/j.yexmp.2005.03.005. [DOI] [PubMed] [Google Scholar]
- 10.Yuan QX, Marceau N, French BA, Fu P, French SW. Mallory body induction in drug-primed mouse liver. Hepatology. 1996;24:603–612. doi: 10.1002/hep.510240324. [DOI] [PubMed] [Google Scholar]
- 11.Bardag-Gorce F, Dedes J, French BA, Oliva J, Li J, French SW. Mallory body formation is associated with epigenetic phenotypic change in hepatocytes in vivo. Exp Mol Pathol. 2007;3:160–168. doi: 10.1016/j.yexmp.2007.03.003. [DOI] [PMC free article] [PubMed] [Google Scholar]
- 12.Reilly NE, Bardag-Gorce F, Montgomery RO, Li J, Lungo W, Lue YH, et al. Microtubules are required for cytokeratin aggresomes (Mallory body) formation in hepatocytes: an in vitro study. Exp Mol Pathol. 2003;74:173–179. doi: 10.1016/s0014-4800(03)00005-4. [DOI] [PubMed] [Google Scholar]
- 13.Simon MD, Chu F, Racki LR, dela Cruz CC, Burlingame AL, Panning B, et al. The site-specific installation of methyl lysine analogs into recombinant histones. Cell. 2007;128:1003–1012. doi: 10.1016/j.cell.2006.12.041. [DOI] [PMC free article] [PubMed] [Google Scholar]
- 14.Santos-Rosa H, Schneider R, Bannister AJ, Sherriff J, Bernstein BE, Emre NC, et al. Active genes are tri-methylated at k4 of histone H3. Nature. 2002;419:407–411. doi: 10.1038/nature01080. [DOI] [PubMed] [Google Scholar]
- 15.Bradford MM. A rapid and sensitive method for the quantification of microgram quantities of protein utilizing the principle of protein-dye binding. Anal Biochem. 1976;72:248–254. doi: 10.1016/0003-2697(76)90527-3. [DOI] [PubMed] [Google Scholar]
- 16.Levine RL, Williams JA, Stadtman ER, Shacter E. Carbonyl assays for determination of oxidatively modified proteins. Methods Enzymol. 1994;233:346–357. doi: 10.1016/s0076-6879(94)33040-9. [DOI] [PubMed] [Google Scholar]
- 17.Denk H. Rearrangement of the hepatocyte cytoskeleton after toxic damage: involution, dispersal and peripheral accumulation of Mallory body material after drug withdrawal. Eur J Cell Biol. 1981;23:241–249. [PubMed] [Google Scholar]
- 18.Nan L, Wu Y, Bardag-Gorce F, Li J, French BA, Fu AN, et al. p62 is involved in the mechanism of Mallory body formation. Exp Mol Pathol. 2004;77:168–175. doi: 10.1016/j.yexmp.2004.06.003. [DOI] [PubMed] [Google Scholar]
- 19.Stumptner C, Fuchobickler A, Heid H, Zatloukal K, Denk H. Mallory body—a disease-associated type of sequestrome. Hepatology. 2002;35:1053–1062. doi: 10.1053/jhep.2002.32674. [DOI] [PubMed] [Google Scholar]
- 20.Zatloukal K, Stumptrer C, Fricksbickler A, Heid H, Schnoelzer M, Kenner L, et al. p62 is a common component of cytoplasmic inclusions in protein aggregation diseases. Am J Pathol. 2002;160:255–263. doi: 10.1016/S0002-9440(10)64369-6. [DOI] [PMC free article] [PubMed] [Google Scholar]
- 21.Nan L, Bardag-Gorce F, Wu Y, Li J, French BA, French SW. Mallory body forming cells express the preneoplastic hepatocyte phenotype. Exp Mol Pathol. 2006;80:109–118. doi: 10.1016/j.yexmp.2005.11.001. [DOI] [PubMed] [Google Scholar]
- 22.Roomi MW, Gaal K, Yuan QX, French BA, Fu P, Bardag-Gorce F, et al. Preneoplastic liver cell foci expansion induced by thiacetamide toxicity in drug-primed liver. Exp Mol Pathol. 2006;81:8–14. doi: 10.1016/j.yexmp.2006.02.006. [DOI] [PubMed] [Google Scholar]
- 23.Lee CG, Ren J, Cheong IS, Ban KH, Ooi LL, Yong Tan S, et al. Expression of the FAT10 gene is highly up regulated in hepatocellular carcinoma and other gastrointestinal and gynecological cancers. Oncogene. 2003;22:2592–2603. doi: 10.1038/sj.onc.1206337. [DOI] [PubMed] [Google Scholar]
- 24.Ren J, Kan A, Leong SH, Ooi LLPJ, Jeang K-T, Chong SS, et al. Fat 10 plays a role in the regulation of chromosomal stability. J Biol Chem. 2006;281:11413–11421. doi: 10.1074/jbc.M507218200. [DOI] [PubMed] [Google Scholar]
- 25.Song J, Kim CJ, Cho YG, Kim SY, Nam SW, Lee SH, et al. Genetic and epigenetic alterations of the KLF6 gene in hepatocellular carcinoma. Gastroenterol Hepatol. 2006;21:1286–1289. doi: 10.1111/j.1440-1746.2006.04445.x. [DOI] [PubMed] [Google Scholar]
- 26.Sirach E, Bureau C, Peron JM, Pradyrol L, Vinel JP, Buscall L, et al. KLF6 transcription factor protects hepatocellular carcinoma derived cells from apoptosis. Cell Death Differ. 2007;4:1202–1210. doi: 10.1038/sj.cdd.4402114. [DOI] [PubMed] [Google Scholar]
- 27.Wu D, Cederbaum AI. Opposite action of S-adenosyl methionine and its metabolites on CYP2E1-mediated toxicity in pyrazole-induced rat hepatocytes and HepG2 E47 cells. Am J Physiol Gastrointest Liver Physiol. 2006;290:G674–G684. doi: 10.1152/ajpgi.00406.2005. [DOI] [PubMed] [Google Scholar]
- 28.Caro AA, Cederbaum AI. Antioxidant properties of S-adenosyl-L-methionine in Fe(2+)-initiated oxidations. Free Radic Biol Med. 2004;36:1303–1316. doi: 10.1016/j.freeradbiomed.2004.02.015. [DOI] [PubMed] [Google Scholar]
- 29.Lu SC, Gukovsky I, Lugea A, Reyes CN, Huang Z-Z, Chen L, et al. The role of S-adenosylmethionine in two experimental models of pancreatitis. FASEB J. 2003;17:56–58. doi: 10.1096/fj.01-0752fje. [DOI] [PubMed] [Google Scholar]
- 30.Sasaki Y. Does oxidative stress participate in the development of hepatocellular carcinoma? J Gastroenterol. 2006;41:1135–1148. doi: 10.1007/s00535-006-1982-z. [DOI] [PubMed] [Google Scholar]
- 31.Ou J-N, Torrisani J, Onterberger A, Provencal N, Shikini K, Karimi M, et al. Histone deacetylase inhibitor trichostatin A induces global and gene-specific DNA demethylation in human cancer cell lines. Biochem Pharmacol. 2007;73:1297–1307. doi: 10.1016/j.bcp.2006.12.032. [DOI] [PubMed] [Google Scholar]
- 32.Pascale RM, Simile MM, DeMiglio MR, Feo F. Chemoprevention of hepatocarcinogenesis: S-adenosylmethionine. Alcohol. 2002;27:193–198. doi: 10.1016/s0741-8329(02)00227-6. [DOI] [PubMed] [Google Scholar]
- 33.Nakanuma Y, Ohta G. Is Mallory body formation a preneoplastic change? A study of 181 cases of liver hepatocellular carcinoma and 82 cases of cirrhosis. Cancer. 1985;55:2400–2404. doi: 10.1002/1097-0142(19850515)55:10<2400::aid-cncr2820551017>3.0.co;2-b. [DOI] [PubMed] [Google Scholar]
- 34.Tazawa J, Irie T, French SW. Mallory body formation runs parallel to gamma glutamyl transferase induction in hepatocytes of griseofulvin fed mice. Hepatology. 1983;3:989–1001. doi: 10.1002/hep.1840030617. [DOI] [PubMed] [Google Scholar]