

Abstract
Gas chromatography coupled to mass spectrometry (GC-MS) is one of the most widespread routine technologies applied to the large scale screening and discovery of novel metabolic biomarkers. However, currently the majority of mass spectral tags (MSTs) remains unidentified due to the lack of authenticated pure reference substances required for compound identification by GC-MS. Here, we accessed the information on reference compounds stored in the Golm Metabolome Database (GMD) to apply supervised machine learning approaches to the classification and identification of unidentified MSTs without relying on library searches. Non-annotated MSTs with mass spectral and retention index (RI) information together with data of already identified metabolites and reference substances have been archived in the GMD. Structural feature extraction was applied to sub-divide the metabolite space contained in the GMD and to define the prediction target classes. Decision tree (DT)-based prediction of the most frequent substructures based on mass spectral features and RI information is demonstrated to result in highly sensitive and specific detections of sub-structures contained in the compounds. The underlying set of DTs can be inspected by the user and are made available for batch processing via SOAP (Simple Object Access Protocol)-based web services. The GMD mass spectral library with the integrated DTs is freely accessible for non-commercial use at http://gmd.mpimp-golm.mpg.de/. All matching and structure search functionalities are available as SOAP-based web services. A XML + HTTP interface, which follows Representational State Transfer (REST) principles, facilitates read-only access to data base entities.
Keywords: Metabolic markers, Gas chromatography (GC), Mass spectrometry (MS), GC-MS, Mass spectral classification, Mass spectral matching, Metabolite fingerprinting, Metabolite profiling, Metabolomics, Metabonomics, Decision trees
Introduction
The identification of the high number of as of yet unidentified metabolic components from GC-MS profiling experiments poses a major challenge in metabolite profiling. Two factors contribute to the high complexity of typical GC-(TOF)-MS experiments. Firstly, as GC-MS inherently requires volatile analytes, metabolites of interest need to be chemically modified, for example by methoxyamination and silylation reagents (Kopka 2006, Lisec et al. 2006). Thus, more than one single analyte per metabolite may be generated and thorough chemical interpretations of observed analytes with respect to their mass spectral and retention index (RI) properties are required. Secondly, a compound library comparison as the most straightforward approach for identifying components from GC-MS analyses relies on the availability of authenticated pure reference substances. Currently, metabolite identification is only possible by a time consuming, manually supervised matching of both the RI information and the reference mass spectra stored in dedicated libraries such as the Golm Metabolome Database (GMD) (Kopka et al. 2005, Schauer et al. 2005), Therefore, the lack of chemically synthesized reference substances and of purified bio-molecules may be seen as the current bottleneck of comprehensive compound identification as identification is only possible if the detected compound is present in the library of references compounds.
In order to provisionally accommodate unidentified compounds, the GMD archives respective Mass Spectral Tags (MSTs). MSTs are defined to represent the combination of chemo-physical properties, namely the mass fragmentation pattern linked to the chromatographic RI information (Wagner et al. 2003). In addition, the GMD also comprises a large compendium of identified compound entries. These entries represent known metabolite structures and are linked to the source (vendor etc.) information of the respective reference substances. Thus, the GMD may represent an ideal resource for the application of supervised machine learning algorithms for compound classification as a means for an automated annotation of MSTs. The GMD compendium may thus be used to enhance the chemical identification process of novel metabolic components discovered by GC-(TOF)-MS based metabolomic screening studies.
Currently, most novel GC-MS based analytical signals remain unidentified as there is no reference substance available. Of the total of up to 1,000 MSTs observed in typical studies, only 50–150 metabolites can be identified. The determination of the chemical sum formula associated with molecule peak and electron-impact induced fragment peaks may be feasible. The unambiguous mass spectral interpretation, however, is in many cases only possible for small molecules bearing a single functional group (Varmuza and Werther 1996). For this reason, hit list based mass spectra similarity matching has evolved as a highly successful tool for the routine assessment of mass spectra (Halket et al. 2005), and large commercial mass spectral libraries, such as NIST08 (http://chemdata.nist.gov/mass-spc/Srch_v1.7/index.html) have been developed. The employed matching approaches use various similarity scores, which were developed in conjunction with specifics of the gas chromatographic and mass spectrometric technology (Crawford and Morrison 1968, Stein 1999, Stein and Scott 1994). However, a reliable automation of mass spectral matching has not been accomplished so far. Tools utilising RI information for the matching process adapted for the processing of large metabolite profiling experiments, such as TagFinder (Luedemann et al. 2008), recommend manually supervised compound identification.
Beyond similarity-based matching of mass fragmentation patterns, algorithmic approaches that relate mass spectral features to structural properties have been pursued. For example, several low resolution mass spectral classifiers have been reported to yield promising results. Werther et al. (1994) successfully applied diverse computational classification techniques to the recognition of simple structural moieties. These authors tested the prediction of 10 structural characteristics and found neural networks to be superior compared to k-nearest neighbour (KNN) classification, linear discriminant analysis, or principal component models. Furthermore, Varmuza and Werther (1996) presented an enhanced approach based on random sampling of training mass spectra according to predefined spectral features and the subsequent application of multivariate classification methods or neural networks. Approximately 160 spectral classifiers were developed that cover a significant portion of organic chemistry, but they may only be partially applicable to bio-molecules, such as the primary and secondary metabolites. These spectral classifiers are now part of the NIST software. Since version 2.0, the software package Mass Frontier™ supports the classification of mass spectra (http://www.highchem.com/new-features/), utilizing three classification methods: Principal Component Analysis (PCA), Fuzzy Clustering, and Self-Organizing Maps (SOM) (http://www.highchem.com/mass-spectra-classification/) (Steiner et al. 2002). Further enhanced approaches attempt to include isomer prediction from given sum formulas (Varmuza 2001).
Progress has also been made for the prediction of the presence or absence of substructures based on mass spectral features. Mass spectral classifiers were implemented using linear discriminant analysis, LDA, and partial least squares discriminant analysis, PLS-DA (Yoshida et al. 2001), or by selection of characteristic mass fragment combinations (Tang et al. 2003). In view of these successful approaches, we developed a decision tree (DT) based classifier and a web-based interface dedicated to the specific metabolomic needs of GC-MS-based profiling. In contrast to prior general organic chemistry-based efforts, we focus on metabolites and substructures of metabolic origin. Furthermore, we combine the chromatographic RI information (Strehmel et al. 2008) with mass spectral features for classification and substructure prediction. Most importantly, we chose the DT algorithm to solve the classification problem. This algorithm is employed for the recognition of patterns in mass fragmentation spectra that distinguish classes of compounds which either contain or lack a specific predefined chemical moiety. The DTs are made available via the augmented web-interface of the GMD as well as web-services to assist in the annotation of metabolomics data sets.
Methods
Integration of metabolite structures into the GMD
The GMD uses a Microsoft SQL Server 2008™ as the relational database backend for relating the mass spectrum and retention behaviour to an analyte, i.e. the chemically modified compound, which is mapped to represent a metabolite (Fig. 1) (Hummel et al. 2008). Both analyte and metabolite have the properties of a chemical compound and are linked to structures archived as .mol-files and InChI™ codes (http://www.iupac.org/inchi/). A typical metabolite has one to two analytes, which are generated by the chemical derivatization process inherent to the GC-MS profiling technique. Each analyte has multiple technological versions of MSTs. These replicate mass spectra and RIs are empirically determined using different mass spectral technologies, e.g. time of flight, quadrupole or ion trap based mass detectors, and variations of gas chromatographic systems (Strehmel et al. 2008).
Fig. 1.
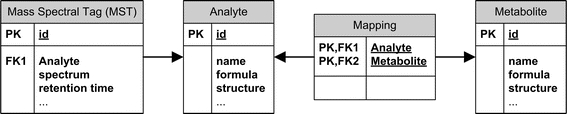
Excerpt of the GMD scheme. MSTs (mass spectral tags, i.e. repeatedly observed mass spectra with retention behaviour) are linked to analytes via experiments and a supervised annotation process. Likewise, analytes are mapped to metabolites. Structural information has been added to both types of compounds, the metabolites and their respective analytes
In the current GMD release, 6,187 mass spectra are available representing 2,444 analytes and 1,535 metabolites. It should be noted that the GMD compendium is biased towards GC-MS accessible, stable, primary metabolites. Therefore, the structural moieties of the metabolite classes, amino acids, organic acids, fatty acids, fatty alcohols, sugars, sugar alcohols and respective conjugates dominate. Structural annotations are in most cases stereo-chemically correct, even though routine GC-MS profiling (Lisec et al. 2006, Wagner et al. 2003) allows only the differentiation of anomeric, epimeric structures and E/Z-geometric isomers.
Decision tree supported substructure prediction
A supervised machine learning approach using a pattern recognition algorithm was chosen to infer correlations between the sub-structure properties of known compounds and the properties of respective MSTs. For every considered functional group, we classify MSTs to belong to either the functional group containing or non-containing groups. Thus, we perform a binary classification. The DT method was applied, because multiple parameter types, categorical and numerical, can be integrated and no assumptions about numerical parameter distributions and about the nature of discriminating functions, e.g. linear, non-linear, multimodal, are required. Secondly, in contrast to the NIST Mass Spectrum Interpreter software for substructure analysis, rules comprised of single feature decisions are returned, which describe the criteria of the mass spectral classification process and are suitable for interpretation by a GC-MS expert.
The checkmol program (Feldman et al. 2005) was executed to automatically extract the 21 most abundant structural features, e.g. substructures or chemical moieties, from the metabolite structures of the GMD (>3% occurrence). Subsequently, we created DTs using mass spectral and retention properties as predictors of the structural features.
The mass spectra used to train the DT algorithm were electron impact spectra of methoxyaminated and trimethylsilylated reference compounds with known structures, natural isotopomer composition, and documented reference compound sources.
It should be noted that—in the current release—we use the MSTs of chemically derivatized metabolites for the analysis of structural features present in non-derivatized metabolite structures. As the DT algorithm supports this approach, we reasoned that the biologist and GMD user’s interest lies more on the metabolite structure rather than the methoxyaminated and trimethylsilylated compounds inherently required for GC-MS based metabolite profiling.
MST subsetting and RI assignment
DT training was performed separately for each considered structural feature. For this procedure, the mass spectral compendium of the GMD was divided into those mass spectra associated with metabolites containing the respective structural feature and those in which the structural feature was absent. DT training was performed with and without using the RI information linked to each MST. In order to use the RI information, a subset of training data with empirically determined RIs was created. The supported RI models are based on standardization by 9 n-alkanes (C10–C36) and either a 5%-phenyl-95%-dimethylpolysiloxane capillary column, in short VAR5, or a 35%-phenyl-65%-dimethylpolysiloxane column (MDN35, Lisec et al. 2006). RI information of 8 variant VAR5 chromatography methods was converted according to Strehmel et al. (2008).
Mass spectral features
A mass spectrum can be considered a point in an n-dimensional mass space with n representing the number of individual masses/charge fragment ratios as coordinate axes with associated values corresponding to fragment abundances. In order to characterise mass spectra in terms of those properties, which are potentially relevant for the structural distinction of chemical substance classes, additional spectral features have been proposed, e.g. weighted abundance of single masses, intensities of single masses normalised to the local ion current, averaged intensities of mass intervals, logarithmic transformations, modulo-14 summation, autocorrelation properties, so-called spectrum type features, and characteristic peak series features (Varmuza 2001, Xu et al. 2003).
As DT methods allow the combined use of diverse properties, we extracted three types of spectral features in addition to the above mentioned RI information. (1) Logarithmic intensities of nominal masses, as proposed previously (cf. above), were used in the mass range m/z 70–600. However, only 525 spectral features (“intensity-lg”) were allowed after exclusion of ubiquitous mass fragments typically generated from compounds carrying a trimethylsilyl-moiety, namely the fragments at m/z 73, 74, 75, 147, 148, and 149. (2) For an improved feature construction with better discriminative potential (Kotsiantis et al. 2006), we implemented the full set of logarithmic pair-wise intensity ratios, thus, adding 137,550 spectral features to the DT training input space (“ratio lg”). (3) In addition to these features, we used a mass distance measure to represent the mass losses of typical electron impact induced fragmentation reactions. Mass distances caused by the naturally occurring 13C-isotopic patterns were excluded. This spectral processing provided 524 additional spectral features (“peak distance”) per MST. In detail, only those mass fragments associated with a local intensity maximum were considered for peak distance calculation, whereas flanking mass fragments with descending intensities at (m/z) − 1(2, 3, …) or (m/z) + 1(2, 3, …) were removed before calculating the peak distance matrix.
In summary, MSTs were pre-processed to obtain those spectral features best representing the probability that a specific fragment is generated from a given compound (intensity-lg, ratio lg) and the mass differences between fragments indicative of the typical cleavage reactions of chemical moieties. Both types of information were used to train DTs with or without the use of RI information.
Decision tree generation
Using the Microsoft SQL 2008 Server Analysis Services™, DTs were trained for selected single structural features. Because an SQL Server table is limited to 1,024 columns, the predictor variables had to be pre-selected. We used the Fisher ratio, F r, for ranking the variables, with
 |
1 |
with m 1 and m 2 equal to the means, and v 1 and v 2 representing the variances of classes 1 and 2 (functional group present/absent), respectively (Duda and Hart 1973; Varmuza and Werther 1996).
In total, 138,599 Fisher scores were computed for each functional group for the evaluation of the respective discriminative power of all available mass spectral features. The 1,000 highest scoring spectral features were chosen for each prediction task. When multiple feature types were used for DT training, features of each type were selected in equal proportions.
The final training set submitted to the DT algorithm comprised 1,004 columns with 1,000 columns of the pre-selected best scoring mass spectral features. Two columns containing the optional RI-related information from the VAR5- and MDN35-RI systems were added, while one column contained the present or absent call of the structural feature under investigation. The forth column comprised the primary key reference to the respective mass spectrum entry within the GMD. Three DT training procedures were performed, generating a DT without RI information, and two DTs with RI information of either the VAR5 or the MDN35 chromatographic systems. For DTs with RI information, only those MSTs with available RI information were considered.
The DT models including selected features, transformations and other pre-processing details were saved to the server for subsequent application to user submitted MSTs of unknown structure. In the current build, the DT algorithm of the Microsoft SQL Server Analysis Services™ was parameterized according to default recommendations (cf. Table 1). The minimum node support was set to 10 spectra (tree expansion break off criterion).
Table 1.
Microsoft SQL Server Analysis Services™ DT Algorithm default recommendations (cf. http://msdn.microsoft.com/en-us/library/cc645868.aspx)
| Property | Value | Description |
|---|---|---|
| Hold out Max Percent | 0 | All available data are used as training data |
| Hold out Max Cases | 0 | All available data are used as training data |
| Split Method | Both (binary and complete) | Determines the method that is used to split the node |
| Score Method | Bayesian dirichlet equivalent to uniform prior | Specifies the method to calculate the split score |
| Minimum Support | 10 | Break off criterion of tree extension. All nodes of the resulting tree have at least 10 spectra |
| Maximum Input Attributes | 255 | Defines the number of input attributes that the algorithm can handle before it invokes feature selection |
| Maximum Output Attributes | 255 | Defines the number of output attributes that the algorithm can handle before it invokes feature selection |
| Complexity Penalty | Not specified | This parameter defines the likelihood of a split as a function of the number of attributes. The default is 0.5 (1–9 attributes) decreasing the likelihood, 0.9 (10–99 attributes) and 0.99 (>100 attributes) causing an increased likelihood |
Performance measures
The prediction performance was assessed by the precision (p) and recall (r) measures, with
 |
2 |
and
 |
3 |
TP, FP, TN, and FN define true positive, false positive, true negative and false negative predictions, respectively.
For a combined characterization of precision and recall, the F pr-value with
 |
4 |
was computed as a frequently used performance measure in the field of information retrieval (van Rijsbergen 1979). F pr-values of 1 indicate optimal, while values approaching zero correspond to minimal prediction performance.
Matthews correlation coefficient (MCC) is commonly used for the assessment of binary classifications and was shown to be robust with regard to imbalanced class distributions (Matthews 1975). MCC can be computed from the contingency table according to Eq. 5:
 |
5 |
MCC values range from −1 (perfect inverse prediction) to +1 (perfect prediction). A coefficient of 0 represents an average random prediction. The error rate obtained in cross validation (CV), Er CV, is computed as
 |
6 |
and should approach zero with increasing DT quality.
Results and discussion
We developed DT-based substructure prediction as a potentially powerful tool box for the structural characterisation of the numerous non-identified MSTs that are encountered in routine GC-MS based metabolite profiles. To enable evidence based substructure prediction we utilized the rich resource of mass spectra and RI information of authenticated reference compounds from the GMD. Application of supervised machine learning approaches required updating of the GMD with structure information of the contained metabolites. This added information now allows binary partitioning of the known metabolites into training data that either contain or do not contain the assessed substructure. The application of supervised machine learning algorithms, such as the DT classification, now supports the in silico characterisation of yet non-identified MSTs that are frequently recognised as relevant marker molecules by non-targeted metabolite profiling. In order to define and compare the performance of the chosen DT-classification approaches for the potential users of the GMD web site and the offered web services (cf. Sect. 3.2) we report in the following the implemented CV procedures of the provided DTs, the respective feature usage and finally assess typical application cases.
Evaluation of the decision tree performance
For the characterization and comparison of DT performance, we implemented measures based on the subtotal TP, FN, FP, and TN prediction of the CV contingency table. These measures allow the assessment of alternative DTs for identical substructures, e.g. DTs with or without use of RI information. Also the quality of DTs was made comparable between different substructure predictions as two general classification errors exist, (1) deficiencies resulting from imperfect MST training data, and (2) deficiencies due to imbalanced training data. Both potential errors lead to over-fitted DTs and may compromise substructure predictions.
Cross validation of decision trees
For the reasons stated above a 50-fold CV by iterative exclusion of randomly chosen MSTs was routinely implemented. As an alternative we explored a heuristic validation process by excluding all technological replicate MSTs of single analytes (data not shown). As GMD will provide a steadily increasing number of replicate mass spectra and RIs of each analyte that is expected to improve DT-based substructure prediction we decided to use random choice of MSTs for CV. Our implemented procedure characterises DT performance and enables the calculation of overall error estimates for each substructure tree. CV results are displayed along with the respective DT information and visualization (Fig. 2). In order to demonstrate the implementation of the chosen CV process, exemplary results of a ten-fold CV are shown for the DT-classification which assesses the presence or absence of an amine moiety (Table 2).
Fig. 2.
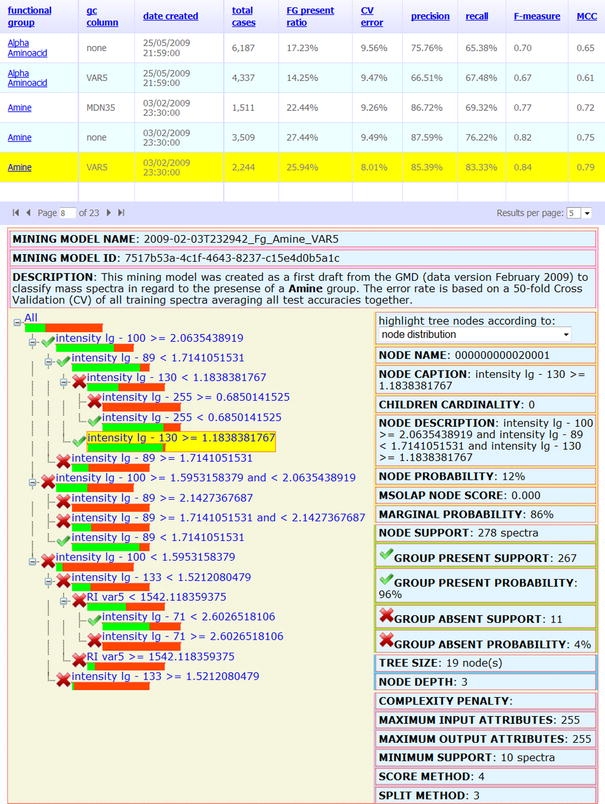
Two synchronized web controls facilitate the access to all currently available DTs and sub-structure predictions provided by the GMD interface. The upper table describes the investigated functional group, with optional use of the RI system, and records the date of DT generation, as well as the number and proportion of MSTs linked to present calls of the substructure. DTs are characterised by a 50-fold CV error, with corresponding precision, recall, F-measure and MCC values (cf. Sect. 2.2.4). The table can be sorted by activating the selected column header. The full list of all available DTs is accessible through a paging function at the left bottom of the display. An exemplary DT trained to classify mass spectra with regard to the presence or absence of the amine substructure using the VAR5 RI information and 582 mass spectra representing metabolites with an amine moiety contrasted by 1,662 MSTs of metabolites lacking this moiety. The DT is depicted on the left hand side. Standard SQL Server Analysis Services Decision Tree properties of the activated tree node (indicated by underlay) are displayed to the right. Light (green) bars indicate the proportion of MSTs linked to a compound with amine moiety; dark (red) indicate the proportion of MSTs linked to compounds lacking this moiety. Note that we use the terms Decision Tree and Mining Model to indicate the data structures according to the SQL Server Analysis Services terminology
Table 2.
Contingency table of a 10-fold CV, evaluating both performance and robustness of the DT model for the prediction of a amine sub-group generated using the February 3, 2009 version of GMD and the RI information of the VAR5 chromatographic system, in short the DT model named ‘2009-02-03T232942_Fg_Amine_VAR5’
| Observed | Partition index | Predicted | Total | |||||
|---|---|---|---|---|---|---|---|---|
| Present | Absent | |||||||
| Present | 1 | True positives (TP) | 47 | (21%) | False negatives (FN) | 11 | (5%) | |
| 2 | 44 | (20%) | 14 | (6%) | ||||
| 3 | 50 | (22%) | 9 | (4%) | ||||
| 4 | 38 | (17%) | 21 | (9%) | ||||
| 5 | 39 | (17%) | 19 | (8%) | ||||
| 6 | 45 | (20%) | 13 | (6%) | ||||
| 7 | 40 | (18%) | 18 | (8%) | ||||
| 8 | 43 | (19%) | 15 | (7%) | ||||
| 9 | 52 | (23%) | 6 | (3%) | ||||
| 10 | 43 | (19%) | 15 | (7%) | ||||
| Subtotal | 441 | 141 | 582 | |||||
| AVG | 44.10 | (20%) | 14.10 | (6%) | ||||
| STDEV | 4.58 | (2%) | 4.61 | (2%) | ||||
| Absent | 1 | False positives (FP) | 8 | (4%) | True negatives (TN) | 158 | (71%) | |
| 2 | 10 | (4%) | 157 | (70%) | ||||
| 3 | 7 | (3%) | 160 | (71%) | ||||
| 4 | 1 | (0%) | 165 | (73%) | ||||
| 5 | 2 | (1%) | 164 | (73%) | ||||
| 6 | 4 | (2%) | 162 | (72%) | ||||
| 7 | 5 | (2%) | 161 | (72%) | ||||
| 8 | 1 | (0%) | 165 | (74%) | ||||
| 9 | 10 | (4%) | 156 | (70%) | ||||
| 10 | 7 | (3%) | 159 | (71%) | ||||
| Subtotal | 55 | 1,607 | 1,662 | |||||
| AVG | 5.50 | (2%) | 160.70 | (72%) | ||||
| STDEV | 3.44 | (2%) | 3.27 | (1%) | ||||
| Total | 496 | 1,748 | 2,244 | |||||
Rows 3–12 and 16–25 represent the 10 iterative partitions. Absolute numbers (column D, G) and relative proportions (%; column E, H) of TP, FN, FP and TN classifications are reported. Results of each partition add up to 100%. Subtotals, averages (AVG) and standard deviations (STDEV) are calculated over all sequential partitions. Note that high proportions of TP and TN and low STDEV (<2%) indicate high DT prediction performance
Using a Precision-Recall-Plot (Fig. 3), we evaluated precision and recall in relation to an F pr-measure threshold = 0.65 using the most recent set of DTs which includes the RI information based on standardization by 9 n-alkanes (C10–C36) and a 5%-phenyl-95%-dimethylpolysiloxane capillary column, in short VAR5 (Strehmel et al. 2008).
Fig. 3.
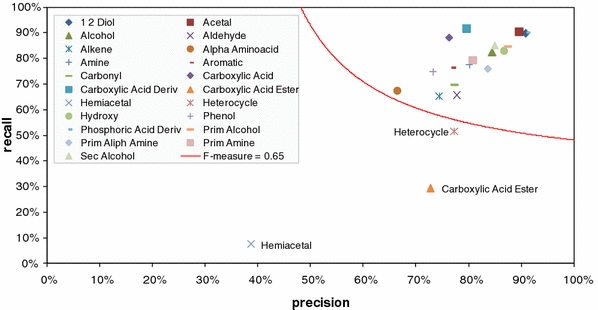
Precision-Recall-plot for a set of DTs including the Var5 RI information of the May 2009 version of the GMD. We introduced an F pr-measure threshold of 0.65 indicated by a line as a minimal performance criterion. DTs not passing this threshold, namely the DTs for the prediction of the carboxylic acid ester, hemiacetal and heterocycle substructures were disabled for public use. The nomenclature of the chemical substructures is according to the definitions made by the checkmol program (Feldman et al. 2005)
Precision and recall measures were high for almost all tested substructures. Only the three DTs targeting the prediction of heterocycle, hemiacetal, and carboxylic acid ester substructures resulted in slightly inferior DT-classifications. These substructures are, hence, excluded from for public use and will be targeted by future efforts to enhance the DT applied algorithm and by extending the GMD compendium by suitable training data. Since the hard to classify substructures were also those with the smallest number of available training data, we expect that extended data resources within GMD will immediately result in improved performance of substructure prediction.
Analysis of MST feature usage
Table 3 summarizes the MST feature usage within the current set of DTs compiled from the May 2009 GMD version including the Var5 RI information as input variables. All DTs were generated independently, i.e. both data processing and feature pre-selection was performed separately for each substructure prior to DT training. As expected, the features incorporated in the DT vary considerably between the different predicted substructures. The usage of characteristic mass spectral fragments (m/z) agrees with the chemical nature and hierarchy of the investigated biochemical moieties. The repeated use of characteristic mass fragments for similar substructures is apparent. For example, the fragment m/z = 99 is consistently used for all amine-like substructures, m/z = 103 in the case of alcohol-like substructures and m/z = 160 for carbonyl-like substructures. These mass fragments may be termed canonical masses which result from fragmentation reactions that are typical of compounds belonging to certain chemical classes. For example, the mass fragment m/z = 160 represents methoxyaminated aldehyde moieties, which are characteristic for reducing aldose-sugars. The fragment m/z = 103 is an abundant and typical cleavage product of trimethylsilylated primary alcohols, such as non-cyclic sugar and polyol molecules. While m/z = 103 represents the cation [.CH2O(TMS)+] and m/z = 160 the cation [C=NOCH3–CH2O(TMS)+], the source and usage of m/z = 99 for the prediction of amines is not yet fully understood.
Table 3.
Summary of MST feature usage over a set of DTs predicting several chemically similar substructures
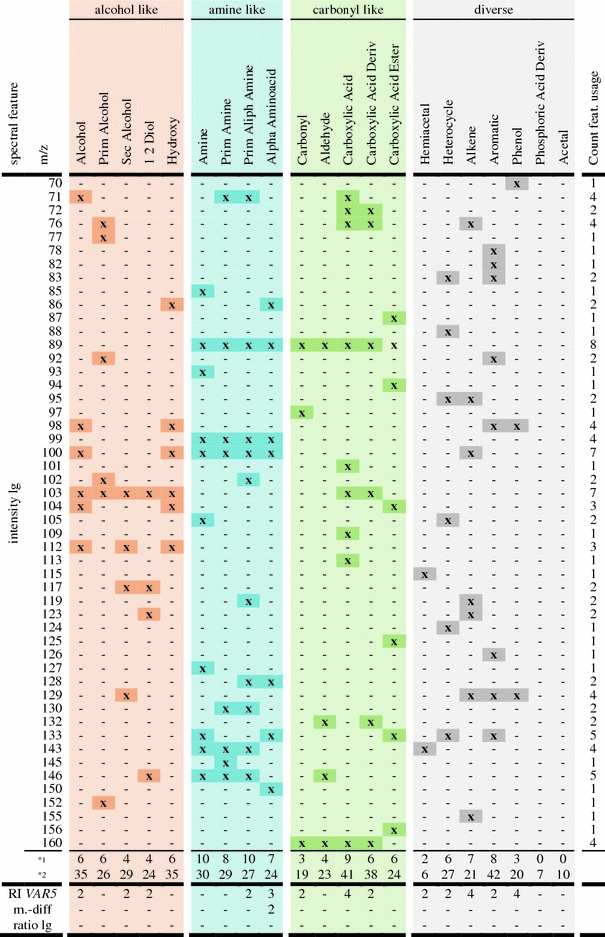
“x” marks the use of a feature in a DT. The intensity lg features are limited in this example to m/z < 161. The full mass range is used however with a preference of small m/z. Row*1 lists the number of distinct intensity lg features in each DT. Row*2 shows the number of DT nodes using intensity lg allowing for repetitive occurrence of a feature in single DTs. The columns are sorted according to similarity of substructure classes. The final column lists the frequency of the “intensity lg” feature usage across all considered DTs and may indicate potential canonical mass fragments. DTs for the sub-groups Phosphoric Acid Deriv. and Acetal use only intensity lg features greater than m/z = 160. Thus, corresponding values in row *1 are “0”
Considering the available choice of the numerous preselected 1,001 variables (a maximum of 1,000 spectral features plus one optional RI information), the DT classification uses only a comparatively small and specific number (<14) of selected features per DT (cf. summary row*1) in Table 3). This small number and the frequent choice of specific features represent an additional safe-guard against the risk of DT over-fitting. The chemical analysis and interpretation of feature usage and the analysis of the surprising absence of “ratio-lg” criteria from the current DTs is in progress but was deemed beyond the scope of this study.
Application cases
In order to characterize the potential, but also the caveats of substructure predictions using the DT algorithm provided by GMD, we performed typical application cases. New or non-identified metabolites will—in most cases—be discovered as automatically deconvoluted mass spectra from profiles of complex biological samples. Automated mass spectral deconvolution represents the typical solution to the task of analysing GC-MS profiles of highly complex biological matrices; here we use the term matrix to refer to the sum of all monitored metabolites from a biological sample. Under such conditions the available deconvolution algorithms may remove specific mass fragments either because of low compound abundance, resulting in a low signal-to-noise ratio (S/N), or due to chromatographic peak shape artefacts. Alternatively, mass fragments belonging to chromatographically co-eluting compound(s) may be incorrectly added.
Because of the ease of automated deconvolution, the experimental scientist might be tempted to base an initial structural elucidation attempt on such potentially compromised MSTs. To demonstrate the risk of such an approach, we selected four compounds derived from two complex plant matrices, namely potato tuber and rice leaf. The compounds glucose (1MeOX 5TMS), citric acid (4TMS), valine (2TMS) and putrescine (4TMS) were chosen to represent carbohydrates, organic acids, amino acids, and amines as typical metabolite classes. These metabolites contain most of the frequently occurring metabolite substructures, which have been targeted by our DT classification approach. Figure 4 shows the metabolite structures before chemical derivatization by methoxiamination (carbonyl modifying) and trimethylsilylation (substituting protons bound to heteroatoms).
Fig. 4.
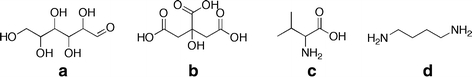
Exemplary metabolites and typical substructures retrieved by the checkmol program (Feldman et al. 2005). a glucose: primary alcohol, secondary alcohol, 1,2 diol, aldehyde, hydroxyl, carbonyl, alcohol; b citric acid: carboxylic acid, hydroxyl, alcohol; c valine: alpha-amino acid, amine, carboxylic acid, hydroxyl, carbonyl, alcohol; d putrescine: primary aliphatic amine, amine
Our application cases convincingly demonstrate that many expected substructures are recognized with high reproducibility (Table 4). Nevertheless, clear differences with regard to the biological source or concerning single automated deconvolutions from identical sources exist. For example, the primary alcohol substructure is only recognized in part of the deconvolutions representing glucose and fructose, whereas the more generalized substructures containing OH-moieties are diagnosed with high repeatability. In addition, the alpha-amino acid and the more general amine-substructure were recognized with varying reproducibility, in some cases only in a small part of the automated deconvolutions.
Table 4.
Reproducibility of substructure predictions using automatically deconvoluted MSTs from routine metabolite profiles of complex biological matrices (selected examples)
| Metabolite | Substructure | Potato tuber | Rice leaf | ||||||||||||||||||
|---|---|---|---|---|---|---|---|---|---|---|---|---|---|---|---|---|---|---|---|---|---|
| Deconvolution | Deconvolution | ||||||||||||||||||||
| 1 | 2 | 3 | 4 | 5 | 6 | 7 | 8 | 9 | 10 | 1 | 2 | 3 | 4 | 5 | 6 | 7 | 8 | 9 | 10 | ||
| Glucose | Hydroxy | 100 | 100 | 100 | 100 | 100 | 100 | 100 | 100 | 100 | 99 | 100 | 100 | 100 | 100 | 100 | 100 | 100 | 100 | 100 | 100 |
| Alcohol | 99 | 99 | 99 | 99 | 99 | 99 | 99 | 99 | 99 | – | 99 | 99 | 99 | 99 | 99 | 99 | 99 | 99 | 99 | 99 | |
| Prim. alcohol | – | 99 | 99 | 99 | 99 | 99 | – | – | – | – | – | – | – | – | – | – | – | – | – | – | |
| Sec. alcohol | 99 | 99 | 99 | 99 | 99 | 99 | 99 | 99 | 99 | 99 | 99 | 99 | 99 | 99 | 99 | 99 | 99 | 99 | 99 | 99 | |
| 1,2 Diol | 99 | 99 | 99 | 99 | 99 | 99 | 99 | 99 | – | 99 | 99 | 99 | 99 | 99 | 79 | 79 | 79 | 99 | 79 | 79 | |
| Carbonyl | – | 91 | 91 | 91 | 91 | 91 | 91 | 91 | 91 | 91 | 91 | 91 | 91 | 91 | – | – | – | – | – | – | |
| Citric acid | Hydroxy | 100 | 100 | 100 | 100 | 100 | 100 | 100 | 100 | 100 | 100 | 100 | 100 | 100 | 100 | 100 | 100 | 100 | 100 | 100 | 100 |
| Alcohol | 99 | 99 | 99 | 99 | 99 | 99 | 99 | 99 | 99 | 99 | 99 | 99 | 99 | 99 | 99 | 99 | 99 | 99 | 99 | 99 | |
| Sec. alcohol | 99 | 99 | 99 | 99 | 99 | 99 | 99 | 99 | 99 | 99 | 99 | 99 | 99 | 99 | 99 | 99 | 99 | 99 | 99 | 99 | |
| Carbonyl | 91 | 91 | 91 | 91 | 91 | 91 | 91 | 91 | 91 | 91 | 91 | 91 | 91 | 91 | 91 | 91 | 91 | 91 | 91 | 91 | |
| Carboxylic acid | – | – | – | – | – | – | – | – | – | – | – | – | – | – | – | – | – | – | – | – | |
| Valine | Alpha aminoacid | 97 | 97 | 97 | – | – | – | – | 97 | – | – | 97 | – | – | – | – | – | – | – | – | – |
| Amine | – | – | – | – | – | – | – | 91 | – | – | – | – | – | – | – | – | – | – | – | – | |
| Hydroxy | – | – | – | – | – | – | – | 83 | – | 83 | 83 | 83 | 83 | 83 | 100 | 100 | 100 | 100 | 100 | 100 | |
| Carbonyl | – | – | – | – | – | – | – | – | 91 | – | – | – | – | – | 91 | 91 | 91 | 91 | 91 | 91 | |
| Carboxylic acid | 88 | 88 | 88 | 88 | 88 | 88 | 88 | 88 | 88 | 88 | 88 | 88 | 88 | 88 | 90 | 90 | 90 | 90 | 90 | 90 | |
| Carboxylic acid deriv. | 98 | 98 | 98 | 98 | 98 | 98 | 98 | 98 | 98 | 98 | 98 | 98 | 98 | 98 | 90 | 90 | 90 | 90 | 90 | 90 | |
| Putrescine | Prim. aliph. amine | 86 | 86 | 86 | 94 | 86 | 86 | 86 | 86 | 86 | 86 | 86 | 86 | 86 | 86 | 86 | 86 | 86 | 86 | 86 | 86 |
| Prim. amine | – | – | 94 | 94 | – | – | – | – | – | – | – | – | – | – | – | – | – | – | – | – | |
| Amine | – | – | 97 | 91 | – | – | – | – | – | – | – | – | – | – | – | – | – | – | – | – | |
Automated deconvolutions of each metabolite were generated from 10 independently processed GC-TOF-MS profiles of potato tubers and rice leafs. The listed values represent confidence (probability) of identification within the used DT nodes (“–” indicates non-recognized expected substructures)
In conclusion, automated mass spectral deconvolutions should only be considered with care and for a preliminary substructure assessment. We recommend the use of manually curated mass spectra and a statistical evaluation of multiple high quality mass spectra best obtained from multiple biological sources or from at least two different chromatographic systems. Specialized laboratories may avoid many GC co-elution artefacts by application of a two dimensional (GCxGC)-TOF–MS system.
Availability, GMD web site and web services
All DTs developed as part of this study have been made freely available to academic users for spectra-based compound annotation at http://gmd.mpimp-golm.mpg.de/. For automated batch processing, the developed platform-independent Simple Object Access Protocol (SOAP) based web service endpoint wsPrediction provides public access to the functionality presented here.
Concluding remarks
The mass spectrum and RI compendium of the GMD has been used as a training data set for a supervised machine learning approach using a DT algorithm for the classification of MSTs and the retrieval of human-interpretable classification rules. The new GMD frontend provides a rich set of substructure classification models comprising mass spectral patterns and optional extensions including RI information, which group MSTs with common substructures. The offered DTs are provided as an extension to the conventional hit list based mass spectral matching approach and can be used to support the interpretation of MSTs from known metabolites and also facilitate the classification of those MSTs, which are not yet identified. The classification tools of the GMD frontend can be updated with the continuously growing set of GMD entries. The success of updating efforts can be assessed using DT cross validation (CV) parameters, such as precision, recall, F pr-measure, MCC, and the CV error, which have been implemented in the course of this project to compare DT performance and to reject weak prediction models. Hence, this new web interface and application may contribute to the evidence-based classification of non-identified MSTs and follows the general recommendations of the metabolomics standards initiative for reporting standards for chemical analysis (Sumner et al. 2007).
The DTs presented in this work depend on the continued curation and enhancement of the GMD content. Specifically, residual deconvolution errors will be removed, the spectral quality improved and the number of high quality replicate spectra for existing MSTs extended. Most importantly, new metabolites will be added to the GMD compendium. As a consequence, these efforts will necessitate an updating scheme for the DT substructure predictions and evaluation of DT performance will become a frequent use case.
Furthermore, the extension towards DT analyses of those substructures, which are underrepresented in the current GMD dataset, appears to be an attractive goal. Finally, given the availability of multiple DTs for the prediction of one particular substructure, the application of DT forests may be worthwhile.
Acknowledgements
The authors acknowledge the long standing support and encouragement by Prof. L. Willmitzer, Prof. M. Stitt and Prof. R. Bock, Max Planck Institute of Molecular Plant Physiology (MPI-MP), Am Muehlenberg 1, D-14476 Potsdam-Golm, Germany. The authors thank Dr. D. Steinhauser, Dr. A. R. Fernie, A. Erban, I. Fehrle, J. Hannemann and M. Kuczmierczyk for the generation of metabolite structures and the interactive discussions during project realization.
Funding
This work was supported by the Max Planck Society, the QuantPro program of the Bundesministerium für Bildung und Forschung (BMBF), sub-project “InnOx—Innovative diagnostic tools to optimise potato breeding: Systematic analysis of cellular processes and their relation to plant internal oxygen concentrations”, FKZ 0313813A, and the European META-PHOR project, FOOD-CT-2006-036220.
Open Access
This article is distributed under the terms of the Creative Commons Attribution Noncommercial License which permits any noncommercial use, distribution, and reproduction in any medium, provided the original author(s) and source are credited.
References
- Crawford LR, Morrison JD. Computer methods in analytical mass spectrometry. Identification of an unknown compound in a catalog. Analytical Chemistry. 1968;40:1464–1469. doi: 10.1021/ac60266a027. [DOI] [Google Scholar]
- Duda RO, Hart PE. Pattern classification and scene analysis. New York: Wiley; 1973. [Google Scholar]
- Feldman HJ, Dumontier M, Ling S, Haider N, Hogue CWV. CO: A chemical ontology for identification of functional groups and semantic comparison of small molecules. FEBS Letters. 2005;579:4685–4691. doi: 10.1016/j.febslet.2005.07.039. [DOI] [PubMed] [Google Scholar]
- Halket JM, Waterman D, Przyborowska AM, Patel RKP, Fraser PD, Bramley PM. Chemical derivatization and mass spectral libraries in metabolic profiling by GC/MS and LC/MS/MS. Journal of Experimental Botany. 2005;56:219–243. doi: 10.1093/jxb/eri069. [DOI] [PubMed] [Google Scholar]
- Hummel J, Selbig J, Walther D, Kopka J. The Golm Metabolome Database: A database for GC-MS based metabolite profiling. In: Nielsen J, Jewett M, editors. Metabolomics a powerful tool in systems biology. Topics in Current Genetics Vol. 18. Berlin, Heidelberg, New York: Springer; 2008. pp. 75–96. [Google Scholar]
- Kopka J. Current challenges and developments in GC-MS based metabolite profiling technology. Journal of Biotechnology. 2006;124:312–322. doi: 10.1016/j.jbiotec.2005.12.012. [DOI] [PubMed] [Google Scholar]
- Kopka J, Schauer N, Krueger S, Birkemeyer C, Usadel B, Bergmuller E, Dormann P, Weckwerth W, Gibon Y, Stitt M, Willmitzer L, Fernie AR, Steinhauser D. GMD@CSB.DB: The Golm Metabolome Database. Bioinformatics. 2005;21:1635–1638. doi: 10.1093/bioinformatics/bti236. [DOI] [PubMed] [Google Scholar]
- Kotsiantis S, Kanellopoulos D, Pintelas P. Data preprocessing for supervised learning. International Journal of Computer Science. 2006;1:111–117. [Google Scholar]
- Lisec J, Schauer N, Kopka J, Willmitzer L, Fernie AR. Gas chromatography mass spectrometry-based metabolite profiling in plants. Nature Protocols. 2006;1:387–396. doi: 10.1038/nprot.2006.59. [DOI] [PubMed] [Google Scholar]
- Luedemann A, Strassburg K, Erban A, Kopka J. TagFinder for the quantitative analysis of gas chromatography-mass spectrometry (GC-MS)-based metabolite profiling experiments. Bioinformatics. 2008;24:732–737. doi: 10.1093/bioinformatics/btn023. [DOI] [PubMed] [Google Scholar]
- Matthews BW. Comparison of the predicted and observed secondary structure of T4 phage lysozyme. Biochimica Biophysica Acta. 1975;405:442–451. doi: 10.1016/0005-2795(75)90109-9. [DOI] [PubMed] [Google Scholar]
- Schauer N, Steinhauser D, Strelkov S, Schomburg D, Allison G, Moritz T, Lundgren K, Roessner-Tunali U, Forbes MG, Willmitzer L, Fernie AR, Kopka J. GC-MS libraries for the rapid identification of metabolites in complex biological samples. FEBS Letters. 2005;579:1332–1337. doi: 10.1016/j.febslet.2005.01.029. [DOI] [PubMed] [Google Scholar]
- Stein SE. An integrated method for spectrum extraction and compound identification from gas chromatography/mass spectrometry data. Journal of the American Society for Mass Spectrometry. 1999;10:770–781. doi: 10.1016/S1044-0305(99)00047-1. [DOI] [Google Scholar]
- Stein SE, Scott DR. Optimization and testing of mass spectral library search algorithms for compound identification. Journal of the American Society for Mass Spectrometry. 1994;5:859–866. doi: 10.1016/1044-0305(94)87009-8. [DOI] [PubMed] [Google Scholar]
- Steiner FM, Schlick-Steiner BC, Nikiforov A, Kalb R, Mistrik R. Cuticular hydrocarbons of Tetramorium ants from central Europe: Analysis of GC-MS data with self-organizing maps (SOM) and implications for systematics. Journal of Chemical Ecology. 2002;28:2569–2584. doi: 10.1023/A:1021496305308. [DOI] [PubMed] [Google Scholar]
- Strehmel N, Hummel J, Erban A, Strassburg K, Kopka J. Retention index thresholds for compound matching in GC-MS metabolite profiling. Journal of Chromatography B. 2008;871:182–190. doi: 10.1016/j.jchromb.2008.04.042. [DOI] [PubMed] [Google Scholar]
- Sumner L, Amberg A, Barrett D, Beale M, Beger R, Daykin C, Fan T, Fiehn O, Goodacre R, Griffin J, Hankemeier T, Hardy N, Harnly J, Higashi R, Kopka J, Lane A, Lindon J, Marriott P, Nicholls A, Reily M, Thaden J, Viant M. Proposed minimum reporting standards for chemical analysis. Metabolomics. 2007;3:211–221. doi: 10.1007/s11306-007-0082-2. [DOI] [PMC free article] [PubMed] [Google Scholar]
- Tang Y, Liang Y, Fang KT. Data mining in chemometrics: Sub-structures learning via peak combinations searching in mass spectra. Journal of Data Science. 2003;1:481–496. [Google Scholar]
- van Rijsbergen CJ. Information retrieval. Newton, MA: Butterworth-Heinemann; 1979. [Google Scholar]
- Varmuza, K. (2001). From MS data via chemometrics to chemical structure information. Informatics and mass spectrometry. In 13th Sanibel conference on mass spectrometry. American Society for Mass Spectrometry, Sanibel Island, FL, USA, pp. 1–11.
- Varmuza K, Werther W. Mass spectral classifiers for supporting systematic structure elucidation. Journal of Chemical Information and Computer Sciences. 1996;36:323–333. [Google Scholar]
- Wagner C, Sefkow M, Kopka J. Construction and application of a mass spectral and retention time index database generated from plant GC/EI-TOF-MS metabolite profiles. Phytochemistry. 2003;62:887–900. doi: 10.1016/S0031-9422(02)00703-3. [DOI] [PubMed] [Google Scholar]
- Werther W, Lohninger H, Stancl F, Varmuza K. Classification of mass spectra: A comparison of yes/no classification methods for the recognition of simple structural properties. Chemometrics and Intelligent Laboratory Systems. 1994;22:63–76. doi: 10.1016/0169-7439(94)85018-6. [DOI] [Google Scholar]
- Xu CJ, He P, Liang YZ. Building an honest tree for mass spectra classification based on prior logarithm normal distribution. Journal of Data Science. 2003;1:497–509. [Google Scholar]
- Yoshida H, Leardi R, Funatsu K, Varmuza K. Feature selection by genetic algorithms for mass spectral classifiers. Analytica Chimica Acta. 2001;446:483–492. doi: 10.1016/S0003-2670(01)00910-2. [DOI] [Google Scholar]