

Abstract
Background
Degenerative features such as neuronal, glial, synaptic and axonal loss have been identified in neocortical and other grey matter structures in patients with multiple sclerosis, but mechanisms for neurodegeneration are unclear. Cortical demyelinating lesions are a potential cause of this degeneration but the pathological and clinical significance of these lesions is uncertain, as they remain difficult to identify and study in vivo. In this study we aimed to describe and quantify cellular and subcellular pathology in the cortex of MOG-induced marmoset experimental autoimmune encephalomyelitis using quantitative immunohistochemical methods.
Results
We found evidence of diffuse axonal damage occurring throughout cortical grey matter with evidence for synaptic loss and gliosis and a 13.6% decrease in neuronal size and occurring in deep cortical layers. Evidence of additional axonal damage and a 29.6–36.5% loss of oligodendrocytes was found in demyelinated cortical lesions. Leucocortical lesions also showed neuronal loss of 22.2% and a 15.8% increase in oligodendrocyte size.
Conclusions
The marmoset EAE model therefore shows both focal and generalised neurodegeneration. The generalised changes cannot be directly related to focal lesions, suggesting that they either are a consequence of diffusible inflammatory factors or secondary to remote lesions acting through trans-synaptic or retrograde degeneration.
Keywords: multiple sclerosis, cortex, inflammation, neurodegeneration, experimental autoimmune encephalomyelitis, marmoset, Callithrix jacchus, immunohistochemistry, demyelination, myelin oligodendrocyte glycoprotein
Introduction
Cortical demyelination has long been recognised in MS [1], but until recently the extent has been underestimated due to difficulties identifying cortical lesions using conventional neuropathological and radiological techniques. Immunohistochemical studies have shown widespread demyelination in MS cortex, occupying a mean of 9–26.5% and a median of 3–14% of the total cortical area [2–4]. Focal demyelinating cortical lesions are distinct from white matter lesions in terms of their morphology and inflammatory cell content. Leucocortical involve the white matter and also the deeper layers of the cortex, intracortical lesions are small, round or ovoid in shape and centred on a blood vessel. Larger subpial lesions are found that run parallel to the pial surface and can stretch across a whole gyrus or across multiple gyri [5]. All cortical lesion subtypes contain a lower density of inflammatory cells compared to white matter lesions whilst subpial lesions have been shown to contain a similar lymphocyte density compared to control cortex [6].
Cortical lesions are difficult to detect in vivo [7] and clinical-pathological correlations are thus uncertain. More extensive cortical demyelination has been associated with the progressive phases of MS where degenerative features of axonal loss and cerebral atrophy are more extensive [8,9]. Such features have shown only moderate or poor correlations with the extent of traditional white matter lesions in MS [8–11].
Neuropathological studies have characterised neurodegenerative features in cortical lesions and found evidence of neuronal glial and synaptic loss in leucocortical lesions [12] and neuronal loss in subpial lesions in 2 patients with extensive cortical demyelination [4]. However, interpretation and study of the MS brain is limited by problems with suboptimal fixation and a shortage of pathological material in the early active stages of disease.
Animal models offer an alternative approach to understanding the relationship between myelin-directed autoimmunity and neurodegeneration. Cortical lesions have been described in MOG-induced marmoset EAE and in Lewis rats which share the essential characteristics of lesions in MS. Similar morphological subtypes to those in MS have been described and subpial lesions have been found to be the most frequent lesion subtype and to have the lowest density of inflammatory cells [13–18]. We have previously described diffuse cortical atrophy in this model but as in MS, the mechanisms responsible for the atrophy have not been defined [16]. Limited evidence of neurodegenerative features in the form of axonal damage and single neurons undergoing apoptosis have been seen in focal lesions of thee Lewis rat induced by sterotactic injection of pro-inflammatory mediators (17). The aim of the current study is to provide a detailed, quantitative description of neurodegenerative features in myelinated and demyelinated cortex to provide new evidence relevant to the underlying mechanisms.
Methods
Disease Model
Tissue was acquired from 6 animals with EAE and 5 control animals which came from an outbred colony of common marmosets (Callithrix jacchus jacchus) kept as part of an approved animal care and use protocol at the National Institutes of Health, Washington. Animals were induced with EAE through a subcutaneous injection of myelin oligodendrocyte glycoprotein (MOG) and inactivated Bordetella Pertussis. EAE animals underwent a progressive relapsing disease course with survival times of 26–70 days. Whole brains were cut into 2mm thick sections using a brain frame and sectioned at 6μm using a sliding microtome. Full clinical data and details of tissue selection and immunohistochemical methods have been provided elsewhere [13].
Identification of Lesions and Matched Control Areas
Reference sections from all tissue blocks were stained for myelin using anti-PLP (Serotec, UK) in order to identify demyelinated cortical lesions. Sequential sections were taken from either side of the reference section and stained with antibodies against neurones (anti-NeuN, Serotec UK) and astrocytes (anti-GFAP, Dako UK). A further adjacent section was stained with antibodies against oligodendrocytes (anti-CA2, Serotec UK). Anti CA2 has previously been shown to label approximately 20–30% of cells which fitted morphological criteria for identification as oligodendrocytes in MS lesions, whilst anti-2′ 3′ cyclic nucleotide 3′ phosphodiesterase (CNPase) labelled only 5–10% [17]. All sections used in this procedure were cut and stained in the same session. This process was repeated with new reference section surrounded by sequential sections stained for axonal damage (anti-βAPP Serotec, UK) and synapses (anti-synaptophysin Dako, UK)
Lesions were identified on myelin-stained sections and were classified according to the morphological classification described by Peterson et al [5]. A three dimensional coordinate was calculated for each lesion using a stereotaxic atlas of the marmoset brain [20]. Lesions were viewed using an Olympus BX41 microscope (Olympus, UK) at a magnification of x100 and photographed using an AxioCam MRC5 camera (Carl Zeiss Microimaging, Germany) at a resolution of 2584 × 1936 pixels. The border of each lesion was outlined using AxioVision 4.4 software (Imaging Associates UK) to generate a template that was used to identify lesions and control areas on sequential sections. Care was taken to ensure that lesion templates included only deep cortical layers 5 and 6 for Leucocortical lesions and only superficial cortical layers 1 and 2 for subpial lesions.
Matched control areas of normal appearing grey matter (NAGM) and non-EAE control cortex were identified for each lesion. The procedure for selecting cortical areas from control blocks was repeated for each of the 5 staining protocols used in order to minimise the impact of any individual control case. Due to variations in the characteristics of cortical lesions a different method was required to select control areas for each lesion subtype. All lesions were matched with an area of control cortex taken from an identical site in a non-EAE animal. Leucocortical lesions were matched with an area of NAGM taken from an identical position in the contralateral hemisphere. It was not possible to perform a direct comparison of subpial lesions with contralateral NAGM since subpial lesions almost exclusively occupied the cingulate region and were always bilateral. Instead, comparing an adjacent area of parasaggital NAGM with a matched area of non-EAE control cortex performed an indirect comparison. Using this method, features specific to demyelinated lesions would be expected to show a significant difference between lesions and control tissue but no difference between NAGM and control tissue.
Development of Computer-Assisted Method For calculation of Neuronal and Oligodendrocyte Parameters
A rapid method of calculating cell size and cell density was designed and validated in a two-step process. Traditional manual cell counts were used to retrospectively define cell size and shape parameters and these parameters were subsequently used in a prospective validation of a semi-automated, computer-assisted counting method. It was not possible to count astrocytes in this way since gliosis in EAE animals was often quite extensive and it was not possible to outline individual cells.
The first stage of the validation process involved performing manual counts of cell size and shape in order to define cells in terms of these two parameters. A randomly selected subset of 4 lesions and 4 control areas were stained for myelin, oligodendrocytes and neurones as detailed above. Each region of interest (ROI) was visualised using an Olympus BH-2 microscope (Olympus UK) and a JVC KY-300 camera (JVC, UK). Each ROI was viewed in its entirety through a series of sequential high-powered fields (x400). Live images of each field were viewed on a computer using KS400 image analysis software (Imaging associates, UK). All positive-staining structures within the field were outlined and their area and perimeter recorded. A structure was either classified as ‘cell body’ if it possessed a ring of cytoplasm which completely encircled an intact nucleus, or ‘cell process’ if it did not meet these morphological criteria. The area and F-circle value (shape) was calculated for all cell bodies and cell processes seen within the ROIs. For neurones, a cut-off point of area>60μm2 and fcircle>0.5 was chosen. This definition produced a sensitivity for detecting ‘cell bodies’ of 89.5%, a specificity of 97.4% and a positive predictive value of 99.6%. For oligodendrocytes, a cut-off point of area >30μm2 and fcircle>0.5 was chosen. This definition produced a sensitivity of 98.9%, a specificity of 94.4% and a positive predictive value of 90.4%.
These definitions were used in a prospective analysis to compare cell densities obtained using manual and computer-assisted methods. The same subset of lesions and control areas were included in the computer counting method. Digital photographs were taken of each ROI at a magnification of x100 using an Olympus BX41 microscope and an Olympus C-5050 digital camera (Olympus UK) at a resolution of 1280×960 pixels. These pictures were converted to a greyscale image and viewed on a computer using Scion image for windows version 4.0.2 (Scion Corporation). Positive-staining particles were identified using a colour density threshold that was set individually for each image by increasing the threshold until just below the point where background staining of myelin or cell nuclei began to appear in the image. The computer was programmed to identify all positively staining particles that fitted the size and shape parameters determined by the manual counting method. Figures obtained using manual and computer-assisted methods were compared using Pearson’s correlation coefficient. Measures of cell density were corrected using the Abercrombie correction [21] in order to correct for biases in cell density caused by differences in cell size. Whilst the ratio between cell size and section thickness was too high to produce absolute measures of cell density, the use of this correction generated unbiased measures of relative cell density that could be compared between matched ROIs in this study.
Measurement of Axonal and Astrocyte Parameters
ROIs stained with GFAP and βAPP were examined using a computer and a colour density threshold was applied as described above. An additional subset of deep WM lesions was also identified in sections stained with βAPP by selecting the nearest focal WM lesion to each leucocortical lesion. The positive-staining area included above the colour density threshold was divided by the total area of the ROI to obtain the AreaPercentage. This figure therefore provided a measure of gliosis in sections stained with anti-GFAP or acute axonal damage in sections stained with anti-βAPP.
Measurement of Synaptic Density
A measure of relative synaptic density was obtained in sections stained with anti-synaptophysin by using microdensitometric techniques to record colour density within ROIs. When using a camera-based measure of optical density it is not possible to calibrate the system to a range of concentration standards and it is therefore not possible to give a figure for the absolute concentration of the target molecule being measured. However, it is still possible to obtain readings which are proportional to the concentration of the target antigen if it can be demonstrated that there is a linear response relationship within the range of optical densities of the regions of interest (ROIs) being recorded. Prior to recording of optical density in histological sections the microscope and imaging system were calibrated against a series of external international standards for optical density (OD) using a Kodak Photographic step tablet. All microscope settings and lighting conditions were kept constant throughout this calibration step and for all subsequent recordings of optical density. Linear regression analysis was performed to compare recorded optical density against true optical density and showed an almost perfect linear relationship with an r2 value of 0.995.
ROIs were generated and digital images recorded using the methods described above. Images were greyscaled and viewed as an 8-bit image with a value of 255 representing white and a value of 0 representing black. The mean optical density of each ROI was recorded and divided by 255 to give a measure of light transmittance. This figure was converted to a measure of relative optical density (ROD) using the equation ROD = log10 (1/grey level transmittance). The ratio between colour density in the grey and white matter was compared in order to control for background staining within each section. The figures reported are therefore measures of normalised optical density (NOD).
Statistical Methods
Differences in cellular parameters and synaptic density were tested using a paired t-test with each ROI being compared with matched ROIs taken from lesions, NAGM and control cortex. This method eliminated the effects of physiological differences seen between different regions of the cortex. The distributions of rates of axonal damage were highly skewed and were therefore assessed using a non-parametric Mann-Whitney U test. Intra-rater reliability was assessed in all counts by examining 8 randomly selected ROIs using a blinded count-recount method and analysing the results using linear regression.
Control animals in this study were not age and sex matched and a possible confounding effect of these variables was assessed using linear regression analysis. Differences in recorded parameters between cases and controls were plotted against age differences between the animals. This produced a linear regression equation in the form y=a+bx where a is the difference in the recorded parameter at a theoretical point where age is equal. A similar analysis was performed for differences in sex by giving male animals a nominal value of 1 and female animals a nominal value of 2. All statistical calculations were performed using SPSS software (version 12.0.1, SPSS inc.)
Results
Cellular Pathology in Lesions and NAGM
Sections stained using antibodies against oligodendrocytes, astrocytes and neurones were assessed for any qualitative differences in staining patterns. No obvious disparities in cell morphology or density were seen in the intracortical lesions or in any of the 3 subpial lesions that did not involve the cingulate cortex. Anti-NeuN staining of neurones produced good quality staining of both the neuronal nuclei and cytoplasm (fig. 1A, 1D). Sections stained for oligodendrocytes with anti-CA2 showed prominent staining of cell bodies with less intense staining of myelin sheaths (fig. 1B, 1E). Oligodendrocyte density was lower in lesions than in adjacent NAGM (Fig. 1B). Anti-GFAP staining of astrocyte cell bodies and processes generated a diffuse staining pattern throughout the neuropil (fig. 1C, 1F). Areas of mild astrocytosis could be seen within many leucocortical lesions, but the edges of these regions often spread out beyond the borders of demyelinated areas (fig. 1C). Several similar areas of astrocytosis were seen within the myelinated NAGM in deep cortical layers.
Figure 1. Examples of Leucocortical Lesions Stained for Neurones and Glial Cell Populations.

Photomicrographs of lesions stained for specific cell populations. A-F show leucocortical lesions stained using antibodies against neurones (A, D), oligodendrocytes (B, E) and astrocytes (C, F). A-C original magnification ×100, scale bars represent 100μm, D-F high power fields, original magnification, ×400, scale bars represent 10μm. The leucocortical border between the WM and GM is outlined with a white dashed line where present and lesion borders between demyelinated (DMy) and myelinated areas (My) are illustrated with the black dashed line. 1A (anti-NeuN) shows the placement of a leucocortical lesion within cortical layers 5 and 6, note the staining of both cell nucleus and cytoplasm seen at high power in 1D. Anti-CA2 (1B,E) achieved strong staining of oligodendrocyte cell bodies with weaker staining of the myelin sheaths. Note the lower density of oligodendrocytes seen within lesions relative to surrounding NAGM. There was a mild degree of astrocytosis seen in lesions (1C, F) with a diffuse border that spread into surrounding NAGM. Figure 1G (original magnification ×40, scale bar represents 200μm) shows an area of the cingulate cortex (Cx) as it abuts the corpus callosum (CC). The area of cortical layers 1 and 2 that was included for the purposes of measurement is outlined between the two dashed black lines.
Quantitative size and shape parameters were recorded for cell bodies and cell fragments stained in 4 randomly selected lesions and 4 areas of NAGM using the manual counting method. Analysis using Pearson’s correlation coefficient confirmed that the measures of cell density obtained using the manual and computer-assisted cell counting methods were highly correlated (NeuN: r2=0.865, p=0.001, CA2: r2=0.870, p=0.001). Counting and recounting a subset of 8 lesions for each stain assessed intra-rater reliability for the computer-assisted method. Pearson’s correlation coefficients between counts and recounts were highly significant for both neurones (r2=0.937 p<0.001) and oligodendrocytes (r2=0.857, p<0.001).
Data from 26 leucocortical lesions was included in the quantitative analysis of oligodendrocytes, 22 leucocortical lesions were analysed for neuronal and astrocyte pathology. This discrepancy in lesion numbers was due to the background staining of myelin sheaths in sections stained with anti-CA2 that facilitated more accurate identification of smaller demyelinated lesions. 15 cingulate subpial lesions were included in the quantitative analysis for all cell populations. The distribution of data for cell density, cell size and AreaPercentage was examined and was normally distributed. Data from matched lesions and control areas were therefore compared using a paired t-test. The mean and standard error for all cellular parameters in all cell types are shown for leucocortical and subpial lesions in figures 2 and 3 respectively. All significant differences with a p-value <0.05 are highlighted in the graphs.
Figure 2. Bar Charts Showing Cell Size and Density Parameters for Leucocortical Lesions and Control Areas.

Bar charts showing mean and standard error of measures of cell density and cell size for all cell types in deep cortical layers. Significant differences between all matched ROIs are displayed on the chart.
Figure 3. Bar Charts Showing Cell Size and Density Parameters for Cingulate Subpial Lesions and Control Areas.

Bar charts showing mean and standard error of measures of cell density and cell size for all cell types in superficial cortical layers. Significant differences between directly matched ROIs (cingulate lesion vs. cingulate control, paracentral NAGM vs. paracentral control) are displayed on the chart.
There was a decrease in oligodendrocyte staining in both leucocortical lesions (33% vs. control tissue p=0.03, 30% vs. NAGM p=0.03) and cingulate subpial lesions (36% vs. control tissue, p=0.03). Compared to control grey matter, there was an increase in relative GFAP staining in leucocortical lesions (263%, p=0.002), deep cortical NAGM (234%, p=0.005) and cingulate subpial lesions (143%, p=0.015), but not in superficial NAGM (59%, p=0.669). Significant neuronal size changes were only found in subpial plaques. In the superficial cortical layers there was a decrease in neuronal size in subpial lesions (−17.5% vs. controls, p<0.001), a decreased neuronal size of similar magnitude was seen in NAGM of cortical layers 1 and 2 but this did not reach statistical significance (=12.9%, p=0.055). In leucocortical lesions, similar decreases in neuronal size were found in both lesions (−16.2%, p=0.001) and NAGM (−13.6%, p=0.009). Neuronal density was reduced in leucocortical lesions (22.2% vs. NAGM p=0.023, 23.2% vs. controls p=0.045), but there was no evidence of neuronal loss detected in cingulate subpial lesions.
Linear regression analysis confirmed weak but significant correlations between neuronal density and age differences between cases and controls in both myelinated and demyelinated regions (r2 = 0.158 – 0.314). Other significant correlations were found between age and neuronal size in cingulate subpial lesions vs. controls (r2 = 0.593, p=0.020) and in oligodendrocyte size between leucocortical lesions and controls (r2 = 0.279, p=0.006). Examination of the constant in the regression equation revealed that the effect of age difference between cases and controls did not alter any of the conclusions regarding differences in cell size or density related to disease. There were no significant effects found between sex difference in cases and controls and any of the parameters measured.
Subcellular Pathology in Lesions and NAGM
18 leucocortical lesions and 15 cingulate subpial lesions were identified in the sections used for analysis of axonal and synaptic pathology. An additional 18 deep WM lesions were used in the quantitative analysis of axonal damage. Visual inspection of the tissue revealed that βAPP staining was prominent throughout the WM of all cases, particularly in WM lesions but less prominent positive staining was seen in cortical lesions and in some areas of NAGM. Density of βAPP positive staining was lower in regions of leucocortical lesions within the grey matter relative to extensions into the white matter portion whilst there was also less staining seen in cingulate subpial lesions compared with adjacent WM in the corpus callosum. βAPP staining appeared more prominent in deep WM lesions compared to cortical lesions. The distribution of βAPP positive axons within cingulate subpial lesions was concentrated towards the subpial surface. Axonal spheroids, indicative of axonal transection were rare in myelinated cortex, but were present in 5/15 subpial lesions and 9/18 leucocortical lesions. There was no βAPP positive staining seen in control cases and control areas from non-EAE animals were therefore not included in the subsequent quantitative analysis. Typical appearances of βAPP staining in and around leucocortical and subpial lesions are shown in figure 4A and 4B.
Figure 4. Photomicrographs Showing Typical Patterns of βAPP and Synaptophysin Immunoreactivity.

Photomicrographs showing typical staining patterns for βAPP (figures 4A, 4B) and synaptophysin (figure, 4C), original magnification ×100, scale bars represent 100μm. Figure 4A shows the typical relative densities of βAPP positive axons in different tissue compartments. Note that the density of damaged axons in the cortical portion of the lesion appears greater than in surrounding NAGM but lower than in the white matter portion. The inset shows an area within the grey matter portion of the lesion at high power (original magnification ×400). Arrows indicate axonal spheroids and arrowheads point to axonal beading. Figure 4B demonstrates the typical appearances of βAPP staining in a cingulate subpial lesion and surrounding areas. The section shows an area of demyelinated cingulate cortex (Cx) as it abuts the superior commissure of the hippocampus (SCH) and corpus callosum (CC). Note the distribution of βAPP positive structures in the (myelinated) hippocampus and corpus callosum with a lower density of βAPP positive axons in the demyelinated subpial lesion within the cingulate cortex. The arrow indicates a βAPP positive spheroid within the demyelinated area of cortex. Inset shows axonal spheroids in the cortex at higher magnification. Figure 4C shows an area of NAGM in an EAE animal with a typical pattern of synaptophysin immunoreactivity. Note the presence of distinct, small synaptophysin positive structures in the WM (arrows) with a staining pattern similar to that seen with βAPP. Inset shows high power field (original magnification ×400) showing detail of the typical punctate staining pattern in cortical layer 6.
Box and Whisker plots showing the distribution of βAPP positive axonal densities for WM lesions, cortical lesions and matched areas of WM and NAGM are shown in Figure 5. The data was heavily skewed and required the use of a non-parametric Mann-Whitney U test to assess relative densities between ROIs. Leucocortical lesions had a median density of 494.7 βAPP positive axons/mm2 which was significantly greater than that seen in matched areas of deep cortical NAGM (median=77.6, p=0.004). Cingulate subpial lesions had a median density of 51.3 axons/mm2 which was significantly greater than that seen in areas of superficial NAGM from the paracentral cortex (median=11.7, p=0.003). Comparisons between unmatched ROIs revealed that leucocortical lesions had a significantly greater density of βAPP positive axons than cingulate subpial lesions (p=0.006). The extent of βAPP positive axons in GM overall, however, was lower than in WM lesions in these animals. Deep WM lesions had a median density of 1653.5 axons/mm2 which showed only a trend towards significance when compared to leucocortical lesions (p=0.056) but was significantly greater than cingulate subpial lesions (p<0.001).
Figure 5. Box and Whisker Plot Showing Distributions of βAPP Positive Axonal Densities seen in ROIs from EAE Cases.
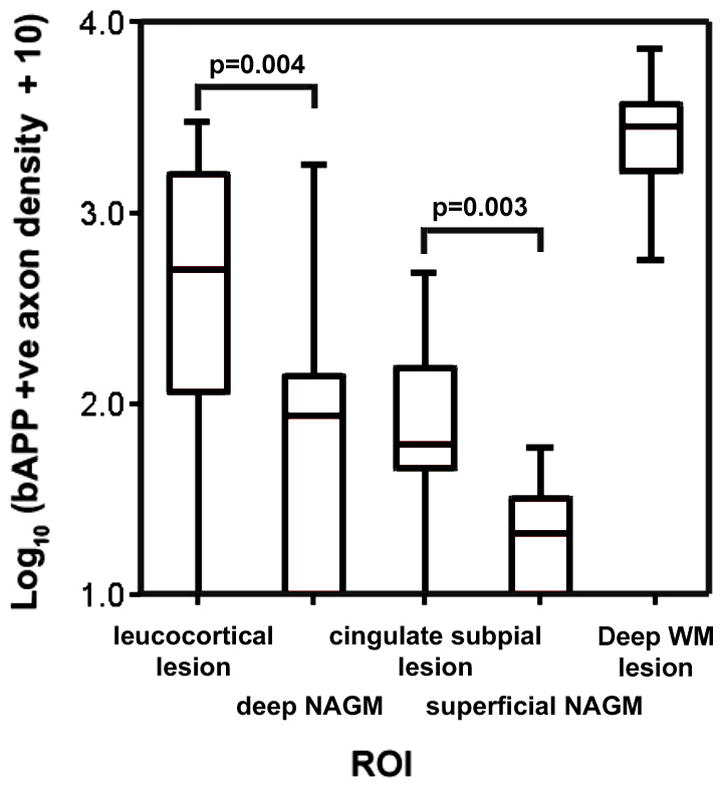
Box and whisker plot showing the distribution of βAPP positive axons within deep WM lesions, leucocortical lesions, subpial lesions and their matched control areas. Significant differences between cortical lesion subtypes and matched control areas are marked on the graphs. Note the use of a logarithmic scale.
Sections stained using synaptophysin displayed high contrast between GM and WM. Examination of the GM at high power revealed a punctate staining pattern with lighter-staining shadows representing the position of cell bodies. WM in control cases was almost devoid of background staining but cases displayed distinct, small synaptophysin positive structures throughout the WM that were more frequent within lesions. These were of similar size and shape to βAPP positive structures. Typical appearances of sections stained for synaptophysin are shown in figure 4C.
NOD of synaptophysin staining was quantified in 15 cingulate subpial lesions taken from 5 animals and 17 leucocortical lesions taken from 6 animals along with matched ROIs from 5 control animals. Leucocortical lesions had a mean NOD of 1.07 compared with 1.08 for NAGM and 1.14 for control cortex. A paired t-test confirmed a significant decrease in synaptophysin staining in lesions and NAGM compared with controls (p=0.001, p=0.006 respectively) but no significant difference between lesions and NAGM (p=0.380). Cingulate subpial lesions had a mean NOD of 1.10 compared with 1.12 for cingulate control cortex. Paracentral NAGM had a mean NOD of 1.09 compared with 1.13 for paracentral control cortex. A paired t-test did not find a significant difference in NOD between either cingulate lesions and controls or paracentral NAGM and controls (p=0.306, p=0.818 respectively. The bar charts in figure 6 show the distribution of NOD measurements in all ROIs.
Figure 6. Distribution of Normalised Optical Density of Synaptophysin Staining for all ROIs.

Bar charts showing mean and standard error of normalised optical densities (NOD) of leucocortical lesions and matched ROIs (figure 6A) and cingulate subpial lesions and matched ROIs (figure 6B). All statistically significant differences are marked on the graphs.
A significant positive correlation was detected between age difference and NOD difference in cingulate subpial lesions and controls (r2=0.351, p=0.020). Analysis of the constant in the regression equation confirmed that this did not affect the conclusion that there was no significant effect of cingulate subpial lesions on synaptophysin NOD (a=0.025, p=0.480). There was no significant association between age and NOD difference for leucocortical lesions and no significant association between sex and difference in NOD in leucocortical or cingulate subpial lesions.
Discussion
This study has confirmed and extended a characterisation of neurodegeneration in GM involving both cortical GM lesions and NAGM in MOG-induced marmoset EAE. Oligodendrocyte loss was specific to demyelinated lesions in the cortex whilst evidence of acute axonal damage was seen diffusely throughout the cortex but was more frequent in demyelinated lesions. The occurrence of other features differed between leucocortical and subpial lesions. There were no diffuse changes seen in myelinated areas of superficial cortex but gliosis and a decrease in neuronal size were found in cingulate subpial lesions. Gliosis, a decrease in neuronal size and synaptic loss were also seen diffusely throughout deep cortical layers whilst leucocortical lesions showed additional evidence of neuronal loss and an increase in oligodendrocyte size
The finding of oligodendrocyte loss specific to demyelinated lesions makes intuitive sense and the magnitude of the loss witnessed in this study is similar to the 36% loss of glial cells seen in a previous study of MS [12]. The increase in oligodendrocyte size within leucocortical lesions could represent an increase in the number of reactive oligodendrocytes or oligodendrocyte precursor cells. Larger MOG +ve cells seen in MS lesions have been shown to be mature reactive oligodendrocytes [24] whilst studies of oligodendrocyte morphology in experimental cat lesions have shown that all oligodendrocyte precursor stages have relatively small nuclei and scant cytoplasm [23,24]. This evidence suggests that the larger oligodendrocytes within lesions in this study are reactive.
Previous work in MS has shown that axonal loss occurs in the early disease course before significant disability has developed [8,25] and at the time of a clinically isolated syndrome in MS or first relapse in EAE [26,27]. Our finding of diffuse axonal damage in this model provides further evidence that axonal pathology occurs in the early active phase of demyelinating disease. Significantly greater rates of axonal damage were seen within demyelinated regions indicating that cortical demyelination contributes to axonal pathology. The presence of axonal spheroids within lesions implies that a proportion of this damage is permanent and could contribute to the significant cortical atrophy that has been demonstrated in MS and marmoset EAE [9,11,28].
Evidence that inflammation is directly involved in axonal damage within the cortical lesions in this model derives from the finding that the more active leucocortical lesions contain higher rates of axonal damage than subpial lesions. In addition, βAPP positive axons in subpial lesions were clustered close to the subarachnoid space that contains B-cells, T-cells and macrophages. Studies have shown that in EAE WM lesions, and in MS cortical and WM lesions the degree of inflammation is proportional to the axonal damage in each lesion [29–32] and that the precise location of axonal damage and inflammatory cell infiltration within individual lesions is closely linked [33,34].
Axonal damage, synaptic loss and a decrease in neuronal size were all seen throughout myelinated and demyelinated areas of deep cortical layers but not in superficial layers. These features must therefore be due to more diffuse pathological factors or secondary to remote pathology in other areas of the CNS. Neurones in deep layers would be more vulnerable to effects of remote lesions due to their more extensive connections. Axonal pathology in remote white matter lesions could cause synaptic loss in deep cortical layers through Wallerian degeneration and a decrease in neuronal size through retrograde degeneration which would be more likely to affect larger neurones with longer axons. Alternatively, diffuse changes can be caused by diffuse inflammation occurring throughout the whole brain that has been described in MS [3]. We have previously demonstrated a greater concentration of inflammatory cells in NAGM of marmoset EAE compared with control animals and this background inflammation appears greater in deeper cortical layers [13]. The presence of inflammatory cells in the subarachnoid space overlying subpial lesions may also explain the similar findings of gliosis and a decrease in neuronal size that is specific to demyelinated lesions in superficial layers.
Comparisons can be drawn to assess whether this EAE model adequately reflects cortical pathology in MS. The lack of evidence for a reduction of synaptic density within cortical lesions in this study is consistent with a previous investigation of subpial lesions in MS [4], but is different to the results of Wegner et al. who found a 47% loss of synaptophysin reactivity in MS leucocortical lesions [12]. The results of this study were potentially confounded by the staining patter seen within lesions that were similar to that seen with βAPP and implies that synaptophysin accumulates in lesions due to interruption of fast axonal transport. This study may therefore have underestimated the extent of synaptic loss within lesions but it is unlikely that this issue explains a difference in synaptic density of this magnitude between MS and EAE.
Previous work in EAE spinal cord showed that synaptic and dendritic loss in the spinal cord was related to the degree of inflammation [35] and the discrepancy in findings in the cortex between MS and EAE is therefore surprising given that there is considerably more inflammation seen in EAE leucocortical lesions relative to those of MS. This discrepancy could be accounted for by differences in the age of lesions between chronic end-stage MS and the acute form of EAE in this study. The magnitude of synaptic loss in older lesions may reflect the build up of damage over time or a decreased capacity for cortical repair. Wegner et al found evidence of a 50% increase in the concentration of GAP-43, a marker of synaptic plasticity within leucocortical lesions but it is conceivable that the capacity for synaptic repair is higher in the more acute EAE model. An alternative explanation is that there is a beneficial effect of inflammation similar to that seen in the taiep rat where the induction of acute inflammation was required in order to remyelinate chronic demyelinated tissue [36]. These findings suggest that factors other than inflammation may be responsible for chronic synaptic loss.
Leucocortical lesions showed evidence of neuronal loss that was not seen in subpial lesions and this finding has previously been described in MS. Wegner et al. found an overall loss of neuronal density of 9% in leucocortical lesions compared with adjacent NAGM [12]. Vercellino et al. studied neuronal density in subpial lesions and found no significant difference in 4 out of 6 cases studied [4]. Although this group found evidence of neuronal loss in two patients, these patients had a degree of subpial demyelination (25–48%) that was far in excess of that seen in any of the marmosets in this study.
Neuronal loss could be caused by loss of trophic support from oligodendrocytes [37] but the magnitude of oligodendrocyte loss seen in this study was similar in leucocortical and subpial lesions. Neuronal loss therefore may occur as a direct result of inflammatory cell infiltration and previous studies in MS and EAE have shown more inflammatory activity in leucocortical lesions relative to subpial lesions [2,5,13]. The mechanism of inflammation has been shown to differ between cortical lesion types. Merkler et al. described immunoglobulin leakage and complement deposition in leucocortical lesions of marmoset EAE but not in subpial lesions [14]. Other studies have suggested that subpial demyelination occurs due to inflammation behind an intact blood brain barrier or a substance diffusing from inflammatory cells in the subarachnoid space [3, 5, 38].
Previous work has shown a diffuse 13–21% loss of cortical thickness in this model that was not directly related to local cortical lesions [16]. In this study, astrocyte staining was increased and oligodendrocyte loss was specific to demyelinated lesions implying that it is neuronal changes that are the substrate of cortical atrophy. We found evidence of a diffuse decrease in neuronal size and synaptic density in deep cortical layers. A similar decrease in cortical size and synaptic density was seen in superficial layers but these changes did not reach clinical significance in this study. We can speculate that it is a decrease in neuronal size related to axonal or dendritic loss that leads to cortical atrophy but further work is needed to confirm this.
An alternative explanation is that the methodology employed in this study has failed to detect a true neuronal loss in the model. We used cell profile counts that were corrected for any differences in the size of objects being counted by using the Abercrombie correction. Whilst the ratio of the section thickness to the object being counted was too high at 1:3 to produce cell density figures which could be compared across other studies we believe that the use of this correction prevented a systematic bias when comparing counts in matched areas within this current work. In addition, any error produced by a tendency to underestimate the density of smaller objects would have led us to overestimate the magnitude of diffuse neuronal loss since neurones were smaller in EAE cortex. Where it was possible, we compared parameters in lesions with matched areas of NAGM taken from an identical location in the opposite hemisphere of the same animal. Since cingulate subpial lesions were always bilateral, it was not possible to use this method and indirect comparisons were used instead. This will necessarily have introduced random error into the figures and reduced the power of the study to find significant differences between subpial lesions and control areas.
This study has described and quantified extensive neurodegenerative features in marmoset EAE and demonstrated that they occur in the early active stages of demyelinating disease. Focal, demyelinating cortical lesions are associated with some of these features whilst others have a more diffuse distribution and may be secondary to distant inflammatory lesions, diffuse inflammation in the cortex or an as yet unidentified neurodegenerative processes. Whilst there are important differences, the nature of the cortical pathology in marmoset EAE is similar to that of MS, suggesting that it is a good model with which to address questions related to GM injury in MS.
Acknowledgments
The authors would like to acknowledge Drs. Henry McFarland and Roland Martin from the National Institutes of Neurological Disorders and Stroke, National Institutes of Health for support of the EAE marmoset project. This work was supported by the intramural research program in the Clinical Center at the National Institutes of Health. The authors would also like to acknowledge the generous gift of recombinant MOG protein from Robert Weissert from the Department of Neurology, University of Tuebingen, Germany. This work was supported by the UK Multiple Sclerosis Society.
References
- 1.Lumsden CE. The neuropathology of multiple sclerosis. In: Vinken PJ, Bruyn GW, editors. Handbook of clinical neurology. Amsterdam: North Holland Publ; 1970. pp. 217–309. [Google Scholar]
- 2.Bo L, Vedeler CA, Nyland H, Trapp BD, Mork SJ. Subpial demyelination in the cerebral cortex of multiple sclerosis patients. J Neuropathol Exp Neurol. 2003;62:723–732. doi: 10.1093/jnen/62.7.723. [DOI] [PubMed] [Google Scholar]
- 3.Kutzelnigg A, Lucchinetti CF, Stadelmann C, Bruck W, Rauschka H, Bergmann M, et al. Cortical demyelination and diffuse white matter injury in multiple sclerosis. Brain. 2005;128:2705–2712. doi: 10.1093/brain/awh641. [DOI] [PubMed] [Google Scholar]
- 4.Vercellino M, Plano F, Votta B, Mutani R, Giordana MT, Cavalla P. Grey matter pathology in multiple sclerosis. J Neuropathol Exp Neurol. 2005;64:1101–1107. doi: 10.1097/01.jnen.0000190067.20935.42. [DOI] [PubMed] [Google Scholar]
- 5.Peterson JW, Bo L, Mork S, Chang A, Trapp BD. Transected neurites, apoptotic neurons, and reduced inflammation in cortical multiple sclerosis lesions. Ann Neurol. 2001;50:389–400. doi: 10.1002/ana.1123. [DOI] [PubMed] [Google Scholar]
- 6.Bo L, Vedeler CA, Nyland H, Trapp BD, Mork SJ. Intracortical multiple sclerosis lesions are not associated with increased lymphocyte infiltration. Mult Scler. 2003;9:323–331. doi: 10.1191/1352458503ms917oa. [DOI] [PubMed] [Google Scholar]
- 7.Geurts JJ, Bo L, Pouwels PJ, Castelijns JA, Polman CH, Barkhof F. Cortical lesions in multiple sclerosis: combined postmortem MR imaging and histopathology. AJNR Am J Neuroradiol. 2005;26:572–577. [PMC free article] [PubMed] [Google Scholar]
- 8.De Stefano N, Narayanan S, Francis S, Smith S, Mortilla M, Tartaglia C, et al. Diffuse axonal and tissue injury in patients with low cerebral lesion load and no disability. Arch Neurol. 2002;59:1565–1571. doi: 10.1001/archneur.59.10.1565. [DOI] [PubMed] [Google Scholar]
- 9.De Stefano N, Matthews PM, Filippi M, Agosta F, De Luca M, Bartolozzi ML, et al. Evidence of early cortical atrophy in MS: relevance to white matter changes and disability. Neurology. 2003;60:1157–116. doi: 10.1212/01.wnl.0000055926.69643.03. [DOI] [PubMed] [Google Scholar]
- 10.Dalton CM, Chard DT, Davies GR, Miszkiel KA, Altmann DR, Fernando K, et al. Early development of multiple sclerosis is associated with progressive grey matter atrophy in patients presenting with clinically isolated syndromes. Brain. 2004;127:1101–1107. doi: 10.1093/brain/awh126. [DOI] [PubMed] [Google Scholar]
- 11.Sastre-Garriga J, Ingle GT, Chard DT, Cercignani M, Ramio-Torrenta L, Miller DH, et al. Grey and white matter volume changes in early primary progressive multiple sclerosis: a longitudinal study. Brain. 2005;128:1454–1460. doi: 10.1093/brain/awh498. [DOI] [PubMed] [Google Scholar]
- 12.Wegner C, Esiri MM, Chance SA, Palace J, Matthews PM, et al. Neocortical Neuronal, Synaptic and Glial Loss in Multiple Sclerosis. Neurology. 2006 doi: 10.1212/01.wnl.0000237551.26858.39. [DOI] [PubMed] [Google Scholar]
- 13.Pomeroy IM, Matthews PM, Frank JA, Jordan EK, Esiri MM. Demyelinated neocortical lesions in marmoset autoimmune encephalomyelitis mimic those in multiple sclerosis. Brain. 2005;128:2713–2721. doi: 10.1093/brain/awh626. [DOI] [PubMed] [Google Scholar]
- 14.Merkler D, Schmelting B, Czeh B, Fuchs E, Stadelmann C, Bruck W. Myelin oligodendrocyte glycoprotein-induced experimental autoimmune encephalomyelitis in the common marmoset reflects the immunopathology of pattern II multiple sclerosis lesions. Mult Scler. 2006;12:369–374. doi: 10.1191/1352458506ms1290oa. [DOI] [PubMed] [Google Scholar]
- 15.Merkler D, Boscke R, Schmelting B, Czeh B, Fuchs E, Bruck W, Stadelmann C. Differential macrophage/microglia activation in neocortical EAE lesions in the marmoset monkey. Brain Pathol. 2006;16:117–123. doi: 10.1111/j.1750-3639.2006.00004.x. [DOI] [PMC free article] [PubMed] [Google Scholar]
- 16.Pomeroy IM, Jordan EK, Frank JA, Matthews PM, Esiri MM. Diffuse cortical atrophy in a marmoset model of multiple sclerosis. Neurosci Lett. 2008;437:121–4. doi: 10.1016/j.neulet.2008.03.069. [DOI] [PMC free article] [PubMed] [Google Scholar]
- 17.Merkler D, Ernsting T, Kerschensteiner M, Bruck W, Stadelmann C. A new focal EAE model of cortical demyelination: multiple sclerosis-like lesions with rapid resolution of inflammation and extensive remyelination. Brain. 2006;129:1972–83. doi: 10.1093/brain/awl135. [DOI] [PubMed] [Google Scholar]
- 18.Storch MK, Bauer J, Linington C, Olsson T, Weissert R, Lassmann H. Cortical demyelination can be modelled in specific rat models of autoimmune encephalomyelitis and is major histocompatability complex (MHC) haplotype-related. J Neuropathol Exp Neurol. 2006;65:1137–42. doi: 10.1097/01.jnen.0000248547.13176.9d. [DOI] [PubMed] [Google Scholar]
- 19.Morris CS, Esiri MM, Sprinkle TJ, Gregson N. Oligodendrocyte reactions and cell proliferation markers in human demyelinating diseases. Neuropathol Appl Neurobiol. 1994;20:272–281. doi: 10.1111/j.1365-2990.1994.tb00969.x. [DOI] [PubMed] [Google Scholar]
- 20.Stephan H, Baron G, Schwerdtreger WK. The Brain Of The Common Marmoset (Callithrix Jacchus): A Stereotaxic Atlas. Berlin: Springer Verlag; 1980. [Google Scholar]
- 21.Abercrombie M. Estimation of nuclear population from microtome sections. Anat Rec. 1946;94:239–247. doi: 10.1002/ar.1090940210. [DOI] [PubMed] [Google Scholar]
- 22.Bruck W, Schmied M, Suchanek G, Bruck Y, Breitschopf H, Poser S, et al. Oligodendrocytes in the early course of multiple sclerosis. Ann Neurol. 1994;35:65–73. doi: 10.1002/ana.410350111. [DOI] [PubMed] [Google Scholar]
- 23.Carroll WM, Jennings AR, Ironside LJ. Identification of the adult resting progenitor cell by autoradiographic tracking of oligodendrocyte precursors in experimental CNS demyelination. Brain. 1998;121:293–302. doi: 10.1093/brain/121.2.293. [DOI] [PubMed] [Google Scholar]
- 24.Jennings A, Carroll W. GSLII positivity is not confined to oligodendrocytes in adult mammalian CNS. J Neurocytol. 1999;28:239–248. doi: 10.1023/a:1007032224480. [DOI] [PubMed] [Google Scholar]
- 25.De Stefano N, Narayanan S, Francis GS, Arnaoutelis R, Tartaglia MC, Antel JP, et al. Evidence of axonal damage in the early stages of multiple sclerosis and its relevance to disability. Arch Neurol. 2001;58:65–70. doi: 10.1001/archneur.58.1.65. [DOI] [PubMed] [Google Scholar]
- 26.Hobom M, Storch MK, Weissert R, Maier K, Radhakrishnan A, Kramer B, et al. Mechanisms and time course of neuronal degeneration in experimental autoimmune encephalomyelitis. Brain Pathol. 2004;14:148–157. doi: 10.1111/j.1750-3639.2004.tb00047.x. [DOI] [PMC free article] [PubMed] [Google Scholar]
- 27.Rocca MA, Mezzapesa DM, Falini A, Ghezzi A, Martinelli V, Scotti G, et al. Evidence for axonal pathology and adaptive cortical reorganization in patients at presentation with clinically isolated syndromes suggestive of multiple sclerosis. Neuroimage. 2003;18:847–855. doi: 10.1016/s1053-8119(03)00043-0. [DOI] [PubMed] [Google Scholar]
- 28.Sailer M, Fischl B, Salat D, Tempelmann C, Schonfeld MA, Busa E, et al. Focal thinning of the cerebral cortex in multiple sclerosis. Brain. 2003;126:1734–1744. doi: 10.1093/brain/awg175. [DOI] [PubMed] [Google Scholar]
- 29.Trapp BD, Peterson J, Ransohoff RM, Rudick R, Mork S, Bo L. Axonal transection in the lesions of multiple sclerosis. New Engl J Med. 1998;338:278–285. doi: 10.1056/NEJM199801293380502. [DOI] [PubMed] [Google Scholar]
- 30.Bitsch A, Schuchardt J, Bunkowski S, Kuhlmann T, Bruck W. Axonal injury in multiple sclerosis. Correlation with demyelination and inflammation. Brain. 2000;123:1174–1183. doi: 10.1093/brain/123.6.1174. [DOI] [PubMed] [Google Scholar]
- 31.Kornek B, Storch MK, Weissert R, Wallstroem E, Stefferl A, Olsson T, et al. Multiple sclerosis and chronic autoimmune encephalomyelitis: a comparative quantitative study of axonal injury in active, inactive, and remyelinated lesions. Am J Pathol. 2000;157:267–276. doi: 10.1016/S0002-9440(10)64537-3. [DOI] [PMC free article] [PubMed] [Google Scholar]
- 32.Kuhlmann T, Lingfeld G, Bitsch A, Schuchardt J, Bruck W, et al. Acute axonal damage in multiple sclerosis is most extensive in early disease stages and decreases over time. Brain. 2002;125:2202–2212. doi: 10.1093/brain/awf235. [DOI] [PubMed] [Google Scholar]
- 33.Ferguson B, Matyszak MK, Esiri MM, Perry VH. Axonal damage in acute multiple sclerosis lesions. Brain. 1997;120:393–399. doi: 10.1093/brain/120.3.393. [DOI] [PubMed] [Google Scholar]
- 34.Diaz-Sanchez M, Williams K, Deluca GC, Esiri MM. Protein co-expression with axonal injury in multiple sclerosis plaques. Acta Neuropathol (Berl) 2006;111:289–299. doi: 10.1007/s00401-006-0045-0. [DOI] [PubMed] [Google Scholar]
- 35.Zhu B, Liqing L, Moore GRW, Paty DW, Cynader MS. Dendritic and synaptic pathology in experimental autoimmune encephalomyelitis. Am J Pathol. 2003;162:1639–1650. doi: 10.1016/S0002-9440(10)64298-8. [DOI] [PMC free article] [PubMed] [Google Scholar]
- 36.Foote AK, Blakemore WF. Inflammation stimulates remyelination in areas of chronic demyelination. Brain. 2005;128:528–539. doi: 10.1093/brain/awh417. [DOI] [PubMed] [Google Scholar]
- 37.Wilkins A, Compston A. Trophic factors attenuate nitric oxide mediated neuronal and axonal injury in vitro: roles and interactions of mitogen-activated protein kinase signalling pathways. J Neurochem. 2005;92:1487–96. doi: 10.1111/j.1471-4159.2004.02981.x. [DOI] [PubMed] [Google Scholar]
- 38.Serafini B, Rosicarelli B, Magliozzi R, Stigliano E, Aloisi F, et al. Detection of ectopic B-cell follicles with germinal centers in the meninges of patients with secondary progressive multiple sclerosis. Brain Pathol. 2004;14:164–174. doi: 10.1111/j.1750-3639.2004.tb00049.x. [DOI] [PMC free article] [PubMed] [Google Scholar]