Abstract
Despite advances in methods and instrumentation for analysis of phosphopeptides using mass spectrometry, it is still difficult to quantify the extent of phosphorylation of a substrate due to physiochemical differences between unphosphorylated and phosphorylated peptides. Here we report experiments to investigate those differences using MALDI-TOF mass spectrometry for a set of synthetic peptides by creating calibration curves of known input ratios of peptides/phosphopeptides and analyzing their resulting signal intensity ratios. These calibration curves reveal subtleties in sequence-dependent differences for relative desorption/ionization efficiencies that cannot be seen from single-point calibrations. We found that the behaviors were reproducible with a variability of 5–10% for observed phosphopeptide signal. Although these data allow us to begin addressing the issues related to modeling these properties and predicting relative signal strengths for other peptide sequences, it is clear this behavior is highly complex and needs to be further explored.
Introduction
Phosphorylation of proteins by kinases is one of the most common and important biological signaling events. Protein phosphorylation regulates many essential processes including intercellular signaling, proliferation and differentiation. This post-translational modification has traditionally been monitored using molecular biology techniques such as Western blotting (which requires specific probes to be generated for substrates of interest) or by incorporation of radioactive phosphate (32P)—however, recently mass spectrometry has grown in popularity and practicality as a method for monitoring and characterizing phosphorylation of peptide and protein substrates. The primary advantages of mass spectrometry are probe-free detection (unexpected modifications can be readily detected) and the potential to both sequence phosphorylated substrates and identify their phosphorylation sites directly.
Qualitatively identifying phosphorylated proteins and peptides using mass spectrometry is commonplace, thus technologies for discovery of signaling phosphorylations are becoming more and more practical. However, quantifying phosphorylation using mass spectrometry is not as straightforward. It is well known that mass spectrometry is not absolutely quantitative. Particularly for MALDI-TOF MS, many factors such as sample crystal size and homogeneity, analyte distribution within the crystals and crystal layer thickness can influence the absolute ion intensity from shot to shot of the laser.1, 2 The errors that these factors introduce can be controlled for by preparing replicate spots, performing many laser shots (>500) and having the laser search the sample spot randomly but comprehensively to obtain an overall representation of the distribution of sample in the spot. Although the absolute peak intensity cannot be simply compared between spots, it is known that the intensity of any signal relative to other signals in the spectrum does correlate with their relative amounts in the sample. Therefore it is possible to use internal standards such as stable isotope-labeled analogs to quantify materials by their MALDI-TOF-MS signal.3–6 However, stable isotope labels can be expensive, and despite the common assumption that they provide high precision, their use is in fact subject to the same reproducibility issues involved in comparing the peak intensities of any given peaks in a mass spectrum.5–7 While the unknown physiochemical factors that influence relative ionization efficiencies for various peptides are undoubtedly extremely complex, it is reasonable to assume that they will be reproducible between given sets of peptides. Therefore as long as sample preparation and matrix conditions are carefully controlled, any peptide should be able to serve as an internal standard for any other if they are thoroughly calibrated to each other and can be normalized.
For monitoring kinase reactions, an ideal internal standard for tracking the progress of a phosphorylation reaction is the unphosphorylated substrate peptide, since it will always be in the sample and at a concentration that is closely related to that of the reaction product. However, phosphorylation is known to alter the relative ionization and detection of peptides, sometimes drastically.8 This difference can be sequence-dependent in a seemingly unpredictable way, where some peptide/phosphopeptide pairs ionize equally well and others show very different relative phosphopeptide signals and these differences depend on the polarity and mode of analysis. As is well known, but minimally characterized, phosphopeptides tend to be detected somewhat preferentially in the negative polarity modes and conversely are often under-represented in positive mode spectra.9
External calibration of mixtures of an unphosphorylated peptide and its phosphorylated derivative and/or the comparison of their relative signal strengths at 1:1 in both positive and negative modes have been used before to begin characterization of the detection differences between unphosphorylated/phosphorylated peptide pairs.10–14 Methods using HPLC to externally calibrate relative UV trace peak areas for unphosphorylated and phosphorylated versions of the CaMK II substrate peptide show that the relative peak cluster areas for the same samples in the MALDI can be reproducible and representative of the amount of those peptides in the sample. However, they rely on the separation of those two peptides on an HPLC column, a process that is far from trivial since it is highly sequence- and molecular weight-dependent. Other methods using one-point calibration of relative signal strengths in the MALDI can be difficult to interpret, since the disparity between positive mode and negative mode ratios of unphosphorylated to phosphorylated peptides can be unpredictable for different sequences. From this literature, it is apparent that the behavior of every unphospho/phosphopeptide pair is different during the desorption and ionization process, and that individual sequences need to be calibrated separately to derive useful relationships between their input concentration ratios and observed signal ratios.
In this work, we have begun by generating standard curves for a set of synthetic peptide/phosphopeptide pairs and investigated a number of sample preparation and instrument parameter conditions for understanding their relative ionization efficiency across a broad range of relative concentrations. To streamline the data analysis, we have written software tools with which to quantify the observed “% phosphorylated” signal from the MALDI-TOF MS data and plot them as calibration curves in a semiautomated fashion. Eventually, we hope that calibration curves for a number of different peptides with diverse sequence characteristics may lead to models predicting how the peptide and matrix chemistries (such as hydrophobicity, overall peptide net charge, distance of charged amino acids from the phosphorylated residue and total peptide length) contribute to the relative ionization behavior.
Experimental
Peptides were obtained from New England Peptide and Anaspec, Inc. Matrices were obtained from Sigma-Aldrich. Peptide pI estimates were obtained using an Excel spreadsheet developed by Gale Rhodes at the University of Southern Maine (http://www.usm.maine.edu/~rhodes/Goodies/PeptChg.xls, accessed 8/2007)
Sample preparation
Peptides were obtained from the suppliers in 1 mg lyophilized aliquots. These were dissolved in 0.1% aqueous TFA at an appropriate volume to give ~1 mM and aliquots diluted to ~100 μM, initially assuming that each sample as obtained from the supplier contained 1 mg. To confirm the approximate accuracy of the aliquoted amounts of lyophilized peptide as well as the peptide purities, each sample was analyzed by reverse-phase HPLC-MS and the peaks observed at 214 nm from UV detection that showed MS traces corresponding to the mass of each peptide were compared for each unphosphorylated/phosphorylated peptide pair (see supporting information for spectra). All peptides were >95% pure (with the exception of peptide 3 for which the impurities were considered when calculating the relative concentration of the materials of interest) and their relative peak integration ratios (between unphosphorylated and phosphorylated versions of the same peptide) were within 1–5% of the expected amounts. These known errors were used to correct the assumed concentrations of the unphosphorylated vs. phosphorylated stock solutions for each peptide when determining the actual input ratio for each experiment (see table in supporting information).
Unphosphorylated/phosphorylated peptides were combined in ratios of ~15, 25, 35, 45, 55, 65, 75 and 85% (taking the corrections from HPLC analysis of each stock solution into account) in a total volume of 20 μl. These solutions were spotted in triplicate on ABI disposable MALDI plates, combining 0.3 μl sample with 0.3 μl matrix solutions (matrix dissolved at 10 mg/ml for CHCA and DHB and 20 mg/ml for THAP in 75/25/0.1% acetonitrile/water/TFA, also each matrix solution contained 10 mg/ml dihydrogen ammonium phosphate), and dried under vacuum. Spots were analyzed using the Applied Biosystems Voyager 4700 Proteomics Analyzer using a random laser pattern for 2000 shots per spot. Each experiment was repeated in full for 4–6 replications, in order to control for variations in sample preparation and MALDI plate sample location. Laser strengths were optimized for each experiment to give total signal strength between 500–10,000 total ion counts (to avoid saturation of the detector with the most abundant ion in each sample). The range of laser strengths is dependent on the individual instrument used, and in these experiments varied according to matrix (CHCA optimal strength was ~2000–3000, DHB and THAP optimal strengths were ~3000–5000).
Peptide 4 was also analyzed at a total peptide concentration of 3.33 μM (giving ~1 pmol total peptide per spot) in order to check if overall peptide concentration had an effect on the ratios of phosphorylated to unphosphorylated peptide observed. These samples were prepared by diluting the ~100 μM samples 1:30 in 0.1% aqueous TFA and spotting as above.
Data analysis and quantitation
To quantitate the ratio of phosphorylated to non-phosphorylated peptides, we developed a simple application that we called the MaldiQuantifier (MQ) to perform the calculations in batch mode. The parameters entered for the MQ analysis were: peptide masses (as calculated using standard peptide calculators); modification distance = 80; linear positive accuracy figure = 8; linear negative accuracy figure = 8; combine peaks range = 22. The MQ is a JavaServer page (JSP) web application running on a Jakarta Tomcat Java application server (JDK 5.0, running on either Windows XP or LINUX). The JSP page uses components of the Illinois Bio-Grid Desktop application as well as components of the ProteomeCommons-IO package for data analysis. The MQ can be accessed on-line at http://illinoisbiogrid.org/MaldiQuant. The source code is available upon request to dangulo@cti.depaul.edu. The ratios were plotted using a script we created for the open-source statistics package R that we named Graphomatic. This script takes the outputs from the MQ and plots the input vs. output ratios as calibration curves. For the details of the script, please see the supporting information.
Results
To create initial calibration curves, we selected seven peptides and their phosphorylated derivatives with diverse sequences (including peptides representing each of the three commonly phosphorylated amino acids: serine, threonine and tyrosine) from commercial sources (New England Peptide and Anaspec, peptides and properties given in Table 1). All of the sequences are derived from natural kinase substrates. The net pIs of the peptides used ranged from 3 to 11 and the molecular weights were representative of most commonly used peptide kinase substrates (between ~2400 and ~1100). Stock solutions were prepared for each and the relative concentrations were verified by HPLC-MS as described in the Experimental section (data shown in the supporting information). Each pair was mixed in various ratios to represent a range of “% phosphopeptide” in the sample relative to the total concentration of unphosphorylated and phosphorylated peptide combined. These peptide mixtures were combined with three different matrices (α-cyano-4-hydroxycinnamic acid, CHCA; 2,5-dihydroxybenzoic acid, DHB; and 2,4,6-trihydroxyacetophenone, THAP).
Table 1.
Peptides used for calibration curve studies
| Sequence | MW (unphos) | MW (phos) | pI | |
|---|---|---|---|---|
| 1 | PK(p)TPKKAKKL | 1138.5 | 1218.5 | 10.5 |
| 2 | ADAQHA(p)TPPKKKRKVEDPKDF | 2406.7 | 2487.7 | 9.5 |
| 3 | MHRQE(p)TVDCLK | 1359.6 | 1439.6 | 7.2 |
| 4 | RRLIEDNE(p)YTARG | 1592.7 | 1672.7 | 6.9 |
| 5 | acFHDD(p)SDEDLLHI | 1497.5 | 1577.5 | 3.8 |
| 6 | TSTEPQ(p)YQPGENL | 1463.5 | 1543.5 | 3.5 |
| 7 | ADE(p)YLIPQQ | 1076.2 | 1156.2 | 3.4 |
Each individual sample was spotted in triplicate on a MALDI target and analyzed in linear positive and linear negative modes. The laser strength was optimized for each peptide prior to analysis in the Applied Biosystems Voyager 4700 MALDI-TOF/TOF instrument “batch” mode (high-throughput). This parameter must be manually determined, since ‘laser strength’ is a somewhat arbitrary and relative value that depends on the age of the laser and the type of instrument used. The total amount of peptide spotted for each sample was ~30 pmol, which is relatively high compared to the ~1–5 pmol typically aimed for in MALDI-TOF experiments. Therefore, the laser strengths needed for each sample were individually determined by adjusting the laser strength in the software until the strength of the signal for the most abundant peptide ion was >10,000 counts. This was to prevent detector saturation by the more abundant peptide in the mixture, which could result in signal ratio artifacts. For the instrument used in this study, samples spotted with CHCA required laser strengths between 2000–2600, while DHB and THAP required laser strengths between 3500–5500 (most likely due to differences in the UV absorbance maxima and extinction coefficients between these chemicals, shown in the supporting information).
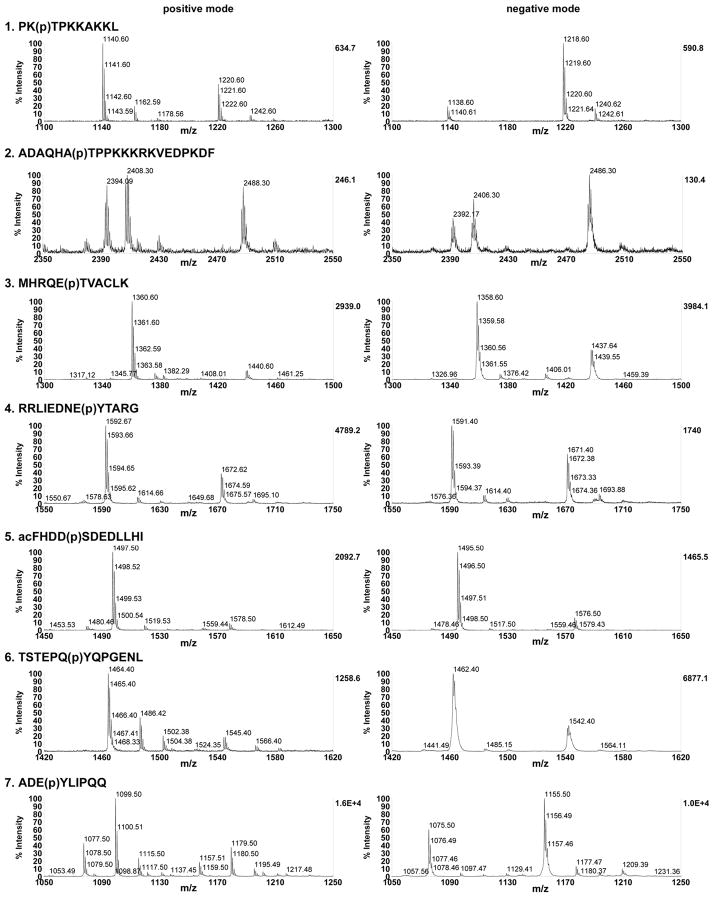
Some examples of phospho/unphosphopeptide mixture spectra are shown in Fig. 1 for each of the peptides at input ratio of ~35%, to demonstrate that peaks were well resolved and averaged spectra from 2000 laser shots resulted in decent to excellent signal to noise. To account for the population of sodium salt adducts potentially representing a significant portion of the observed material, adduct peaks were combined with non-adduct peptide ions when calculating the total signal intensities for unphosphorylated vs. phosphorylated peptides. In these MALDI-TOF experiments, only the singly-charged ions were observed and considered for analysis of signal intensity ratios.
Fig. 1.
Representative spectra for each peptide/phosphopeptide pair at ~35% phosphopeptide input, shown for DHB matrix in linear positive and linear negative modes. Shown zoomed for peak detail, see supporting information for full spectra.
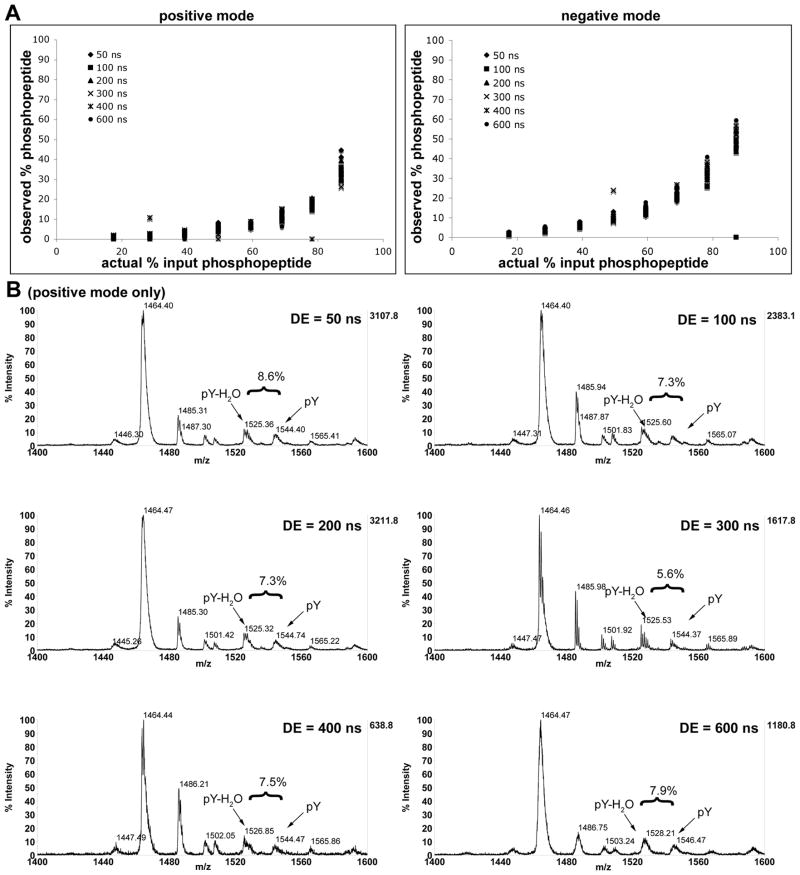
In order to determine if delayed extraction was a factor in relative signal strengths, we analyzed a selection of the peptide ratio standards using various delay times (Fig. 2). While the resolution of both peptides changed over the range of delay times, the relative peak intensities observed for unphosphorylated and phosphorylated peptide in each sample did not significantly change, thus it does not appear that extraction of the ions affects the relative observed ion intensities.
Fig. 2.
Analysis of the effect of delayed extraction times on relative signal intensity for peptide 6 (TSTEPQ(p)YQPGENL). a) data for positive and negative modes plotted for each extraction time; b) Representative spectra for positive mode at phosphopeptide (m/z = 1544) input concentration of 59.4%. While resolution changes with different extraction times, observed relative intensity does not. For additional data in negative mode, see supporting information.
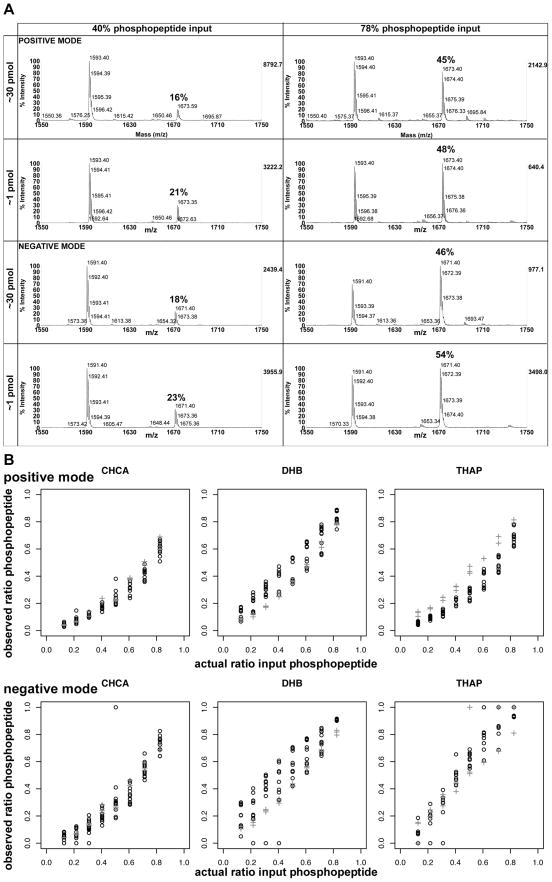
In order to assess the effect of the relatively high concentration of peptide used (~30 pmol/spot), we examined calibration curves for peptide 4 at a dilution of ~1 pmol/spot (more typical for MALDI-TOF analysis of peptides). Representative spectra are shown in Fig. 3a for two different input ratios, comparing ~30 pmol/spot with ~1 pmol/spot. No significant difference was seen in the spectra, nor was any significant deviation seen in ~1 pmol/spot calibration curves relative to the ~30 pmol/spot calibration curves for the three different matrices (Fig. 3b).
Fig. 3.
a) Representative spectra for comparison of analysis at ~30 pmol/spot vs. ~1 pmol/spot for peptide 4 (RRLIEDNE(p)YTARG) at phosphopeptide inputs of 40% and 78% spotted with CHCA matrix. b) Variation in the observed phosphopeptide signals at the different concentrations falls within typical variance of the measurements: 30 pmol = black open circles; 1 pmol = grey hatches.
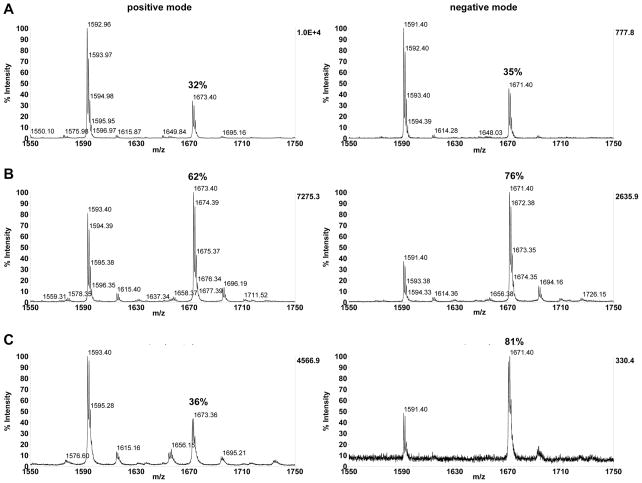
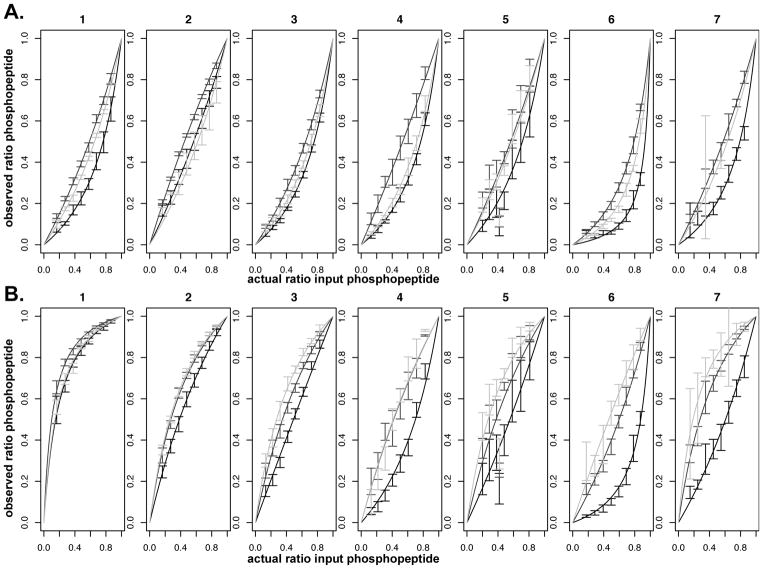
Matrix had a clear effect on the ratios observed. Fig. 4 shows the same solution containing ~75% peptide 4 spotted at 30 pmol with the three different matrices. The observed amount of phosphopeptide can be seen to be drastically different depending on which matrix was used. This can also be seen in the plots of the calibration curves shown in Fig. 5. In general, it appears that pI has a greater effect on the behavior of phospho/unphosphopeptide ratios observed using CHCA matrix than what was seen for DHB and THAP, particularly in negative mode. It also appears that for most peptides examined in this study, THAP provided a more accurate representation of the actual input ratios compared to the other matrices, particularly CHCA which seemed to show results that varied the most from the inputs overall.
Fig. 4.
Representative spectra for peptide 4 (RRLIEDNE(p)YTARG) containing ~65% phosphopeptide (actual 60.7% based on correction for concentrations) analyzed with A) CHCA, B) DHB and C) THAP matrices in linear positive and negative modes. Spectra shown are zoomed in for detail, see supporting information for corresponding 100–10,000 m/z range spectra.
Fig. 5.
Fitted data. Calibration curves for peptide/phosphopeptide signals in the MALDI-TOF mass spectrometer. A: linear positive mode, B: linear negative mode. See Table 1 for sequences of peptides 1–7. Matrices: CHCA = black, DHB = dark grey, THAP = light grey.
For analysis of the data, we used the MQ program described above. To prepare data for the MQ, spectra were processed and extracted as text files that were output using a Data Explorer Visual Basic macro that gave lists of peaks and their corresponding isotope cluster areas. The macro was obtained from Melanie Lin (Applied Biosystems) and modified to include 3000 peaks and list them in order of mass rather than intensity. We compressed all peak list files from an experiment into a single ZIP archive file and then uploaded that file to the MQ using a standard web browser. The MQ searches for pairs of peaks in these spectra that have a difference in mass equivalent to the phosphate group (or other input modification mass). The algorithm calculates the percent phosphorylation by integrating the peaks and calculating the ratios of the area under the curves, outputting the “% phosphorylated signal observed” (where % phosphorylated = [modified peptide cluster area]/[unmodified peptide cluster area + modified peptide cluster area] × 100). The MQ accepts user input for the target mass, mass of the expected modification group (e.g. the phosphate group), accuracy of the measurement of the MS machine (e.g. ~2–5 m/z for linear mode depending on the instrument used), and potential for summing the isotope cluster areas of peaks within a specific mass distance range. For our data, obtained from pure peptides with no other impurity peaks between any water loss peaks (−18), the protonated peptide peak [M+H]+ and the sodium adduct peak [M+Na]+ (+22) the sums of all the corresponding isotope cluster areas were combined in the analysis by entering “22” into the “Combine Peaks Range” parameter. This allowed the analysis to consider all peptide ion species when calculating the relative intensities of the unphosphorylated and the phosphorylated ions in the spectra. Results of the MQ analysis were exported into a comma-delimited file format suitable for use in spreadsheet programs such as Microsoft Excel, or statistics packages such as R.
We used the MQ to create output tables giving the % phosphorylated signal observed for each experiment, using MQ analysis input criteria that took into account the possible presence of sodium ion adducts on both unphosphorylated and phosphorylated ions. For analysis of signal ratios, we created a script for the open-source statistics package R that we named Graphomatic (included in the supporting information). The MQ exported the data in the form of comma separated value files (.csv) that were concatenated into a master table for analysis. The Graphomatic script aids in the management and visualization of data from these MALDI-TOF experiments by relating the known abundance ratios to measured abundance ratios, making graphical representations such as scatterplots or boxplots of calibration curves for different peptides, matrices and modes (pos/neg).
In order to use these data for “calibration” of MALDI detection of peptide-phosphopeptide pairs, we designed a preliminary curve-fitting model similar to Beer’s Law. In this model, A represents the observed area under the peak corresponding to non-phosphorylated peptides, and B is the observed area under the phosphorylated peptide peak. We assumed that there are three dominant experimental factors that determine the absolute sizes of these peaks. First, there is an overall signal strength, which is denoted by S. To some extent, S is determined by the experimenter, who adjusts the laser to get a signal that is strong enough to be easily detected, but not so strong as to saturate the detector. The second factor is the actual input proportion of non-phosphorylated peptide, which is denoted by x. For example, if x= 0.10, ten percent of the peptide input was non-phosphorylated, and B is expected to be about 9 times as large as A. The third factor is a measure of the propensity of each type of peptide to get detected. This factor represents the various peptides’ ionization, reaction, or degradation characteristics in the plasma state, mechanisms for which there are currently no effective predictive models—thus here we treat it as an ‘unknown’ to be empirically determined. These ‘unknown factors’ are summarized in our model as PA (relative detection efficiency for the non-phosphorylated peptide), and PB (relative detection efficiency for the corresponding phosphorylated peptide). It should be noted that it is quite likely that these factors may not be constant for all values of x and/or S. The nature of this relationship is something we must assume in the preliminary model presented here, but is under extensive consideration in our development of this research.
Under these assumptions, the data is modeled by A = xSPA and B = (1−x)SPB. The natural estimate of the proportion of non-phosphorylated peptides is ratio of A to the total peak area A+B.
We briefly note that if PA = PB, the ratio reduces to .
From the calibration data, PB/PA can be estimated via a nonlinear least squares regression or weighted least squares regression and used to determine the amount of phosphopeptide in an unknown sample (for a calibrated peptide sequence). For notational convenience, we let γ denote the true unknown ratio PB/PA, and let γ̂ denote its least squares estimate for the calibration curve.
We incorporated a term to describe replicates where a given sample is measured n times. Here, y1, …, yn are the individual measurements, and ȳ denotes their average. Then, the corresponding x (actual phosphopeptide) can be estimated via the following equation , whose solution is given by . (If γ were exactly 1, x should be estimated by ȳ)
Uncertainty in x̂
We also used our calibration data to generate a rough model for propagating the uncertainty inherent in the estimate of “actual phosphopeptide” measured in a given unknown sample. The uncertainty in the estimated %phosphopeptide for an unknown sample (x̂) determined from the calibration curve, results from variability in both the calibration curve (γ̂) and the actual measurements (ȳ). If we let , the first order approximation of the variability in x̂ is given by:
In the above, y can be estimated by ȳ, γ by γ̂, by [n(n−1)]−1Σ(yi−ȳ)2, and an estimate of the variance in is produced automatically by most nonlinear regression packages. Based on our data and replicate analysis, the %phosphopeptide observed can vary +/− ~10% from the average for a given experiment, thus we believe +/− 10% to be the standard variability of measuring relative peptide amounts by MALDI-TOF MS in linear mode.
Discussion
The results of these experiments highlight the need for multi-point rather than single-point calibrations for tracking phosphorylation of a peptide. The relationships between the signals are generally not linear across a broad concentration ratio range. Notably, while some phosphopeptides are consistently overrepresented in negative mode, others seem to ionize equally well in either mode. There is a very approximate relationship between pI and the extent of overrepresentation in negative mode, where peptides with higher pIs gave larger relative signal ratios in negative than in positive mode (e.g. peptides 1, 2 and 3)—however this trend is not consistent and can’t be related to the entire set of peptides. There is also a clear relationship between the matrix and the observed ratio for different peptides, however the relationship is as yet unpredictable and changes drastically with matrix for some peptides and hardly at all for others. Our primary set of experiments used ~30 pmol total peptide per spot, which is relatively large for MALDI-TOF MS of peptides. However we found that at 1 pmol total peptide per spot, the relative calibration behavior of the unphosphorylated and phosphorylated ions for the peptides analyzed were not significantly different from the data at 30 pmol total peptide per spot—at least not different enough to account for the deviations of observed relative phosphopeptide intensities from actual input peptide in MALDI-TOF MS data.
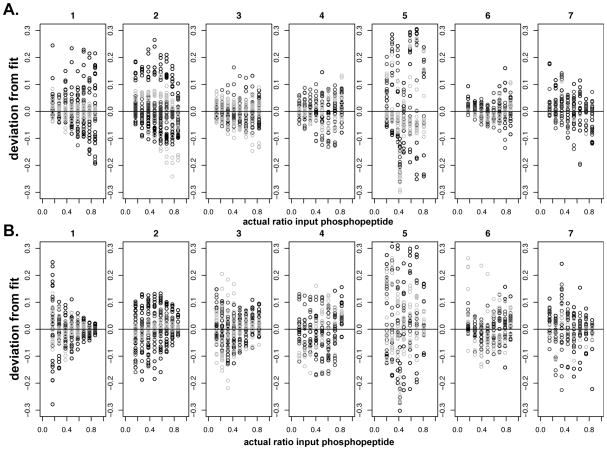
When analyzing the appropriateness of our fitting model using a residuals plot (Fig. 6) it can be seen that the fit is not ideal for all the peptides tested. For example, although many of the curves match the fit in a reasonable way, some systematic and non-systematic discrepancies can be seen for some peptides (e.g. peptide 5). However, this model does allow for preliminary calibration of % phosphorylation curves and provides a starting point from which to develop more complex models in future work, such as those that will take into account possible changes in PA and PB over a range of concentrations and/or additional chemical properties of the peptides and matrices. It also allows for a broad characterization of standard variability in these measurements. Based on the number of replicates we performed, we controlled for sources of potential variation coming from spot-to-spot, solution preparation to solution preparation, and MALDI-TOF MS shot-to-shot variability. In general, we conclude that by considering all those sources of error and variation, the precision available in this kind of experiment averages out to be within ~5–10% with respect to the % phosphopeptide observed in a given experiment or “uncertainty in x̂” as described by our mathematical model. We believe this to be a reasonable level of uncertainty over many replicates with regards to typically accepted quantification data for mass spectrometers in general, and MALDI-TOF MS in particular.
Fig 6.
Residual plot. Appropriateness of fit for each calibrated peptide. A: linear positive mode, B: linear negative mode. See Table 1 for sequences of peptides 1–7. Matrices: CHCA = black, DHB = dark grey, THAP = light grey.
Another interesting observation that comes out of these multi-point calibration plots from both polarity modes is that the degree of under-representation of the ‘more negatively charged’ phosphopeptide in positive mode is not always conversely demonstrated as equal over-representation in negative mode. Along with the variability in how much the phosphopeptide is over-represented in negative mode, this suggests that unknown, non-linear factors are contributing to the apparent ‘suppression’ of one peptide by the other. However from the results, it is clear that this suppression is reproducible for these peptides, and can be calibrated as long as the sample conditions (matrix, laser strength) are held constant. Using this method, it should be possible to calibrate any given peptide to quantify the % phosphorylation and track the progression of kinase reactions with confidence by using the MALDI alone. The reproducibility of these curves also suggests that with further experiments and careful modeling, it may eventually be possible to better understand what physiochemical factors are influencing the relative ionization behavior and generate predictive methods for characterizing these complex processes.
Supplementary Material
Acknowledgments
This work was supported by NIH NHGRI Roadmap MLSI grant R01 HG003864. L.L.P. gratefully acknowledges the NIH for Ruth L. Kirschstein Individual Postdoctoral Fellowship F32 CA117672A. S.J.K. was a Scholar of the Leukemia and Lymphoma Society.
References
- 1.Dreisewerd K. The desorption process in MALDI. Chemical Reviews. 2003;103(2):395–425. doi: 10.1021/cr010375i. [DOI] [PubMed] [Google Scholar]
- 2.Sze ET, Chan TW, Wang G. Formulation of matrix solutions for use in matrix-assisted laser desorption/ionization of biomolecules. J Am Soc Mass Spectrom. 1998;9(2):166–74. doi: 10.1016/S1044-0305(97)00237-7. [DOI] [PubMed] [Google Scholar]
- 3.Flory MR, Griffin TJ, Martin D, Aebersold R. Advances in quantitative proteomics using stable isotope tags. Trends Biotechnol. 2002;20(12 Suppl):S23–9. doi: 10.1016/s1471-1931(02)00203-3. [DOI] [PubMed] [Google Scholar]
- 4.Smolka MB, Zhou H, Purkayastha S, Aebersold R. Optimization of the isotope-coded affinity tag-labeling procedure for quantitative proteome analysis. Anal Biochem. 2001;297(1):25–31. doi: 10.1006/abio.2001.5318. [DOI] [PubMed] [Google Scholar]
- 5.Tao WA, Aebersold R. Advances in quantitative proteomics via stable isotope tagging and mass spectrometry. Curr Opin Biotechnol. 2003;14(1):110–8. doi: 10.1016/s0958-1669(02)00018-6. [DOI] [PubMed] [Google Scholar]
- 6.Turecek F. Mass spectrometry in coupling with affinity capture-release and isotope-coded affinity tags for quantitative protein analysis. J Mass Spectrom. 2002;37(1):1–14. doi: 10.1002/jms.275. [DOI] [PubMed] [Google Scholar]
- 7.Zhang R, Sioma CS, Wang S, Regnier FE. Fractionation of isotopically labeled peptides in quantitative proteomics. Anal Chem. 2001;73(21):5142–9. doi: 10.1021/ac010583a. [DOI] [PubMed] [Google Scholar]
- 8.Steen H, Jebanathirajah JA, Rush J, Morrice N, Kirschner MW. Phosphorylation analysis by mass spectrometry - Myths, facts, and the consequences for qualitative and quantitative measurements. Molecular & Cellular Proteomics. 2006;5(1):172–181. doi: 10.1074/mcp.M500135-MCP200. [DOI] [PubMed] [Google Scholar]
- 9.Janek K, Wenschuh H, Bienert M, Krause E. Phosphopeptide analysis by positive and negative ion matrix-assisted laser desorption/ionization mass spectrometry. Rapid Communications In Mass Spectrometry. 2001;15(17):1593–1599. doi: 10.1002/rcm.417. [DOI] [PubMed] [Google Scholar]
- 10.Asara JM, Allison J. Enhanced detection of phosphopeptides in matrix-assisted laser desorption/ionization mass spectrometry using ammonium salts. J Am Soc Mass Spectrom. 1999;10(1):35–44. doi: 10.1016/S1044-0305(98)00129-9. [DOI] [PubMed] [Google Scholar]
- 11.Kinumi T, Niki E, Shigeri Y, Matsumoto H. Affinity-tagged phosphorylation assay by matrix-assisted laser desorption/ionization time-of-flight mass spectrometry (ATPA-MALDI): Application to calcium/calmodulin-dependent protein kinase. Journal Of Biochemistry. 2005;138(6):791–796. doi: 10.1093/jb/mvi178. [DOI] [PubMed] [Google Scholar]
- 12.Ma YL, Lu Y, Zeng HQ, Ron D, Mo WJ, Neubert TA. Characterization of phosphopeptides from protein digests using matrix-assisted laser desorption/ionization time-of-flight mass spectrometry and nanoelectrospray quadrupole time-of-flight mass spectrometry. Rapid Communications In Mass Spectrometry. 2001;15(18):1693–1700. doi: 10.1002/rcm.426. [DOI] [PubMed] [Google Scholar]
- 13.Matsumoto H, Kahn ES, Komori N. Nonradioactive phosphopeptide assay by matrix-assisted laser desorption ionization time-of-flight mass spectrometry: Application to calcium/calmodulin-dependent protein kinase II. Analytical Biochemistry. 1998;260(2):188–194. doi: 10.1006/abio.1998.2691. [DOI] [PubMed] [Google Scholar]
- 14.Craig AG, Hoeger CA, Miller CL, Goedken T, Rivier JE, Fischer WH. Monitoring Protein-Kinase And Phosphatase Reactions With Matrix-Assisted Laser-Desorption Ionization Mass-Spectrometry And Capillary Zone Electrophoresis -Comparison Of The Detection Efficiency Of Peptide-Phosphopeptide Mixtures. Biological Mass Spectrometry. 1994;23(8):519–528. doi: 10.1002/bms.1200230810. [DOI] [PubMed] [Google Scholar]
Associated Data
This section collects any data citations, data availability statements, or supplementary materials included in this article.


