Abstract
There are two subclasses of alpha cell in the mammalian retina, which are morphologically identical in plain view but have opposite responses to a luminance change: one is ON center and the other is OFF center. Recent studies have shown that the neural circuitries, which underlie light responses in such ON- and OFF-ganglion cell pairs, are not mirror symmetric with respect to the ON and OFF pathways (Pang et al., 2003; Zaghloul et al., 2003; Murphy & Rieke, 2006). This study examines alpha-cell homologues in the mouse retina and elucidates the synaptic mechanisms that generate their light responses. Morphological analysis of recorded cells revealed three subclasses that were essentially identical in plan view but had distinct vertical stratification levels. We refer to these cells as the sustained ON (ON-S), sustained OFF (OFF-S), and transient OFF (OFF-T) cells (Murphy & Rieke, 2006; Margolis & Detwiler, 2007). Both ON-S and OFF-S cells were largely driven through the ON pathway via changes in excitatory and inhibitory inputs, respectively. Light responses of OFF-T cells were driven by transient changes in excitatory and inhibitory inputs. Light responses of OFF-S cells were also measured in connexin 36 knockout mice in order to dissect glycinergic input arising from AII amacrine cells. At photopic/mesopic intensities, peak glycinergic input to OFF-S cells in the connexin 36 knockout mouse was reduced by ~85% compared to OFF-S cells in the wild-type retina. This is consistent with the idea that AII cells receive their input from ON-cone bipolar cells through gap junctions and in turn provide glycinergic inhibition to OFF-S cells.
Keywords: Alpha ganglion cell, A-type ganglion cell, AII amacrine cell, connexin36
Introduction
The major functional subdivision of ganglion cells in the mammalian retina is into ON- and OFF-center ganglion cells. ON-center cells are depolarized by illumination of their receptive field center (RFC), while OFF-center cells are depolarized by decreased illumination of their RFC. It is commonly assumed that ON-center ganglion cells receive excitatory input from ON-cone bipolar cells, while OFF-ganglion cells are excited by OFF-cone bipolar cells (Werblin & Dowling, 1969). This ON/OFF dichotomy is the result of the expression of two different types of glutamate receptors (GluRs) at the cone-to-bipolar cell synapses: ON-cone bipolar cells express the sign-inverting metabotropic mGluR6 receptors at their invaginating contacts with cone pedicles (Slaughter & Miller, 1985; Nomura et al., 1994), while OFF-cone bipolar cells express ionotropic AMPA/kainate GluRs at their flat contacts with the cone pedicle base (DeVries, 2000). Along with the vertical excitatory pathways from cones to bipolar cells to ganglion cells, there are two stages of lateral inhibition. Horizontal cells provide feedback inhibition onto cone pedicles and GABAergic feed-forward inhibition onto bipolar cell dendrites (Werblin & Dowling, 1969; Kamermans et al., 2001; Hirasawa & Kaneko, 2003), and amacrine cells can feed back onto bipolar cells axon terminals and feed forward onto ganglion cell dendrites (Taylor, 1999; Flores-Herr et al., 2001).
The receptive field surround of ganglion cells has commonly been attributed to such inhibitory inputs from horizontal and amacrine cells (Werblin & Dowling, 1969; Davenport et al., 2008; Schubert et al., 2008). However, early work in the mudpuppy retina (Wunk & Werblin, 1979; Belgum et al., 1982) showed that inhibitory inputs also shape the center receptive field of ganglion cells. ON-center cells received a tonic inhibitory input in darkness that was suppressed by illumination of the RFC. Conversely, in OFF-center cells, illumination of the RFC triggered sustained inhibition, which was abolished in darkness. McGuire et al. (1986) proposed that the center response might be generated by a “push–pull” mechanism. That is, when illumination increases, ON-center ganglion cells receive excitation from ON-cone bipolar cells and disinhibition from OFF-cone bipolar cells, while OFF-center ganglion cells receive inhibition from ON-cone bipolar cells and reduced excitation from OFF-cone bipolar cells. This push–pull hypothesis in its original form postulated direct excitation and inhibition from bipolar cells onto ganglion cells; however, there is little evidence for inhibitory bipolar cells (Kao et al., 2004).
A more realistic push–pull model invokes amacrine cells as the inhibitory partners in the cross talk between the ON and the OFF channels. The mammalian retina contains GABAergic and glycinergic amacrine cells. GABAergic amacrine cells are usually wide-field cells with dendritic fields narrowly stratified in the inner plexiform layer (IPL; MacNeil et al., 1999). Hence, they are unlikely to mediate crossover inhibition between the ON and the OFF pathways. In contrast, glycinergic amacrine cells are small-field cells having dendrites that are more vertically oriented within the IPL, which makes them well suited for the postulated crossover inhibition (Menger et al., 1998). In a push–pull model involving amacrine cells, ON-ganglion cells will receive excitatory input from ON-cone bipolar cells and inhibitory input from glycinergic amacrine cells driven by OFF-cone bipolar cells. Conversely, OFF-ganglion cells will receive excitatory input from OFF-cone bipolar cells and inhibitory input from glycinergic amacrine cells driven by ON-cone bipolar cells.
Previous attempts to demonstrate a push–pull mechanism involving glycinergic inhibition were complicated by interference from the rod pathway (Famiglietti & Kolb, 1975; Kolb & Famiglietti, 1976). Rod bipolar (RB) cells are depolarized by light and, in turn, depolarize AII amacrine cells. The AII cells depolarize ON-cone bipolar cells through electrical synapses and hyperpolarize OFF-cone bipolar cells through conventional glycinergic synapses. In addition, AII cells often provide direct inhibitory input onto OFF-ganglion cells (Kolb, 1979; Strettoi et al., 1992; Chun et al., 1993; Kolb & Nelson, 1993). Since rods continue to operate at mesopic light intensities, selective dissection of cone circuitries is difficult. Furthermore, since electrical synapses between ON-cone bipolar cells and AII amacrine cells are bidirectional, AII cells can potentially inhibit the OFF pathway even at photopic intensities (Trexler et al., 2001; Veruki & Hartveit, 2002; Pang et al., 2007).
Most recently, a series of papers have provided evidence for crossover inhibition: O’Brien et al. (2003) showed that a light stimulus of the nonpreferred contrast triggered glycinergic inhibition in cat alpha ganglion cells. Pang et al. (2003, 2004) examined the relative contributions of bipolar and amacrine cells to the light responses of mouse ganglion cells. Murphy and Rieke (2006) showed that the amplitude, timing, and integration of excitatory and inhibitory inputs differed dramatically between ON and OFF cells. Margolis and Detwiler (2007) described different synaptic mechanisms generating maintained activity to ON- and OFF-ganglion cells. Murphy and Rieke (2008) and Manookin et al. (2008) showed direct inhibitory input from AII amacrine cells onto OFF A-type ganglion cells at scotopic and photopic light conditions, respectively.
The aim of the current study was to examine the possible role of push–pull synaptic inputs in generating light responses in the ON and OFF alpha-cell homologues in the mouse retina.
Materials and methods
Research animals
Experiments were performed on adult C57BL/6J and con-nexin36−/− mice of either sex. Connexin36−/− mice were kindly provided by Prof. Klaus Willecke (The University of Bonn) and Prof. Reto Weiler (The University of Oldenburg). Genetic modification of the connexin36−/− mice has been published previously (Güldenagel et al., 2001). Connexin36−/− mice were generated using an embryonic stem cell line from Sv129P2/OlaHSD. The mice were then crossed back multiple times using C57BL/6NCrl. All procedures were approved by the local animal care committee and were in accordance with the law for animal experiments issued by the German government (Tierschutzgesetz).
Extracellular and patch clamp recording
The methods for patch clamp recording of the visually evoked currents in retinal ganglion cells have been described in detail previously (Taylor & Vaney, 2002; van Wyk et al., 2006). Mice were dark adapted for 1 h, anesthetized with isoflurane (CuraMED Pharma, Karlsruhe, Germany), and decapitated. The eyes were removed under dim red illumination, and the retinas were isolated. A piece of retina was placed photoreceptor side down in a recording chamber and immobilized by fine nylon fibers strung across a C-shaped piece of platinum. The recording chamber was perfused with bicarbonate-buffered Ames’ medium (Sigma, Hamburg, Germany; pH 7.4). Pre- and postsynaptic pathways were manipulated by adding L-AP4 (20 μM; BioTrend, Cologne, Germany) or strychnine (4 μM; Sigma) to the bath solution during recording. The temperature was maintained at 34–36°C using a temperature controller (Quest Scientific, Vancouver, Canada). Ganglion cell somas were visualized for recording using infrared differential interference contrast optics.
Extracellular and patch electrodes were pulled from borosilicate glass to a final resistance of 5–8 MΩ. The extracellular electrodes were filled with bicarbonate-buffered Ames’ medium, while the patch electrodes contained the following: 125 mM Cs-gluconate, 1 mM CaCl2, 4 mM Na-ATP, 0.4 mM Na-GTP, 10 mM EGTA, 4.6 mM MgSO4, 10 mM Na-HEPES, and 5 mM Br-QX314. The pH was adjusted to 7.3 using CsOH. Cesium was used in place of potassium to block voltage-gated potassium currents and thereby improve the quality of the voltage clamp at positive potentials. The QX 314 was included to block voltage-gated sodium channels and abolished all spiking activity within 1–2 min of establishing the whole-cell configuration. Sixteen millivolts was subtracted from all voltages to correct for the disappearance of the liquid junction potential upon establishing the whole-cell recording. Series resistance compensation was not activated during the recordings but was corrected for offline (see below). The chloride reversal potential, ECl, was calculated to be ~−68 mV, assuming that Br− has a 1.5-fold higher permeability than Cl− through the inhibitory chloride channels (Bormann et al., 1987).
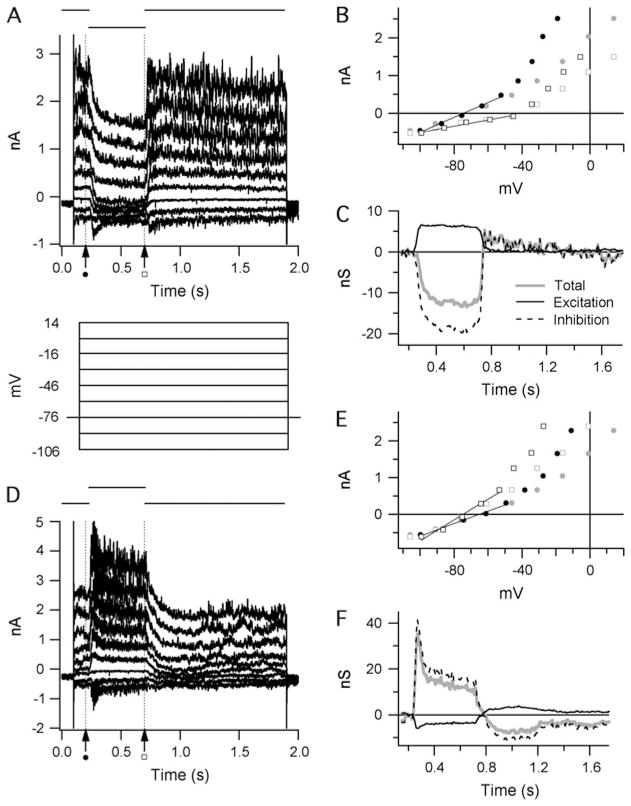
The conductance analysis methods have been described previously (Borg-Graham, 2001; Taylor & Vaney, 2002; van Wyk et al., 2006). Cells were held at −76 mV. Light responses were recorded during voltage steps from −106 to +14 mV in 15-mV increments (Fig. 1A and 1D). Current–voltage (IV) relations of the total membrane current were measured at 10-ms intervals over a 1.6-s interval commencing at 0.1 s prior to the start of the light stimulus. At each time point, the total membrane conductance was calculated as the slope of the IV relation (Fig. 1B and 1E, solid lines). The linear regression was restricted to voltages less than ~−45 mV as the IV relations were linear over this region. At more positive potentials, marked outward rectification was observed, presumably due to incomplete suppression of voltage-gated potassium currents activated in this range. The light-evoked conductance was calculated as the difference between the slope of the IV relation at each time point and the slope measured at 0.2 s, just prior to the onset of the light stimulus (Fig. 1A and 1D, dashed vertical line, and solid circles in Fig. 1B and 1E). The changes in the linear component of the IV relations, observed during light stimulation, were assumed to result entirely from the activation of linear excitatory and inhibitory synaptic conductances with reversal potentials at 0 and −68 mV, respectively. The time course of these two components is illustrated in Fig. 1C and 1F.
Fig. 1.
Calculating light-evoked changes in the synaptic conductance of A-type ganglion cells: (A and D) Current traces recorded from an OFF-S ganglion cell. A step change in light intensity of either negative contrast (A) or positive contrast (B) was presented over the receptive field center for 500 ms as indicated above the traces. Just prior to the light stimulus, the holding potential was stepped to a range of values, as shown below the current traces in panel (A). (B and E) Example IV graphs from the traces in (A) and (D) before (gray) and after (black) series resistance compensation. The positions at which example IV measurements were taken are indicated by the broken vertical lines in (A) and (D). Total membrane conductance was calculated by linear regression at negative holding potentials (fitted lines, B and E) to obviate nonlinearities associated with significant outward rectification at positive potentials. (C and F) Stimulus-evoked changes in synaptic conductance calculated from the traces in (A) and (D). The total membrane conductance (gray lines) is the sum of the calculated excitatory (solid black lines) and inhibitory (broken black lines) components.
In each cell, the series resistance was measured at the start of each voltage pulse series from the amplitude of the capacitive current transient during the −15-mV hyperpolarizing voltage step. The peak capacitive current at the onset of the voltage step was measured from the amplitude of an exponential fitted to the decay of the capacitive current. Series resistance averaged 15 ± 6 MΩ (n = 30). The membrane potential was corrected for the series resistance errors before fitting the IV relations, as described above. The effects of the series resistance corrections are evident as a compression of the data points along the voltage axis that becomes more marked as the conductance increases at positive potentials (Fig. 1B and 1C, compare gray and black symbols). Note that the errors are relatively smaller over the linear region where the IV relations were fitted to measure the membrane conductance.
The retinal preparation remained light responsive for several hours after isolation. Light stimuli were generated on a computer monitor with a refresh rate of 85 Hz using only the green gun of the cathode ray tube. The stimuli were projected through the microscope condenser and focused onto the photoreceptor outer segments. The background light intensity (LBG) corresponded to 9.3 cd/m2 in photopic/mesopic experiments and 0.003 cd/m2 in sco-topic experiments. The stimulus intensity (LSTIM) was adjusted to either +80 or −80% contrast, where percentage stimulus contrast is defined as C = 100 ×(LSTIM − LBG)/LBG.
Intracellular labeling and immunocytochemistry
Ganglion cells were labeled by adding 4 mM Alexa Fluor 568 hydrazide (Invitrogen, Karlsruhe, Germany) to the intracellular solution during patch clamp experiments. After recording, the retina was fixed for 12–15 min with 4% paraformaldehyde in 0.1 M phosphate buffer (PB). The fixed tissue was incubated overnight at room temperature in a 1:500 anti-choline acetyltransferase antibody solution (Chemicon, Billerica, MA, USA) containing 1% Triton X-100 and 2% bovine serum albumin in PB. The tissue was subsequently washed for 30 min in PB and incubated for 2 h in 1:400 Alexa 488–conjugated secondary antibody (Invitrogen).
Confocal photomicrographs were taken with a Zeiss LSM 5 Pascal confocal microscope using a 40× oil immersion objective. Image contrast was adjusted using ImageJ (Abramoff et al., 2004).
Results
Morphology and stratification of physiologically identified A-type cells
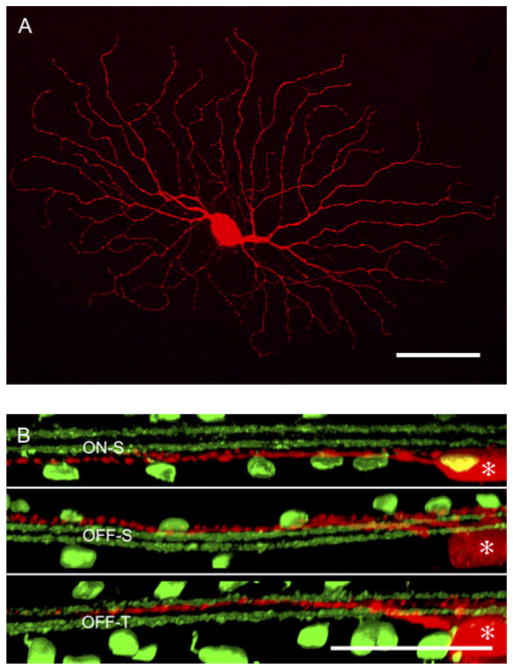
Cells with the largest somata (>20 μm diameter) were targeted for recording. As described below, the physiological responses of these cells fell into three distinct categories: a sustained ON cell (ON-S), a sustained OFF cell (OFF-S), and a transient OFF cell (OFF-T; Pang et al., 2003; Murphy & Rieke, 2006; Margolis & Detwiler, 2007). A subset of cells (three cells of each physiological type) was filled with fluorescent dye during the recording period to reveal the morphology. The cells had the classic alpha-cell morphology (Fig. 2A), defined by a large somata (>20 μm diameter) with radiate dendrites and a dendritic field diameter of ~300 μm (Peichl et al., 1987). Co-labeling of the starburst amacrine cells revealed three levels of dendritic stratification (Fig. 2B). The dendrites of ON-S and OFF-S ganglion cells stratified in the inner and outer borders of the IPL, respectively, on either side of the starburst amacrine cell dendrites, while the dendrites of the OFF-T cell stratified close to the center of the IPL, just below the dendrites of the OFF starburst amacrine cells (Pang et al., 2003; Margolis & Detwiler, 2007). Apart from these characteristic differences in the level of stratification, the dendritic morphologies of the ON-S, OFF-S, and OFF-T cells were indistinguishable.
Fig. 2.
The dendritic morphologies of A-type ganglion cells: (A) A flat view of a physiologically identified OFF-S ganglion cell reconstructed from serial confocal micrographs. (B) Optical cross sections of ON-S, OFF-S, and OFF-S dendrites (red; * indicates the cell bodies). Co-labeling of starburst amacrine cells with antibodies against choline acetyltransferase reveals the levels of dendritic stratification (green). The dendrites of the ON-S and OFF-S cells stratify at the inner and outer borders of the IPL, while the dendrites of the OFF-T cell stratify closer to the center of the IPL. Aside from differences in the level of dendritic stratification, ON-S, OFF-S, and OFF-T cells could not be discriminated on the basis of their dendritic morphology. Scale bar = 50 μm.
Center responses of ganglion cells
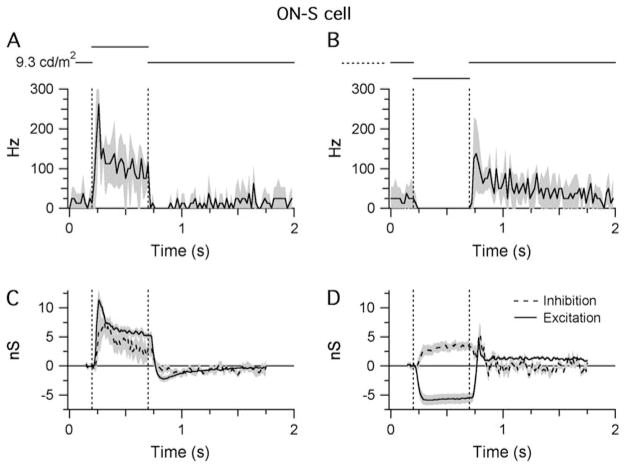
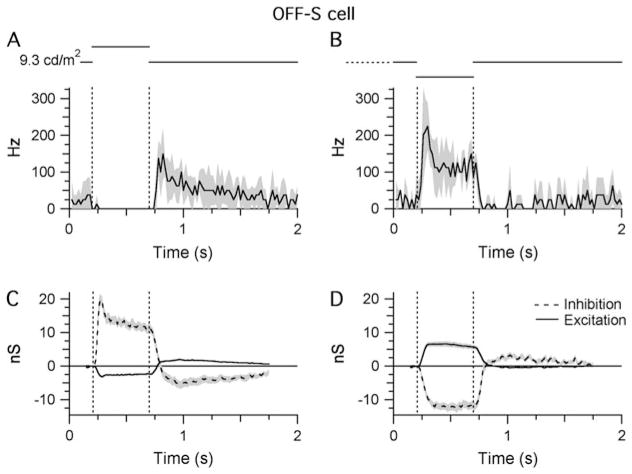
Spike time histograms (STHs) were generated from extracellular responses elicited by bright and dark stimuli projected onto the RFC (300 μm diameter). The STHs recorded from ON-S and OFF-S cells were mirror symmetric with respect to stimulus contrast (Figs. 3A and 3B and 4A and 4B).
Fig. 3.
Light responses of ON-S cells. Shaded areas indicate ±1 S.E.M.: (A and B) STHs generated from extracellular responses recorded during RFC stimulation with either positive (A) or negative (B) contrast (±80%; background = 9.3 cd/m2 on the retinal surface). All traces show the average data collected from four cells. For each cell, the synaptic conductances were calculated from five stimulus presentations (see Materials and methods section). The bin width of the STHs is 20 ms. (C and D) Light-evoked changes in inhibitory and excitatory synaptic inputs in response to the same stimuli presented in (A) and (B). Responses were averaged from seven cells.
Fig. 4.
Light responses of OFF-S cells. Shaded areas indicate ±1 S.E.M. All traces show averaged data from 11 cells: (A and B) STHs generated from extracellular responses recorded during RFC stimulation with either positive (A) or negative (B) contrast (±80%; background = 9.3 cd/m2 on the retinal surface). The bin width of the STHs is 20 ms. (C and D) Light-evoked changes in inhibitory and excitatory synaptic inputs in response to the same stimuli presented in (A) and (B).
Both cell types displayed tonic (~20 Hz) spike discharge under maintained background illumination. The spike rates increased sharply in response to a visual stimulus of the preferred contrast [10–90% in 25 ± 11 ms (n = 4) for OFF cells and in 36 ± 12 ms (n = 4) for ON cells] and remained elevated for the duration of the 500-ms stimulus (Figs. 3A and 4B). In both types, a stimulus of the opposite contrast completely suppressed background activity and generated a rebound increase in spike frequency upon return to background illumination (Figs. 3B and 4A).
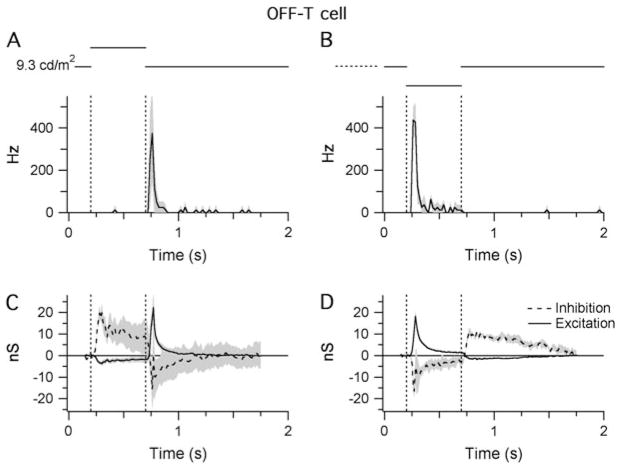
The responses of OFF-T cells were qualitatively different from the sustained cells (Fig. 5A and 5B). During background illumination, OFF-T cells lacked the tonic discharge seen in the sustained cells and responded with a transient (histogram width at half peak ~40 ms), high frequency (~400 Hz) burst of action potentials upon stimulation with a dark spot (Fig. 5B) or when a light spot was turned OFF (Fig. 5A; Pang et al., 2003).
Fig. 5.
Light responses of OFF-T cells. Shaded areas indicate ±1 S.E.M.: (A and B) STHs generated from extracellular responses recorded during RFC stimulation with either positive (A) or negative (B) contrast (±80%; background =9.3 cd/m2 on the retinal surface). The bin width of the STHs is 20 ms. Traces show the averaged data from four cells. (C and D) Light-evoked changes in inhibitory and excitatory synaptic inputs in response to the same stimuli presented in (A) and (B). Traces are averaged from three cells.
Synaptic input to ganglion cells
Whole-cell patch clamp recording was used to record the light-evoked changes in synaptic input onto ON-S, OFF-S, and OFF-T ganglion cells. For ON-S cells, illumination of the RFC increased the excitatory conductance to a peak of 11.3 ± 4.4 nS, which then declined to a steady value of 6.3 ±1.4 nS after 0.2 s (n =4; Fig. 3C). This rise in excitatory input mirrored the spiking behavior of the cell (Fig. 3A). Conversely, a decrease in the illumination of the RFC produced a 5.5 ± 2.4–nS sustained decrease in the excitatory conductance (Fig. 3D), again consistent with the spiking behavior (Fig. 3B). The decrease in excitatory input observed in response to the dark stimulus shows that ON-S cells receive substantial tonic excitatory input under constant background illumination (Margolis & Detwiler, 2007). In contrast to the OFF-S cells (see below), the inhibitory input to ON-S cells was increased during both increases and decreases in illumination, consistent with the notion that input to the ON-S cells is dominated by the ON pathway. Overall, the results suggest that the spiking responses of ON-S cells are dominated by excitatory input driven through the ON pathway.
For OFF-S cells, illumination of the RFC (Fig. 4C) produced a 19.6 ± 3.8–nS peak increase in the inhibitory conductance and a concomitant but relatively small decrease in the excitatory conductance (−2.9 ± 0.7 nS; Fig. 4C, n = 11). Both these changes were consistent with the suppression of spiking (Fig. 4A). Conversely, decreased illumination of the RFC increased the excitatory conductance (6.5 ± 2.5 nS) and produced a roughly twofold larger decrease in the inhibitory conductance (11.7 ± 3.5 nS; Fig. 4D). This decrease in inhibitory input indicates that the OFF-S cells receive a substantial tonic inhibitory input. Thus, similar to the ON-S cells, the light-evoked conductance changes in OFF-S cells during RFC illumination are dominated by the ON pathway, albeit via inhibitory rather than excitatory inputs. The opposite polarity of the excitatory inputs during increases and decreases in illumination is consistent with direct input from OFF-bipolar cells. In summary, the light responses in ON-S and OFF-S cells appear to be mediated largely through the ON pathway through changes in postsynaptic excitation and inhibition, respectively.
As might be expected from the spiking behavior, the synaptic inputs to the OFF-T cells were qualitatively different from the sustained cells. The transient spiking is mirrored by the relatively rapid adaptation of the synaptic inputs during the 0.5-s stimuli (Fig. 5). During OFF transitions in RFC illumination, the OFF-T cells receive a transient increase in excitatory inputs (22.2 ± 14.0 at the termination of light flash and 18.2 ± 5.9 at onset of dark flash; Fig. 5C and 5D), which is almost equal to a concomitant decrease in inhibition (−15.7 ± 9.3 at the termination of the light flash and −16.5 ± 6.5 at the onset of the dark flash). Thus, like the OFF-S cells, the OFF-T cells receive a substantial tonic inhibitory input.
During ON transitions in RFC illumination, OFF-T cells received a large increase in inhibitory input (~15 nS) that was much slower to adapt than the inhibition seen during OFF transitions. Similarly, there was suppression of excitatory input to the cell that was much smaller (~3 nS) but more sustained than the increase during the OFF transition. It is interesting to note that the magnitude of the tonic excitatory input to the OFF-T cells, as evident from the suppression of excitation during increased illumination, is very similar to that seen in the OFF-S cells (Figs. 4C and 5C).
In summary, while the ON-S and OFF-S cells appeared to be dominated by inputs from the ON pathway, the OFF-T cells were clearly different, having strong synaptic drive from both the ON and the OFF pathways. All subsequent experiments focused only on the receptive field circuitries of ON-S and OFF-S cells.
The surround of ON-S and OFF-S cells
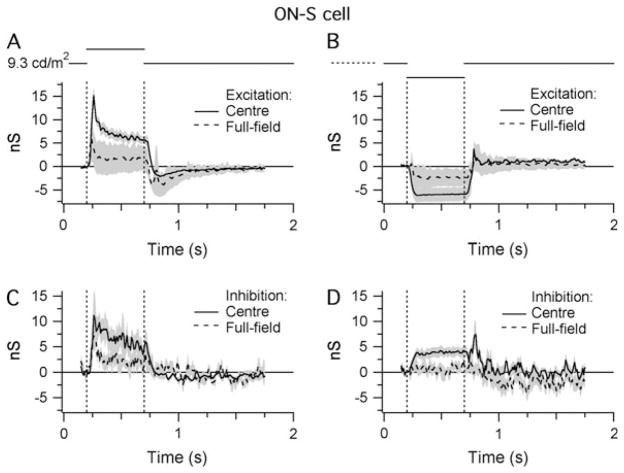
We examined the synaptic mechanisms generating receptive field surrounds in ON-S and OFF-S cells by comparing the light-evoked conductances produced by centered spots of 300 μm diameter and full-field stimuli (Figs. 6 and 7). For ON-S cells, full-field illumination reduced the excitatory and inhibitory center responses by 78 and 67%, respectively, compared to the center stimulus (recorded at 0.2 s after stimulus onset; Fig. 6A and 6C). The rebound decrease in excitation at the end of the stimulus was larger than that for center stimulation. During decreases in illumination, full-field stimulation reduced the excitatory conductance by 61% and completely suppressed the inhibitory input (Fig. 6B and 6D).
Fig. 6.
The antagonistic surround of ON-S cells. Shaded areas indicate ±1 S.E.M. Traces show the averaged data from four cells: (A and B) Light-evoked changes in the level of excitatory synaptic input to ON-S cells in response to centered (300 μm diameter) and full-field stimuli of either positive (A) or negative (B) contrast. (C and D) Light-evoked changes in the level of inhibitory synaptic input in response to the same stimuli used in (A) and (B).
Fig. 7.
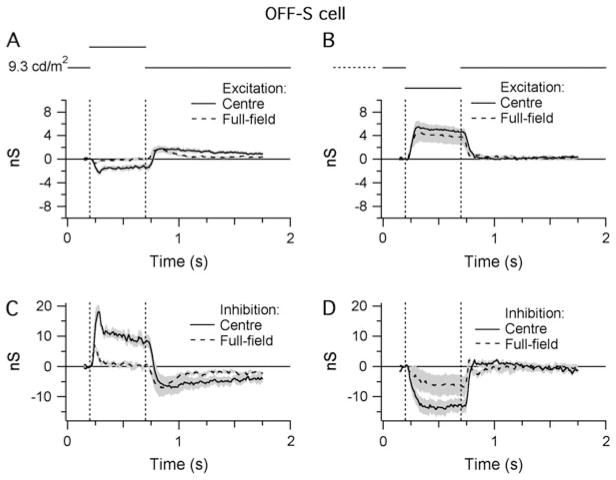
The antagonistic surround of OFF-S cells. Shaded areas indicate ±1 S.E.M. Traces show the averaged data from four cells: (A and B) Light-evoked changes in the level of excitatory synaptic input to OFF-S cells in response to centered (300 μm diameter) and full-field stimuli of either positive (A) or negative (B) contrast. (C and D) Light-evoked changes in the level of inhibitory synaptic input in response to the same stimuli used in (A) and (B).
For OFF-S cells, at 0.2 s after stimulus onset, full-field illumination reduced the excitatory and inhibitory center responses by 96 and 91%, respectively, compared to the center stimulus (Fig. 7A and 7C). During decreases in illumination, full-field stimulation had very little effect on the excitatory conductance (22% reduction) but suppressed the inhibitory input by 63% (Fig. 7B and 7D). The magnitude of the suppression of the inhibitory inputs to the OFF-S cells was quantitatively similar to that observed for excitation in the ON-S cells (compare Fig. 7C and 7D with Fig. 6A and 6B). For the OFF-S cell, inhibition was suppressed by 91 and 63% at positive and negative contrast, respectively, and for the ON-S cell, excitation was suppressed by 78 and 61% at positive and negative contrast, respectively.
Pharmacological dissection of the inhibitory input onto OFF-S ganglion cells
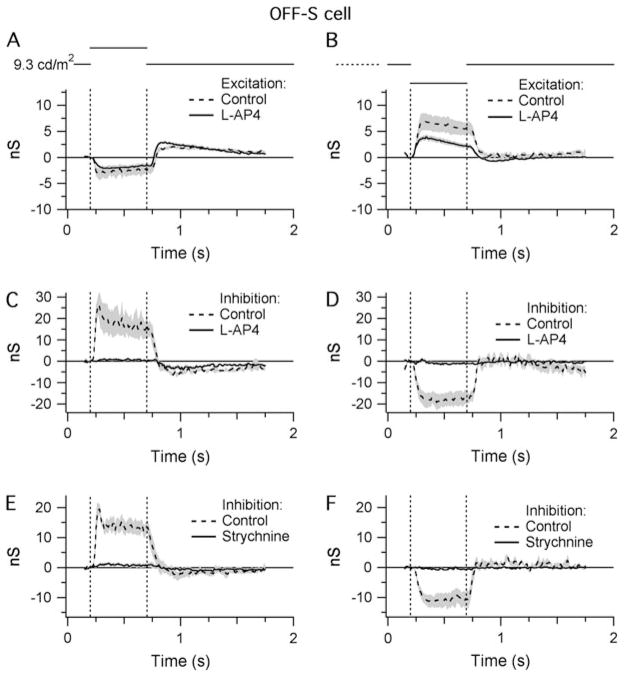
The preceding results indicate that the inhibitory inputs to OFF-S cells are mediated through the ON pathway, presumably via the activity of ON-cone bipolar cells. If so, the mGluR6 agonist L-AP4 should block the inhibitory input to the OFF-S cells while the excitatory inputs from the OFF-cone bipolar cells should be unaffected. In line with these predictions, L-AP4 completely abolished inhibitory input to the OFF-S cells produced by RFC stimulation (Fig. 8C and 8D; Margolis & Detwiler, 2007). However, contrary to expectation, L-AP4 also suppressed excitatory conductance during RFC stimulation by 14 and 48% during positive and negative contrast stimuli, respectively (Fig. 8A and 8B).
Fig. 8.
A pharmacological analysis of the synaptic input to OFF-S cells. Shaded areas indicate ±1 S.E.M.: (A and B) Light-evoked changes in the level of excitatory synaptic input in response to RFC stimulation with either positive (A) or negative (B) contrast in control conditions and in the presence of L-AP4 (20 μM). (C and D) Light-evoked changes in inhibitory synaptic input under the same conditions as (A) and (B). Average of five cells. (E and F) Light-evoked changes in the level of inhibitory synaptic input in response to RFC stimulation with either positive (E) or negative (F) contrast in control conditions and in the presence of strychnine (4 μM). The modulation of inhibitory input to OFF-S cells was entirely blocked by L-AP4 and strychnine (C–F), indicating glycinergic inhibition driven through the ON pathway. Average of four cells.
These experiments also show that synaptic inputs are not mediated entirely via the rod pathway under these recording conditions. The rod pathway, which is active at scotopic light levels, comprises RB cell → AII amacrine cell → OFF-/ON-cone bipolar cells. Signals through RB cells, which are ON-type cells, are completely suppressed by the application of 20 μM L-AP4 (Yamashita & Wässle, 1991; Nakajima et al., 1993). However, the modulation of excitatory input into the OFF-S cells elicited by a step change in light intensity was not entirely blocked by L-AP4 (Fig. 8A and 8B). This indicates that the cone pathway is carrying a significant portion of the signal. Moreover, it is possible that the rod pathway is saturated, and therefore inactive, and that the suppression of excitation produced by L-AP4 is due to activation of other group III metabotropic GluRs in the IPL, particularly as the L-AP4 concentration used in this study was relatively high compared to that in previous studies (Snellman & Nawy, 2004; Quraishi et al., 2007).
We subsequently tested whether the direct inhibition onto OFF-S ganglion cells was GABAergic or glycinergic by adding 4 μM strychnine, a selective glycinergic antagonist, to the bath solution. The strychnine completely suppressed the inhibitory input to the OFF-S cells (Fig. 8E and 8F), indicating that this conductance was largely glycinergic (Murphy & Rieke, 2006).
OFF-S cells receive direct inhibitory input from AII amacrine cells
The results above indicate that the inhibitory input onto the OFF-S cells is mediated through ON-bipolar cells via an intermediate glycinergic amacrine cell. Recent results suggest that the amacrine cell presynaptic to the OFF-T cell might be the AII amacrine cell (Manookin et al., 2008; Murphy & Rieke, 2008), and we decided to test for the involvement of AII amacrine cells in the OFF-S cell circuitry using a connexin-36 knockout mouse (Cx36−/−). As noted above, the AII amacrine cell is part of the rod pathway and is connected to ON-cone bipolar cells through sign-conserving electrical synapses mediated by gap junctions composed of Cx36 in the AII amacrine cell (Deans et al., 2002). At low light levels, with the rod pathway active, the AII amacrine cell is driven by conventional glutamatergic inputs from RB cells. At higher light levels that saturate the RB cells, the AIIs are driven, at least in part, via the electrical connections with the ON-cone bipolar cells (Pang et al., 2007). Therefore, in the Cx36−/− mouse, inhibitory input arising directly from AII cells should be weaker at high background intensities compared with low background intensities due to the loss of the electrical synapses from the ON-cone bipolar cells.
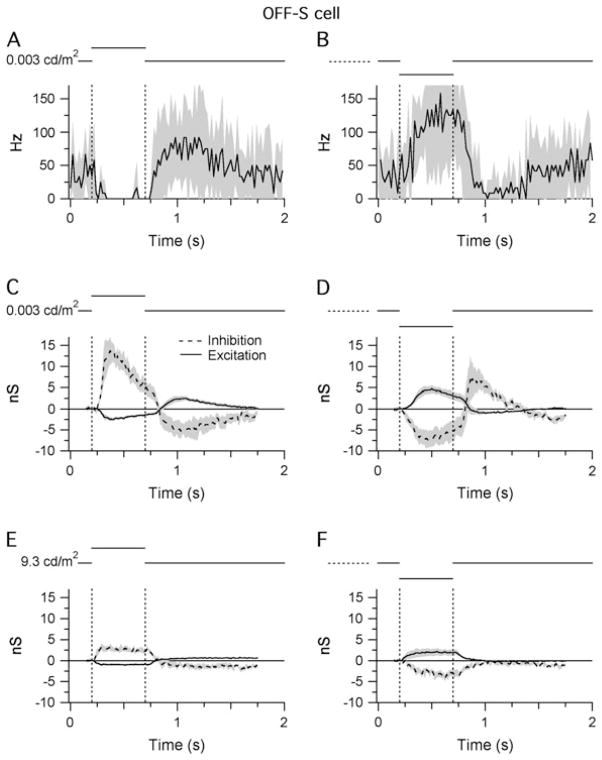
Cell-attached recordings were made from >30 A-type ganglion cells in six Cx36−/− retinas of which only 11 cells responded to light stimuli under low background conditions (background = 0.003 cd/m2 on the retina). All 11 cells had sustained OFF-S RFC responses (Fig. 9A and 9B). However, the spiking responses were more sustained compared to the high background (9.3 cd/m2) recordings (Fig. 4A and 4B) and occurred with longer latencies, as expected for rod-mediated inputs. The inability to find any ganglion cells with ON-center responses at low background intensities is consistent with signaling exclusively through the rod pathway since the electrical synapse between the AII and the ON-cone-bipolar cells was absent in the Cx36−/− mouse.
Fig. 9.
Light responses of OFF-S cells in the Cx36−/− retina. Shaded areas indicate ±1 S.E.M.: (A and B) STHs generated from extracellular responses recorded during RFC stimulation with either positive (A) or negative (B) contrast (±80%; background = 0.003 cd/m2 on the retinal surface). The bin width of the STHs is 20 ms. Average of 11 cells. (C and D) Light-evoked changes in inhibitory and excitatory synaptic inputs recorded under the same conditions as (A) and (B). (E and F) Light-evoked changes in inhibitory and excitatory synaptic inputs recorded from the same cells in (C) and (D) at a background intensity of 9.3 cd/m2 (±80% contrast). The modulation of the inhibitory conductance at the scotopic background intensity (C and D) was significantly reduced at the photopic/mesopic intensity (E and F). Average of six cells.
Of the 11 cells with extracellular light responses, 6 cells were successfully patch clamped to measure light-evoked changes in synaptic input at both low and high background intensities. Light-evoked changes in synaptic conductance under low background conditions are illustrated in Fig. 9C and 9D. They resembled the conductance changes of OFF-S cells (Fig. 4C and 4D), albeit with slower time course. Cells received a tonic inhibitory conductance, which was either up- or downregulated by 13.7 ± 6.9 and 7.0 ± 4.6 nS in response to bright or dark stimuli, respectively, with a smaller inverse modulation of excitatory input. Responses were recorded a second time >10 min after switching to the high background intensity (9.3 cd/m2). The modulation of the inhibitory conductance was significantly reduced at the high background intensity (compare Fig. 9E and 9F with Fig. 9C and 9D). It was also small compared to the modulation of the inhibitory conductance recorded from OFF-S cells in wild-type mice at the same background intensity (Fig. 4C and 4D). These results are consistent with the idea that AII cells provide a significant portion of the inhibitory input onto OFF-S cells. The residual change in inhibition recorded at the high background level may reflect a small fraction of glutamatergic synapses from cone bipolar cells onto AII amacrine cells, previously demonstrated by Strettoi et al. (1992) in the rabbit, or perhaps inputs from another glycinergic amacrine cell. Alternatively, it is possible that the rod response was not entirely saturated at the higher light intensity (9.3 cd/m2) and that the residual modulation in inhibition still comes from AII cells.
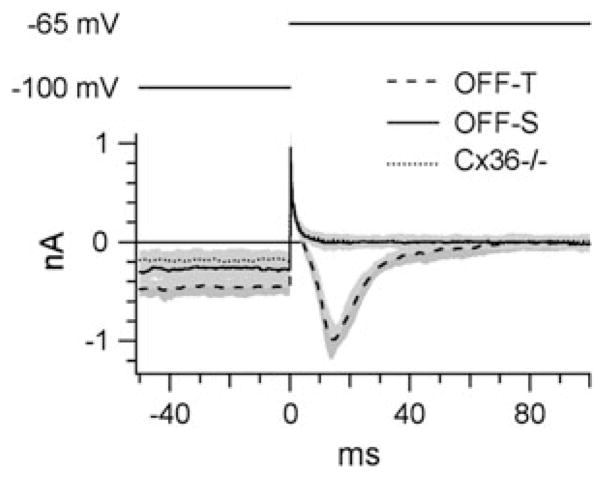
In order to confirm that the population of ganglion cells patch clamped in the Cx36−/− mouse excluded OFF-T cells, we compared the expression of T-type voltage-gated calcium channels in wild-type OFF-S and OFF-T cells and the Cx36−/− cells (Fig. 10). All recorded OFF-T cells expressed T-type calcium channels, which produced a characteristic inward current upon the termination of a hyperpolarizing voltage step (Margolis & Detwiler, 2007). This inward current was absent in all OFF-S cells and in all the cells studied in the Cx36−/− mouse. A further observation was that OFF-T cells required a larger negative current injection in order to maintain the holding potential of −100 mV compared to the OFF-S and Cx36−/− cells (−858 ± 87 pA for OFF-T cells and −368 ± 111 pA for OFF-S cells).
Fig. 10.
T-type calcium currents in OFF-T cells: In all OFF-T cells, a 1-s prepulse to −100 mV followed by depolarization to −65 mV activated a characteristic T-type calcium current. This current was absent in OFF-S cells and in the A-type cells studied in the Cx36−/− retina. Therefore, recordings from the Cx36−/− retina did not include data from OFF-T cells. All traces show the average data collected from six cells. Shaded areas indicate ±1 S.E.M.
Discussion
Morphological and physiological classification of ganglion cells
When the largest cell bodies in the mouse ganglion cell layer (>20 μm) were targeted for analysis, three morphological cell types were found, which differed in the level of stratification of their dendrites in the IPL: ON-S cells, with dendrites stratifying between the inner cholinergic stratum and the ganglion cell layer; OFF-S cells, with dendrites stratifying between the outer cholinergic stratum and the amacrine cell layer; and OFF-T cells, with dendrites stratifying between the two cholinergic strata. These three morphological types have also been described in previous studies of mouse ganglion cells (Pang et al., 2003; Murphy & Rieke, 2006; Margolis & Detwiler, 2007). In the large-scale morphological survey of mouse retinal ganglion cells made by Sun et al. (2002), ON-S cells possibly correspond to A1 or A2 inner cells. Both A1 and A2 inner cells have large somata with radiate dendrites, which stratify between the ON-cholinergic stratum and the ganglion cell layer. A possible counterpart for the OFF-S cell is the C2 outer cell of Sun et al. (2002). The OFF-T cell stratifies between the cholinergic strata and most likely corresponds to the A2 outer cell of Sun et al. (2002).
It is difficult to compare mouse ganglion cells with cell types from other mammalian retinas. In the cat retina, the morphological cell types and their physiological counterparts are well defined (Boycott & Wässle, 1974; O’Brien et al., 2002). Alpha ganglion cells correspond to ON- and OFF-brisk transient (Y) cells, and beta ganglion cells correspond to ON- and OFF-brisk sustained (X) cells. Cat alpha cells have the largest cell bodies, and accordingly, in many other mammalian retinas, ganglion cells with the largest somata were named alpha cells (rabbit: Peichl et al., 1987; rat: Peichl, 1989; and mouse: Pang et al., 2003). However, in contrast to cat alpha cells, mouse A-type cells are not as clearly defined. Recently, two morphological subpopulations of Y cells were described in the monkey retina (Crook et al., 2008). More data are needed for a convincing correlation between the structural and the functional types of mouse ganglion cells and for a more accurate cross-species comparison (Kong et al., 2005).
Light responses of concentric ON- and OFF-center ganglion cells
The STHs of the sustained ON-S and OFF-S cells were mirror symmetric with respect to stimulus contrast. Both cell types had a low background activity (spike rate of ~20 Hz), which limited their ability to encode changes in light intensity of the non-preferred contrast. Stimuli of the preferred contrast often elicited firing frequencies >200 Hz and consequently occupied most of the spike-coding bandwidth. Therefore, the signals generated by ON-S and OFF-S cells appear to be complementary and taken together might be suitable for signaling changes in contrast over an extended range.
The firing properties of the OFF-T cell were qualitatively different fromthe ON-S and OFF-S cells. A complementary ON counterpart was not observed. In contrast to the OFF-S cell, which responded optimally at the onset of a dark stimulus, the OFF-T cell responded equally well to the onset of the dark stimulus and at the termination of the bright stimulus presented for 500 ms, suggesting that the OFF-T cell adapts relatively fast to changes in light intensity. It seems likely that this cell corresponds to the one described by Münch et al. (2008) as a looming detector, which signals the approach of a dark object.
Using both bright and dark stimuli, we showed that all A-type ganglion cells received substantial synaptic input at rest (>6 nS). ON-S cells received excitatory input at rest, while OFF-S and OFF-T cells mainly received inhibitory input. These results are in agreement with previous studies. Margolis and Detwiler (2007) showed that mouse ON-S cells receive a sustained excitatory input under steady background illumination, while OFF-S cells receive a sustained inhibitory input under similar conditions. Experiments examining light-evoked changes in synaptic inputs to the same cell types in the mouse and guinea pig retinas reported an increase in excitatory input onto ON-S cells in response to a centered bright stimulus. In OFF-S cells, however, the same stimulus triggered an increase in inhibitory input and a decrease in excitatory input (Pang et al., 2003; Zaghloul et al., 2003; Murphy & Rieke, 2006).
A comparison of the light-evoked conductances during center-only and full-field illumination indicated that the major effect of the antagonistic surround was a suppression of the synaptic inputs to the ON-S and OFF-S cells. This provides strong evidence that the concentric surrounds are generated largely presynaptic to the ganglion cells, presumably by suppression of transmitter release from the bipolar and amacrine cells.
Since both the ON-S and the OFF-S cells are driven through inputs from the ON pathway, it is tempting to speculate that they are driven by a common ON-cone bipolar cell, which drives the ON-S cells directly and the OFF-S cells through an intervening amacrine cell. In agreement with this hypothesis, the time course of the excitation in the ON-S cells, during both positive and negative contrast stimulation, is remarkably similar to that of the inhibition in the OFF-S cells. Moreover, under this hypothesis, surround activation should suppress the inhibition to the OFF-S cells to the same extent as the excitation to the ON-S cells; the good quantitative agreement in the strength of the surrounds in each case is consistent with the hypothesis.
In the OFF-T cell, light-evoked modulation of the inhibitory and excitatory conductances was inversely related but of a similar magnitude. These data corroborate previous findings by Pang et al. (2003) who showed that OFF-T cells were driven by excitatory inputs and Murphy and Rieke (2008) who showed that spikes in OFF-T cells were generated predominantly through inhibitory pathways. However, given that the physiological membrane potential generally approximates the reversal potential of inhibitory input and lies further from the reversal potential of excitatory input, a change in the excitatory conductance may result in a relatively large change in current flow and consequently contribute most to the light response.
This study was limited to only three ganglion cell types at light intensities between 0.003 cd/m2 (scotopic) and 10 cd/m2 (low photopic). It is clear that these circuitries do not hold for all ganglion cell types. For example, extracellular recordings of multiple ganglion cell types in wild-type and Cx36−/− retinas have shown that some cells do not receive any input from the rod pathway but only from the cone pathway (Deans et al., 2002; Völgyi et al., 2004). Also, in the present study, all recordings were made at high contrast (±80%). Manookin et al. (2008) showed that the relative contributions of inhibition and excitation to guinea pig OFF-T cell responses were dependent on the stimulus contrast, with low contrast favoring inhibition and high contrast favoring excitation.
A role for AII amacrine cells in photopic signaling
The data presented here show that the OFF-S cells receive a glycinergic input, and we propose that this originates from conventional synapses with the lobular appendages of the glycinergic AII amacrine cells. The cumulative evidence that supports this contention can be summarized as follows. First, glycinergic antagonists block the inhibitory input. Second, blocking ON-bipolar cell signaling also blocked the inhibitory input, but not the excitatory input, indicating that the glycinergic amacrine cell responsible for the inhibition is an ON-type cell. This is consistent with the known electrical connection between ON-cone bipolar cells and AII amacrine cells, which are active at photopic light intensities (Massey & Mills, 1999; Xin & Bloomfield, 1999; Trexler et al., 2001; Veruki & Hartveit, 2002; Pang et al., 2007). Finally, and most significantly, measurements in Cx36 knockout mice indicated that the glycinergic input is markedly reduced at high light intensities, consistent with the loss of the gap junction connections between the ON-cone bipolar cells and the AII amacrine cells. However, at low intensities, strong inhibitory inputs were evident in the Cx36 knockout mouse, consistent with signaling through the rod pathway (rod → RB cell → AII → OFF-S). Thus, the evidence presented here, together with previous work from other laboratories (Manookin et al., 2008; Murphy & Rieke, 2008), supports the notion that AII amacrine cells provide direct glycinergic inhibition to OFF A-type cells and that this inhibition is the major input that modulates the firing rate. However, we cannot rule out a minor component arising from an additional unidentified glycinergic amacrine cell.
In summary, our results show that the light responses of mouse ON-S, OFF-S, and OFF-T cells are generated by quite different mechanisms. The light responses of ON-S cells were generated by the modulation of a tonic excitatory conductance driven through the ON channel (ON-cone bipolar cells at photopic light intensities and AII → ON-cone bipolar cells at scotopic light intensities). Light responses of OFF-S cells were mainly generated by the modulation of direct glycinergic input from AII amacrine cells. At scotopic light intensities, AII cells were driven by glutamatergic input from RB cells. When light intensities were increased to a low photopic level, AII cells were primarily driven by ON-cone bipolar cells through gap junctions. Thus, the AII amacrine cell, a crucial interneuron of the rod pathway, plays an important role in cone-mediated visual signaling (Manookin et al., 2008; Murphy & Rieke, 2008). The excitatory input to OFF-S cells was also modulated by light; however, the change in the inhibitory conductance was approximately 7 times larger. Therefore, both ON-S and OFF-S cells were predominantly driven through the ON pathway.
Acknowledgments
The authors would like to thank I. Odenthal for typing this article, J. Shelly for breeding the Cx36−/− mice, and B. Sinke for technical assistance. W.R.T. was supported by a grant from NIH (EY014888).
References
- Abramoff MD, Magelhaes PJ, Ram SJ. Image processing with ImageJ. Biophotonics International. 2004;11:36–42. [Google Scholar]
- Belgum JH, Dvorak DR, McReynolds JS. Sustained synaptic input to ganglion cells of mudpuppy retina. The Journal of Physiology. 1982;326:91–108. doi: 10.1113/jphysiol.1982.sp014179. [DOI] [PMC free article] [PubMed] [Google Scholar]
- Borg-Graham LJ. The computation of directional selectivity in the retina occurs presynaptic to the ganglion cell. Nature Neuroscience. 2001;4:176–183. doi: 10.1038/84007. [DOI] [PubMed] [Google Scholar]
- Bormann J, Hamill OP, Sakmann B. Mechanism of anion permeation through channels gated by glycine and g-aminobutyric acid in mouse cultured spinal neurones. The Journal of Physiology. 1987;385:243–286. doi: 10.1113/jphysiol.1987.sp016493. [DOI] [PMC free article] [PubMed] [Google Scholar]
- Boycott BB, Wässle H. The morphological types of ganglion cells of the domestic cat’s retina. The Journal of Physiology. 1974;240:397–419. doi: 10.1113/jphysiol.1974.sp010616. [DOI] [PMC free article] [PubMed] [Google Scholar]
- Chun MH, Han SH, Chung JW, Wässle H. Electron microscopic analysis of the rod pathway of the rat retina. The Journal of Comparative Neurology. 1993;332:421–432. doi: 10.1002/cne.903320404. [DOI] [PubMed] [Google Scholar]
- Crook JD, Peterson BB, Packer OS, Robinson FR, Gamlin PD, Troy JB, Dacey DM. The smooth monostratified ganglion cell: Evidence for spatial diversity in the Y-cell pathway to the lateral geniculate nucleus and superior colliculus in the macaque monkey. The Journal of Neuroscience. 2008;28:12654–12671. doi: 10.1523/JNEUROSCI.2986-08.2008. [DOI] [PMC free article] [PubMed] [Google Scholar]
- Davenport CM, Detwiler PB, Dacey DM. Effects of pH buffering on horizontal and ganglion cell light responses in primate retina: Evidence for the proton hypothesis of surround formation. The Journal of Neuroscience. 2008;28:456–464. doi: 10.1523/JNEUROSCI.2735-07.2008. [DOI] [PMC free article] [PubMed] [Google Scholar]
- Deans MR, Völgyi B, Goodenough DA, Bloomfield SA, Paul DL. Connexin36 is essential for transmission of rod-mediated visual signals in the mammalian retina. Neuron. 2002;36:703–712. doi: 10.1016/s0896-6273(02)01046-2. [DOI] [PMC free article] [PubMed] [Google Scholar]
- DeVries SH. Bipolar cells use kainate and AMPA receptors to filter visual information into separate channels. Neuron. 2000;28:847–856. doi: 10.1016/s0896-6273(00)00158-6. [DOI] [PubMed] [Google Scholar]
- Famiglietti EV, Jr, Kolb H. A bistratified amacrine cell and synaptic circuitry in the inner plexiform layer of the retina. Brain Research. 1975;84:293–300. doi: 10.1016/0006-8993(75)90983-x. [DOI] [PubMed] [Google Scholar]
- Flores-Herr N, Protti DA, Wässle H. Synaptic currents generating the inhibitory surround of ganglion cells in the mammalian retina. The Journal of Neuroscience. 2001;21:4852–4863. doi: 10.1523/JNEUROSCI.21-13-04852.2001. [DOI] [PMC free article] [PubMed] [Google Scholar]
- Güldenagel M, Ammermuller J, Feigenspan A, Teubner B, Degen J, Sohl G, Willecke K, Weiler R. Visual transmission deficits in mice with targeted disruption of the gap junction gene connexin36. The Journal of Neuroscience. 2001;21:6036–6044. doi: 10.1523/JNEUROSCI.21-16-06036.2001. [DOI] [PMC free article] [PubMed] [Google Scholar]
- Hirasawa H, Kaneko A. External proton mediates the feedback from horizontal cells to cones in the newt retina. In: Kaneko A, editor. Neural Basis of Early Vision. Tokyo, Japan: Springer Verlag; 2003. pp. 108–109. [Google Scholar]
- Kamermans M, Fahrenfort I, Schultz K, Janssen-Bienhold U, Sjoerdsma T, Weiler R. Hemichannel-mediated inhibition in the outer retina. Science. 2001;292:1178–1180. doi: 10.1126/science.1060101. [DOI] [PubMed] [Google Scholar]
- Kao YH, Lassova L, Bar-Yehuda T, Edwards RH, Sterling P, Vardi N. Evidence that certain retinal bipolar cells use both glutamate and GABA. The Journal of Comparative Neurology. 2004;478:207–218. doi: 10.1002/cne.20221. [DOI] [PubMed] [Google Scholar]
- Kolb H. The inner plexiform layer in the retina of the cat: Electron microscopic observations. Journal of Neurocytology. 1979;8:295–329. doi: 10.1007/BF01236124. [DOI] [PubMed] [Google Scholar]
- Kolb H, Famiglietti EV. Rod and cone pathways in the retina of the cat. Investigative Ophthalmology & Visual Science. 1976;15:935–946. [Google Scholar]
- Kolb H, Nelson R. OFF-alpha and OFF-beta ganglion cells in cat retina: II. Neural circuitry as revealed by electron microscopy of HRP stains. The Journal of Comparative Neurology. 1993;329:85–110. doi: 10.1002/cne.903290107. [DOI] [PubMed] [Google Scholar]
- Kong JH, Fish DR, Rockhill RL, Masland RH. Diversity of ganglion cells in the mouse retina: Unsupervised morphological classification and its limits. The Journal of Comparative Neurology. 2005;489:293–310. doi: 10.1002/cne.20631. [DOI] [PubMed] [Google Scholar]
- MacNeil MA, Heussy JK, Dacheux RF, Raviola E, Masland RH. The shapes and numbers of amacrine cells: Matching of photofilled with Golgi-stained cells in the rabbit retina and comparison with other mammalian species. The Journal of Comparative Neurology. 1999;413:305–326. [PubMed] [Google Scholar]
- Manookin MB, Beaudoin DL, Ernst ZR, Flagel LJ, DeMb JB. Disinhibition combines with excitation to extend the operating range of the OFF visual pathway in daylight. The Journal of Neurosci-ence. 2008;28:4136–4150. doi: 10.1523/JNEUROSCI.4274-07.2008. [DOI] [PMC free article] [PubMed] [Google Scholar]
- Margolis DJ, Detwiler PB. Different mechanisms generate maintained activity in ON and OFF retinal ganglion cells. The Journal of Neuroscience. 2007;27:5994–6005. doi: 10.1523/JNEUROSCI.0130-07.2007. [DOI] [PMC free article] [PubMed] [Google Scholar]
- Massey SC, Mills SL. Gap junctions between AII amacrine cells and calbindin-positive bipolar cells in the rabbit retina. Visual Neuroscience. 1999;16:1181–1189. doi: 10.1017/s0952523899166173. [DOI] [PubMed] [Google Scholar]
- McGuire BA, Stevens JK, Sterling P. Microcircuitry of beta ganglion cells in cat retina. The Journal of Neuroscience. 1986;6:907–918. doi: 10.1523/JNEUROSCI.06-04-00907.1986. [DOI] [PMC free article] [PubMed] [Google Scholar]
- Menger N, Pow DV, Wässle H. Glycinergic amacrine cells of the rat retina. The Journal of Comparative Neurology. 1998;401:34–46. doi: 10.1002/(sici)1096-9861(19981109)401:1<34::aid-cne3>3.0.co;2-p. [DOI] [PubMed] [Google Scholar]
- Münch TA, da Silveira RA, Siegert S, Roska B. A Functional Role of AII Amacrine Cells in Light-Adapted Retina. Arvo Annual Meeting, 1415/A603; 27 April to 1 May; Fort Lauderdale, FL, USA. Association for Research in Vision and Ophthalmology; 2008. [Google Scholar]
- Murphy GJ, Rieke F. Network variability limits stimulus-evoked spike timing precision in retinal ganglion cells. Neuron. 2006;52:511–524. doi: 10.1016/j.neuron.2006.09.014. [DOI] [PMC free article] [PubMed] [Google Scholar]
- Murphy GJ, Rieke F. Signals and noise in an inhibitory interneuron diverge to control activity in nearby retinal ganglion cells. Nature Neuroscience. 2008;11:318–326. doi: 10.1038/nn2045. [DOI] [PMC free article] [PubMed] [Google Scholar]
- Nakajima Y, Iwakabe H, Akazawa C, Nawa H, Shigemoto R, Mizuno N, Nakanishi S. Molecular characterization of a novel retinal metabotropic glutamate receptor mGluR6 with a high agonist selectivity for L-2-amino-4-phosphonobutyrate. The Journal of Biological Chemistry. 1993;268:11868–11873. [PubMed] [Google Scholar]
- Nomura A, Shigemoto R, Nakamura Y, Okamoto N, Mizuno N, Nakanishi S. Developmentally regulated postsynaptic localization of a metabotropic glutamate receptor in rat rod bipolar cells. Cell. 1994;77:361–369. doi: 10.1016/0092-8674(94)90151-1. [DOI] [PubMed] [Google Scholar]
- O’Brien BJ, Isayama T, Richardson R, Berson DM. Intrinsic physiological properties of cat retinal ganglion cells. The Journal of Physiology. 2002;538:787–802. doi: 10.1113/jphysiol.2001.013009. [DOI] [PMC free article] [PubMed] [Google Scholar]
- O’Brien BJ, Richardson RC, Berson DM. Inhibitory network properties shaping the light evoked responses of cat alpha retinal ganglion cells. Visual Neuroscience. 2003;20:351–361. doi: 10.1017/s0952523803204016. [DOI] [PubMed] [Google Scholar]
- Pang JJ, Abd-El-Barr MM, Gao F, Bramblett DE, Paul DL, Wu SM. Relative contributions of rod and cone bipolar cell inputs to AII amacrine cell light responses in the mouse retina. The Journal of Physiology. 2007;580:397–410. doi: 10.1113/jphysiol.2006.120790. [DOI] [PMC free article] [PubMed] [Google Scholar]
- Pang JJ, Gao F, Wu SM. Light-evoked excitatory and inhibitory synaptic inputs to ON and OFF alpha ganglion cells in the mouse retina. The Journal of Neuroscience. 2003;23:6063–6073. doi: 10.1523/JNEUROSCI.23-14-06063.2003. [DOI] [PMC free article] [PubMed] [Google Scholar]
- Pang JJ, Gao F, Wu SM. Light-evoked current responses in rod bipolar cells, cone depolarizing bipolar cells and AII amacrine cells in dark-adapted mouse retina. The Journal of Physiology. 2004;558:897–912. doi: 10.1113/jphysiol.2003.059543. [DOI] [PMC free article] [PubMed] [Google Scholar]
- Peichl L. Alpha and delta ganglion cells in the rat retina. The Journal of Comparative Neurology. 1989;286:120–139. doi: 10.1002/cne.902860108. [DOI] [PubMed] [Google Scholar]
- Peichl L, Ott H, Boycott BB. Alpha ganglion cells in mammalian retinae. Proceedings of the Royal Society of London. Series B. Biological Sciences. 1987;231:169–197. doi: 10.1098/rspb.1987.0040. [DOI] [PubMed] [Google Scholar]
- Quraishi S, Gayet J, Morgans CW, Duvoisin RM. Distribution of group-III metabotropic glutamate receptors in the retina. The Journal of Comparative Neurology. 2007;501:931–943. doi: 10.1002/cne.21274. [DOI] [PubMed] [Google Scholar]
- Schubert T, Kerschensteiner D, Eggers ED, Misgeld T, Ker-schensteiner M, LichtMan JW, Lukasiewicz PD, Wong RO. Development of presynaptic inhibition onto retinal bipolar cell axon terminals is subclass-specific. Journal of Neurophysiology. 2008;100:304–316. doi: 10.1152/jn.90202.2008. [DOI] [PMC free article] [PubMed] [Google Scholar]
- Slaughter MM, Miller RF. Characterization of an extended glutamate receptor of the on bipolar neuron in the vertebrate retina. The Journal of Neuroscience. 1985;5:224–233. doi: 10.1523/JNEUROSCI.05-01-00224.1985. [DOI] [PMC free article] [PubMed] [Google Scholar]
- Snellman J, Nawy S. cGMP-dependent kinase regulates response sensitivity of the mouse on bipolar cell. The Journal of Neuroscience. 2004;24:6621–6628. doi: 10.1523/JNEUROSCI.1474-04.2004. [DOI] [PMC free article] [PubMed] [Google Scholar]
- Strettoi E, Raviola E, Dacheux RF. Synaptic connections of the narrow-field, bistratified rod amacrine cell (AII) in the rabbit retina. The Journal of Comparative Neurology. 1992;325:152–168. doi: 10.1002/cne.903250203. [DOI] [PubMed] [Google Scholar]
- Sun W, Li N, He S. Large-scale morphological survey of mouse retinal ganglion cells. The Journal of Comparative Neurology. 2002;451:115–126. doi: 10.1002/cne.10323. [DOI] [PubMed] [Google Scholar]
- Taylor WR. TTX attenuates surround inhibition in rabbit retinal ganglion cells. Visual Neuroscience. 1999;16:285–290. doi: 10.1017/s0952523899162096. [DOI] [PubMed] [Google Scholar]
- Taylor WR, Vaney DI. Diverse synaptic mechanisms generate direction selectivity in the rabbit retina. The Journal of Neuroscience. 2002;22:7712–7720. doi: 10.1523/JNEUROSCI.22-17-07712.2002. [DOI] [PMC free article] [PubMed] [Google Scholar]
- Trexler EB, Li W, Mills SL, Massey SC. Coupling from AII amacrine cells to ON cone bipolar cells is bidirectional. The Journal of Comparative Neurology. 2001;437:408–422. doi: 10.1002/cne.1292. [DOI] [PubMed] [Google Scholar]
- van Wyk M, Taylor WR, Vaney DI. Local edge detectors: A substrate for fine spatial vision at low temporal frequencies in rabbit retina. The Journal of Neuroscience. 2006;26:13250–13263. doi: 10.1523/JNEUROSCI.1991-06.2006. [DOI] [PMC free article] [PubMed] [Google Scholar]
- Veruki ML, Hartveit E. Electrical synapses mediate signal transmission in the rod pathway of the mammalian retina. The Journal of Neuroscience. 2002;22:10558–10566. doi: 10.1523/JNEUROSCI.22-24-10558.2002. [DOI] [PMC free article] [PubMed] [Google Scholar]
- Völgyi B, Deans MR, Paul DL, BlooMfield SA. Convergence and segregation of the multiple rod pathways in mammalian retina. The Journal of Neuroscience. 2004;24:11182–11192. doi: 10.1523/JNEUROSCI.3096-04.2004. [DOI] [PMC free article] [PubMed] [Google Scholar]
- Wässle H. Parallel processing in the mammalian retina. Nature Reviews Neuroscience. 2004;5:747–757. doi: 10.1038/nrn1497. [DOI] [PubMed] [Google Scholar]
- Werblin FS, Dowling JE. Organization of the retina of the mudpuppy, Necturus maculosus. II. Intracellular recording. Journal of Neurophysiology. 1969;32:339–355. doi: 10.1152/jn.1969.32.3.339. [DOI] [PubMed] [Google Scholar]
- Wunk DF, Werblin FS. Synaptic inputs to the ganglion cells in the tiger salamander retina. The Journal of General Physiology. 1979;73:265–286. doi: 10.1085/jgp.73.3.265. [DOI] [PMC free article] [PubMed] [Google Scholar]
- Xin D, Bloomfield SA. Comparison of the responses of AII amacrine cells in the dark- and light-adapted rabbit retina. Visual Neuroscience. 1999;16:653–665. doi: 10.1017/s0952523899164058. [DOI] [PubMed] [Google Scholar]
- Yamashita M, Wässle H. Responses of rod bipolar cells isolated from the rat retina to the glutamate agonist 2-amino-4-phosphonobutyric acid (APB) The Journal of Neuroscience. 1991;11:2372–2382. doi: 10.1523/JNEUROSCI.11-08-02372.1991. [DOI] [PMC free article] [PubMed] [Google Scholar]
- Zaghloul KA, Boahen K, Demb JB. Different circuits for ON and OFF retinal ganglion cells cause different contrast sensitivities. The Journal of Neuroscience. 2003;23:2645–2654. doi: 10.1523/JNEUROSCI.23-07-02645.2003. [DOI] [PMC free article] [PubMed] [Google Scholar]


