Abstract
Sound-induced stapes velocity (Vs) was measured intraoperatively in 14 patients undergoing cochlear implantation. All 14 patients had no history of middle-ear pathology, and their ossicular chains appeared normal on intraoperative inspection and palpation. The magnitude of the mean Vs (normalized by simultaneously-measured ear-canal sound pressure) was stiffness-dominated at frequencies below 1 kHz, increased up to ~4 kHz, and then decreased at higher frequencies. The phase of the mean velocity was +0.2 periods at 0.3 kHz, and gradually became a phase lag at higher frequencies. The mean Vs measured in this study was similar to that of seven ears reported in the only other published study of live human measurements (Huber et al., 2001). We also made measurements of Vs in fresh cadaveric temporal bones using a technique identical to that used in live ears, including similar measurement angles and location. The mean Vs measured in the cadaveric ears under these conditions was similar to the mean Vs measurements in the 14 live ears. This indicates that middle-ear mechanics are similar in live and cadaveric ears. In addition, interspecies comparisons were made between our live human Vs and the Vs reported in different animal studies. There were some clear similarities in Vs across species, as well as differences. The primary interspecies differences were in the magnitude of the Vs as well as in the frequency of transitions in the magnitudes’ frequency dependence from rising to flat or falling.
Keywords: Stapes velocity, Middle-ear mechanics, Laser-Doppler vibrometry, Middle-ear output, Umbo velocity, Round-window velocity
1. Introduction
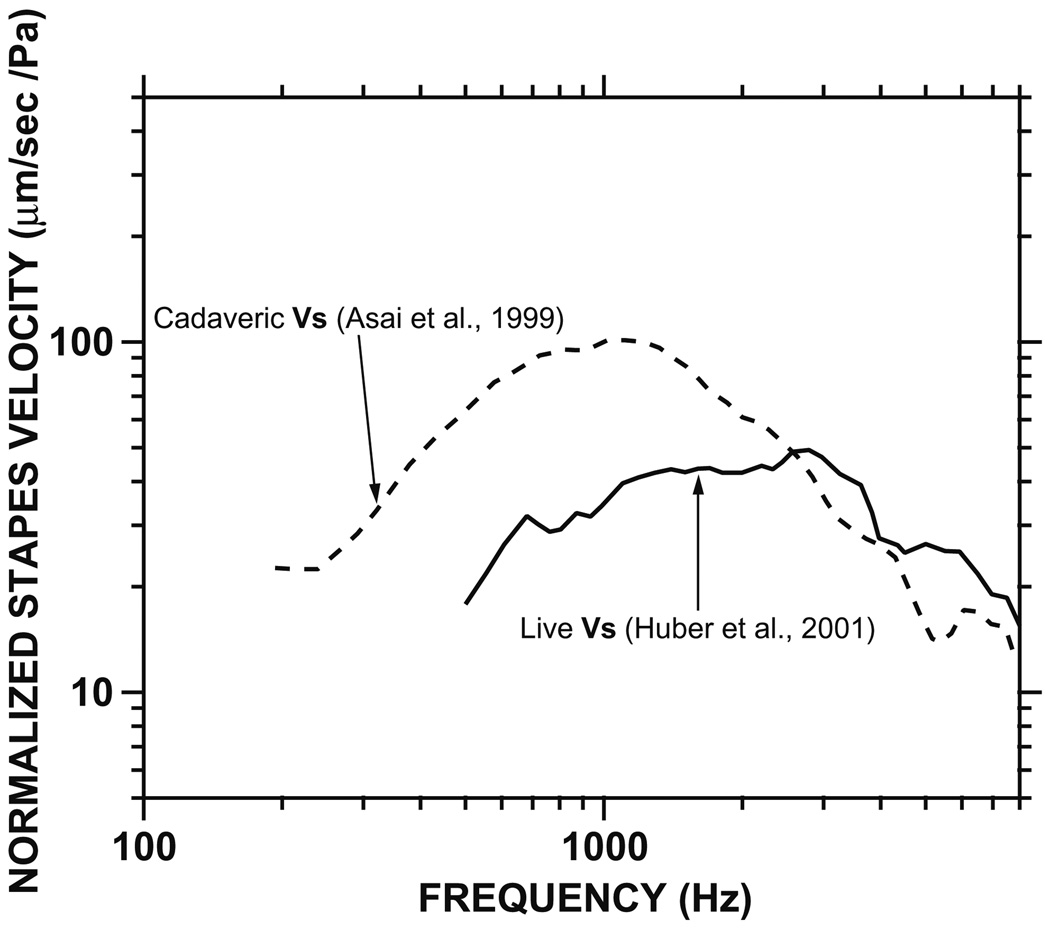
The mechanical properties of the live human middle ear at its input (e.g., middle-ear admittance and sound-induced umbo velocity) have been characterized reasonably well (Rabinowitz, 1981; Margolis and Goycoolea, 1993; Goode et al., 1993, 1996; Whittemore et al., 2004). However, few measurements of middle- ear output (e.g., stapes velocity, Vs) have been reported in live humans. In the single extant study of middle-ear output in seven live human patients (Huber et al., 2001), the mean sound-induced Vs magnitude was significantly lower (~5–10 dB) below ~1.5 kHz than that measured in cadaveric ears (Asai et al., 1999)—see Fig. 1. This discrepancy led to suggestions that there are significant mechanical differences in middle-ear sound transmission between cadaveric and live human ears (Ruggero and Temchin, 2003).
Fig. 1.
Mean stapes velocity (Vs) magnitude in live (solid line) and cadaveric (dashed line) ears as reported by Huber et al. (2001), Asai et al. (1999), respectively (taken from Chien et al., 2006). The magnitude difference below 1.5 kHz is statistically significant (Huber et al., 2001).
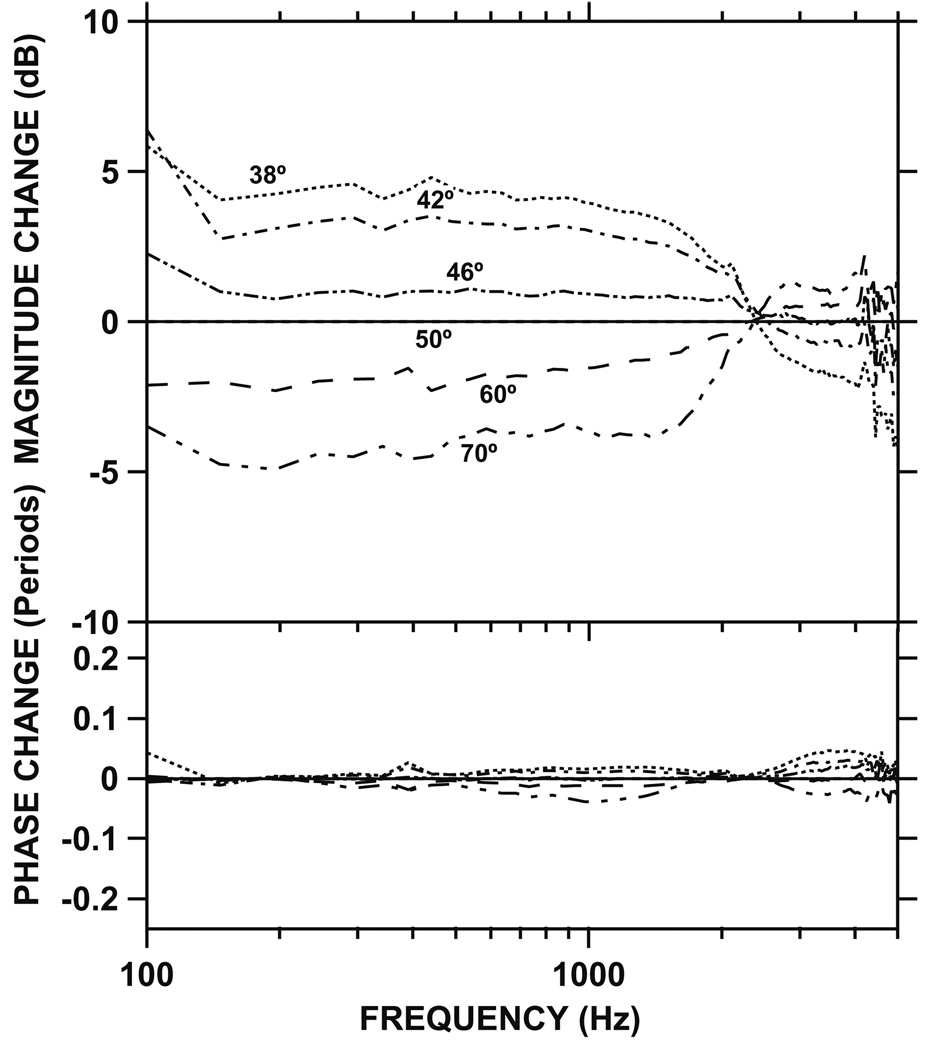
In a recent study, we presented evidence suggesting that most of the difference in measured Vs between cadaveric and live ears can be explained by differences in measurement angle, i.e., the angle between the direction of piston-like stapes motion and the direction of the laser beam used to measure Vs (Chien et al., 2006). In that study, we demonstrated that increasing the measurement angle (relative to the direction of piston-like stapes motion) in cadaveric ears caused a decrease in the measured Vs magnitude (as might be expected from a cosine correction for observation of a one-dimensional motion from an angled view), but only below 2 kHz (Fig. 2). Above 2 kHz, variations in measurement angle had smaller effects on Vs. The magnitude as well as the frequency dependence of these variations in Vs with viewing angle are consistent with the observed discrepancy in low-frequency Vs between cadaveric and live ears shown in Fig. 1.
Fig. 2.
The change in stapes velocity (ΔVs) in one representative temporal bone when the measurement angle was changed from large to small with respect to the axis of piston-like stapes motion (taken from Chien et al., 2006). All measurements were normalized to an angle of 50°. Top panel: magnitude. Bottom panel: phase. Note that increasing the angle results in a decrease in magnitude of Vs below 2 kHz [modified from Chien et al., 2006].
In the present study, we report measurements of sound-induced Vs (both magnitude & phase) made in 14 live patients undergoing cochlear implantation (similar to Huber’s patient population). We also measured Vs in fresh cadaveric temporal bones using measurement angles and locations that were similar to those used in the live ears. Our goals are to compare the live versus cadaveric data to investigate possible similarities and differences in middle-ear mechanics between pre- and post-mortem ears, and to generate estimates of Vs in live humans for comparison with similar measurements in other species.
2. Materials and methods
2.1. Measurements of stapes velocity in live patients (Fig. 3A and B)
Fig. 3.
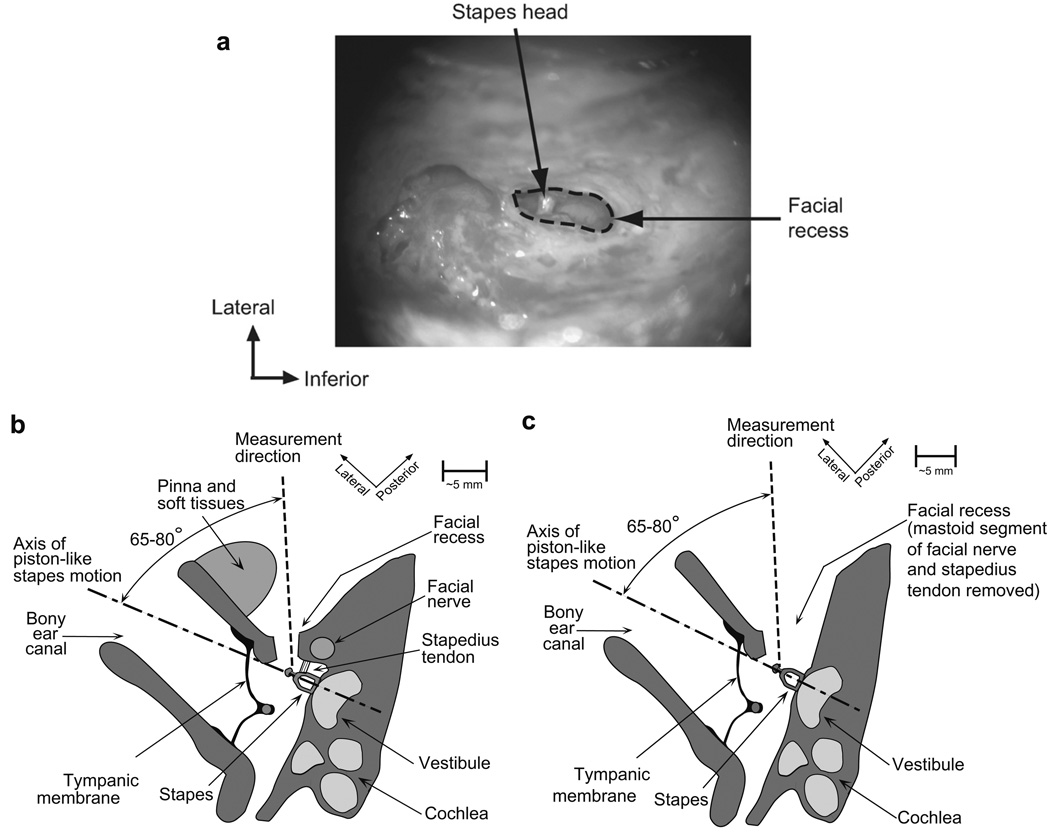
(A) Photograph of an intraoperative view of the stapes during Vs measurement (right ear). The stapes head is shown with a naturally reflective spot where Vs measurements were made. (B) Schematic axial view of the measurement setup in live Vs measurements. (C) Schematic axial view of the measurement setup in cadaveric Vs measurements. Note that even though the measurement direction is aimed at the head of stapes, some of our cadaveric Vs measurements were made at the posterior crus, as indicated in the text.
This study was approved by the Institutional Review Board (IRB) at the Massachusetts Eye & Ear Infirmary. Stapes velocity measurements were made in 14 patients undergoing cochlear implantation who had no history of middle-ear disease. The age of our cohort ranged from 20 to 78 years (mean 58 years). Otologic examinations and preoperative CT scans showed normal middle ears, normal mastoids, and no fibrosis or ossification of the inner ears. Preoperative umbo velocity measurements using laser-Doppler vibrometry (Whittemore et al., 2004) were performed in 12 out of these 14 patients to confirm normal mobility of the tympanic membrane and to exclude patients with evidence of ossicular chain abnormalities (Rosowski et al., 2008). The umbo velocity measurements were not performed in 2 patients due to logistical difficulties. Both of these patients had no clinical evidence of middle-ear abnormalities.
After general anesthesia was induced, a canal-wall-up mastoidectomy was performed, and the facial recess was opened to visualize the round window and the stapes (Fig. 3A and B). A 9-tone stimulus (containing frequency components of 0.3, 0.5, 0.7, 1, 1.5, 2, 3, 4, and 6 kHz) was presented to an earphone (Etymotic Research, Inc., Model No. ER-4 or ER-6, IL, USA) coupled to the external auditory canal using a sterile standard otologic speculum. Earcanal sound pressure (Pec) was measured with a probe tube microphone (Etymotic Research, Inc., Model No. ER-7A, IL, USA). The probe tip was flush with the end of the otologic speculum and placed within 10–15 mm of the umbo. This was done to avoid contamination of the surgical field. At 6000 Hz, 15 mm is about 26% of the wavelength of sound and we expect inaccuracies in our measurements of sound pressure at this frequency. The estimates of sound pressure phase will be most affected and could be in error by as much as 0.4 periods, while our measured sound pressure could underestimate the sound pressure at the tympanic membrane by 20 dB. Smaller inaccuracies would also occur at 4000 Hz. Sound-induced Vs (magnitude and phase) was measured using a laser-Doppler vibrometer (Polytec Inc., Model No. HLV-1000, CA, USA; see Chien et al., 2006, for details). The location of the measurement was on a bright spot at the stapes head in all 14 cases. No reflectors were placed on the stapes. The Vs and Pec measurements were acquired using National Instruments hardware and software (TX, USA) installed in a portable computer. The measurement angle between the laser beam and the piston-like direction of stapes motion was estimated intraoperatively with a metal protractor (that was sterilized) and was found to vary between 65 and 80°. In each ear, the measurements were completed within a span of 10–15 min. Because of the limited time available and the relatively high noise floors associated with the use of natural stapes reflections, we concentrated on making measurements at frequencies within the clinically significant range (≤6 kHz). Cochlear implantation was completed after the Vs measurements were performed. Post-measurement analysis of the Vs and Pec data (including magnitude and phase) was done using MATLAB software (The MathWorks, Inc., MA, USA).
2.2. Measurements of stapes velocity in cadaveric temporal bones (Fig. 3C)
Thirteen fresh cadaveric human temporal bones from individuals aged 46–80 years were used. The temporal bones were obtained less than 29-hours post-mortem and were kept refrigerated in normal saline at 5 °C until experiments were performed. These bones were from individuals with no history of otologic disease (except presbycusis). All had normal middle ears and mastoids on otoscopy and at mastoidectomy. The ossicular chain was intact and normal on inspection and palpation in all ears.
A canal-wall-up mastoidectomy was performed and the facial recess was opened to visualize the stapes. The stapedius tendon was severed and the mastoid segment of the facial nerve was removed in order to maximize the exposure of the stapes. (It has been shown in our previous study that cutting the stapedius tendon and removing the mastoid segment of facial nerve had small effects on measured Vs at frequencies below 6 kHz; see Chien et al., 2006). A logarithmic chirp stimulus (containing harmonic frequency components of 48 Hz–12.5 kHz with a frequency−1/2 pre-emphasis, i.e. so the amplitude of the chirps’ harmonic components decreased as their frequency increased) was presented to an earphone (Etymotic Research, Inc., Model No. ER-4 or ER-6, IL, USA) coupled to the residual ear canal using a standard otologic speculum. Ear-canal sound pressure (Pec) was measured with a similar probe tube microphone as in live ears. The probe tip was within 5 mm of the umbo since sterility is not a concern in this case.
Sound-induced Vs was measured using a laser-Doppler vibrometer. In the first six bones, a small reflective tape (with dimensions of ~0.25 mm by 0.25 mm) was placed at the posterior crus of the stapes during Vs measurements to increase the signal strength of the reflected laser light. In the next seven bones, the Vs was measured with small reflective tapes at both the posterior crus and the head of the stapes. The Vs measurement angles were estimated with a protractor and varied between 65 and 80° from the axis of piston-like stapes motion, similar to the live Vs measurement angles.
To confirm the integrity of the inner ear in these cadaveric temporal bones (i.e., that the inner ear was completely fluid-filled), sound-induced round-window velocity (Vrw) was also measured. Only temporal bones exhibiting a half-cycle phase difference and constant magnitude ratio between Vrw and Vs below ~500 Hz were used (Mehta et al., 2003).
3. Results
All stapes velocity measurements reported in the present study are normalized by the ear-canal sound pressure (Pec).
3.1. Stapes velocity in live ears (Fig. 4)
Fig. 4.
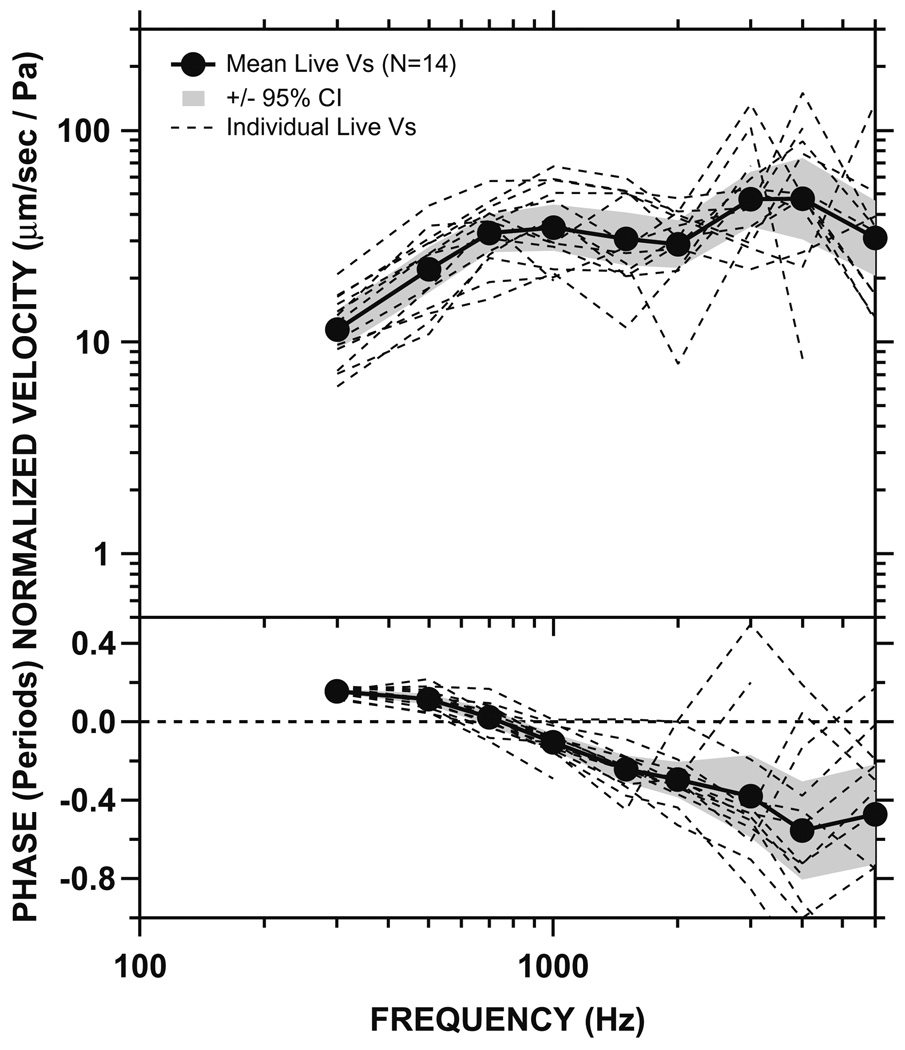
Normalized Vs measured in 14 live ears (dashed lines), as well as the mean (solid line) and 95% CI around the mean (shaded areas). Top panel: magnitude. Bottom panel: phase.
The individual measurements, the mean, and the 95% confidence interval (CI) around the mean of Vs measurements (magnitude and phase) in all 14 live ears are shown in Fig. 4. The mean magnitude of live Vs increased with frequency below 700 Hz, was flat between 700 and 2000 Hz, increased with frequency again between 2000 and 3000 Hz, and decreased at higher frequencies (at the rate of ~ 8 dB per octave). The peak in Vs magnitude was between 3 and 4 kHz. There was a 0.2-period phase lead at low frequencies which gradually decreased to 0 by ~800 Hz. The phase reached −0.5 periods above 4 kHz.
3.2. Comparison of our live stapes velocity with the published data (Fig. 5)
Fig. 5.
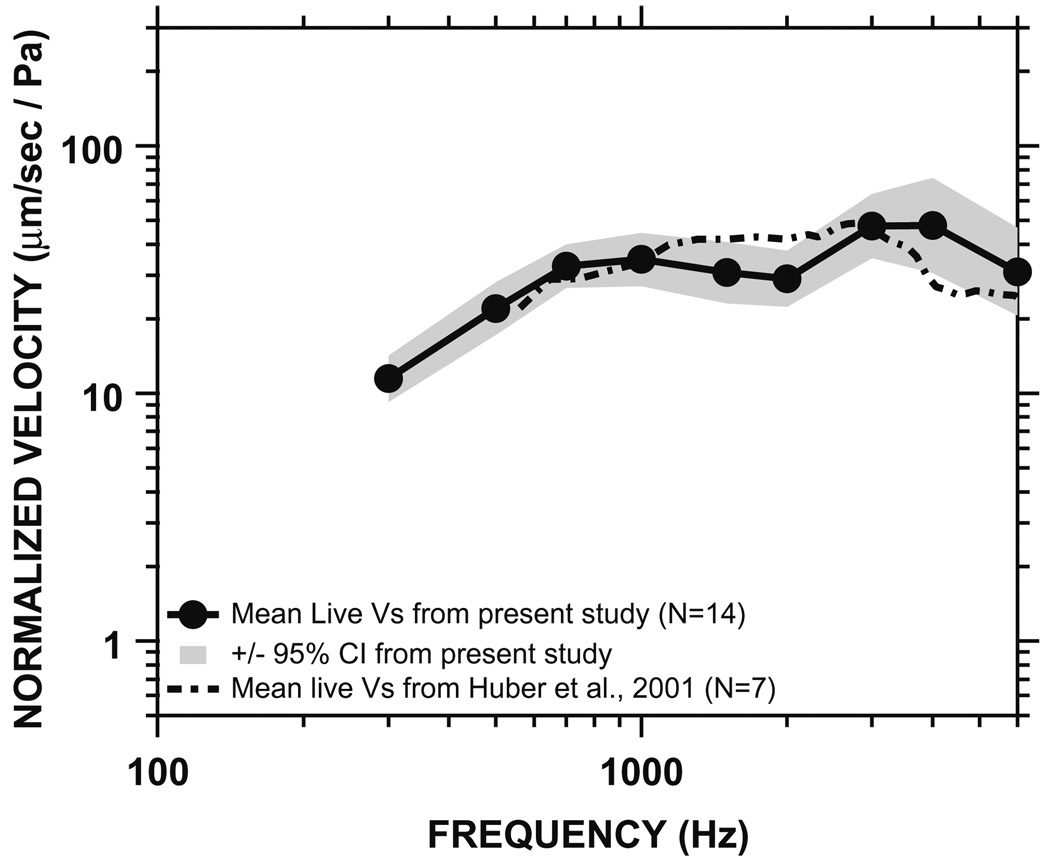
The mean and 95% CI of the Vs magnitude measured in 14 live patients in the present study (solid line and shaded areas), compared to the published mean live Vs by Huber et al., 2001 (dot-dashed line).
Fig. 5 shows the mean live Vs magnitude and its 95% CI from the present study, along with the mean live Vs magnitude reported by Huber et al. (2001). The mean live Vs magnitude reported by Huber has a similar frequency response to the mean live Vs magnitude in the present study, and the difference between the two measurements is not statistically significant (Huber’s data fall within the 95% CI of our measurements), except at around 2 and 4 kHz. The Huber study did not report the phase component of Vs, thus comparison of phase cannot be made.
3.3. Stapes velocity in cadaveric ears (Fig. 6–Fig. 8)
Fig. 6.
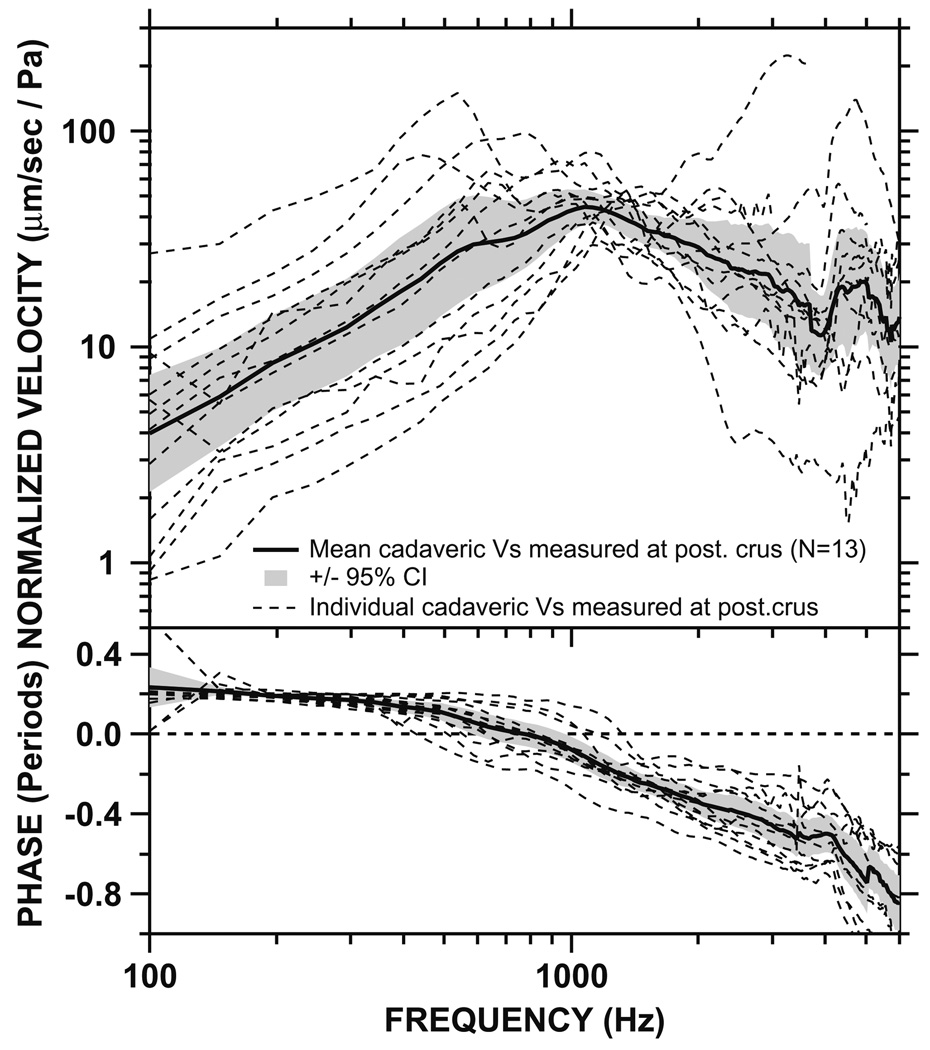
Normalized Vs measured at the posterior crus in 13 cadaveric temporal bones (dashed lines), as well as the mean (solid line) and 95% CI around the mean (shaded areas). Top panel: magnitude. Bottom panel: phase.
Fig. 8.
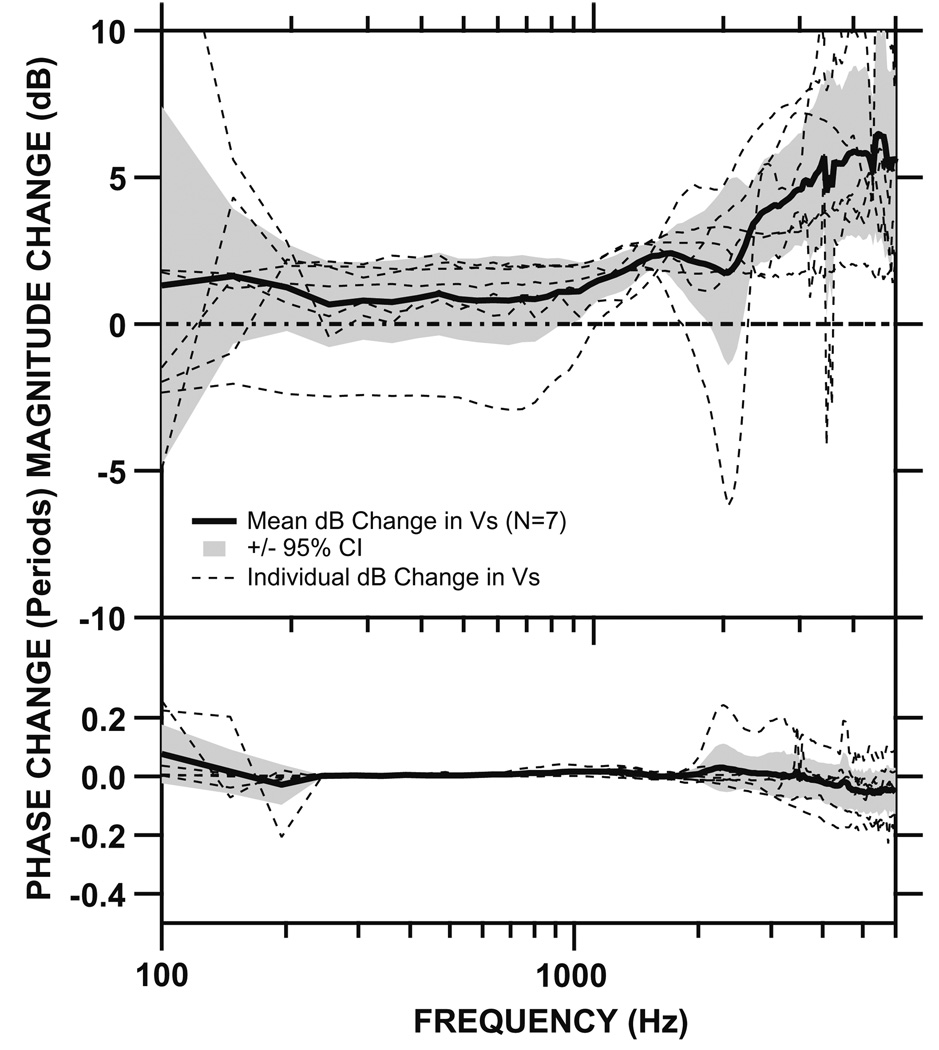
Change in Vs when measured from head of stapes vs. posterior crus in seven cadaveric temporal bones (dashed lines). The mean change in Vs (solid line) as well as its 95% CI (shaded areas) are also shown. Top panel: magnitude. Bottom panel: phase. Note the Vs measured at the head of stapes is higher than the Vs measured at the posterior crus, but the difference is only statistically significant at higher frequencies.
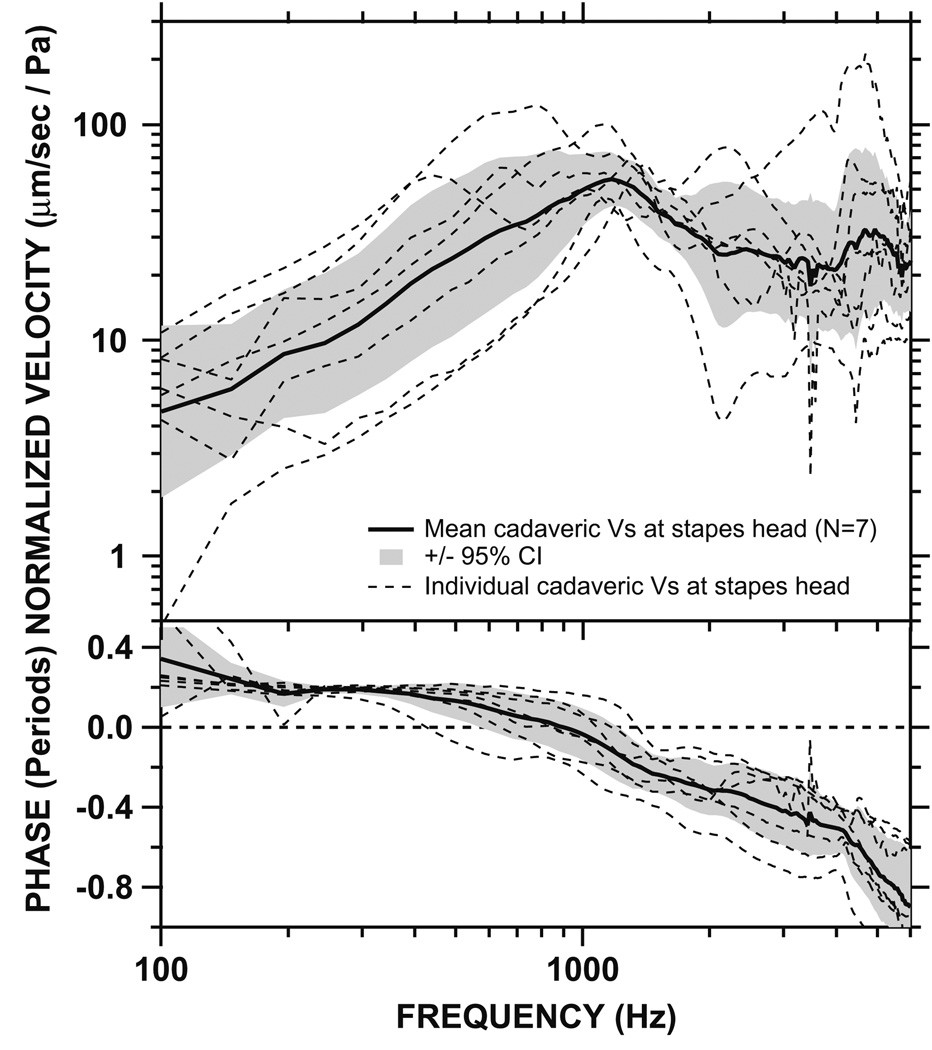
Stapes velocity was measured in 13 fresh cadaveric temporal bones. In the first six bones, Vs was measured at the posterior crus, which is one of the common sites for Vs measurement in cadaveric specimens. These measurements were performed prior to our live Vs measurements. In the next seven bones, Vs was measured at both the posterior crus and the stapes head because our intraoperative Vs measurements indicated that the head of stapes had a natural reflective spot rather than the posterior crus, and therefore, all of our intraoperative live Vs measurements were performed at the head of stapes. Fig. 6 shows the Vs measured at the posterior crus of stapes in all 13 cadaveric temporal bones. The individual measurements, the mean, and the 95% confidence interval (CI) around the mean are shown. The magnitude of cadaveric Vs increased with frequency below 1 kHz, and decreased with frequency above 1 kHz. There was a 0.2-period phase lead at low frequencies which gradually decreased to 0 by ~800 Hz. The phase reached −0.8 periods above 6 kHz. Fig. 7 shows the sound-induced Vs measured at the stapes head in seven cadaveric bones. The individual measurements, the mean, and the 95% CI around the mean are shown. The mean magnitude of the cadaveric Vs increased with frequency below 1 kHz, and decreased at higher frequencies above 1 kHz. There was a 0.3-period phase lead at low frequencies which gradually decreased to 0 by ~1 kHz. The phase reached −0.8 periods above 5 kHz. The measurement angles in both sets of measurements (Fig. 6 and Fig. 7) ranged from 65 to 80°, similar to the angles in live ears.
Fig. 7.
Normalized Vs measured at the head of stapes in seven cadaveric temporal bones (dashed lines), as well as the mean (solid line) and 95% CI around the mean (shaded areas). Top panel: magnitude. Bottom panel: phase.
Fig. 8 shows the change (in dB) in Vs measured at the head of stapes when compared to the Vs measured at the posterior crus in the seven bones in which measurements at both locations were taken. In general, the magnitude of Vs measured at the stapes head is higher than the magnitude of Vs measured at the posterior crus. However, this difference is small and statistically insignificant at frequencies below 900 Hz. Above 1 kHz, the differences in Vs magnitude between the two measurement locations become larger (6 dB at 6000 Hz) and statistically significant. The phase differences are minimal at these two measurement locations across the frequency range and are not statistically significant.
3.4. Comparison of live Vs measurements with cadaveric Vs measurements made in a similar fashion (Fig. 9)
Fig. 9.
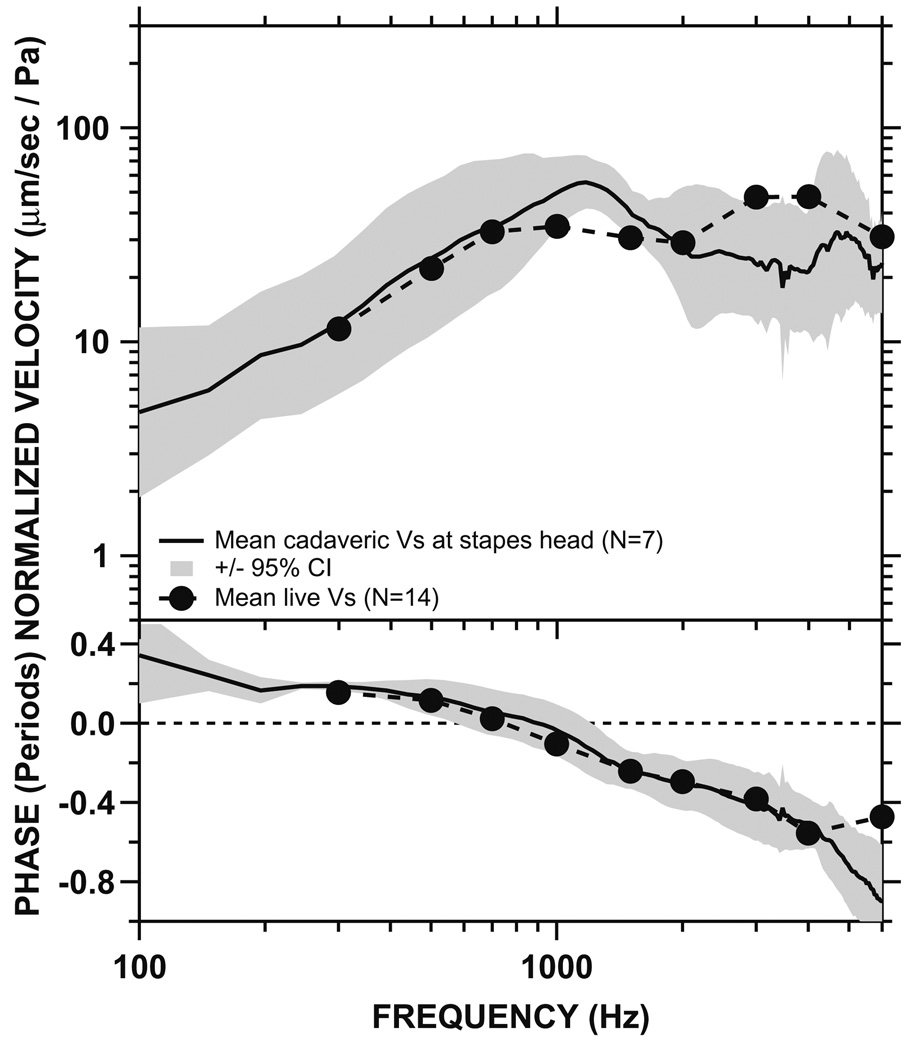
The mean and 95% CI of the Vs measured at the head of stapes in seven cadaveric temporal bones (solid black line and shaded areas), compared to the mean live stapes velocity in the present study (dashed line). Top panel: magnitude. Bottom panel: phase. There were no statistically significant differences between the live and cadaveric data (see also Table 1)
Fig. 9 compares the mean cadaveric Vs measured at the head of stapes with its 95% CI, to our mean live Vs. The magnitudes of the mean cadaveric and live Vs are similar, with both magnitudes increasing at low frequencies and decreasing at higher frequencies. There are some differences between live and cadaveric Vs. For example, the cadaveric Vs magnitude peaks at ~ 1 kHz, whereas the live Vs magnitude peaks at ~ 3–4 kHz. However, the differences between cadaveric and live Vs are small and not statistically significant when examined using student’s t-tests, as shown in Table 1. The mean phase of the cadaveric Vs is also very similar to the mean phase of live Vs, with the two being almost identical below ~4 kHz.
Table 1.
Comparison of stapes velocity in cadaveric and live ears. The magnitudes of mean Vs measured in cadaveric and live ears at various frequencies are shown. T-tests were performed to examine the statistical significance of the observed differences between cadaveric and live ears (shown in Fig. 9) at various frequencies. p-value of <.05 indicates statistical significance at the 5% level.
| Frequency (kHz) | Mean normalized |Vs| (µm/sec/Pa) | p-Value | |
|---|---|---|---|
| Live | Cadaveric | ||
| 0.5 | 23.88 | 34.00 | .38 |
| 1 | 37.78 | 53.15 | .14 |
| 1.5 | 34.18 | 40.53 | .30 |
| 2 | 31.24 | 33.48 | .80 |
| 3 | 53.98 | 29.28 | .06 |
| 4 | 59.68 | 29.38 | .09 |
4. Discussion
4.1. Making intraoperative Vs measurements
We were able to successfully make Vs measurements intraoperatively in patients undergoing cochlear implantation. Such patients are good candidates for live Vs measurements because no additional surgery is required to expose the stapes. All patients enrolled in this study had normal middle ears. In addition to normal otologic examinations and preoperative CT scans, the umbo velocity measurements were normal in all 12 patients tested, as measured by laser-Doppler vibrometry.
In the process of making intraoperative Vs measurements, we encountered some challenges:
We were not able to assess the reproducibility of the measurements, because the amount of time available for measurement during surgery was limited.
The stapes (along with the other ossicles and the tympanic membrane) was sometimes partially covered with fluid and/or blood, requiring frequent suctioning and repositioning of the measurement setup.
The use of reflective tape to increase the signal-to-noise ratio for laser-Doppler vibrometry measurement was not an option, because of the time involved in its application and removal, and the problem of sterilizing such reflectors.
The location of naturally reflective spots on the stapes varied between patients. In order to keep the measurement location consistent, only measurements from the stapes head were included in this study.
The intraoperative estimation of measurement angle was difficult, unlike the case in cadaveric temporal bones. Therefore, any errors in estimation of the measurement angle were likely to be larger in live ears. The measurement angles estimated in the live ears were 65–80° from the axis of piston-like motion of the stapes. The large angles were due to several factors, including the limited opening of the facial recess, the presence of soft tissue and pinna attached to the ear canal, and the limited neck mobility of some patients.
4.2. Comparison of our live Vs measurement with the published data
Our live Vs measurements are very similar in magnitude to the published data by Huber and colleagues (2001)—see Fig. 5. We suspect that the measurement methods used in Huber’s study were similar to ours, since the technique of cochlear implantation was similar.
4.3. Cadaveric Vs at different measurement locations
In the first six cadaveric temporal bones, we made Vs measurements only at the posterior crus of stapes, whereas in the next seven bones, Vs was measured at both the posterior crus and the head of stapes. It has been shown that the human stapes moves mainly in a piston-like motion at frequencies below 1 kHz, whereas the motion at higher frequencies is more complex and involves multiple modes of motion (Hato et al., 2003; Heiland et al., 1999; Decraemer and Khanna, 2004). Our finding that the differences in magnitude between Vs measured at the posterior crus and the head of stapes were small (<2 dB) at frequencies below 1 kHz, and were larger at higher frequencies (Fig 8), is consistent with these ideas. It also illustrates the importance of controlling for different variables (e.g. measurement location, angle, etc.) when comparing measured Vs in live and cadaveric ears. A more complete understanding of Vs motion will undoubtedly require 3D motion measurements.
4.4. Comparison of our live Vs with our cadaveric Vs measurements
When both the measurement angle and location are controlled for, our live Vs data are very similar to our cadaveric Vs measurements made in a similar fashion (Fig. 9). This indicates that the difference between live and cadaveric Vs shown in Fig. 1 can be explained by differences in measurement technique and is not necessarily an intrinsic difference between live and cadaveric ears. As shown in Fig. 1, the largest difference between the live Vs data (Huber et al., 2001) and the cadaveric Vs data (Asai et al., 1999) occurred below 2 kHz. This is precisely the same frequency range where the effects of measurement angle are most evident (see Fig. 2). In our analysis, the differences between the live and cadaveric Vs for frequencies below 2 kHz (shown in Fig. 1) can be explained on the basis of the differences in measurement angle alone. Therefore, the cadaveric temporal bone preparation is a valid model to study human middle-ear mechanics.
4.5. Comparison of live human stapes velocity with other species
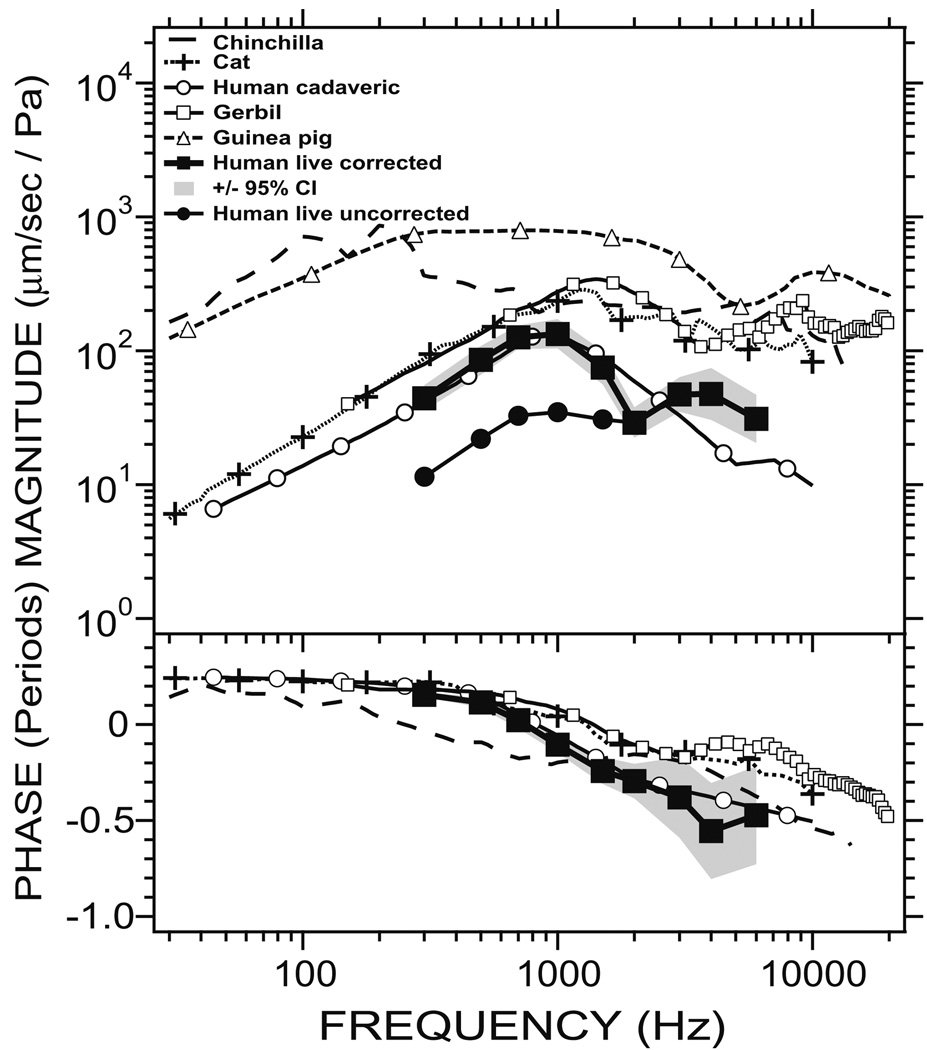
A comparison between our live human Vs measurements and the Vs measurements from other species are shown in Fig. 10. The Vs data from the other species were obtained by various techniques, including the Mössbauer technique (Ruggero et al., 1990; Manley and Johnstone, 1974), stroboscopic illumination (Guinan and Peake, 1967), estimates of round-window volume velocity (Kringlebotn and Gundersen, 1985) and laser-Doppler vibrometry (Ravicz et al., 2008). Also included in the figure is the “corrected” live human Vs from our measurements. The correction refers to a measurement angle correction we applied to our data in order to minimize the effect of measurement angle on the measured Vs (Chien et al., 2006). (The correction to a laser measurement angle of 0° relative to the axis of piston-like stapes motion was equivalent to multiplying the measured data by a frequency-dependent correction factor based on the data of Fig. 2.) All of the measurements shown in Fig. 10 were made with middle-ear cavity opened, except for the human Vs measurement by Kringlebotn and Gundersen (1985). However, since the human middle-ear volume is quite large, it is thought to have a small effect on middle-ear mechanics (Zwislocki 1962; Rosowski et al., 1990; Voss et al., 2000), except in narrow high-frequency ranges where the cavities may resonate (Stepp and Voss, 2005).
Fig. 10.
Comparison of Vs measurements in five species (modified from Fig. 8 in Rosowski et al., 1999). The chinchilla data is taken from Ruggero et al. (1990); the cat data is from Guinan and Peake (1967); the gerbil data is from Ravicz et al. (2008) and the guinea pig data is from Manley and Johnstone (1974). Two sets of human Vs measurements are used: the first is from the present study in live human, and the second is from Kringlebotn and Gundersen (1985), labeled “Human cadaveric”] where cadaveric human temporal bones were used. Data from present study include our mean live human Vs (labeled “Human live uncorrected”) as well as a “corrected” live human Vs (labeled “Human live corrected”) where a measurement angle correction is applied to minimize the effect of measurement angle on the measured Vs magnitude (Chien et al., 2006). Measurement in guinea pig and gerbil at frequencies >20 kHz are not shown.
Our corrected live human Vs is very similar to the human Vs reported by Kringlebotn and Gundersen (1985), both in magnitude and in phase. It is important to note that the human Vs data by Kringlebotn and Gundersen came from measurements of roundwindow volume velocity in cadaveric temporal bones, which was used to estimate the stapes volume velocity. The stapes volume velocity was converted to point velocity by division with a footplate area of 3.2 mm2 (Wever and Lawrence, 1954). The match between our live Vs measurements corrected for measurement angle and the Kringlebotn and Gundersen measurements, which are not affected by observational angle, is reassuring. The measurements of Kringlebotn and Gundersen (1985) are also known to be consistent with more modern measurements of stapes velocity in temporal bones (Voss et al., 2000; Gan et al., 2001).
In a study by O’Connor and Puria (2008), estimation of human stapes velocity was made using model calculation, and this was shown to be similar to a “corrected” version of the live Vs measured by Huber et al. (2001), using the same correction method as in our study (see Fig. 10, also see the text above). Since our live Vs measurements share many similarities to Huber’s measurements, we assume that our live Vs measurements are also similar to the model calculation by O’Connor and Puria (2008).
Our corrected best-estimate of the live human Vs has some similarities and differences with the Vs measured in gerbil (Ravicz et al., 2008), cat (Guinan and Peake, 1967), chinchilla (Ruggero et al., 1990), and guinea pig (Manley and Johnstone, 1974). At the lowest frequencies, the Vs magnitude increases with increasing frequencies in all species. The live human Vs magnitude is similar to the Vs magnitudes in gerbil and cat below 1 kHz, and it is much smaller than the Vs magnitudes in chinchilla and guinea pig. The increase in magnitude with frequency is terminated at a transition frequency that differs across species: 100 Hz in chinchilla, 200 Hz in guinea pig, 800 Hz in human, 1200 Hz in cat and 1600 Hz in gerbil. In humans, there is a clear decrease in magnitude at frequencies above the transition; in the other species there is a nearly flat frequency dependence above the transition (Ravicz et al. argue that in gerbils, at higher frequencies than those depicted here, there is a roll-off in stapes velocity). The phase measurements are similar between human, gerbil, and cat, where a ~0.25-period phase lead is seen at low frequencies, which gradually becomes a phase lag at higher frequencies. The phase of the chinchilla Vs also begins with a phase lead at low frequencies, but the phase lag appears at a much lower frequency than in other species (>200 Hz). The phase was not measured in guinea pig in the study by Manley and Johnstone (1974), so no comparison can be made.
5. Conclusions
We made live Vs measurements in 14 patients who had normal middle ears and were undergoing cochlear implantation. Our live Vs measurements were very similar to published data (Huber et al., 2001). Our live Vs measurements were also very similar to cadaveric Vs measurements we made using identical methods, and using the same measurement location and angle. We conclude that sound transmission through the middle ear is similar in live and cadaveric ears. Comparisons of our live Vs measurements (after a frequency-dependent correction for observation angle) with measurements in live ears of other animals show both similarities and differences. The velocities in all species are stiffness-dominated at low frequencies, but above some transition frequency, the Vs magnitude either flattens or falls off. The transition frequency varies between species as does the Vs magnitude.
Acknowledgements
We thank Diane Jones, William Peake, Jocelyn Songer, and the staff at Eaton-Peabody Lab for their support and inputs. Funded in part by NIDCD (grants R01 DC047998, R01 DC000194, and T32 DC000020), Mr. Axel Eliasen, Mr. Lakshmi Mittal, and the Silverstein Young Investigator Award.
References
- Asai M, Huber A, Goode R. Analysis of the best site on the stapes footplate for ossicular chain reconstruction. Acta Otolaryngol. (Stockh) 1999;119:356–361. doi: 10.1080/00016489950181396. [DOI] [PubMed] [Google Scholar]
- Chien W, Ravicz ME, Merchant SN, Rosowski JJ. The effect of methodological differences in the measurement of stapes motion in live and cadaver ears. Audiol. Neurotol. 2006;11(3):183–197. doi: 10.1159/000091815. [DOI] [PMC free article] [PubMed] [Google Scholar]
- Decraemer WF, Khanna SM. Measurement, visualization and quantitative analysis of complete three-dimensional kinematical data sets of human and cat middle ear. In: Gyo K, Wada H, Hato N, Koike T, editors. Middle Ear Mechanics in Research and Otology. Singapore: World Scientific; 2004. pp. 3–10. [Google Scholar]
- Gan RZ, Dyer RK, Wood MW, Dormer KJ. Mass loading on the ossicles and middle ear function. Ann. Otol. Rhinol. Laryngol. 2001;110(5:1):478–485. doi: 10.1177/000348940111000515. [DOI] [PubMed] [Google Scholar]
- Goode RL, Ball G, Nishihara S. Measurement of umbo vibration in human subjects-methods and possible clinical applications. Am. J. Otol. 1993;14:247–251. [PubMed] [Google Scholar]
- Goode RL, Ball G, Nishihara S, Nakamura K. Laser Doppler vibrometer (LDV)—a new clinical tool for the otologist. Am. J. Otol. 1996;17:813–822. [PubMed] [Google Scholar]
- Guinan JJ, Jr, Peake WT. Middle-ear characteristics of anesthetized cats. J. Acoust. Soc. Am. 1967;41(5):1237–1261. doi: 10.1121/1.1910465. [DOI] [PubMed] [Google Scholar]
- Hato N, Stenfelt S, Goode RL. Three-dimensional stapes footplate motion in human temporal bones. Audiol. Neurotol. 2003;8:140–152. doi: 10.1159/000069475. [DOI] [PubMed] [Google Scholar]
- Heiland KE, Goode RL, Asai M, Huber AM. A human temporal bone study of stapes footplate movement. Am. J. Otol. 1999;20(1):81–86. [PubMed] [Google Scholar]
- Huber A, Linder T, Ferrazzini M, Schmid S, Dillier N, Stoeckli S, Fisch U. Intraoperative assessment of stapes movement. Ann. Otol. Rhinol. Laryngol. 2001;110(1):31–35. doi: 10.1177/000348940111000106. [DOI] [PubMed] [Google Scholar]
- Kringlebotn M, Gundersen T. Frequency characteristics of the middle ear. J. Acoust. Soc. Am. 1985;77(1):159–164. doi: 10.1121/1.392280. [DOI] [PubMed] [Google Scholar]
- Manley GA, Johnstone BM. Middle-ear function in the guinea pig. J. Acoust. Soc. Am. 1974;56(2):571–576. doi: 10.1121/1.1903292. [DOI] [PubMed] [Google Scholar]
- Margolis RH, Goycoolea HG. Multifrequency tympanometry in normal adults. Ear Hear. 1993;14(6):408–413. doi: 10.1097/00003446-199312000-00006. [DOI] [PubMed] [Google Scholar]
- Mehta RP, Ravicz ME, Rosowski JJ, Merchant SN. Middle-ear mechanics of Type III tympanoplasty (stapes columella): I. Experimental studies. Otol. Neurotol. 2003;24(2):176–185. doi: 10.1097/00129492-200303000-00009. [DOI] [PubMed] [Google Scholar]
- O’Connor KN, Puria S. Middle-ear circuit model parameters based on a population of human ears. J. Acoust. Soc. Am. 2008;123(1):197–211. doi: 10.1121/1.2817358. [DOI] [PubMed] [Google Scholar]
- Rabinowitz WM. Measurement of the acoustic input immittance of the human ear. J. Acoust. Soc. Am. 1981;70(4):1025–1035. doi: 10.1121/1.386953. [DOI] [PubMed] [Google Scholar]
- Ravicz ME, Cooper NP, Rosowski JJ. Gerbil middle-ear sound transmission from 100 Hz to 60 kHz. J. Acoust. Soc. Am. 2008;124(1):363–380. doi: 10.1121/1.2932061. [DOI] [PMC free article] [PubMed] [Google Scholar]
- Rosowski JJ, Davis PJ, Merchant SN, Donahue KM, Coltrera MD. Cadaver middle ears as models for living ears: comparisons of middle ear input immittance. Ann. Otol. Rhinol. Laryngol. 1990;99(5 Pt 1):403–412. doi: 10.1177/000348949009900515. [DOI] [PubMed] [Google Scholar]
- Rosowski JJ, Ravicz ME, Teoh SW, Flandermeyer D. Measurements of middle-ear function in the Mongolian gerbil: acoustic and anatomical measurements. Audiol. Neurootol. 1999;4(3–4):129–136. doi: 10.1159/000013831. [DOI] [PubMed] [Google Scholar]
- Rosowski JJ, Nakajima HH, Merchant SN. Clinical utility of laser-Doppler vibrometer measurements in live normal and pathologic human ears. Ear Hear. 2008;29(1):3–19. doi: 10.1097/AUD.0b013e31815d63a5. [DOI] [PMC free article] [PubMed] [Google Scholar]
- Ruggero MA, Rich NC, Robles L, Shivapuja BG. Middle-ear response in the chinchilla and its relationship to mechanics at the base of the cochlea. J. Acoust. Soc. Am. 1990;87(4):1612–1629. doi: 10.1121/1.399409. [DOI] [PMC free article] [PubMed] [Google Scholar]
- Ruggero MA, Temchin AN. Middle-ear transmission in humans: wide-band, not frequency-tuned? Acoust. Res. Lett. Online. 2003;4(2):53–58. doi: 10.1121/1.1566924. [DOI] [PMC free article] [PubMed] [Google Scholar]
- Stepp CE, Voss SE. Acoustics of the human middle-ear air space. J. Acoust. Soc. Am. 2005;118(2):861–871. doi: 10.1121/1.1974730. [DOI] [PubMed] [Google Scholar]
- Voss SE, Rosowski JJ, Merchant SN, Peake WT. Acoustic response of the human middle ear. Hear. Res. 2000;150:43–69. doi: 10.1016/s0378-5955(00)00177-5. [DOI] [PubMed] [Google Scholar]
- Wever EG, Lawrence M. Physiological Acoustics. Princeton, NJ: Princeton University Press; 1954. [Google Scholar]
- Whittemore KR, Jr, Merchant SN, Poon BB, Rosowski JJ. A normative study of tympanic membrane motion in humans using a laser Doppler vibrometer (LDV) Hear. Res. 2004;187(1–2):85–104. doi: 10.1016/s0378-5955(03)00332-0. [DOI] [PubMed] [Google Scholar]
- Zwislocki J. Analysis of the middle-ear function. Part I: Input impedance. J. Acoust. Soc. Amer. 1962;34:1514–1523. [Google Scholar]


