Abstract
Ekins’ ambient analyte theory predicts, counter intuitively, that an immunoassay’s limit of detection can be improved by reducing the amount of capture antibody. In addition, it also anticipates that results should be insensitive to the volume of sample as well as the amount of capture antibody added. The objective of this study is to empirically validate all of the performance characteristics predicted by Ekins’ theory. Flow cytometric analysis was used to detect binding between a fluorescent ligand and capture microparticles since it can directly measure fractional occupancy, the primary response variable in ambient analyte theory. After experimentally determining ambient analyte conditions, comparisons were carried out between ambient and non-ambient assays in terms of their signal strengths, limits of detection, and their sensitivity to variations in reaction volume and number of particles. The critical number of binding sites required for an assay to be in the ambient analyte region was estimated to be 0.1VKd. As predicted, such assays exhibited superior signal/noise levels and limits of detection; and were not affected by variations in sample volume and number of binding sites. When the signal detected measures fractional occupancy, ambient analyte theory is an excellent guide to developing assays with superior performance characteristics.
Keywords: Flow cytometric assays, Suspension arrays, Assay optimization, Specific binding assays, Ambient analyte theory
INTRODUCTION
Theoretical guidelines for optimizing immunoassay performance have evolved from an analysis by Ekins more than two decades ago, which defined conditions for assaying free thyroxin without perturbing its concentration. He reasoned that the equilibrium between bound and free hormone would be undisturbed if only a trace amount of capture antibody were added. [1] Under these “ambient analyte” conditions, Ekins’ analysis also predicted, counter intuitively, that the signal to background ratio would be improved. He hypothesized that ambient analyte conditions and maximum occupancy would be attained whenever the amount of antibody was much less than the product of the equilibrium dissociation constant, Kd, and the reaction volume1 [2]. The insight that large surface areas are not required for high sensitivity2 not only resulted in accurate tests for free hormones, but it led Ekins in 1985 to the concept of high-density, multiplexed assays and microarrays [3–9] and a TSH assay with a limit of detection of 0.0002 mIU/L or 1.4 aM3 [10].
While ambient analyte theory predicts that optimal sensitivity can be attained by maximizing the fractional occupancy of the capture surface, another line of reasoning asserts that it is the total mass of analyte captured that determines the limit of detection. Remarkable sensitivity has been reported with these mass sensing assays where the number of capture sites was far above Ekins’ limit [11,12]. For example, Mirkin and colleagues have reported attomolar sensitivity with a vast excess of antibody-coated magnetic particles.
Sensitivity, however, is determined by a number of factors including signal intensity, nonspecific binding, and variability in the capture surface. Designers of immunoassay systems assume that the reproducibility of results will be proportional to the volumes of sample and reagents added to the reaction cuvette, and automated analyzers contain sophisticated pipetting systems to insure that volumes are precisely aliquoted to minimize variability. However, if the detection scheme measures fractional occupancy, as is the case with both planar and suspension arrays [6,13,14], then under ambient analyte conditions Ekins’ theory predicts that pipetting precision may not be important.
Ambient Analyte theory
For the simplest case where a single species of binding sites captures a homogeneous target analyte, the fraction of binding sites occupied at equilibrium, f, can be expressed as a function of two dimensionless parameters, a and b:
| 1a |
where:
| 1b |
For the dimensionless terms defined in 1b: Γ represents the surface concentration of occupied receptors or bound target in moles/cm2; Γm, the maximum surface concentration of occupied receptors or bound target in moles/cm2; f, the fractional occupancy Γ/Γm; S, the total capture surface area in cm2, V the reaction volume in liters, L; Kd, the equilibrium dissociation constant in moles/L, and Ao the target analyte concentration in moles/L.
Ekins showed that equation 1 reduces to:
| 2 |
whenever the number of binding sites, SΓm, is very much less than VKd, i.e. when b ≪ 1. Under these conditions, the assay is said to be in the ambient analyte region. Since all terms containing S and V have been eliminated in Equation 2, one would predict that the signal representing the fractional occupancy, f, would be independent of the total number of binding sites or target analytes present in the reaction. This would translate into enhanced assay robustness since results would not be affected by errors in sample volume or amount of capture surface added.
While Equation 2 provides the fractional occupancy for a single binding site, it is common for receptors to display heterogeneous binding characteristics especially after immobilization onto a solid phase [15]. In this case, Equation 2 can be modified to accommodate more binding sites. Such an equation for two binding sites would be:
| 3 |
where a1 = A0/Kd1 and a2 = A0/Kd2 are dimensionless variables derived from the equilibrium dissociation constants of the two sites, Kd1 and Kd2; and f1 is the fraction of total binding sites that are of the first kind, (f1) = S1 · Γm1/(S1 · Γm1+ S2 · Γm2).
Furthermore, the degree of heterogeneity of binding sites can be assessed using Sips isotherm:
| 4 |
where h is the heterogeneity index [15].
In this paper, using a two component assay system, we demonstrate the ability of ambient analyte conditions to enhance assay performance and robustness. We examine the binding of labeled anti-goat IgG to immobilized goat IgG in a suspension array format to show that the assay not only exhibits higher sensitivity and signal strength, but it is also much more resistant to deviations in sample volume and the number of particles when in the ambient analyte regime.
METHODS AND MATERIALS
MATERIALS
Carboxyl polystyrene particles (1.27 µm diameter and 1.05 g/ml density) and Rainbow Calibration particles (3 µm diameter) were generously provided by Spherotech (Libertyville, IL). R-Phycoerythrin (R-PE)-conjugated AffiniPure F(ab')2 fragment Donkey Anti-Goat IgG H+L (product number 705-116-147) was purchased from Jackson Laboratories (West Grove, PA, USA). Immunopure whole molecule biotin conjugated Goat IgG (product number 31734) was purchased from Pierce (Rockford, IL, USA). Phosphate Buffered Saline (PBS, pH 7.4) was obtained from Sigma (St. Louis, MI, USA) and used as the standard buffer for particle coating and analyte binding assays. IgG-free Bovine Serum Albumin, also obtained from Sigma, was diluted in PBS and used as a blocker. BD Quantibrite PE Beads were obtained from BD Biosciences (San Jose, CA). Assays were carried out in 0.5 ml polyethylene microcentrifuge tubes.
Particle Coating Procedures
Goat IgG was passively adsorbed to the carboxyl-modified surface of the polystyrene particles (1.27 µm diameter). A 50µl aliquot of stock particles (5% w/v, 2.22×10⁹ particles) was washed three times in PBS and re-suspended in 50µl of the same. The particles were sonicated for 1 minute to prevent aggregation and then 0.15 mg of Goat IgG and enough PBS was added to make a final volume of 100µl. The mixture was immediately vortex mixed to ensure a homogeneous coating on the particles. The coupling was allowed to occur overnight at room temperature with constant mixing in a rotator. The particles were then washed in PBST (PBS containing 0.05% Tween-20) and stored at 4°C in PBS (containing 1% IgG free BSA) at 1% w/v.
Binding Assays
General
Capture particles were sonicated for 1 minute and added to aliquots of target analyte (PE-labeled Anti-Goat IgG) as described below. The assay was incubated overnight (17 hours) in a rotator at room temperature. This insured that equilibrium was achieved for all the assays. At the end of the incubation period, tubes were centrifuged and unbound PE-AntiGoat IgG was separated as supernant from the particles. The particles were washed three times in PBST and analyzed on a flow cytometer. Although flow cytometry assays do not require any wash steps, it was found that it was necessary as it helped remove loosely bound analyte molecules (that may have bound non-specifically).
Particle dilution assay
Particle dilution curves were obtained by incubating a series of particle dilutions (2.67×10⁷ - 1.63×10³ particles, 5.07×10⁻⁸ cm2 per particle, 1.35 to 8.26×10⁻⁵cm2) overnight with target analyte (final concentration of 2.50×10⁻¹⁰moles/L diluted in PBS containing 1% IgG free BSA) in a reaction volume of 100µl.
We compared the effects of changes in volume and the number of binding sites in ambient and non-ambient analyte assays. For the change in volume experiment, the analyte concentration and the total number of particles were held constant. This experiment was carried out by incubating 8.88×10⁵ particles, (surface area 0.045cm2, b = 4.75) or 8.88×10³ particles (surface area 0.000445cm2, b = 0.047) with a fixed target analyte concentration of 2.50×10⁻¹⁰ moles/L at final volumes of 100µ or 200µl.4
The dependence of the response on the total number of particles was determined from the particle dilution assays described above.
Analyte Dilution Assay
To obtain analyte dilution curves, 2.66×10⁶ particles (surface area 0.135cm2, b=14.25) and final analyte concentrations ranging between 5.00×10⁻⁸ moles/L and 3.66×10⁻¹¹moles/L (diluted in 1% IgG-free BSA) were incubated overnight in a reaction volume of 100µl. The fractional occupancy was calculated from the ratio of median particle fluorescence intensity, F, in relative fluorescence units, corrected for background fluorescence, Fb, divided by the background corrected median particle fluorescence obtained with excess target, Fm. Assuming fluorescence intensity is linearly related to the mass of target bound, then f = Γ / Γm = (F − Fb)/(Fm − Fb). The maximum surface concentration, Γm, and the equilibrium dissociation constant, Kd, were determined by nonlinear regression (JMP IN Release 5.1) which determined values of dimensionless parameters a and b in equation 1 that minimized the sum of squared differences between each experimental data point and the model. The physical parameters were then calculated from Kd = Ao/a and Γm = b · VKd/S using the known values of Ao, V, and S.
The value of Kd obtained was verified with an analyte dilution assay carried out using a number of binding sites that was within the ambient analyte region. Approximately 1.78×10⁴ coated particles (surface area 9.00×10⁻⁴ cm2, b=0.095) were assayed with serial dilutions of analyte (9.60×10⁻⁸ to 5.72×10⁻¹³ moles/L). Estimates of Kd were obtained by fitting Equation 2 to the observed data.
The value of Γm was confirmed by quantifying the signal at full occupancy using the BD Quantibrite PE Beads. Quantibrite beads contain four PE intensities at known numbers of PE molecules per bead to provide a simple way of quantifying the PE-conjugated antibodies via flow cytometry.
Flow Cytometry
Fluorescence from bound target was measured using a FACS flow cytometer (Becton Dickinson, San Jose, CA, USA). For a standard sample, around 10,000 particles were excited at 488nm and fluorescence emission was collected in the FL2 channel (585/42 nm). However, for more dilute samples only 2,500 particles were scanned. Flow cytometry data was analyzed using WinMDI (Version 2.8, 2000) and median intensity values were recorded for each sample.
To standardize the measured fluorescence intensities for day-to-day comparison, we read Rainbow Calibration particles on the flow cytometer prior to our samples. Rainbow Calibration particles contain six fluorescence intensities and thus exhibit multiple peaks when seen in the flow cytometer. Each median fluorescence intensity value from our sample was divided by the intensity of the third peak of the calibration particles. Fractional occupancy was then calculated by dividing these values by the calibrated intensity corresponding to full occupancy (Fm).
RESULTS
Determination of maximum occupancy
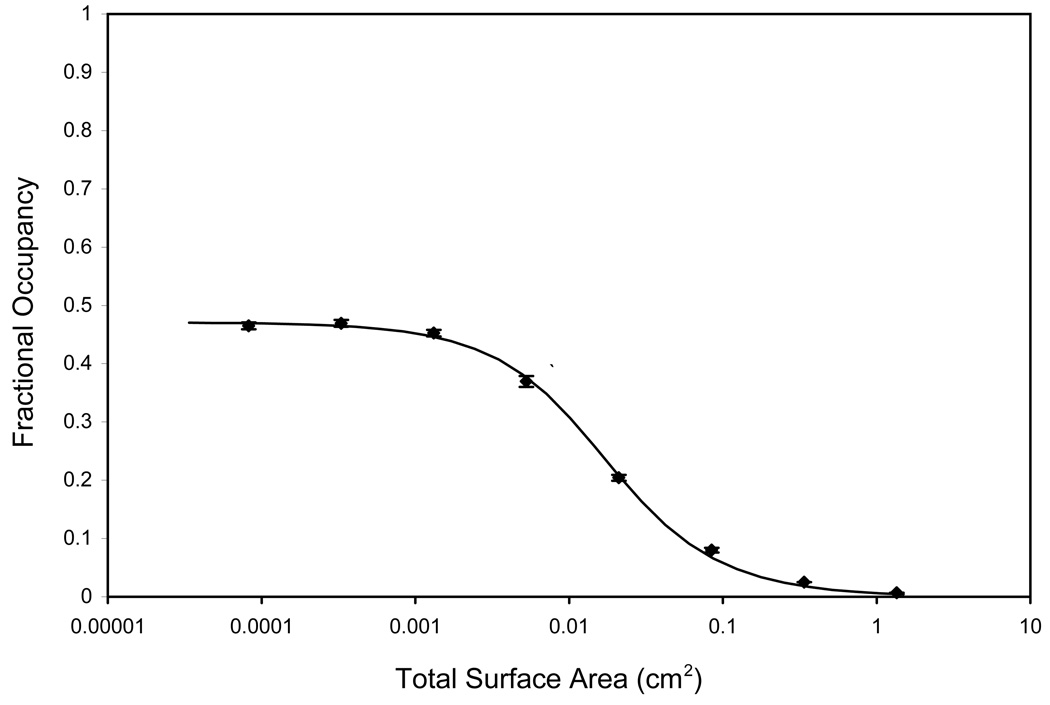
Ambient analyte theory predicts that when the number of binding sites is much less than VKd, fractional occupancy is maximized. As the capture surface area decreased from approximately 1 to 0.0001 cm2 in the particle dilution assay for a final analyte concentration of 2.50×10⁻¹⁰ moles/L (Figure 1), the fractional occupancy increased from 0.006 to a plateau value of 0.47. The analyte concentration was selected to give a plateau fractional occupancy less than 0.5 which indicates A0 < Kd 5. Maximum fractional occupancy was obtained with only 2×10⁴ particles, which was still a sufficient number to achieve good counting statistics in the flow cytometer.
Figure 1.
Particle dilution assay (antibody fractional occupancy vs. surface area) at final target analyte concentration of 2.5 × 10⁻¹⁰ moles/L. The antibody fractional occupancy can be estimated as the measured signal divided by the maximum signal measured at high target analyte concentration. Using non-linear regression to fit Equation 1a to the equilibrium binding data, the best-fit estimates for the dissociation constant (Kd) and capture probe density (Γm) were 0.28 ± 0.004 nmoles/L and 4.00 ± 0.13 pmoles/cm2, respectively.
Estimation of Γm and Kd
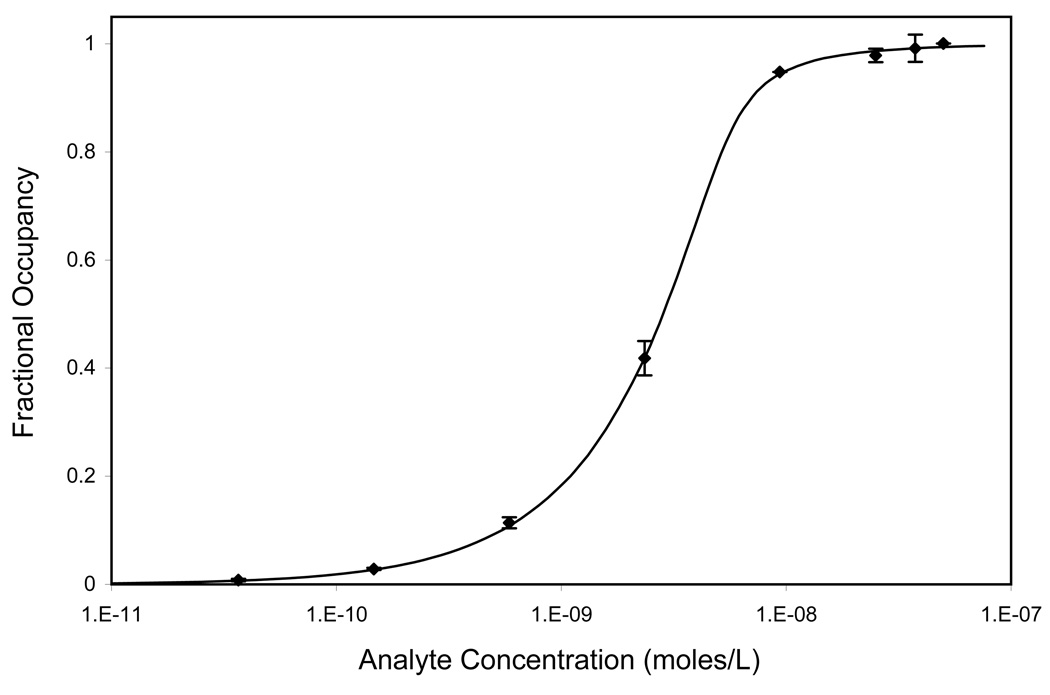
To verify that maximum binding is obtained when b ≪ 1, it is necessary to determine maximum captured target density, Γm, and the equilibrium dissociation constant, Kd, for the binding pair. Both parameters were estimated by fitting Equation 1 to the analyte dilution data (Figure 2) that had been normalized to the maximum signal. The best fit values were 0.27 ± 0.06 nmoles/L for Kd and 3.80 ± 0.09 pmoles/cm2 for Γm.
Figure 2.
Analyte dilution assay (antibody fractional occupancy vs. target analyte concentration) at a total particle surface area of 0.135cm2 (b = 14.25). The best-fit values for Kd and Γm were estimated to be 0.27 ± 0.06 nmoles/L and 3.80±0.09 pmoles/cm2, respectively (Equation 1a).
We also fit the data obtained from the particle dilution curves to Equation 1 and again obtained estimates for Kd and Γm. The best-fit values and confidence intervals were 0.28 ± 0.0035 nmoles/L for Kd and 4.00 ± 0.13 pmoles/cm2 for Γm (Figure 1), which were within the confidence intervals of our initial estimates.6
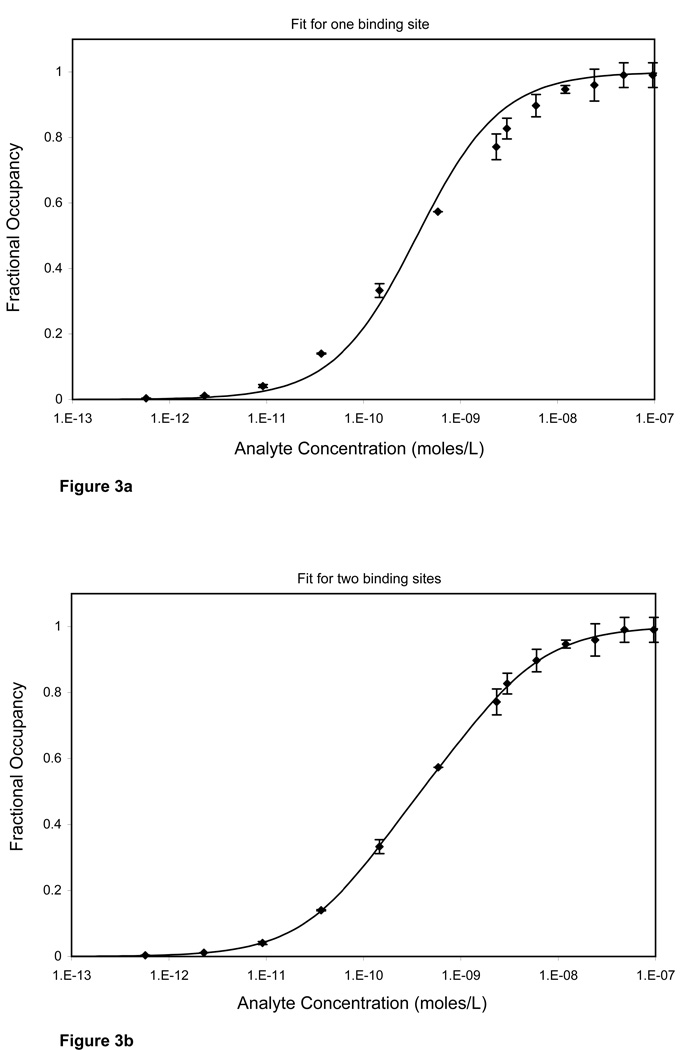
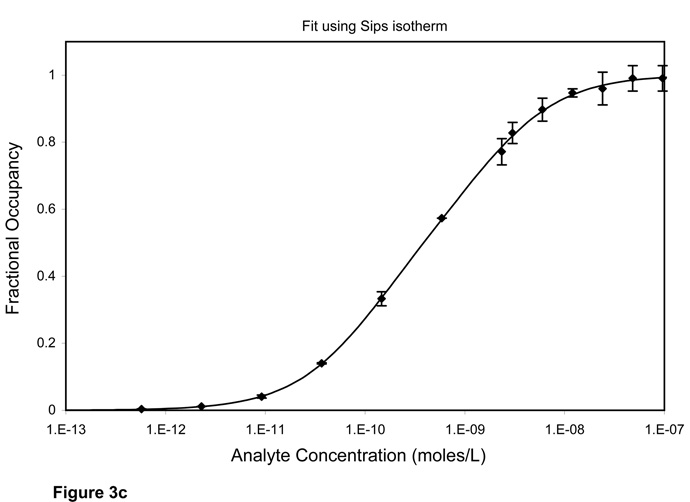
When an assay is in the ambient analyte range, the Kd value can be more easily estimated with a one-parameter model. We fit Equation 2 to analyte dilution curves obtained using number of particles that were within the ambient analyte range as determined from Figure 1. The approximated best-fit value for Kd was 0.36 ± 0.03 nmoles/L (Figure 3a). However, a one-site model did not seem to appropriately fit our data. Instead, a two-site model fit (Equation 3) was found to be more accurate (Figure 3b). The best fit values for Kd1 and Kd2 were 0.11± 0.02 and 1.57 ± 0.29 nmoles/L. The data can also be fit with the Sips isotherm (Equation 4), which is often used to study heterogeneity in solution. The best-fit values using Sips isotherm were 0.41 ± 0.02 nmoles/L for Kd and 0.74 ± 0.02 for the heterogeneity index (Figure 3c).
Figure 3.
Analyte depletion curve carried out under ambient analyte conditions (surface area 0.0009 cm2, b = 0.095). (A) A one-site model (equation 2) is used to fit the data. The best-fit value for Kd is 0.36 ± 0.03 nmoles/L. The one-site model does not fit the data very well. (B) A two-site model (equation 3) is a better fit for the data. The best-fit values for the two classes of binding sites are 0.11 ± 0.02 and 1.57 ± 0.29 nmoles/L for Kd1 and Kd2, and 0.53 ± 0.06 for f1. (C) Sips isotherm (equation 4) is used to fit the data. The best-fit values are 0.41 ± 0.02 nmoles/L and 0.74 ± 0.02 for Kd and heterogeneity index respectively. An F ratio of 89.6 confirms that the two site fit is much better than the one site fit.
The value of the capture probe density estimated from dilution curves was verified by calibrating the intensity signal of the flow cytometer using BD Quantibrite PE Beads. The fluorescence intensity signal corresponding to full occupancy was quantified as 2.54 pmoles/cm2. The estimates for Kd and Γm have been compiled in Table 1.
Table 1.
Parameter estimation through curve fitting.
| Curve | Parameters | |
|---|---|---|
| Γm (pmoles/cm2) | Kd (nmoles/L) | |
| Particle dilution | 4 ± 0.13 | 0.28 ± 0.004 |
| Analyte dilution (one site model in the ambient analyte region) |
0.36 ± 0.03 | |
| Analyte dilution (two site model in the ambient analyte region) |
Kd1 0.11±0.02 Kd2 1.57±0.29 |
|
| Analyte dilution (non ambient analyte region) |
3.8 ± 0.09 | 0.27 ± 0.06 |
| BD Quantibrite PE Beads | 2.54 | |
Robustness of Ambient Analyte Assays
While ambient analyte conditions enhance performance by improving signal levels and minimizing background, they also impact precision by eliminating potential sources of error. In analytical methods that measure fractional occupancy, as is the case with flow cytometric assays, ambient analyte theory predicts that the response will not be dependent on either the reaction volume or the number of particles added.
Response to changes in volume
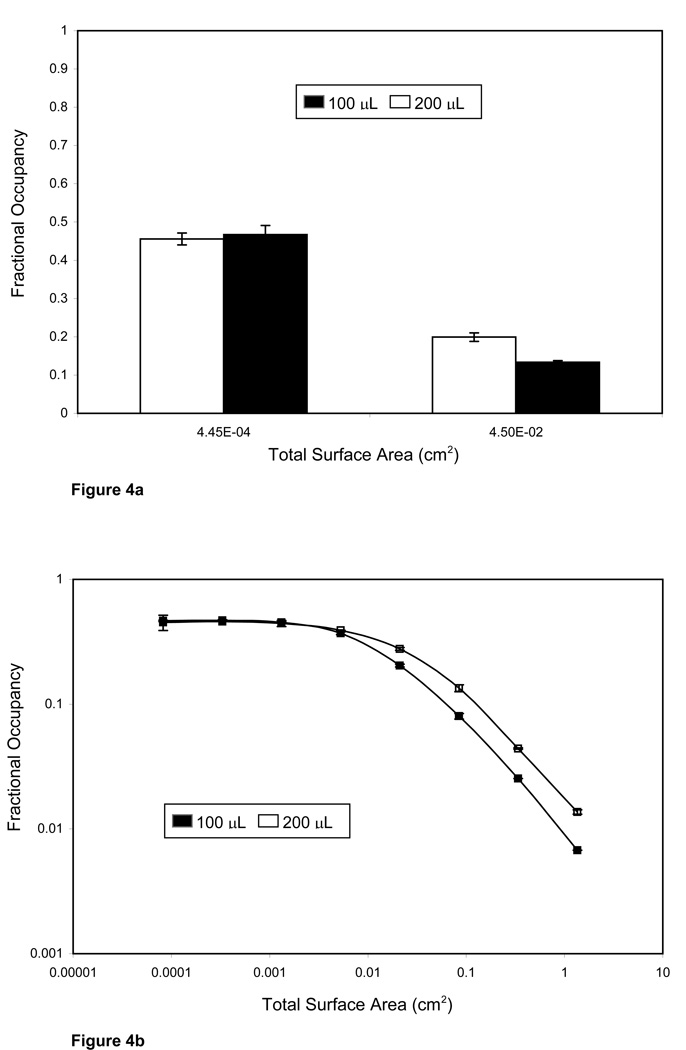
Under ambient analyte conditions, we would expect that changes in the reaction volume would not affect the response for any given concentration of analyte. We choose two assay conditions; one in the ambient analyte range with b= 0.047 (surface area 0.000445cm2), and the other at b= 4.75 (surface area 0.045cm2). At each point, the required number of particles were added to final reaction volumes of 100ul and 200ul. From the data (Figure 4a) it is apparent that the signal measured for the ambient analyte case is insensitive to changes in the reaction volume. For the non-ambient analyte case, however, there is a significant increase in signal when the volume of the reaction is increased from 100ul to 200ul.
Figure 4.
(A) Robustness to changes in total volume (■ 100uL, □ 200uL) between an assay performed in the ambient analyte region (surface area of 0.000445 cm2, b = 4.75), and outside the region (surface area of 0.045 cm2, b = 0.047). At the higher particle concentration fractional occupancy increases significantly (p value <0.0001) as a result of doubling the total reaction volume while at low particle concentration there was no significant difference (p value = 0.16) in fractional occupancy. Data shown represents the average of four replicates ± 2 standard deviations. (B) Response to changes in volume (■ 100uL, □ 200uL) for assays with surface areas ranging from 1.35 to 8.24×10⁻⁵ cm2 at a final analyte concentration of 2.5×10⁻¹⁰ moles/L. The response at higher surface areas (non ambient analyte conditions) is dependent on volume whereas, at low surface areas (less than 0.00131 cm2) the two responses converge showing that the response is solely a function of the analyte concentration to which the antibody is exposed.
We compared the two groups using an unpaired student t-test assuming equal variance. The p-value when the assay was performed in the ambient range was 0.16, which is not significant at the 0.05 level. Under non-ambient conditions, p < 0.0001 indicating a significant difference.
We also obtained particle dilution curves for the assays carried out in final volumes of 100µl and 200µl while maintaining a constant analyte concentration (Figure 4b). The responses from the two curves converge as the assay enters the ambient analyte range (surface area less than 0.00131 cm2) showing that the response is robust to changes in analyte volume.
Response to changes in the number of particles
When an assay is run under ambient analyte conditions, theory predicts that the fractional occupancy of the capture antibody is not dependent on the total number of binding sites and hence a change in the number of particles should not result in a change in signal. The theory is confirmed by the particle dilution response curve (Figure 1). At particle concentrations corresponding to b > 0.1 (total surface area>0.000947cm2), the signal is dramatically decreased by increases in the number of particles present in the assay. However, in the plateau region where b < 0.1, changes in the number of particles do not affect the signal.
In a particle based assay, the number of capture sites, SΓm, is reduced by changing the total surface area, S, while keeping the density of capture sites, Γm, constant. The calibration factors, Fb and Fm, used in calculating fractional occupancy, f = Γ/Γm = (F − Fb) (Fm − Fb), are constant since median background fluorescence per particle, Fb, and maximum median fluorescence per particle, Fm, do not vary with the total number of particles. This behavior may not be seen in other assay formats where the number of capture sites is modulated by varying antibody density.
DISCUSSION
When an assay is performed under ambient analyte conditions, not only is fractional occupancy maximized, but the response is unaffected by either the volume of sample or mass of antibody added. These advantages of operating in the ambient analyte regime have been experimentally verified with a two component fluorescent assay read on a flow cytometer which directly measures binding site occupancy.
Ambient analyte conditions exist whenever the number of binding sites, S · Γm, is much less than the product of the reaction volume and the equilibrium dissociation constant, V · Kd 7. In our two component assay, it was shown that the fractional occupancy increases to a plateau as the number of binding sites is reduced. After estimating Kd and Γm, it was apparent that fractional occupancy was maximized when b was less than 0.1 (1.87×10⁴ particles, total surface area 0.00095 cm2). While this was larger than the value than Ekins predicted [2], smaller differences from the maximum could not be detected because of experimental error.
It should be noted that for assay developers desiring to formulate their assays in ambient analyte conditions, the determinations of Gm and Kd are not required. These determinations were only performed to validate Ekins’ predictions of the region. In practice, a particle dilution curve (Figure 1) is adequate to provide an estimation of the number of particles required to maximize fractional occupancy.
Our experiments also showed the effects of changes in assay volume and number of particles on fractional occupancy under ambient and non-ambient conditions. We found, as predicted (Equation 2), that assays in the ambient analyte region were insensitive to changes in volume and the number of particles. This could be particularly important for point-of-care assays where precise volumes may be difficult to obtain due to lack of operator expertise and equipment.
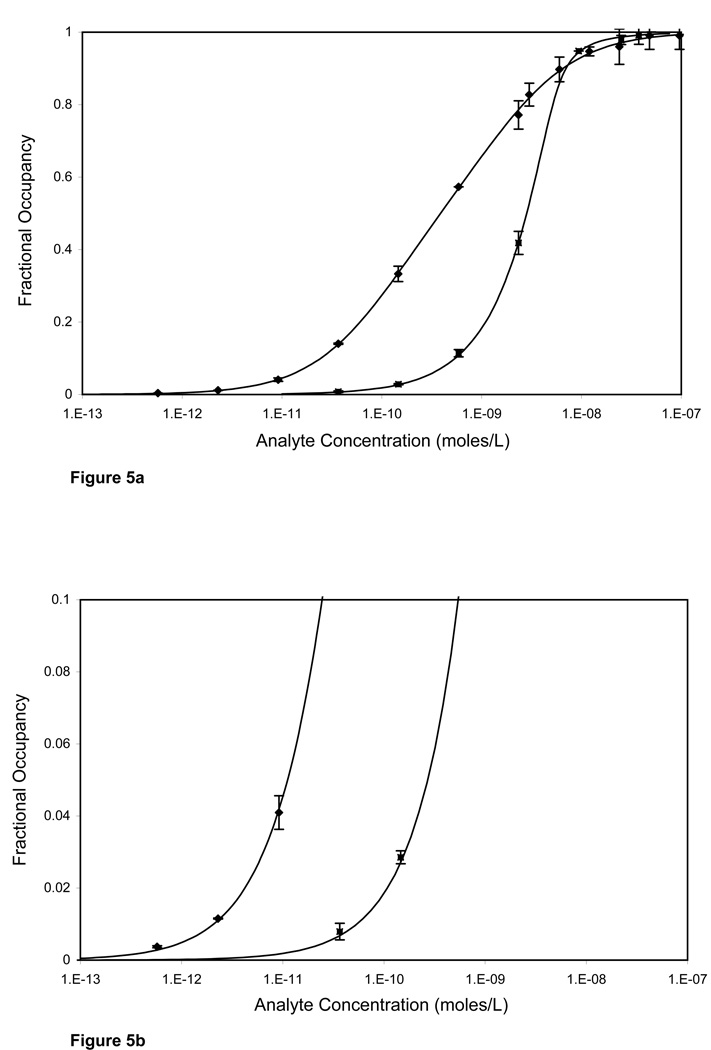
In suspension arrays, sensitivity is a function of the number of fluorophores bound on a particle and the particle background. For our system it, was estimated to be 0.11 pmoles/L in the ambient analyte range (Figures 5a, 5b)8. As the number of particles increases beyond the ambient analyte region, fractional occupancy decreases thereby decreasing sensitivity. Assay sensitivity can be further improved by using higher affinity antibody pairs or smaller particles.
Figure 5.
Comparison of the analyte dilution curves at ambient (♦) and non-ambient analyte (■) conditions. (A) The assay carried out in ambient condition (an area of 0.0009 cm2, b = 0.095) showed a much larger dynamic range compared to the non-ambient analyte conditions (area of 0.135cm2,S · Γm/ V · Kd =14.25). (B) Expanded view of the bottom of the analyte dilution curves. The detection limit for ambient analyte conditions was 0.11 pmoles/L, while that in non-ambient analyte conditions was 2.23 pmoles/L.
While our assays were at equilibrium when measurements were acquired (data not shown), theoretically, ambient analyte conditions should also enhance non-equilibrium end points, and will be the subject of a future study. The kinetics of assays carried out on microparticles and planar arrays have been reviewed elsewhere [16–20].
The ambient analyte principle can be applied to all forms of immunoassays that measure a response proportional to the fraction of binding sites occupied. Saviranta et al. and Dandy et al [8, 9] have demonstrated that planar microarrays operate in the ambient anayte regime. In planar arrays, the ambient analyte region can be reached by reducing the capture spot size. We have demonstrated that suspension arrays can also be formulated in the ambient analyte region, by reducing the number of particles used in the assay.
Although we used a direct assay format in this study, our results would be applicable to sandwich as well since the limiting step in these formats is the binding of analyte to the capture probe. The detector labeled antibody, or secondary antibody, is typically in excess concentration.
By reducing the number of binding sites, the total number of target analyte molecules bound decreases, but the signal per unit area increases due to the reduction in total area. Therefore, assays formulated to operate in the ambient analyte regime are able to detect lower concentrations of target molecules with higher precision. The insensitivity of ambient analyte assays to sample volume and mass of binding sites is critical to the performance characteristics microparticle-based assays and suspension arrays, and possibly also DNA and protein microarrays.
Acknowledgements
We are grateful to Dr. C.J. Wang (Spherotech, Libertyville, IL) for his generous gift of the polystyrene particles and to Dr. William Miller (Northwestern University, Evanston, IL) for the use his flow cytometer.
Grant/Funding Support: This work was supported by a grant from the National Institute of Biomedical Imaging and Bioengineering (R01 EB001418).
Footnotes
Publisher's Disclaimer: This is a PDF file of an unedited manuscript that has been accepted for publication. As a service to our customers we are providing this early version of the manuscript. The manuscript will undergo copyediting, typesetting, and review of the resulting proof before it is published in its final citable form. Please note that during the production process errors may be discovered which could affect the content, and all legal disclaimers that apply to the journal pertain.
Financial Disclosures: None declared.
Ekins used the equilibrium association constant, Ka, in his analysis which is the reciprocal of Kd.
The terms “sensitivity” and “limit of detection” are used interchangeably.
0.0002 mIU/L × 306.7 µg/IU / 28,000 g/mole = 1.4 aM
Values of b were based on parameter estimates Γm = 3.8 × 10⁻¹² moles/cm2 and Kd = 3.6 × 10⁻¹⁰ moles/L and calculated surface area, S = 8.88×105 · 5.07 ×10−8 = 0.045 cm2 using Equation 1b: b = SΓm/VKd= 0.045 · 3.8×10−12/0.0001 · 0.36 ×10−9 = 4.75
In the plateau region where f is independent of b, a = fa/1 − fa and fa < 0.5 implies A0 < Kd.
fa, the asymptotic level to which f converges in the plateau region, can also be used to estimate Kd since fa = a/(1 + a). This gave a value of 0.29 nmoles/L.
More generally, ambient analyte conditions exist whenever the total number of binding sites is much less than the greater of VKd and VA0. Since A0 is generally less than Kd for high sensitivity assays, the VKd limit applies in most cases.
Sensitivity is defined as the analyte concentration corresponding to a signal 2 SD above the mean background signal.
Contributor Information
Zaheer A. Parpia, Department of Biomedical Engineering, Northwestern University, Evanston, IL.
David M. Kelso, Department of Biomedical Engineering, Northwestern University, Evanston, IL.
REFERENCES
- 1.Ekins RP. Towards immunoassays of greater sensitivity, specificity and speed: An overview. In: Albertini A, Ekins R, editors. Monoclonal Antibodies and Developments in Immunoassay. Amsterdam: Elsevier, North-Holland Biomedical Press; 1981. pp. 3–21. [Google Scholar]
- 2.Ekins RP. Ambient Analyte Assay. In: Wild D, editor. The Immunoassay Handbook. 3rd Edition. New York: Elsevier, Stockton Press; 2005. pp. 48–62. [Google Scholar]
- 3.Ekins RP. Current concepts and future developments. In: Collins WP, editor. Alternative Immunoassays. New York: John Wiley & Sons Ltd.; 1985. pp. 219–237. [Google Scholar]
- 4.Ekins RP, Chu FW, Biggart E. Development of microspot multianalyte ratiometric immunoassay using dual fluorescent-labelled antibodies. Anal. Chim. Acta. 1989;227:73–96. [Google Scholar]
- 5.Ekins RP, Chu FW. Multianalyte microspot immunoassay--microanalytical" compact disk" of the future. Clin. Chem. 1991;37:1955–1967. [PubMed] [Google Scholar]
- 6.Ekins R, Chu F, Biggart E. Multispot, multianalyte, immunoassay. Ann. Biol. Clin. (Paris) 1990;48:655–666. [PubMed] [Google Scholar]
- 7.Ekins RP. Ligand assays: from electrophoresis to miniaturized microarrays. Clin. Chem. 1998;44:2015–2030. [PubMed] [Google Scholar]
- 8.Saviranta P, Okon R, Brinker A, Warashina M, Eppinger J, Geierstanger BH. Evaluating sandwich immunoassays in microarray format in terms of the ambient analyte regime. Clin. Chem. 2004;50:1907–1920. doi: 10.1373/clinchem.2004.037929. [DOI] [PubMed] [Google Scholar]
- 9.Dandy DS, Wu P, Grainger DW. Array feature size influences nucleic acid surface capture in DNA microarrays. PNAS. 2007;104:8223–8228. doi: 10.1073/pnas.0606054104. [DOI] [PMC free article] [PubMed] [Google Scholar]
- 10.Ekins RP, Chu FW. Binding assay employing labeled reagent. US Patent 5,516,635. 1996
- 11.Silzel JW, Cercek B, Dodson C, Tsay T, Obremski RJ. Mass-sensing, multianalyte microarray immunoassay with imaging detection. Clin. Chem. 1998;44:2036–2043. [PubMed] [Google Scholar]
- 12.Nam JM, Thaxton CS, Mirkin CA. Nanoparticle-based bio-bar codes for the ultrasensitive detection of proteins. Science. 2003;301:1884–1886. doi: 10.1126/science.1088755. [DOI] [PubMed] [Google Scholar]
- 13.Sklar LA, Finney DA. Analysis of Ligand-Receptor interactions with the Fluorescence Activated Cell Sorter. Cytometry. 1982;3:161–165. doi: 10.1002/cyto.990030304. [DOI] [PubMed] [Google Scholar]
- 14.Nolan JP, Sklar LA. Suspension array technology:evolution of the flat array paradigm. Trends Biotechnol. 2002;20:9–12. doi: 10.1016/s0167-7799(01)01844-3. [DOI] [PubMed] [Google Scholar]
- 15.Vijayendran RA, Leckband DE. A Quantitative Assessment of Heterogeneity for Surface-Immobilized Proteins. Langmuir. 1999;15:6829–6836. doi: 10.1021/ac000523p. [DOI] [PubMed] [Google Scholar]
- 16.Stenberg M, Stiblert L, Nygren H. External diffusion in solid-phase immunoassays. J. Theor. Biol. 1986;120:129–140. doi: 10.1016/s0022-5193(86)80169-2. [DOI] [PubMed] [Google Scholar]
- 17.Stenberg M, Nygren H. Kinetics of antigen-antibody reactions at solid-liquid interfaces. J. Immunol. Methods. 1988;113:3–15. doi: 10.1016/0022-1759(88)90376-6. [DOI] [PubMed] [Google Scholar]
- 18.Berg OG, von Hippel PH. Diffusion-controlled macromolecular interactions. Annu. Rev. Biophys. Biophys. Chem. 1985;14:131–160. doi: 10.1146/annurev.bb.14.060185.001023. [DOI] [PubMed] [Google Scholar]
- 19.Henry MR, Stevens PW, Sun J, Kelso DM. Real-Time Measurements of DNA Hybridization on Microparticles with Fluorescence Resonance Energy Transfer. Anal. Biochem. 1999;276:204–214. doi: 10.1006/abio.1999.4344. [DOI] [PubMed] [Google Scholar]
- 20.Crank J. The Mathematics of Diffusion. Oxford: Clarendon Press; 1979. p. 102. [Google Scholar]


