

Abstract
Recent studies have demonstrated that GABAergic synaptic transmission among neostriatal spiny projection neurons (SPNs) is strongly modulated by dopamine with individual connections exhibiting either D1 receptor (D1R)-mediated facilitation or D2 receptor (D2R)-mediated inhibition and, at least in some preparations, a subset of connections exhibiting both of these effects. In light of the cell type-specific expression of D1aR in striatonigral and D2R in striatopallidal neurons and the differential expression of the other D1 and D2 family dopamine receptors, we hypothesize that the nature of the dopaminergic modulation is specific to the types of SPNs that participate in the connection. Here the biophysical properties and dopaminergic modulation of intrastriatal connections formed by striatopallidal neurons were examined. Contrary to previous expectation, synapses formed by striatopallidal neurons were biophysically and pharmacologically heterogeneous. Two distinct types of axon collateral connections could be distinguished among striatopallidal neurons. The more common, small-amplitude connections (80%) exhibited mean IPSC amplitudes several times smaller than their less frequent large-amplitude counterparts, principally because of a smaller number of release sites involved. The two types of connections were also differentially regulated by dopamine. Small-amplitude connections exhibited strong and exclusively D2R-mediated presynaptic inhibition, whereas large-amplitude connections were unresponsive to dopamine. Synaptic connections from striatopallidal to striatonigral neurons exhibited exclusively D2R-mediated presynaptic inhibition that was similar to the regulation of small-amplitude connections between pairs of striatopallidal cells. Together, these findings demonstrate a previously unrecognized complexity in the organization and dopaminergic control of synaptic communication among SPNs.
Introduction
Although the existence of a dense network of functional inhibitory synaptic connections among neostriatal spiny projection neurons (SPNs) has been convincingly demonstrated (Czubayko and Plenz, 2002; Tunstall et al., 2002; Guzmán et al., 2003; Koos et al., 2004; Taverna et al., 2008), the importance and exact function of this network remains unclear. Clues suggesting an important function for this network emerged from the recognition that collateral synapses exhibit cell type-specific biophysical properties and complex neuromodulatory control (Tecuapetla et al., 2007; Taverna et al., 2008). Of particular interest, collateral synapses of SPNs have been shown to be strongly modulated by dopamine (Guzmán et al., 2003; Tecuapetla et al., 2007; Taverna et al., 2008). Two distinct modulatory mechanisms have been identified, one facilitating transmission through presynaptic D1 receptors (D1Rs) and another resulting in the attenuation of transmission through similarly presynaptic D2 receptors (D2Rs). The presynaptic locus of these modulatory effects (Guzmán et al., 2003; Tecuapetla et al., 2007) and the selective expression of D1a and D2 receptors, respectively, in neurons of the direct (striatonigral) and indirect (striatopallidal) pathways (Gerfen et al., 1990; Le Moine and Bloch, 1995; Yung et al., 1995; Surmeier et al., 1996) suggest that the nature of the dopaminergic modulation may be primarily determined by the identity of the presynaptic neuron. This idea would also be consistent with the previously characterized D1 receptor-mediated enhancement of striatonigral GABAergic IPSCs (Radnikow and Misgeld, 1998) as well as with the D2 receptor-mediated attenuation of striatopallidal IPSCs (Cooper and Stanford, 2001). Furthermore, in view of the reciprocal interconnectivity between SPNs of the direct and indirect pathways (Yung et al., 1996; Smith et al., 1998; Taverna et al., 2008), such a connection-specific dopaminergic modulation may contribute to the opponent regulation of the activity of the striatal output pathways.
This picture is further complicated, however, by the existence of synaptic connections between SPNs of the same subtype (Yung et al., 1996; Smith et al., 1998; Taverna et al., 2008) and by the observation that, at least in the neonatal animals previously examined, some synapses of SPNs appear to be regulated by both D1 and the D2 receptors (Tecuapetla et al., 2007). Because the dual regulation of these synapses was studied using sequential application of selective agonists, it is not clear which of the two effects will be dominant at individual connections in the mature striatum under more physiological conditions of receptor activation or whether interactions of the D1 and D2 receptor signaling mechanisms result in dopaminergic effects distinct from the purely D1R- and D2R-mediated ones.
Consequently, understanding the contribution of the regulation of synaptic connections of SPNs to the overall dopaminergic control of striatal activity requires a description of the effects of dopamine on the four types of connections defined by the identities of the participating presynaptic and postsynaptic SPNs. We focus here on the modulation of the axon collateral inhibition among striatopallidal SPNs and between striatopallidal and striatonigral SPNs.
Materials and Methods
Slice preparation.
Most recordings were obtained from FVB mice in which bacterial artificial chromosome vectors (BACs) were used to genetically target the expression of enhanced green fluorescent protein (EGFP) under control of the regulatory sequences of the D2 receptor gene (Gong et al., 2003). Adult mice (60–120 postnatal days) of both sexes were used. Reverse transcription (RT)-PCR experiments were performed in slices from Sprague Dawley rats (43.6 ± 1.8 d postnatal; range, 38–56 d). Surgical procedures were performed in accordance with the National Institutes of Health Guide to the Care and Use of Laboratory Animals and with the approval of the Rutgers University Institutional Animal Care and Use Committee. Animals were deeply anesthetized with ketamine/xylazine (90 and 15 mg/kg, i.p., respectively) and transcardially perfused with partially frozen perfusion solution containing the following (in mm): 242.0 sucrose, 2.5 KCl, 0.0 or 0.5 CaCl2, 7.0 MgCl2, 28.0 NaHCO3, 1.25 NaH2PO4, 10.0 glucose, and 15.0 sodium pyruvate (saturated with 95% O2/5% CO2). Mice and rats were perfused with 20–30 ml and ∼60 ml of solution respectively, at high rates (∼15–30 ml/min), and 250–350 μm slices were cut in the same solution in an oblique-to-horizontal plane parallel to the corticostriatal fiber bundles (Koos et al., 2004). Slices were stored at 35°C in normal Ringer's solution for 10 min and then gradually cooled to room temperature. The normal Ringer's solution contained the following (in mm): 125.0 NaCl, 2.0 KCl, 1.1 or 2.0 CaCl2, 1.0 MgCl2, 25.0 NaHCO3, 1.25 NaH2PO4, 10.0 glucose, and 3 or 15.0 sodium pyruvate (saturated with 95% O2/5% CO2). Atropine (10 μm) was present throughout all recordings, and all recordings were obtained at room temperature.
Whole-cell and perforated patch recording.
Recordings were obtained with 1.5 mm outer diameter borosilicate pipettes exhibiting 4–8 MΩ resistances in vitro. Postsynaptic neurons were voltage clamped at −70 mV in standard whole-cell configuration. The internal solution for the postsynaptic cell contained the following: 125.0 mm CsCl, 0.1 mm EGTA, 10.0 mm HEPES, 2.0 mm MgCl2, 4.0 mm Na2-ATP, 0.4 mm Na2-GTP, 50.0 μm Alexa 594, and, in some cases, 0.25–0.4% biocytin (ECl− = 0 mV).
Perforated patch-clamp recordings were used in the presynaptic cell to prevent rundown of the IPSCs (see Results) (see Fig. 1). The internal solution for the presynaptic cell contained the following: 130.0 mm K-gluconate, 10.0 mm KCl, 10.0 mm HEPES, 2.0 mm MgCl2, 4.0 mm Na2ATP, 0.4 mm Na2GTP, 50.0 μm Alexa 594, and 0.25 mg/ml amphotericin B (from a daily prepared stock of 100 mg/ml in DMSO). Pipettes were tip filled with a small volume of normal internal solution without amphotericin B or Alexa 594 and then backfilled with antibiotic-containing solution to facilitate seal formation. Series resistance reached a stable level of 30–40 MΩ in 30–45 min. The maintenance of an intact perforated patch was followed by detecting the absence of abrupt changes in access resistance and was verified by the exclusion of Alexa 594 from the neuron at the end of the experiment. Recordings in which an intact seal could not be maintained were excluded from analysis.
Figure 1.

Presynaptically mediated rundown of synaptic transmission among SPNs. A, Scatter plot of IPSC amplitudes versus time. IPSC amplitude exhibited profound time-dependent decay in 75% of connections (filled dots). The remaining connections were stable during a comparable period (open dots). The amplitude averages calculated at three time points (1–3 in graph) are shown (right). Note that the presynaptic neuron is recorded in voltage-clamp mode (top trace). B, Spontaneous miniature IPSCs and EPSCs recorded before (trace 1) and after (trace 3) rundown of the elicited response in a representative pair. The average of miniature PSCs recorded in two 5-min intervals before and after rundown are shown overlaid at the bottom. Note the absence of change in the PSC amplitude. A photomicrograph of an Alexa 594-filled pair exhibiting rundown is shown on the right. The presynaptic and postsynaptic neurons are indicated by the open and filled arrowheads, respectively. Note the presence of dendritic spines in the postsynaptic cell (inset). C, Scatter plot of IPSC amplitudes versus time recorded in presynaptic perforated patch-clamp and postsynaptic whole-cell recording modes. The amplitude remained stable over a 20 min recording period. The average IPSCs calculated at three times points (1–3 in graph) are shown on the right. D, Membrane potential responses to injected current (bottom left) in the presynaptic neuron demonstrate typical characteristics of SPNs. Top traces are simultaneous postsynaptic recordings. A photomicrograph of the same pair (right) shows the exclusion of Alexa 594 from the presynaptic neuron (open arrowhead) recorded in perforated patch-clamp mode. A connected postsynaptic pair (filled arrowhead) and a briefly recorded unconnected postsynaptic neuron (asterisk) are indicated. Spine-laden part of a dendrite of the postsynaptic cell is shown in the inset. E, Trains of IPSCs recorded at different postsynaptic holding potentials (top traces) with the first IPSC amplitudes plotted against the holding potential (graph). The IPSC reversal potential is −2 mV. Calibration: 20 pA, 30 mV, and 50 ms. F, Bicuculline (Bic) application reversibly blocks the PSC between SPNs, indicating that the response is a GABAA IPSC.
Presynaptic cells were voltage clamped at −70 mV during the collection of IPSCs. Unclamped presynaptic action potentials were elicited with 5 ms command pulses of 70–150 mV (adjusting the pulse amplitude if the access resistance changed). Presynaptic neurons were stimulated in this mode because this procedure appeared to increase the longevity of the perforated patch. Data collection was initiated after 15–20 min of perforation that yielded sufficiently low access resistance to allow clearly detectable stimulation of the recorded neuron. Although gradual reduction in access resistance continued for a more extended period, this had no effect on the activation of the presynaptic neuron or the amplitude of the recorded IPSCs (see Fig. 1C).
Data acquisition.
Recordings were made with a Molecular Devices Multiclamp 700B amplifier and digitized with an ITC-1600 (InstruTECH Corporation) board. Data collection was performed using AxoGraph X version 1.0.7. Fast capacitance cancellation was used in all recordings. Slow capacitance cancellation was used only periodically to determine access resistance and when the series resistance compensation circuit was engaged. Access resistance was monitored periodically using the slow capacitance cancellation circuit and was maintained at a low value when necessary by applying small pressure pulses to the postsynaptic pipette before data collection. Postsynaptic voltage-clamp recordings were discarded if the uncompensated access resistance exceeded 30 MΩ. Series resistance (Rs) values were typically 10–25 MΩ. In some cases, series resistance was compensated for by <35% with a correction circuit. Presynaptic and postsynaptic recordings were filtered at 10 and 1–2 kHz, respectively, and digitized at 20 kHz.
Connected pairs were found by first obtaining a perforated patch recording from an SPN in voltage-clamp mode and then conducting a serial search for a second SPN that responded to evoked spikes in the first neuron with an IPSC (see Fig. 1D, asterisk). Only those pairs in which the both neurons were identified as an SPN were used for analysis (see below). All of the reported data refer to IPSCs that were elicited by stimulating the presynaptic neuron in perforated patch mode. In most cases, at the end of the experiment, it was possible to rupture the seal and obtain whole-cell access allowing the Alexa 594 to fill the presynaptic cell, resulting in staining that allowed visualization of spiny dendrites and morphological identification of the presynaptic neuron as an SPN (see Fig. 2).
Figure 2.

Biophysical characterization of the two types of connections between EGFP-containing striatopallidal neurons. A, Electrophysiological identification of presynaptic neurons as SPNs. Membrane potential responses of the presynaptic neuron of one of the large-amplitude connections exhibiting typical characteristics of SPNs. The same characteristics were shown by presynaptic neurons forming small-amplitude connections. B, Morphological characterization of the recorded neurons. Confocal microscopic composite images of a pair of D2–EGFP+ SPNs that formed a large-amplitude connection (middle) obtained after paraformaldehyde fixation. The neurons were filled with Alexa 594; in the case of the presynaptic neuron, after rupturing the perforated patch at the end of the recording. The left two pictures are higher-resolution images showing dendritic spines in both neurons, demonstrating that both are SPN cells. The targeted EGFP+ neurons are shown on the right (top and middle, top 2 arrowheads). The intracellularly filled somata of the neurons are shown in the middle (red). The correspondence between the labeled neurons and the originally targeted ones is demonstrated by the fading of the EGFP signal clearly visible before recording (top 2 arrowheads, top right image) from the recorded neurons after establishing whole-cell access (bottom image, top 2 arrowheads point to the locations of the cells). Surrounding neurons that were not subject to whole-cell recording exhibit little or no change in fluorescence during the same period (compare top and bottom, bottom arrowhead). Note that the larger number of cells seen in the middle results is attributable to the larger thickness of the optical section portrayed. C, Representative examples of IPSCs elicited at small-amplitude (top left traces) and large-amplitude (top right) connections. Note the smaller amplitude variance and higher failure rate of the small-amplitude connection. Cumulative IPSC amplitude histogram shown (bottom) shows clearly bimodal distribution among striatopallidal connections. D, Multidimensional comparison of the biophysical properties of the two types of connections. The first IPSC mean amplitude, transmission probability [i.e., 1, failure rate; probability to the first action potential (AP1)], and the CV are plotted for each connection in a three-dimensional space. Note the marked segregation of two clusters of connections along all three dimensions, corresponding to the two types of connections. Red dots are vertical projections to the amplitude–transmission probability plane.
Drugs were applied in the bath at concentrations as shown in Results or using pressure application as indicated. Pressure application of dopamine (200–500 μm dopamine and 10 μm sodium metabisulfite in extracellular buffer) was performed with whole-cell pipettes positioned ∼100 μm from the recorded neurons. Pressure (∼1–20 psi) was applied with a 10 cc syringe under manual control.
Identification of the recorded spiny projection neurons subtypes.
Because the aim of the study was to determine the effect of dopamine on specific synapses formed by striatopallidal projection neurons, it was important to ensure that all neurons could be accurately identified. A combination of three strategies were used for this purpose. First, in most experiments, recordings were obtained from transgenic mice engineered to express EGFP as a fluorescent reporter under the control of the regulatory sequences of the D2R gene. EGFP expression has been demonstrated to localize to D2R-immunoreactive (D2R+) neurons as well as to enkephalin-immunoreactive (ENK+) neurons in these animals (Gong et al., 2003; Day et al., 2006; Gertler et al., 2008), which provides direct confirmation of their identity as striatopallidal neurons. Targeting striatonigral neurons in these animals on the basis of an apparent absence of EGFP expression is potentially problematic because low levels of EGFP expression may be missed with the epifluorescence microscopy used for slice recording (Shuen et al., 2008) (for opposing evidence, see Matamales et al., 2009). Two control strategies were used to address these concerns. First, in a subset of the experiments targeting striatonigral SPNs in the D2R–EGFP animals, retrograde labeling from the substantia nigra was performed to identify these neurons (Morishima and Kawaguchi, 2006; Wang et al., 2006). The second control strategy involved paired recordings from rat slices in which both the presynaptic and postsynaptic neurons were identified with single-cell RT-PCR for the detection of enkephalin and substance P (SP) mRNA, two widely accepted specific markers of the SPN subtypes (Surmeier et al., 1996).
Because D2Rs may also be expressed by interneurons, the recorded presynaptic cells were routinely characterized physiologically and, in all cases, exhibited characteristics typical of SPNs (see Results). Postsynaptic neurons, which could not be identified electrophysiologically because of the presence of Cs+ in the internal solution, were identified morphologically as SPN by intracellular staining with Alexa 594 as described above. The same was attempted in all presynaptic neurons as well, but, in some instances, the use of perforated patch recording prevented break-in and/or sufficient labeling for morphological characterization. Finally, to alleviate the potential concern of accidentally patching a neuron under differential interference contrast that was not the one that was preselected using fluorescence imaging, we routinely monitored the EGFP fluorescence that faded over time in whole-cell recordings as a result of dialyzation. As shown in Figure 2C, the fluorescent signal disappears after several minutes of whole-cell recording, in contrast to the constant intensity of fluorescence observed in neurons that were not subject to whole-cell dialyzation. This test was also performed in several perforated patch recordings by breaking the membrane at the end of the experiment (see Fig. 2C).
Retrograde labeling.
In three cases, rhodamine latex microspheres (Lumafluor) were injected into substantia nigra to retrogradely label striatonigral neurons in D2R–EGFP mice. Mice were anesthetized with ketamine/xylazine (90 and 15 mg/kg, i.p., respectively) and installed in a stereotaxic frame. A small burr hole was drilled overlying substantia nigra at coordinates (from bregma) −3.3 mm anteroposterior and 1.2 mm lateral. Glass micropipettes (2 mm outer diameter) were pulled on a Narishige PE-2, and the tips were broken back to 10–15 μm (outer diameter) under microscopic control and filled with a solution of undiluted fluorescent microspheres. Pipettes were lowered into the middle of the pars reticulata (at −4.7 mm depth from the dura). Injections were made with a picospritzer (using pulses of 5–20 psi, 40 ms), and 100–150 nl were injected under visual control. Slices were prepared after 1 week of recovery.
Single-cell RT-PCR.
Experiments were conducted in semi-sterile RNase-free environment. Sterile gloves and masks were worn by personnel. Pipette glass was baked at >200°C for 4–6 h to eliminate RNase (Jonas et al., 1994; Geiger et al., 1995). Electrode holders and other relevant equipment were autoclaved or rinsed with RNase Away (Invitrogen) and 100% ethanol. Between each recording, the screw caps and gaskets of the electrode holders (Axoclamp 700B electrode holders; Molecular Devices) were removed and rinsed in RNase Away, followed by a rinse in RNase-free 100% ethanol (Invitrogen) and aired dried blowing with filtered air. The Ag/AgCl-coated lead wire was rinsed with DEPC-treated RNase free water and dried in place. Intracellular recording solutions were prepared carefully in RNase-free environment with RNase-free chemicals or chemicals dedicated to this purpose and using RNase-free but not DEPC-treated water. The presynaptic internal solution contained the following (in mm): 125.0 K-gluconate, 16.0 KCl, 10.0 HEPES, 23.25 sucrose, 4.0 Mg-ATP, and 0.4 Na2-GTP. The postsynaptic internal solution contained the following (in mm): 16.0 K-gluconate, 125.0 CsCl, 10.0 HEPES, 12.0 sucrose, 4.0 Mg-ATP, and 0.4 Na2-GTP. pH was adjusted to ∼7.25 by adding 180 μl of 1N NaOH to the presynaptic and 210 μl of 1N NaOH to the postsynaptic solution (20 ml), which also contributed, respectively, ∼8 and 10 mm Na+ ions. The osmolarity of the solutions was ∼300 mmol/kg. The solutions were filtered using a sterile 0.22 μm syringe filter, aliquoted, and stored at −20°C. The absence of RNase contamination was verified with RNase Alert (Ambion). Each vial was centrifuged for ∼3 min at 5000 rpm before use. For backfilling pipettes, Eppendorf 20 μl plastic fillers were cut and inserted into 1 cc plastic syringes and autoclaved at 120–130°C for 1 h. The fillers were kept RNase free by storing in an airtight sterile container. The extracellular solution was prepared without any specific procedure aimed at reducing potential RNase contamination. Neuronal mRNA was collected by harvesting the cytoplasm of the recorded neurons at the end of the recording experiments. To ensure the collection of sufficiently large amounts of material, low-resistance pipettes (1.75–4 MΩ) were used for both presynaptic and postsynaptic neurons. Recording times were limited to <10 min, usually to ∼5 min. At the end of the recording, the pipettes were carefully withdrawn, ensuring in many cases that an intact seal with the neuron or an intact outside-out patch was retained until the pipette was outside of the slice to avoid contamination from extracellular mRNA and RNase. The pipette was then lifted from the bath and rinsed with a strong flow of DEPC-treated water ejected from a 27 gauge needle. The pipette contents (∼2–4 μl) were expelled into RNase-free 0.5 ml PCR tubes containing 5 μl of DEPC-treated H20, 1 μl of Superase RNase inhibitor (Ambion), 1 μl of 0.1 m dithiothreitol (DTT), and 1 μl of oligo-dT12–18 primer (Invitrogen), briefly centrifuged, and stored at −20°C for <2 weeks.
The samples were subsequently processed by heating to 65°C for 5 min and then cooled on ice to inactivate cellular enzymes and linearize RNA. Single-strand cDNA was synthesized by adding 9 μl of a solution containing 4 μl of first-strand buffer (Superscript-II RT; Invitrogen), 2 μl of dNTP (10 mm), 2 μl of DTT, 1 μl of RNase Out (Invitrogen), and 1 μl of Superscript-II reverse transcriptase (Invitrogen) to each sample and incubating at 42°C for 60 min. The reaction was terminated by heating to 70°C for 15 min. PCR for the amplification of ENK and SP was performed using an MJ Research PTC10 thermal cycler using thick-walled, 0.5 ml tubes. Fifty microliters of PCR reactions for ENK and SP were run separately. Reaction mixtures contained 5.1 μl of 10× Platinum TaqPCR buffer, 2.25 mm MgCl2, 0.5 and 0.4 mm each dNTPs for ENK and SP reaction, respectively, 1 μm forward and backward primers, 0.55 μl of Platinum TaqDNA polymerase (Invitrogen), and 3–7 μl of cDNA template obtained from the RT reaction. A touchdown amplification was used to optimize specificity by stepwise reduction of the annealing temperature through the first 12 cycles. The cycling steps during the touchdown phase were 94°C for 1 min 10 s for denaturation, 65 to 0.5°C/cycle for 1 min annealing and 1 min 30 s at 72°C for elongation, which was followed by 37 cycles of the same steps except for annealing in each cycle at 59°C. The primers used for ENK and SP amplification were identical to the ones described and characterized by Surmeier et al. (1996). The amplification products were analyzed with agarose gel electrophoresis using ethidium bromide-stained gels. The amplified products always exhibited the expected molecular weights. Both the long and short isoforms of SP mRNA were observed and were in many instances colocalized in the same cell (Surmeier et al., 1996). In some cases, the ENK sequence was verified with restriction endonuclease digest analysis (data not shown). False positives attributable to contamination from extracellular RNA spilled from damaged neurons or present in axon terminals that might be harvested with the recorded neurons could be excluded by showing that several cholinergic interneurons that were recorded in the same preparation and were positive for choline acetyl transferase mRNA did not express ENK or SP message (data not shown) and by the frequency of ENK+/SP+ neurons, which was far lower than expected if a significant fraction of the positive signals originated from contaminants. In addition, pipettes that were lowered in the slice without harvesting did not yield any PCR amplification product (data not shown).
Quantal analysis.
Two different methods of quantal analysis were used to study the biophysical properties of connections between striatopallidal neurons. The first, more conventional method relies on fitting a theoretical binomial distribution to experimentally observed IPSC distributions (Del Castillo and Katz, 1954; Korn et al., 1981) and was performed here using a simplification of the procedures described by Stricker et al. (1994, 1996). To compensate for the small number of IPSC measurements, the data were boosted by computing probability density functions (PDFs) as the convolution of the amplitude distribution with a Gaussian kernel and normalizing with the integral of the resulting function (Stricker et al., 1994, 1996). This procedure is different from smoothing conventional histograms and avoids the nonlinearity of the binning process. The SD of the convolution kernel was arbitrarily chosen to be between 3 and 10 pA. These SD values are unlikely to lead to loss of discreet quantal levels because visual inspection of individual IPSCs from the perforated patch recordings demonstrated that virtually none of the recorded IPSCs exhibited amplitudes less than ∼20 pA. A constrained binomial model of n release sites was fitted in which each site was assumed to exhibit the same release probability p and the same Gaussian quantal amplitude distribution characterized by mean q* and SDintra, with the latter representing the intrasite quantal amplitude variance. The Levenberg–Marquardt nonlinear least-squares curve-fitting algorithm (Marquardt, 1963) implemented in IgorPro (WaveMetrics) was used to determine the free parameters p, q*, SDintra, and n. Pairs in which convergent fit could not be obtained were omitted; otherwise, we did not attempt to quantify the statistical goodness of the fits attributable to the limited size of the data sets (Ninio, 2007).
Quantal parameters were also estimated using mean–variance analysis. This method provides estimates for the quantal parameters on the basis of a theoretically predictable effect of the probability of release on the relationship between the variance and the mean of PSC amplitude distributions (Clements and Silver, 2000). This effect can be used to estimate quantal parameters by collecting IPSC amplitude distributions under different, experimentally varied (but not necessarily known) release probability conditions and fitting the observed dependence of the variance on the mean across the different recording conditions with quadratic functions that describe the theoretically predicted mean–variance relationship under various assumptions about the nature of the release process (Clements and Silver, 2000). Multiple IPSC distributions with different release probabilities were simultaneously recorded using paired-pulse or train stimulation of the presynaptic neuron that induces a reduction of release probability from one spike to the other (Clements and Silver, 2000).
Paired-pulse stimuli were delivered at 0.3 Hz and consisted of action potentials separated by 50 ms. The train stimulation was used to induce a form of posttetanic potentiation (PTP) that was associated with a decrease in failure rate and other indicators that demonstrate an underlying increase in presynaptic release probability. Train stimulation consisted of ∼20 trains of 10 spikes at 20 Hz with an additional spike 1 s later, delivered at 0.3 Hz. Train stimulation was used in a subset of pairs after pharmacological experiments.
Mean–variance analysis was performed for all pairs using paired-pulse data (providing three mean–variance data points, including the mean = 0, variance = 0 point) and in four pairs in which PTP was induced, and, at the end of the experiment, the same analysis was repeated using the 10 action potential stimulus trains. The fitted model used here describes synaptic release from multiple sites in a way that combines the intrasite and intersite variance of quantal amplitudes across different release sites into a single coefficient of variation value (CVq) specifying the net variance of the quantal amplitude distribution (Clements and Silver, 2000). The CVq was set to 0.3, which is typical for most synaptic contacts (Clements and Silver, 2000), and was similar to the quantal variance estimated from binomial fitting (0.22 ± 0.02; n = 8) as described above. None of the conclusions drawn from this analysis would be altered by the difference between the experimentally estimated and presumed CVq or by other physiologically reasonable deviations from the presumed value. The curve fitting for the computation of quantal parameters corrected for the quantal amplitude variance has been described by Clements and Silver (2000) and was performed using the curve-fitting routine of AxoGraph X version 1.0.7.
Results
Presynaptic rundown of synaptic transmission between spiny neuron pairs during whole-cell recording
In our initial recordings from pairs of SPN in adult transgenic mice, whole-cell recordings were used for the presynaptic and postsynaptic neurons. In most of these recordings (∼75%, 15 pairs of 20 recorded), we observed a time-dependent reduction of the IPSC amplitudes that typically led to a near complete disappearance of the IPSC in ∼20 min (Fig. 1A). Surprisingly, the reduction of the IPSC amplitude was associated with an increased failure rate (Fig. 1A), suggesting a presynaptic origin. In addition, comparison of the average amplitude of spontaneous PSCs collected during two 5-min intervals before and after the rundown of the evoked responses demonstrated that the spontaneous events did not undergo a similar rundown, thus arguing against rundown as a result of dialysis from whole-cell recording in the postsynaptic neuron as a possible explanation (Fig. 1B). Together, these observations indicated that the rundown occurred in the presynaptic neurons. Therefore, we tried to protect the presynaptic neurons from dialyzation by using amphotericin perforated patch recording. Perforated patch recording from the presynaptic neurons prevented rundown in all pairs tested and stabilized the IPSC amplitudes over extended recording times (up to 3 h) (Fig. 1C, D), and, therefore, in all subsequent experiments, presynaptic neurons were recorded with this method. Because perforated patches were more stable under voltage clamp, presynaptic neurons were stimulated to elicit IPSCs in postsynaptic neurons in this mode in all experiments except during the characterization of the intrinsic properties of the recorded neurons.
Interestingly, similar rundown was not evident in recordings from rat slices, a difference most likely attributable to the relatively short duration of recordings in those experiments (see below).
Biophysical properties and dopaminergic modulation of synaptic transmission between striatopallidal neurons
A total of 17 pairs of synaptically connected EGFP+ striatopallidal neurons were recorded with a combination of presynaptic perforated patch and postsynaptic whole-cell recording. This population represented 18% of a total of 94 pairs tested for connectivity using this method. Of the 17 pairs, 16 met the acceptance criteria described above. Cell pairs were <150 μm from each other, typically at a distance of ∼50 μm. Synaptic transmission was characterized by examining the properties of postsynaptic responses to two spikes elicited by paired-pulse presynaptic stimulation at an interstimulus interval of 50 ms, delivered continuously at a rate of 0.3 Hz. The IPSCs were mediated by GABAA receptors as indicated by their reversal potential and reversible block by bicuculline (Fig. 1E, F).
Quantitative analysis of the striatopallidal collateral IPSCs revealed the existence of two physiologically distinct types of connections. The distribution of the mean IPSC amplitudes of the recorded connections exhibited clear bimodality with 13 connections (81%) clustered between 4 and 44 pA (small-amplitude connections) and another three connections or 19% exhibiting much larger IPSCs between 121 and 144 pA (large-amplitude connections) (Fig. 2A, B). The presynaptic neurons in both types of connections exhibited the typical electrophysiological SPNs (see Figs. 2A, 4D). In two of the three large-amplitude connections, intracellular labeling with Alexa 594 after rupturing the perforated patch at the end of the experiment demonstrated that the presynaptic neurons had densely spiny dendrites and other morphological characteristics of projection neurons and, therefore, despite the unusually large IPSC amplitudes, were indeed SPNs and not interneurons (see Figs. 2B, 5H). The difference between the population averages of the mean IPSC amplitudes for the large- and small-amplitude groups was ∼6.5-fold (21 ± 3.5 vs 137 ± 7 pA) (Fig. 2C), and this difference was statistically significant despite the small sample size (ANOVA, p < 0.001; Mann–Whitney U test, p < 0.01). In addition, the two groups of connections exhibited significant differences in failure rates and CVs. For small-amplitude connections, the failure rate was 0.58 ± 03 (range, 0.3–0.8), whereas large-amplitude connections exhibited a significantly lower failure rate (0.12 ± 0.06; range, 0.05–0.25; Mann–Whitney U test, p < 0.01). The CVs of the IPSC amplitude distributions for small-amplitude connections (1.56 ± 1.12; range, 0.95–2.33) was more than twice that for large-amplitude connections (68 ± 0.12; range, 0.54–0.92; Mann–Whitney U test, p < 0.01) (Fig. 2D).
Figure 4.

Dopamine modulation of small-amplitude connections between striatopallidal neurons. A, Scatter plot of IPSC amplitudes recorded in a representative pair of neurons (same pair as in B, D, and E) in a D2–EGFP neostriatal slice. Bath application of dopamine (30 μm) causes a dramatic inhibition of transmission. The effect is recovered by coapplication of sulpiride (5 μm). B, IPSCs recorded in control (set 1), in dopamine (set 2), and in sulpiride (set 3). The top traces are voltage-clamp recordings from the presynaptic neuron. The averages of sets 1–3 in A and B are shown in color (bottom: black, control; red, dopamine; green, sulpiride). C, Cumulative data for the effect of dopamine on the mean amplitude (top left) failure rate (top middle), CV (top right), and paired-pulse ratio (bottom left) of the IPSCs in the recorded pairs. Asterisks indicate statistically significant differences as described in detail in Results. Bar graphs indicate mean (long horizontal line), 25–75% range (box), and median (short horizontal line). Con, Control; DA, dopamine; SUL, sulpiride. D, Membrane potential responses of the presynaptic neuron recorded in perforated patch-clamp mode (bottom traces) are characteristic of SPNs. Simultaneous postsynaptic recording is shown (top traces). E, Photomicrographs of the presynaptic (open arrowheads) and postsynaptic (filled arrowheads) neurons before recording (left) and at the end of the experiment (right). Note the presence of EGFP in both neurons and the continued exclusion of Alexa 595 in the presynaptic neuron, indicating that the perforated patch remained intact. Higher magnification of a part of a dendrite of the postsynaptic neuron with numerous dendritic spines is seen (inset).
Figure 5.

Biophysical properties and dopamine modulation of large-amplitude connections between striatopallidal neurons. A, Scatter plot of IPSC amplitudes versus time recorded in a representative pair (same pair as in B, E–H) in a D2–EGFP mouse. Bath application of dopamine (30 μm), subsequent coapplication of sulpiride (10 μm), or coapplication of the D1-family antagonist SCH 23390 (1 μm) are without effects on the efficacy of transmission. B, IPSCs recorded in control condition (set 1) and in dopamine (set 2), sulpiride (set 3), and SCH 23390 (set 4). The top traces are voltage-clamp recordings from the presynaptic neuron. The averages of sets 1–4 are shown in the bottom. Note the absence of change in the peak amplitude, rise time, or decay time constant of the IPSC. C, D, Cumulative data for the IPSC amplitudes (C) and failure rates (D) in control (CON), dopamine (DA), and sulpiride (SUL). Bar graphs indicate mean (long horizontal line), 25–75% range (box), and median (short horizontal line). E, F, Photomicrographs of the recorded EGFP+ neurons before (E) and at the end of (F) the experiment, indicating that the both neurons express EGFP and that the perforated patch remained intact in the presynaptic neuron (open arrowheads). G, Membrane potential responses of the presynaptic neuron to current pulses recorded in perforated patch-clamp mode (bottom traces) exhibit the typical characteristics of SPNs. Simultaneous postsynaptic recording is shown (top traces). H, Photomicrograph of the presynaptic and postsynaptic neuron filled with Alexa 594. Higher-magnification image of a spine-laden portion of a dendrites is shown in the inset, indicating that the recorded neuron is an SPN.
Although both male and female animals were used in this study, the two types of connections were not gender specific because, in slices from one animal, both a small- and a large-amplitude connection were observed.
To examine the biophysical basis of the difference between the two types of connections, we performed quantal analysis using two different methods: conventional analysis based on fitting a binomial model of release to IPSC amplitude distributions, and mean–variance analysis, which provides quantal parameter estimates from the mean and the variance of IPSC distributions exhibited by the connection under different conditions of release probability.
Limitations of the data were taken into consideration for both types of analysis. Mean–variance analysis requires the IPSCs to be sampled under a wide range of release probabilities. In most connections, this condition was apparently not met because the mean–variance value pairs fit fairly closely to a linear function preventing the estimation of the number of release sites. Similarly, conventional quantal analysis, although less susceptible to this limitation, can provide ambiguous estimates of n and p if p is very small and the dataset insufficiently large. To avoid the possible incorrect estimation of quantal parameters, we sought to verify the quantal parameters extracted under these limiting conditions by repeating the analysis in a subset of pairs after increasing the release probability. This was achieved by inducing a form of PTP elicited with train stimuli (∼30–200 action potentials at 10–30 Hz; see Materials and Methods) that lasted long enough to allow the collection of ∼100 IPSCs under semi-stationary conditions. This experiment was performed for two small-amplitude and the three large-amplitude connections. Examples of IPSC series collected before and after inducting PTP are shown in Figure 3.
Figure 3.
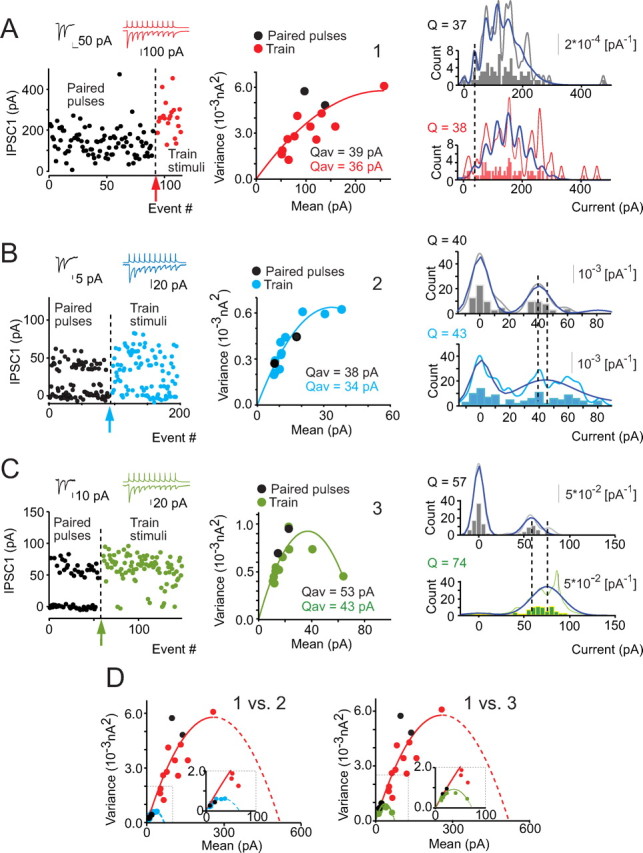
Quantal analysis of synaptic transmission at the two types of connections between striatopallidal neurons. A–C, Mean–variance analysis and conventional quantal analysis of synaptic transmission at one large-amplitude and two small-amplitude connections before and after increasing release probability by inducing PTP. A, Scatter plot of the amplitude of the first IPSC during paired and train stimuli as a function of stimulus number. Onset of train stimulation is indicated by the arrow. Note the change in IPSC amplitude distribution and the decrease in failure rate. Top two insets are averages of pre-PTP and post-PTP responses. Timescale, 50 ms. Middle, Mean–variance curves fitted to IPSC distributions recorded before (black dots) and after (red dots) PTP. Quadratic fit to the combined pre-PTP and post-PTP data is shown (curve in red). Note that quantal amplitudes (Qav) obtained by independent fits for pre-PTP and post-PTP (curves not shown) yield similar values (text inset), and the combined data could be fitted with a single function. Right, IPSC amplitude distribution histogram (bars), computed PDFs (gray curve), and best binomial fit obtained before (top) and after (bottom) PTP induction. The histograms and PDFs are shown on different scales because they were generated independently; scale bar for the PDF is on the right. Note the clear separation of multiple, evenly spaced peaks in the PDFs. Best binomial fits (blue curves) provide quantal amplitude estimates (text insets) for pre-PTP and post-PTP data that are closely similar to those obtained with mean–variance analysis (compare with middle). Note the PTP-induced change in the PDFs and binomial functions indicative of an increase in release probability. B, C, Quantal analysis of two small-amplitude connections performed and illustrated as described for the large-amplitude connection in A. Note the clear separation of peaks in the IPSC amplitude distribution histograms and PDFs for both pairs (right) spaced at intervals similar to the Q estimates obtained with mean–variance analysis. D, Comparison of quadratic fits to the mean–variance data obtained from the large-amplitude connection (curve in red) with the fits obtained for the two small-amplitude connections (left and right). Note that the slopes of the fitted curves corresponding to the quantal amplitudes of the large- and small-amplitude connections at the origin are very similar (inset), whereas the extrapolated non-zero mean values at zero variance, which are directly proportional to the number of release sites in the two types of connections, are severalfold different (for additional explanation, see Materials and Methods) (insets in D show high magnification of the small connection plots).
Both methods of quantal analysis gave nearly identical results in each pair examined. Mean–variance analysis of IPSCs recorded with paired-pulse stimulation in baseline (non-PTP) state of the connections yielded a quantal amplitude estimates for large-amplitude connections of q* = 49 ± 18 pA (range, 26–85 pA; n = 3), and for small-amplitude connections, q* = 45 ± 4 pA (range, 23–73 pA; n = 13). These values are not significantly different (p > 0.6, Mann–Whitney U test) (Fig. 3). The quantal size of the large-amplitude and small-amplitude connections were, respectively, estimated to be 57.5 ± 13.6 pA (range, 37.5–83.6 pA; n = 3) and 37.8 ± 2.2 pA (range, 31.6–41.3 pA; n = 4) with conventional quantal analysis, and these values also did not differ significantly (t test, p > 0.15) (Fig. 3). When comparing the quantal size estimates obtained with the two methods for each connection examined, the estimates were highly correlated (r = 0.83; p < 0.0009; n = 12), although linear regression between the two measures showed a small (<20%) but consistent overestimation of q using mean–variance analysis. These data indicate that the large difference in the average IPSC amplitudes of the two types of connections cannot be attributed to a difference in quantal size.
The number of release sites involved in individual connections was estimated with conventional analysis using baseline data for all connections and using post-PTP data for the four select pairs as well as with mean–variance analysis using the post-PTP data in the four pairs in which PTP was induced. The number of release sites in small-amplitude connections was estimated as n = 2.28 ± 0.7 with mean–variance analysis (n = 2) and n = 2.25 ± 0.36 with conventional analysis (n = 4), whereas the number of release sites for large-amplitude connections was estimated to be n = 9.54 ± 2.9 (n = 2) with mean–variance analysis and 13.1 ± 0.74 (n = 3) with conventional analysis. The difference between the estimated numbers of release sites involved in the two types of connections was statistically significant for both types of comparisons despite the small number of pairs examined (p < 0.0001 for conventional and p < 0.007 for mean–variance analysis, t test; p < 0.03, Mann–Whitney U test) (Fig. 3).
The resting release probabilities of the two connection types were estimated only using data obtained without PTP induction. The estimated release probabilities of the two types of connections using the conventional method were very similar (0.22 ± 0.03 for small and 0.20 ± 0.06 for large connections; p > 0.76, t test; n = 4). With mean–variance analysis, the baseline release probability was slightly lower for the small-amplitude connections (p = 0.34 ± 0.06; n = 13) than for large-amplitude connections (p = 0.46 ± 0.06; n = 3), but this difference did not reach statistical significance.
In summary, these observations demonstrate that the mean IPSC amplitude difference between the two types of connections can be attributed predominantly or exclusively to a corresponding difference in the number of release sites. Based on the small sample sizes, we cannot exclude the possibility of additional differences in quantal amplitudes or release probabilities between the two types of connections with certainty, but, if these exist, they are likely to be relatively small.
Dopaminergic modulation of striatopallidal collateral synapses was examined using bath application of dopamine (30 μm), a concentration sufficient to saturate both D1 and D2 receptors (Shin et al., 2003). All small-amplitude connections were strongly inhibited by dopamine (Fig. 4). The mean IPSC amplitude was reduced from 26 ± 4 pA (range, 12–44 pA) to 13 ± 3 pA (range, 3–29 pA) by dopamine representing, on average, a reduction to 51 ± 6% of control (range, 14.7–65.8%; n = 9) (Fig. 4), and this effect was statistically significant for each pair examined individually (Mann–Whitney U test, p < 0.05). To determine the dopamine receptor subtype involved, the effect of dopamine was challenged with subsequent coapplication of sulpiride (5–10 μm), an antagonist selective for D2-family receptors (Fig. 4), which restored the IPSC amplitude to 96 ± 6% of control (Mann–Whitney U test, p < 0.041) (Fig. 4). In two of the pairs, the IPSC recovered to a value exceeding baseline (Fig. 4C), suggesting the presence of an endogenous dopaminergic tone sufficient to tonically activate the receptors.
The locus of the action by dopamine was investigated using the method of failures, the CV test, and the paired-pulse ratio (PPR) test. Cumulative representation of the results of these analysis for the recorded pairs is shown in Figure 4C. The dopamine-induced IPSC depression was associated with a significant increase in failure rate (54 ± 5% control vs 73 ± 5% in dopamine; Wilcoxon's t test, p < 0.009, for each pair), an increase in the CV of the IPSC amplitude distribution (1.44 ± 0.13 control vs 2.52 ± 0.49 in dopamine; Wilcoxon's t test, p < 0.009, for each pair), and an increase in the PPR (0.69 ± 0.07 control vs 1.19 ± 0.21 in dopamine; Wilcoxon's t test, p < 0.009, for the population) (Fig. 4C). Together, these results demonstrate that the effect of dopamine was predominantly or exclusively presynaptic.
Remarkably and in clear contrast to small-amplitude synaptic connections, dopamine had no effect on large-amplitude connections (Fig. 5). The mean IPSC amplitude at these connections under control conditions (134 ± 7 pA) was not different from that in the presence of dopamine (123 ± 11 pA; Mann–Whitney U test, p > 0.05 for each pair; n = 3) (Fig. 5A–D). In two of three cases, subsequent application of dopamine plus sulpiride was also without effect on the IPSC amplitude (Fig. 5A, B), whereas in one pair, sulpiride modestly increased the mean IPSC amplitude (36% increase; Mann–Whitney U test, p < 0.001) (Fig. 5C). Similarly, subsequent coapplication of the D1 receptor-selective antagonist SCH 23390 [R(+)-7-chloro-8-hydroxy-3-methyl-1-phenyl-2,3,4,5-tetrahydro-1H-3-benzazepine hydrochloride] (in the presence of dopamine and sulpiride) in one pair was also without effect (Fig. 5A). Finally, neither dopamine nor sulpiride caused a change in failure rates at large-amplitude connections (Fig. 5A, D).
Biophysical properties and dopaminergic modulation of synaptic transmission between striatopallidal and striatonigral neurons
We next examined synaptic connections between presynaptic striatopallidal neurons and postsynaptic striatonigral neurons. During the initial phase of this study, we assumed that neurons that exhibited no detectable fluorescent signal in D2R–EGFP transgenic mice were neurons that did not express the D2R and thus could be confidently identified as striatonigral neurons. This assumption has recently been called into question, however, by a study in which the proportion of neurons expressing EGFP in the D2–EGFP neurons was assessed by crossing the D2R–EGFP animals with another BAC transgenic strain that express the spectrally distinct fluorescent reporter dTomato in D1R-expressing cells (Shuen et al., 2008). Because the genetically engineered fluorescent markers were present in separate neurons but a relative large fraction of cells expressed neither of these signals, it is possible that, at least under some imaging conditions, some D2R-expressing neurons in our D2R–EGFP mice may be misidentified as striatonigral cells. However, a more recent study in which neuron-specific markers were used to identify EGFP+ cells as neurons has shown that, in double-transgenic D1–EGFP/D2–EGFP mice, 100% of the SPNs expressed EGFP, i.e., there are no false negatives (Matamales et al., 2009). In any event, in some paired recording experiments, we directly identified striatonigral neurons by retrogradely labeling with fluorescent latex microspheres from the substantia nigra (Fig. 6) (Wang et al., 2006). These experiments were also useful for further assessing the validity of the assumption that EGFP is not expressed in striatonigral (D1R-expressing) neurons in the D2R–EGFP mice (Gertler et al., 2008). Unilateral injections of fluorescent microspheres into the substantia nigra in three D2R–EGFP mice resulted in a dense labeling of neurons in the neostriatum (Fig. 6). Colocalization of the endogenous EGFP signal and the retrograde label was examined in 461 randomly selected neurons. Colocalization of the two labels was not observed in any of these neurons, demonstrating that, at least under our experimental conditions in the D2R–EGFP mice, EGFP is observed exclusively in striatopallidal neurons (Fig. 6).
Figure 6.
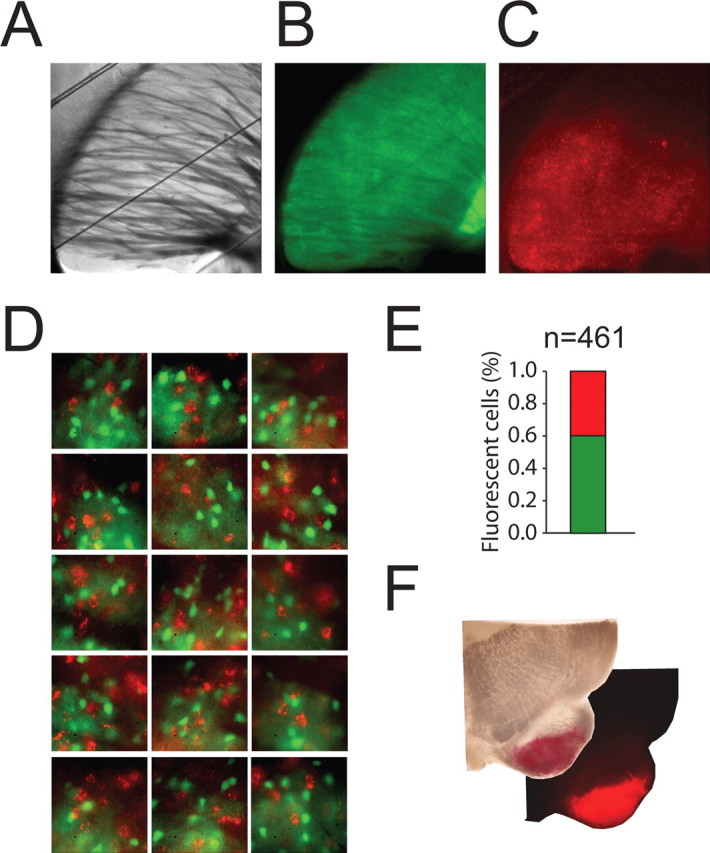
Retrograde labeling of striatonigral neurons with florescent latex microbeads in D2–EGFP mice. A–C, Photomicrographs of a corticostriatal slice obtained from a D2–EGFP mouse injected stereotactically in the substantia nigra with rhodamine latex microspheres. Low-magnification bright-field (A) and EGFP (B) and rhodamine (C) epifluorescence images are shown. Note that EGFP and the red retrograde label (red punctate deposits) are expressed in the same large area confined within the neostriatum. D, Higher-magnification examples of images used for examining colocalization of the two labels in striatal neurons. Note the absence of colocalization of the two markers. E, Graphical representation of the number of EGFP+ (green bar) and retrograde label-containing (red) neurons. F, Bright-field and fluorescence photomicrographs of the ventral left portion of the midbrain showing the area of injection of the retrograde tracer (red) within the substantia nigra pars reticulata.
Synaptic connections in 13 pairs of EGFP+ presynaptic and EGFP− postsynaptic neurons (EGFP+/− pairs) and the three pairs in which the presynaptic neuron was EGFP+ and the postsynaptic neuron was an EGFP−, retrogradely labeled (RL) striatonigral neuron (EGFP+/RL pairs) exhibited similar biophysical properties, including their respective probabilities of connectivity (20 vs 14%; Mann–Whitney U test, p > 0.05), mean IPSC amplitudes (41 ± 11.06 vs 21 ± 0.11 pA; Mann–Whitney U test, p > 0.05), CVs (1.39 ± 0.27 vs 1.83 ± 0.33; Mann–Whitney U test, p > 0.05), and failure rates (0.47 ± 0.07 vs 0.69 ± 0.06; Mann–Whitney U test, p > 0.05), and therefore the data from these populations were pooled (Fig. 7C).
Figure 7.

Biophysical properties and dopamine modulation of synaptic connections between presynaptic striatopallidal and postsynaptic striatonigral neurons. A, Scatter plot of IPSC amplitudes versus time recorded in a representative pair of neurons (same pair as in B, D, and E) between an EGFP+ presynaptic neuron and a postsynaptic EGFP− striatonigral neuron retrogradely labeled from the substantia nigra in a D2–EGFP mouse. Bath application of dopamine (30 μm, set 2) causes inhibition of transmission. The effect is recovered by coapplication of sulpiride (5 μm, set 3). B, Average IPSCs recorded in control condition (set 1) and in dopamine (set 2) and sulpiride (set 3). The top traces are voltage-clamp recordings from the presynaptic neuron. The averages of IPSCs corresponding to sets 1–3 in A and B are shown (bottom: black, control; red, dopamine; green, sulpiride). C, Cumulative data for the effect of dopamine on the mean amplitude (top left), failure rate (top middle), CV (top right), and paired-pulse ratio (bottom left) of the IPSCs. Asterisks indicate statistically significant differences as described in detail in Results. Bar graphs show mean (long horizontal line), 25–75% range (box), and median (short horizontal line). Bottom right shows cumulative histogram of the mean IPSC amplitude distribution for these pairs. The red bars indicate amplitude values measured in retrogradely labeled EGFP neurons. Text insets indicate the fraction of tested dopamine-responsive pairs. D, Membrane potential responses of the presynaptic neuron to current pulses after the perforated patch seal was broken (bottom traces). Simultaneous postsynaptic recording is shown (top traces). E, Photomicrographs of the presynaptic (open arrowheads) and postsynaptic neurons (filled arrowheads) before (left) and at the end (right) of the experiment before the perforated patch was broken. The retrograde label is seen as a red punctate deposit in the soma at the tip of the pipette (filled arrowhead). The same neuron is shown after initiating recording and filling with Alexa 594 on the right (filled arrowhead). The inset shows a higher magnification of spine-laden portion of a dendrite of this cell. Note the absence of Alexa 594 in the presynaptic neuron (open arrowheads), indicating that the perforated patch remained intact. CON, Control; DA, dopamine; SUL, sulpiride.
The effect of dopamine on striatopallidal to striatonigral pairs was tested in seven EGFP+/− and three EGFP+/RL connections. The control IPSC amplitude of 48 ± 15 pA (range, 6.6–107 pA) in EGFP+/− pairs was reduced by bath application of 30 μm dopamine to 18 ± 6 pA (range, 1–44 pA), representing on average a reduction to 31.7 ± 4% of control (Fig. 7). The reduction was statistically significant for each pair (Mann–Whitney U test, p < 0.03). Statistically significant reversal of the effect of dopamine was obtained with coapplication of sulpiride, which returned the IPSC amplitude to 100 ± 31% of control (Mann–Whitney U test, p < 0.031) (Fig. 7C). We also tested the effect of dopamine on transmission at the EGFP+/RL pairs (Fig. 7). The control IPSC amplitude of 21 ± 11 pA (range, 10–44 pA; n = 3) was reduced to 4 ± 1 pA (range, 3.5–5.6 pA; n = 3), representing, on average, a reduction to 33 ± 14% of control (Fig. 7A–C). The reduction was statistically significant for each pair (Mann–Whitney U test, p < 0.014). The effect of dopamine was reversed by coapplication of sulpiride to 27 ± 9 pA (range, 18 ± 36 pA), or 128 ± 30% of control, which was not significantly different from control (Mann–Whitney U test, p > 0.34) (Fig. 7).
The magnitude of the dopaminergic effect was not different between the two groups, and, for purposes of additional analysis, the data were pooled (Fig. 7C). The locus of action of the drug-induced change was analyzed as described for striatopallidal pairs. The average control failure rate was 55 ± 8%. Dopamine significantly increased the failure rate to 79 ± 6% (143% of control; Wilcoxon's t test, p < 0.009; n = 10). The mean CV (1.59 ± 0.28) was increased to 256% of control (4.08 ± 1.29; Wilcoxon's t test, p < 0.009; n = 10), and the PPR (0.56 ± 0.06) was increased to 200% of control (1.12 ± 0.08; Wilcoxon's t test, p < 0.009). As was the case for axon collateral synapses between striatopallidal neurons, these results demonstrate that the effect of dopamine on collateral synapses of striatopallidal neurons onto striatonigral neurons is predominantly or exclusively presynaptic.
Control experiments using paired recording from SPNs identified with RT-PCR profiling in rat brain slices
The previously described experiments are liable to three potential errors. First, it is possible that the dopaminergic regulation of synaptic transmission is altered in the transgenic animals. Second, the recordings in mice were obtained using 2 mm [Ca2+]e, which, although routinely used in in vitro experiments, is higher than the physiological concentration in vivo (0.9–1.1 mm) (Jones and Keep, 1988a,b), and this difference may significantly alter the quantitative or even qualitative properties of the effect of dopamine. Finally, it is possible that potential rapidly desensitizing effects of dopamine may have been obscured in experiments that used the relatively slow- and long-duration bath application of drugs. To address these concerns, we obtained paired whole-cell recordings from SPNs in slices from young adult rats (38–56 d old) in 1.1–1.2 mm [Ca2+]e and examined the effect of dopamine on synaptic transmission using rapid, local pressure application of dopamine (see Materials and Methods). Rapid drug application was used in all but two of these pairs, in one ENK+/SP− to ENK+/SP− pair and the SP+/ENK− to ENK+/SP− pair in which bath application of 30 μm dopamine was used (see below).
The phenotypes of the recorded neurons were identified using RT-PCR analysis of the expression of the neuropeptides substance P and enkephalin, which are specific markers of striatonigral and striatopallidal neurons, respectively (Gerfen et al., 1990). Controls for the RT-PCR profiling were conducted in the same preparation as described in Materials and Methods. This method of identification has the added advantage that the two neuropeptides are more extensively documented, and accepted markers of the two types of SPNs than D1 and D2 receptors and their exclusive expression in projection cells obviates the need for morphological or other identification of the recorded neurons as SPNs.
Of the 58 RT-PCR profiled neurons recorded as pairs, 42 (72.4%) were positive for only one of the neuropeptides, 12 (20.7%) were negative for both, and 5 (6.9%) expressed both ENK and SP. The coexpression of these markers in 6.9% of the cells is essentially the same as that reported for SPNs from 4-month-old rats (4%) (Wang et al., 2006). A total of nine pairs of synaptically connected SPNs were recorded in which successful RT-PCR profiling was obtained from both the presynaptic and postsynaptic neurons (Fig. 8). Five of the recorded connections were between striatopallidal neurons (neurons expressing ENK but not SP), three connections were between presynaptic striatopallidal neurons and postsynaptic striatonigral neurons, the latter identified by the expression of SP but not ENK, and finally one connection was between a similarly identified presynaptic striatonigral and a postsynaptic striatopallidal neuron.
Figure 8.
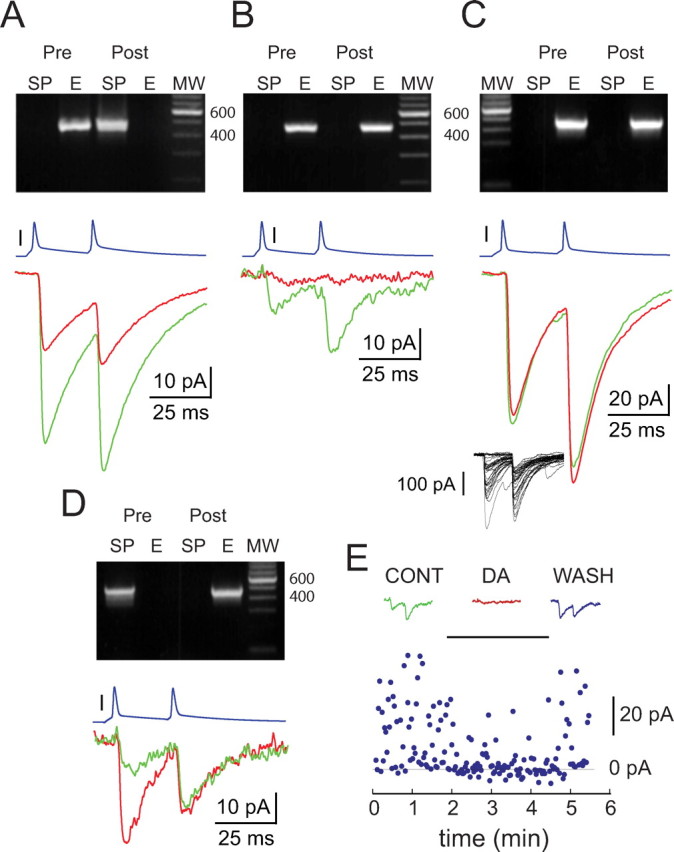
Dopaminergic modulation of synaptic transmission between SPNs identified using RT-PCR profiling of enkephalin (E) and substance P (SP) expression in the rat. A–D, Top row shows photographs of ethidium bromide-stained agarose gels used for electrophoretic separation of RT-PCR products obtained from the recorded presynaptic and postsynaptic neurons. Note that the amplicons exhibit the expected molecular weights (MW). A, Modulation of transmission between an ENK+/SP− striatopallidal and an SP+/ENK− striatonigral SPN. Paired-pulse stimulation of the presynaptic neuron (blue trace) elicited IPSCs in the postsynaptic neuron (bottom green trace) that were significantly reduced in amplitude after local pressure application of dopamine (bottom red trace). Note that the minimal change in PPR is likely a result of the absence of influence between the two responses reflected by the near unity PPR in control. B, Modulation of transmission at a small-amplitude connection between a pair of ENK+/SP− striatopallidal SPNs. Paired-pulse stimulation of the presynaptic neuron (blue trace) elicited IPSCs in the postsynaptic neuron (green trace) that were significantly reduced in amplitude after local pressure application of dopamine (red trace). Note the marked change in paired-pulse ratio after dopamine application. C, Absence of modulation of transmission at a large-amplitude connection between a pair of ENK+/SP− striatopallidal SPNs. Paired-pulse stimulation of the presynaptic neuron (top trace, blue) elicited IPSCs in the postsynaptic neuron (bottom green trace) that remained unaltered after pressure application of dopamine. Note that twofold vertical compression of the display relative to A, B, and D. The inset shows individual IPSCs recorded in this pair. Note the similarity of the amplitude variance and failure rate to those of the large-amplitude responses recorded in mice in Figure 2A. D, Modulation of transmission at a connection between a presynaptic ENK−/SP+ striatonigral and an ENK+/SP− postsynaptic striatopallidal SPN. Paired-pulse stimulation of the presynaptic neuron (top trace, blue) elicited IPSCs in the postsynaptic neuron (bottom green trace) that were significantly increased in amplitude after bath application of 30 μm dopamine (bottom red trace). Note the marked change in paired-pulse ratio. E, Scatter plot of IPSC amplitudes versus time during local pressure application of dopamine recorded in a pair of striatopallidal neurons (ENK+/SP− neurons; same as in B). Reversal of the dopaminergic inhibition of transmission was obtained in this pair after termination of drug application. Note the rapid development and recovery of the dopaminergic effect. CONT, Control; DA, dopamine; WASH, washout.
IPSCs elicited between presynaptic striatopallidal and postsynaptic striatonigral neurons exhibited a mean amplitude of 26.7 ± 12.3 pA under control conditions (n = 3; range, 14.8–53.2 pA). Dopamine reduced the IPSC amplitude in these pairs to 37.3 ± 8.7% of control (9.96 ± 2.3 pA; range, 5.9–13.9 pA; n = 3), and this effect was statistically significant for each pair (Mann–Whitney U test; p < 0.007, for each pair) (Fig. 8A). A presynaptic locus of action of dopamine was indicated by the change in CV (F test, p < 0.002, for each pair; n = 3) and by an observable change in the PPR in two of the three pairs in which this test was permitted by a PPR significantly different from unity in the control condition.
Similar to the connections between striatopallidal neurons in mice, two types of connections could be distinguished among ENK+/SP− cells in the rat on the basis of average IPSC amplitudes and responses to dopamine (Fig. 8B, C). In three of the five connections, dopamine application reduced the mean IPSC amplitude (16.8 ± 7.7 pA; range, 9.1–24.5 pA; n = 3) to 44.5 ± 2.4% of control (7.48 ± 3.4 pA; range, 4.1–11 pA; n = 3), representing a statistically significant effect for each pair (p < 0.001, Mann–Whitney U test). The population average of the mean IPSC amplitudes in this group (16.8 ± 7.7 pA; range, 9.1–24.5 pA; n = 3) was similar to the average amplitude in the dopamine responsive group of connections between striatopallidal neurons recorded in mice (21 ± 3.5 pA; range, 4–44 pA; n = 12). As in mice, the effect of dopamine in the rat was mediated presynaptically as indicated by a change in the CV (F test, p < 0.002, for each pair; n = 3) and increase in the PPR observable in all pairs (Fig. 8B). Reversal of the dopaminergic modulation was demonstrated in one of these pairs after terminating local dopamine application (Fig. 8E).
In contrast, the remaining two pairs of ENK+/SP− striatopallidal neurons were not responsive to dopamine exhibiting mean IPSC amplitudes of 81.8 ± 9.7 pA in control versus 75.1 ± 14.9 pA in dopamine (Mann–Whitney U test, p > 0.1) (Fig. 8C). The mean IPSC amplitudes in these pairs (91.5 and 72.1 pA, respectively) had a population average of 81.8 ± 9.7 pA, which was significantly larger than the 16.8 ± 7.7 pA population average of IPSC amplitudes observed in the dopamine-responsive group of ENK+/SP− striatopallidal neurons (t test; p < 0.04). In addition, the ratios of dopamine-unresponsive to dopamine-responsive IPSC population averages were similar in mice and rat (6.5-fold vs 4.9-fold differences, respectively).
Finally, we also recorded one pair consisting of a presynaptic striatonigral (SP+/ENK−) neuron and a postsynaptic striatopallidal (ENK+/SP−) cell (Fig. 8D). Bath application of dopamine (30 μm) increased the baseline IPSC amplitude of 10.26 pA to 220% (22.6 pA) of control (Mann–Whitney U test, p < 0.05) in this pair. The predominantly or exclusively presynaptic locus of this enhancement was indicated by the CV test (p < 0.03, F test) and a large (>2.5-fold) change in PPR (Fig. 8D). The dopaminergic enhancement observed in this pair was similar to the previously observed dopaminergic facilitation of synaptic transmission among unidentified types of SPNs in the striatum (our unpublished observation), as well as to the D1R-mediated facilitation described by Tecuapetla et al. (2007) and demonstrates that this modulatory mechanism was functional in our preparation.
Discussion
Inhibitory interactions among projection neurons have long been assumed to represent a key mechanism of information processing in the neostriatum (Groves, 1983), but, despite increasingly detailed characterization, the significance of this synaptic network remains unclear. In particular, the unusually small amplitude of most unitary collateral interactions reported in previous studies (Tunstall et al., 2002; Guzmán et al., 2003; Koos et al., 2004) and the apparent randomness of connectivity have called into question the traditionally presumed role of competitive response selection (Wickens and Oorshott, 2000; Plenz, 2003) that would rely on communicating specific information contained in the temporal and/or spatial pattern of activity of relatively small groups of SPNs (Tepper and Bolam, 2004; Tepper et al., 2008).
Contrary to the initially apparent lack of specificity in the axon collateral network, recent evidence indicates that synaptic interactions among SPNs are highly organized and exhibit physiological properties that are specific to the identity of the interacting SPN subtypes (Taverna et al., 2008). Most interestingly, the heterogeneity of synaptic connections has been found to extend to differential expression of multiple neuromodulatory mechanisms (Freiman et al., 2006; Tecuapetla et al., 2007; Shindou et al., 2008), including the regulation by dopamine. Specifically, paired recordings from unidentified subtypes of SPNs demonstrate that synaptic transmission at individual connections can be facilitated by activation of D1 receptors, inhibited by activation of D2 receptors, and, in a subset of connections, regulated by both of these mechanisms (Guzmán et al., 2003; Tecuapetla et al., 2007). Based on the cell type-specific expression of D1 and D2 receptors in the striatum, we hypothesized that the expression of the various dopaminergic regulatory mechanisms may be specific to the particular subtypes of SPNs that participate in the connection. In the present study, we began testing this hypothesis by examining the effect of dopamine on identified intrastriatal connections of striatopallidal neurons.
The first main finding of the present study is the strong dopaminergic inhibition of synaptic transmission between presynaptic striatopallidal and postsynaptic striatopallidal or striatonigral neurons. Complete reversal of the inhibitory effect of dopamine on intrastriatal striatopallidal axon collaterals by sulpiride showed that the inhibition is D2-family dopamine receptor mediated. Several different analyses demonstrated that the inhibitory effect of dopamine is predominantly presynaptic. The possibility of mediation through activation of a muscarinic receptor was eliminated by running the experiments in the presence of atropine. These observations, together with the known expression of the D2 receptor in striatopallidal neurons and the absence of presynaptic modulation of striatally evoked IPSCs in the globus pallidus in D2 receptor knock-outs (Shin et al., 2003), suggest that the inhibitory effect is mediated by D2 and not D3 or D4 receptors and that these receptors are directly localized to presynaptic striatopallidal terminals. The possibility that some other signaling molecule, e.g., a cannabinoid (Centonze et al., 2002; Adermark et al., 2009), is involved cannot be completely excluded, but the bulk of the evidence favors direct action at a presynaptic D2 receptor.
D2 receptor-mediated inhibition of GABAergic transmission in the striatum has been described previously (Nicola and Malenka, 1998; Delgado et al., 2000; Momiyama and Koga, 2001; Centonze et al., 2002; Guzmán et al., 2003; Tecuapetla et al., 2007). However, most of the previous studies examined heterogeneous inhibitory inputs originating from multiple sources, and therefore their results are difficult to integrate with our findings. The uniformly strong inhibitory effect of dopamine suggests that these connections are regulated by inhibitory D2 receptors and do not also express the previously described D1 receptor-mediated facilitatory mechanism (Guzmán et al., 2003; Tecuapetla et al., 2007). The absence of dopaminergic facilitation of these synapses was not the result of an artifactual or age-dependent dysregulation of this mechanism in our preparation because a facilitatory response to dopamine could be readily detected when the presynaptic neuron was an SP+/ENK− striatonigral neuron. Moreover, the possibility that the observed dopaminergic modulation of the connections of striatopallidal neurons was species dependent reflected some abnormality of the transgenic animals or resulted from a bias introduced by the supraphysiological [Ca2+]e or the slow bath application of dopamine was excluded in paired recording control experiments in rat slices using fast local drug application in nominally physiological [Ca2+]e.
The previous findings of Tecuapetla et al. (2007) together with our results showing exclusively D2R-mediated control of the connections of striatopallidal neurons suggest that the connections exhibiting D1R-mediated enhancement and the connections regulated by both D1 and D2 receptors reported previously are likely formed by striatonigral axon collaterals. The involvement of D1 receptors at these synapses is consistent with the D1R-mediated facilitatory effect of dopamine on striatal IPSCs in the substantia nigra (Radnikow and Misgeld, 1998) and with our limited observation made on intrastriatal connections in the rat described in this study. Additional studies will be required to understand the nature and mechanism of the effect of dopamine on these synapses.
The second main finding of this study is the demonstration of the existence of two distinct types of connections between striatopallidal neurons. The two types of connections could be distinguished on the basis of biophysical criteria as well as their differential modulation by dopamine. The main biophysical distinction between the two types of connections was an approximate sixfold difference between their mean IPSC amplitudes, giving rise to a clearly bimodal distribution of IPSC amplitudes between striatopallidal neurons. Importantly, both large- and small-amplitude connections were observed in both rodent species examined. Quantal analysis indicates that the main biophysical difference between the two types of connections is the approximately fourfold higher number of synaptic release sites involved in the large-amplitude connections. It is also possible that the resting release probability is slightly higher at large-amplitude connections.
In addition to their biophysical difference, the two types of connections could be distinguished on the basis of their differential responses to dopamine. Although small-amplitude striatopallidal collateral connections were consistently and powerfully inhibited by dopamine, large-amplitude connections were completely unresponsive to this neuromodulator. The lack of dopaminergic modulation was not a result of simultaneous activation of competing D1 receptor-mediated facilitatory and D2 receptor-mediated inhibitory mechanisms because D2 receptor blockade did not induce a systematic increase of the IPSC amplitude in these connections. Most importantly, the perfect correlation between the biophysical properties and the dopaminergic modulation indicates that the biophysical difference between the two types of connections is not a slice preparation artifact (e.g., differential damage to the presynaptic axonal arbors). In addition, dopamine-unresponsive large-amplitude connections were also observed among ENK+/SP− striatopallidal neurons in the rat, demonstrating that the heterogeneity of dopamine modulation among striatopallidal connections is not species specific or an artifact of the transgenic animals.
The demonstration of the two distinct types of synaptic connections among striatopallidal neurons reveals a previously unrecognized complexity of the organization of the striatal network. The reason for the existence of two clearly distinct types of connections within the population of otherwise apparently identical striatopallidal SPNs is not clear. The possibility that presynaptic neurons participating in the large-amplitude connections may have been interneurons was excluded using morphological and physiological identification of these neurons. The possibility of incorrectly identifying these neurons as striatopallidal neurons on the basis of EGFP expression was excluded by the demonstration that retrogradely labeled neurons from the substantia nigra are distinct from EGFP+ neurons in these animals and by the similar biophysical properties and dopaminergic modulation of small- and large-amplitude connections of ENK+/SP− striatopallidal neurons in the rat. Although a number of possibilities exist, our favored hypothesis is that the small- and large-amplitude connections may be specific to SPN in the matrix and the patch compartments in the striatum, respectively. This suggestion is supported by the relative proportion of the large-amplitude connections, which is similar to the proportional volume of the patch compartment in the striatum and is consistent with the known physiology, chemical, and morphological similarity between patch and matrix neurons (Kawaguchi et al., 1989). Moreover, differential neuromodulation of GABAergic transmission in the two compartments from unidentified presynaptic sources has been demonstrated recently (Miura et al., 2007).
In summary, the present study demonstrates a high degree of specialization of the physiological properties, dopaminergic modulation, and presynaptic dopamine receptor expression of the intrastriatal synaptic connections formed by striatopallidal neurons. Additional studies will be required to elucidate the corresponding properties of intrastriatal connections of striatonigral neurons to form a complete picture of the functional role played by the dopaminergic control of the circuitry of neostriatal projection neurons.
Footnotes
This research was supported, in part, by National Institutes of Health (NIH) Grant NS052370 and a Busch Biomedical Research grant of Rutgers University (T.K.), NIH Grant NS034865 (J.M.T.), Consejo Nacional de Ciencia y Technología (F.T.), and the National Parkinson's Foundation and National Institute of Mental Health Grants RO1-MH067830 and P50-MH068789 (M.F.Y.). T.K. dedicates this publication to the memory of the late Professor Patricia Goldman-Rakic, who acted as his mentor during the early phase of this work. We thank Dr. M. Levine for the suggestion of using the transgenic mice and providing breeding pairs, F. Shah for excellent technical assistance, Drs. D.J. Surmeier and Z. Yan for advice on RT-PCR, Dr. W.-J. Gao for discussion and advice on recording methods, Drs. J. Magee and B. K. Andrasfalvy for advice on slice preparation and recording methods, and Erzsebet Borok, Joann Coburn, and Klara Szigeti for technical assistance.
References
- Adermark L, Talani G, Lovinger DM. Endocannabinoid-dependent plasticity at GABAergic and glutamatergic synapses in the striatum is regulated by synaptic activity. Eur J Neurosci. 2009;29:32–41. doi: 10.1111/j.1460-9568.2008.06551.x. [DOI] [PMC free article] [PubMed] [Google Scholar]
- Centonze D, Picconi B, Baunez C, Borrelli E, Pisani A, Bernardi G, Calabresi P. Cocaine and amphetamine depress striatal GABAergic synaptic transmission through D2 dopamine receptors. Neuropsychopharmacology. 2002;26:164–175. doi: 10.1016/S0893-133X(01)00299-8. [DOI] [PubMed] [Google Scholar]
- Clements JD, Silver RA. Unveiling synaptic plasticity: a new graphical and analytical approach. Trends Neurosci. 2000;23:105–113. doi: 10.1016/s0166-2236(99)01520-9. [DOI] [PubMed] [Google Scholar]
- Cooper AJ, Stanford IM. Dopamine D2 receptor mediated presynaptic inhibition of striatopallidal GABA(A) IPSCs in vitro. Neuropharmacology. 2001;41:62–71. doi: 10.1016/s0028-3908(01)00038-7. [DOI] [PubMed] [Google Scholar]
- Czubayko U, Plenz D. Fast synaptic transmission between striatal spiny neurons. Proc Natl Acad Sci U S A. 2002;99:15764–15769. doi: 10.1073/pnas.242428599. [DOI] [PMC free article] [PubMed] [Google Scholar]
- Day M, Wang Z, Ding J, An X, Ingham CA, Shering AF, Wokosin D, Ilijic E, Sun Z, Sampson AR, Mugnaini E, Deutch AY, Sesack SR, Arbuthnott GW, Surmeier DJ. Selective elimination of glutamatergic synapses on striatopallidal neurons in Parkinson disease models. Nat Neurosci. 2006;9:251–259. doi: 10.1038/nn1632. [DOI] [PubMed] [Google Scholar]
- Del Castillo J, Katz B. Quantal components of the end-plate potential. J Physiol. 1954;124:560–573. doi: 10.1113/jphysiol.1954.sp005129. [DOI] [PMC free article] [PubMed] [Google Scholar]
- Delgado A, Sierra A, Querejeta E, Valdiosera RF, Aceves J. Inhibitory control of the GABAergic transmission in the rat neostriatum by D2 dopamine receptors. Neuroscience. 2000;95:1043–1048. doi: 10.1016/s0306-4522(99)00495-9. [DOI] [PubMed] [Google Scholar]
- Freiman I, Anton A, Monyer H, Urbanski MJ, Szabo B. Analysis of the effects of cannabinoids on identified synaptic connections in the caudate-putamen by paired recordings in transgenic mice. J Physiol. 2006;575:789–806. doi: 10.1113/jphysiol.2006.114272. [DOI] [PMC free article] [PubMed] [Google Scholar]
- Geiger JR, Melcher T, Koh DS, Sakmann B, Seeburg PH, Jonas P, Monyer H. Relative abundance of subunit mRNAs determines gating and Ca2+ permeability of AMPA receptors in principal neurons and interneurons in rat CNS. Neuron. 1995;15:193–204. doi: 10.1016/0896-6273(95)90076-4. [DOI] [PubMed] [Google Scholar]
- Gerfen CR, Engber TM, Mahan LC, Susel Z, Chase TN, Monsma FJ, Jr, Sibley DR. D1 and D2 dopamine receptor-regulated gene expression of striatonigral and striatopallidal neurons. Science. 1990;250:1429–1432. doi: 10.1126/science.2147780. [DOI] [PubMed] [Google Scholar]
- Gertler TS, Chan CS, Surmeier DJ. Dichotomous anatomical properties of adult striatal medium spiny neurons. J Neurosci. 2008;28:10814–10824. doi: 10.1523/JNEUROSCI.2660-08.2008. [DOI] [PMC free article] [PubMed] [Google Scholar]
- Gong S, Zheng C, Doughty ML, Losos K, Didkovsky N, Schambra UB, Nowak NJ, Joyner A, Leblanc G, Hatten ME, Heintz N. A gene expression atlas of the central nervous system based on bacterial artificial chromosomes. Nature. 2003;425:917–925. doi: 10.1038/nature02033. [DOI] [PubMed] [Google Scholar]
- Groves PM. A theory of the functional organization of the neostriatum and the neostriatal control of voluntary movement. Brain Res. 1983;286:109–132. doi: 10.1016/0165-0173(83)90011-5. [DOI] [PubMed] [Google Scholar]
- Guzmán JN, Hernández A, Galarraga E, Tapia D, Laville A, Vergara R, Aceves J, Bargas J. Dopaminergic modulation of axon collaterals interconnecting spiny neurons of the rat striatum. J Neurosci. 2003;23:8931–8940. doi: 10.1523/JNEUROSCI.23-26-08931.2003. [DOI] [PMC free article] [PubMed] [Google Scholar]
- Jonas P, Racca C, Sakmann B, Seeburg PH, Monyer H. Differences in Ca2+ permeability of AMPA-type glutamate receptor channels in neocortical neurons caused by differential GluR-B subunit expression. Neuron. 1994;12:1281–1289. doi: 10.1016/0896-6273(94)90444-8. [DOI] [PubMed] [Google Scholar]
- Jones HC, Keep RF. Brain fluid calcium concentration and response to acute hypercalcaemia during development in the rat. J Physiol. 1988a;402:579–593. doi: 10.1113/jphysiol.1988.sp017223. [DOI] [PMC free article] [PubMed] [Google Scholar]
- Jones HC, Keep RF. Brain interstitial fluid calcium concentration during development in the rat: control levels and changes in acute plasma hypercalcaemia. Physiol Bohemoslov. 1988b;37:213–216. [PubMed] [Google Scholar]
- Kawaguchi Y, Wilson CJ, Emson PC. Intracellular recording of identified neostriatal patch and matrix spiny cells in a slice preparation preserving cortical inputs. J Neurophysiol. 1989;62:1052–1068. doi: 10.1152/jn.1989.62.5.1052. [DOI] [PubMed] [Google Scholar]
- Koos T, Tepper JM, Wilson CJ. Comparison of IPSCs evoked by spiny and fast-spiking neurons in the neostriatum. J Neurosci. 2004;24:7916–7922. doi: 10.1523/JNEUROSCI.2163-04.2004. [DOI] [PMC free article] [PubMed] [Google Scholar]
- Korn H, Triller A, Mallet A, Faber DS. Fluctuating responses at a central synapse: n of binomial fit predicts number of stained presynaptic boutons. Science. 1981;213:898–901. doi: 10.1126/science.6266015. [DOI] [PubMed] [Google Scholar]
- Le Moine C, Bloch B. D1 and D2 dopamine receptor gene expression in the rat striatum: sensitive cRNA probes demonstrate prominent segregation of D1 and D2 mRNAs in distinct neuronal populations of the dorsal and ventral striatum. J Comp Neurol. 1995;355:418–426. doi: 10.1002/cne.903550308. [DOI] [PubMed] [Google Scholar]
- Marquardt D. An algorithm for least-squares estimation of nonlinear inequalities. SIAM J Appl Math. 1963;11:431–444. [Google Scholar]
- Matamales M, Bertran-Gonzalez J, Salomon L, Degos B, Deniau JM, Valjent E, Hervé D, Girault JA. Striatal medium-sized spiny neurons: identification by nuclear staining and study of neuronal subpopulations in BAC transgenic mice. PLoS ONE. 2009;4:e4770. doi: 10.1371/journal.pone.0004770. [DOI] [PMC free article] [PubMed] [Google Scholar]
- Miura M, Saino-Saito S, Masuda M, Kobayashi K, Aosaki T. Compartment-specific modulation of GABAergic synaptic transmission by μ-opioid receptor in the mouse striatum with green fluorescent protein-expressing dopamine islands. J Neurosci. 2007;27:9721–9728. doi: 10.1523/JNEUROSCI.2993-07.2007. [DOI] [PMC free article] [PubMed] [Google Scholar]
- Momiyama T, Koga E. Dopamine D(2)-like receptors selectively block N-type Ca(2+) channels to reduce GABA release onto rat striatal cholinergic interneurones. J Physiol. 2001;533:479–492. doi: 10.1111/j.1469-7793.2001.0479a.x. [DOI] [PMC free article] [PubMed] [Google Scholar]
- Morishima M, Kawaguchi Y. Recurrent connection patterns of corticostriatal pyramidal cells in frontal cortex. J Neurosci. 2006;26:4394–4405. doi: 10.1523/JNEUROSCI.0252-06.2006. [DOI] [PMC free article] [PubMed] [Google Scholar]
- Nicola SM, Malenka RC. Modulation of synaptic transmission by dopamine and norepinephrine in ventral but not dorsal striatum. J Neurophysiol. 1998;79:1768–1776. doi: 10.1152/jn.1998.79.4.1768. [DOI] [PubMed] [Google Scholar]
- Ninio J. Doubts about quantal analysis. J Neurophysiol. 2007;98:1827–1835. doi: 10.1152/jn.01254.2006. author reply 1836–1840. [DOI] [PubMed] [Google Scholar]
- Plenz D. When inhibition goes incognito: feedback interaction between spiny projection neurons in striatal function. Trends Neurosci. 2003;26:436–443. doi: 10.1016/S0166-2236(03)00196-6. [DOI] [PubMed] [Google Scholar]
- Radnikow G, Misgeld U. Dopamine D1 receptors facilitate GABAA synaptic currents in the rat substantia nigra pars reticulata. J Neurosci. 1998;18:2009–2016. doi: 10.1523/JNEUROSCI.18-06-02009.1998. [DOI] [PMC free article] [PubMed] [Google Scholar]
- Shin RM, Masuda M, Miura M, Sano H, Shirasawa T, Song WJ, Kobayashi K, Aosaki T. Dopamine D4 receptor-induced postsynaptic inhibition of GABAergic currents in mouse globus pallidus neurons. J Neurosci. 2003;23:11662–11672. doi: 10.1523/JNEUROSCI.23-37-11662.2003. [DOI] [PMC free article] [PubMed] [Google Scholar]
- Shindou T, Arbuthnott GW, Wickens JR. Actions of adenosine A 2A receptors on synaptic connections of spiny projection neurons in the neostriatal inhibitory network. J Neurophysiol. 2008;99:1884–1889. doi: 10.1152/jn.01259.2007. [DOI] [PubMed] [Google Scholar]
- Shuen JA, Chen M, Gloss B, Calakos N. Drd1a-tdTomato BAC transgenic mice for simultaneous visualization of medium spiny neurons in the direct and indirect pathways of the basal ganglia. J Neurosci. 2008;28:2681–2685. doi: 10.1523/JNEUROSCI.5492-07.2008. [DOI] [PMC free article] [PubMed] [Google Scholar]
- Smith Y, Bevan MD, Shink E, Bolam JP. Microcircuitry of the direct and indirect pathways of the basal ganglia. Neuroscience. 1998;86:353–387. doi: 10.1016/s0306-4522(98)00004-9. [DOI] [PubMed] [Google Scholar]
- Stricker C, Redman S, Daley D. Statistical analysis of synaptic transmission: model discrimination and confidence limits. Biophys J. 1994;67:532–547. doi: 10.1016/S0006-3495(94)80513-2. [DOI] [PMC free article] [PubMed] [Google Scholar]
- Stricker C, Field AC, Redman SJ. Statistical analysis of amplitude fluctuations in EPSCs evoked in rat CA1 pyramidal neurones in vitro. J Physiol. 1996;490:419–441. doi: 10.1113/jphysiol.1996.sp021155. [DOI] [PMC free article] [PubMed] [Google Scholar]
- Surmeier DJ, Song WJ, Yan Z. Coordinated expression of dopamine receptors in neostriatal medium spiny neurons. J Neurosci. 1996;16:6579–6591. doi: 10.1523/JNEUROSCI.16-20-06579.1996. [DOI] [PMC free article] [PubMed] [Google Scholar]
- Taverna S, Ilijic E, Surmeier DJ. Recurrent collateral connections of striatal medium spiny neurons are disrupted in models of Parkinson's disease. J Neurosci. 2008;28:5504–5512. doi: 10.1523/JNEUROSCI.5493-07.2008. [DOI] [PMC free article] [PubMed] [Google Scholar]
- Tecuapetla F, Carrillo-Reid L, Bargas J, Galarraga E. Dopaminergic modulation of short-term synaptic plasticity at striatal inhibitory synapses. Proc Natl Acad Sci U S A. 2007;104:10258–10263. doi: 10.1073/pnas.0703813104. [DOI] [PMC free article] [PubMed] [Google Scholar]
- Tepper JM, Bolam JP. Functional diversity and specificity of neostriatal interneurons. Curr Opin Neurobiol. 2004;14:685–692. doi: 10.1016/j.conb.2004.10.003. [DOI] [PubMed] [Google Scholar]
- Tepper JM, Wilson CJ, Koós T. Feedforward and feedback inhibition in neostriatal GABAergic spiny neurons. Brain Res Rev. 2008;58:272–281. doi: 10.1016/j.brainresrev.2007.10.008. [DOI] [PMC free article] [PubMed] [Google Scholar]
- Tunstall MJ, Oorschot DE, Kean A, Wickens JR. Inhibitory interactions between spiny projection neurons in the rat striatum. J Neurophysiol. 2002;88:1263–1269. doi: 10.1152/jn.2002.88.3.1263. [DOI] [PubMed] [Google Scholar]
- Wang HB, Laverghetta AV, Foehring R, Deng YP, Sun Z, Yamamoto K, Lei WL, Jiao Y, Reiner A. Single-cell RT-PCR, in situ hybridization histochemical, and immunohistochemical studies of substance P and enkephalin co-occurrence in striatal projection neurons in rats. J Chem Neuroanat. 2006;31:178–199. doi: 10.1016/j.jchemneu.2006.01.003. [DOI] [PubMed] [Google Scholar]
- Wickens JR, Oorshot DE. Neural dynamics and surround inhibition in the neostriatum: a possible connection. In: Miller R, Wickens JR, editors. Brain dynamics in the striatal complex. Reading, UK: Gordon and Breach; 2000. pp. 141–150. [Google Scholar]
- Yung KK, Bolam JP, Smith AD, Hersch SM, Ciliax BJ, Levey AI. Immunocytochemical localization of D1 and D2 dopamine receptors in the basal ganglia of the rat: light and electron microscopy. Neuroscience. 1995;65:709–730. doi: 10.1016/0306-4522(94)00536-e. [DOI] [PubMed] [Google Scholar]
- Yung KK, Smith AD, Levey AI, Bolam JP. Synaptic connections between spiny neurons of the direct and indirect pathways in the neostriatum of the rat: evidence from dopamine receptor and neuropeptide immunostaining. Eur J Neurosci. 1996;8:861–869. doi: 10.1111/j.1460-9568.1996.tb01573.x. [DOI] [PubMed] [Google Scholar]