Abstract
Summary
The spectral processed Förster resonance energy transfer (psFRET) imaging method provides an effective and fast method for measuring protein–protein interactions in living specimens. The commercially available linear unmixing algorithms efficiently remove the contribution of donor spectral bleedthrough to the FRET signal. However, the acceptor contribution to spectral bleedthrough in the FRET image cannot be similarly removed, since the acceptor spectrum is identical to the FRET spectrum. Here, we describe the development of a computer algorithm that measures and removes the contaminating ASBT signal in the sFRET image. The new method is characterized in living cells that expressed FRET standards in which the donor and acceptor fluorescent proteins are tethered by amino acid linkers of specific lengths. The method is then used to detect the homo-dimerization of a transcription factor in the nucleus of living cells, and then to measure the interactions of that protein with a second transcription factor.
Keywords: C/EBPα, confocal, FRET, green fluorescent proteins, protein dimerization, spectral bleedthrough, spectral imaging
Introduction
The development of genetically encoded fluorescent proteins (FPs) that are suitable donors and acceptors for Förster resonance energy transfer (FRET) microscopy has greatly expanded the utility of this approach (Chudakov et al., 2005; Shaner et al., 2005). FRET microscopy measures the effects of energy transfer on the donor and acceptor fluorophores, and can be used to determine their spatial relationship over distances of up to 10 nm. The efficient transfer of energy requires that the donor and acceptor fluorophores share a strong spectral overlap, and that they have a favourable dipole–dipole orientation and high quantum yield (Lakowicz, 1999; Jares-Erijman & Jovin, 2003; Periasamy & Day, 2005; Vogel et al., 2006; Wallrabe & Periasamy, 2005). When these criteria are met, the excitation of the donor fluorophore will lead to the direct transfer of some of its excited state energy to nearby acceptor fluorophores. This will cause the quenching of the donor fluorescence and a decrease in its fluorescence lifetime, while leading to sensitized emission from the acceptor (Chen & Periasamy, 2004).
The strong spectral overlap of the donor and acceptor that is required for FRET also leads to a substantial fluorescence background that interferes with the detection of the FRET signals. Both the donor and acceptor contribute to this spectral bleedthrough (SBT) background that is detected in the FRET channel. The donor contribution, called donor spectral bleedthrough (DSBT), results from the overlap of the donor emission into the FRET channel. The acceptor contribution results from the excitation of the acceptor fluorophores at the donor excitation wavelength, and is called acceptor spectral bleedthrough (ASBT). In addition, other sources of noise contaminate the FRET signals, including autofluorescence, detector and optical noise, and spectral sensitivity variations in donor and acceptor channels. Therefore, the accurate measurement of FRET signals requires the use of methods that either avoid or remove these background signals.
Methods such as acceptor photobleaching FRET (apFRET) and fluorescence lifetime imaging microscopy (FLIM) avoid the problems associated with SBT, but these approaches have other limitations. The apFRET method determines the FRET efficiency by measuring the difference between the quenched donor signal in the presence of the acceptor, and the dequenched donor signal after the acceptor has been bleached (Bastiaens & Jovin, 1996; Wouters et al., 1998; Day et al., 2001; Zal et al., 2004). The advantage of this approach is that each cell serves as its own control, making it among the most accurate methods for measuring FRET. However, apFRET requires that the bleaching of the acceptor be very selective, since any bleaching of the donor fluorophore will lead to an underestimation of the donor dequenching. Furthermore, since the acceptor is irreversibly bleached, the apFRET method cannot be repeated on the same cell (Day et al., 2001). Alternatively, the measurement of the donor fluorescence lifetime can be used to avoid the problems associated with acceptor photobleaching. The fluorescence lifetime of a fluorophore is sensitive to processes that influence the excited state, and the FLIM method can be used to detect the change in donor fluorophore lifetime that accompanies the energy transfer to the acceptor fluorophores (Centonze et al., 2003; Chen et al., 2003; Clegg et al., 2003; Dong et al., 2003). However, the interpretation of fluorescence lifetime measurements is complicated because most of the FPs that have been characterized in living cells exhibited multi-exponential fluorescence decays (Suhling et al., 2002). For example, the cyan FP (CFP) was found to exhibit different fluorescent states, which limit its utility as a donor in FLIM-FRET experiments (Tramier et al., 2004). Although neither method is broadly applicable, both the apFRET and FRET-FLIM represent important methods for verifying FRET measurements that are obtained by other methods (Day & Schaufele, 2005).
More broadly applicable methods have been developed that remove the contaminating background from the signals in the FRET channel. For example, computer algorithms are available that estimate and remove the contaminating signals from the FRET images. This approach uses either two or three different filter combinations to acquire reference images from control cells that express only the donor- or acceptor-labelled proteins (Gordon et al., 1998; Xia & Liu, 2001; Elangovan et al., 2003; Chen et al., 2005). A computer algorithm is used to determine the various SBT and background noise components in the reference images. This information is then used to remove the contaminating background from FRET images acquired from experimental cells under identical conditions. Importantly, this approach can be used for any intensity-based FRET imaging system, including wide-field, total internal reflection (TIRF) and confocal microscopy. These SBT correction methods, however, require very careful analysis of the signals measured from the reference cells. For example, we developed a processed FRET algorithm (PFRET; described in Chen et al., 2005) that determines the various SBT and background noise components in discrete intensity ranges, allowing SBT correction for both linear and non-linear intensity distributions (Chen et al., 2005; Chen & Periasamy, 2006; Wallrabe et al., 2006).
Improvements in the speed and accuracy of measurements of the SBT contributions of donor, acceptor and background noise can be achieved using spectral imaging approaches (Clegg, 1992; Zimmermann et al., 2002). Spectral imaging systems with acousto-optic tunable filters (AOTF) can be used to obtain images at a series of discrete wavelength bands, generating what are called lambda stacks. The spectral signatures for the individual fluorophores or the background signals are obtained from these lambda stacks, and the method of linear unmixing can then be used to separate the contributions of individual signals in each pixel of an acquired image (Dickinson et al., 2003). In this paper, we describe the use of spectral FRET (sFRET) imaging to detect the spatial relationships of proteins that are labelled with FPs and expressed in living cells. We show how linear unmixing can define and remove the contribution of DSBT to the FRET signal. However, since the spectrum of the ASBT is identical to the FRET signal, it was necessary to develop a method to identify the contribution of the ASBT signal. Here, we describe a computer algorithm that was designed to measure and then remove the contaminating ASBT signal in the sFRET image. The new method is characterized in living cells that expressed donor and acceptor FPs that were tethered by amino acid linkers of specific lengths. The method is then used to detect the homo-dimerization of a transcription factor in the nucleus of living cells, and then to measure the interactions of that protein with a second transcription factor.
Methods
Plasmids
The plasmid vectors that encode the enhanced cyan FP (ECFP) and yellow FP (EYFP) were originally obtained from Clontech (Clonetech Laboratories Inc., Mountain View, CA, USA). The sequences encoding both ECFP and EYFP were mutated to incorporate the monomeric A206K change (Zacharias et al., 2002), and the EYFP sequence was changed to incorporate the F46L Venus mutation (Nagai et al., 2002). The preparation plasmids encoding stoichiometric FRET standards to estimate the concentration of the donor and acceptor molecules were described earlier (Thaler et al., 2005). Four different FRET standards, the C5V, CVC, VCV and CTV constructs, were used in our studies. The C5V construct encodes the Cerulean variant of CFP (Rizzo et al., 2004), separated from the Venus YFP by a five–amino acid linker. The CVC construct encodes two copies of the Cerulean FP, each separated from the Venus FP by a five–amino acid linker, whereas the VCV encodes two copies of Venus FP, each separated from the Cerulean FP by a five–amino acid linker. The CTV construct serves as a negative control, and contains the Cerulean FP separated from the Venus FP by the 229 amino acid tumour necrosis factor receptor– associated factor (TRAF) domain. The sequence encoding the basic region-leucine zipper (BZip) domain (amino acids 237–358) of the rat CCAAT/enhancer binding protein alpha (C/EBPα) was amplified by polymerase chain reaction using primers incorporating suitable restriction enzyme sites. The FP-BZip plasmids encoded a 40-kDa protein consisting of the monomeric ECFP or EYFP F46L fused to the 122 amino acid C/EBPα BZip domain. The construction of plasmid encoding YFP-Pit-1 was described previously (Enwright et al., 2003).
Tissue culture and transfection
Mouse pituitary GHFT1 cells (Lew et al., 1992) were maintained as monolayer cultures in Dulbecco’s Modified Eagles Medium containing 10% newborn calf serum. The cells were harvested by brief treatment with trypsin (0.05%) in 0.53 mM EDTA and recovered by centrifugation. The cell pellets were resuspended in Dulbecco’s calcium-magnesium-free phosphate-buffered saline with 0.1% glucose and1ng/mL Biobrene (Applied Biosystems, Foster City, CA) at a final concentration of approximately 1 × 10⁷ cells per millilitre. The cells were transfected with the indicated plasmid DNA(s) by electroporation as described earlier (Day et al., 2001). The total input DNA was kept constant using empty vector DNA. The production of the correct size proteins was verified by Western blotting of extracts prepared from transfected cells as described previously (Day et al., 2003). For imaging the living cells, suspensions of the transfected cells were added drop-wise onto a sterile cover glass in 35-mm culture dishes, and the cells were allowed to attach to the glass prior to gently flooding the culture dish with media. The cultures were maintained in an incubator for 18 h before imaging. The cover glass with attached cells was then inserted into a chamber containing the appropriate medium, and the chamber was then placed on the microscope stage.
Spectral FRET imaging system
The imaging system used here consisted of a Zeiss Axiovert 200M epifluorescent motorized microscope with a 100-W Hg arc lamp and a halogen lamp. A plan-apochromat 63 × oil NA 1.4 objective lens was used for the studies described here. The Axiovert 200M is coupled to a Zeiss510 confocal–multiphoton–spectral imaging system (www.zeiss.de), and the system is controlled using the LSM software (version 3.5). For confocal spectral FRET imaging, the system consists of a 45-mW argon laser (458, 488, 514 nm), a 10-mW He–Ne laser (561 nm) and a diode 633-nm laser. The Zeiss510 is equipped with the 32-channel spectral META detector and optical grating system, allowing the separation of discrete fluorescence emissions without the need for emission filters. This system collects lambda stacks—a series of x–y images that sample emission wavelengths from a range of small wavelength bands (10.7 nm). A mathematical algorithm defines the spectral signature for each pixel of the scanned confocal image, which allows digital separation of the component signals (Dickinson et al., 2003).
The algorithm
We developed a computer algorithm to remove the contribution of ASBT from sFRET images. The approach is based on the assumption that when imaged under the same conditions, the ASBT dynamics will be the same in control cells that express acceptor alone as the experimental cells that express both donor and acceptor-labelled proteins. Because control samples are used to establish the ASBT contribution to the experimental samples, the individual pixel locations can not be directly compared. What can be compared, however, are the pixels that have matching fluorescence levels. The algorithm determines the pixel-by-pixel fluorescence levels and establishes the level of ASBT in control cells that express acceptor alone. These values are then applied as a correction factor to the appropriate matching pixels of the experimental cells that express both donor and acceptor-labelled proteins.
The approach requires a sequence of four spectral images (Table 1), which are subjected to linear unmixing, resulting in the five unmixed images (see Table 1) that are used to determine the contribution of ASBT to the FRET signal as follows:
| (1) |
| (2) |
| (3) |
where j is the jth range of intensity, ra(j)is the acceptor bleedthrough ratio for the jth intensity range, m is the number of pixels in d for the jth range, d_si is the intensity of pixel i, ASBT(j) is the acceptor bleedthrough for the range j, n is the number of pixels in g for the jth range, g_sp is the intensity of pixels (p), k is the number of ranges and ASBT is the total acceptor bleedthrough.
Table 1.
Sequence of image acquisition and labelling to remove ASBT in the contaminated FRET image f_s.
| Specimen | Excitation | Spectral image | Unmixed | |
|---|---|---|---|---|
| Donor | Acceptor | |||
| Donor + acceptor | Donor | DA_DS | e_s | f_s |
| Acceptor | DA_AS | g_s | ||
| Acceptor | Donor | A_DS | c_s | |
| Acceptor | A_AS | d_s |
The results of Eqs (1)–(3) are used in Eq. (4) to obtain the processed sFRET (psFRET) as follows:
| (4) |
where f_s is the uncorrected FRET signal.
Results
Development of the ASBT correction algorithm
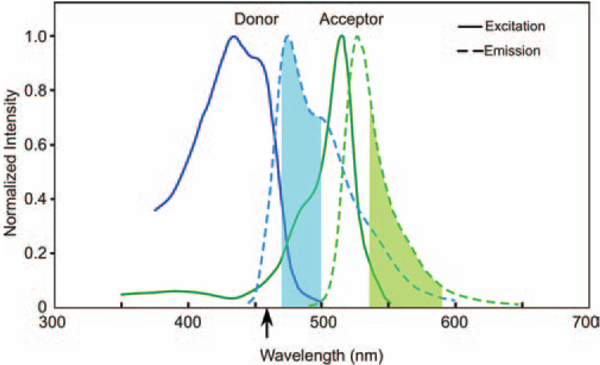
When there is energy transfer from the donor (CFP) to the acceptor (YFP) population, the signal that is measured in the FRET channel (donor excitation, acceptor emission) is contaminated by both DSBT and ASBT. Here, we use spectral imaging and linear unmixing to quantify and remove the contributions of the donor signal contamination in the FRET channel. However, because the laser line used to excite the donor also excites the acceptor, the resulting sFRET image is contaminated with ASBT (see Fig. 1).In this regard, we used the 458-nm laser line for excitation of the CFP, which resulted in significant ASBT contamination in the FRET channel (see the arrow in Fig. 1). Imaging systems that use different laser lines for donor excitation, such as the 440- or 405-nm lines, will generate less ASBT, but the contaminating signal still needs to be removed to accurately measure the sFRET signal.
Fig. 1.
SBT in filter-based intensity and spectral images. We use CFP as donor and YFP as acceptor. The CFP emission spectrum is displayed in a blue colour line and YFP emission spectrum is in a green colour line. When using filter-based intensity images for FRET, the donor emission is from 470 to 500 nm (shadowed cyan colour), and acceptor emission is from 535 to 590 nm (shadowed green–yellow colour). The quenched donor signal is part of the donor spectrum and the FRET signal is part of the acceptor spectrum. Because of the filter settings, there is acceptor back-bleedthrough into the donor emission channel (the green line inside the shadowed cyan colour) and donor bleedthrough into the acceptor emission channel (the blue broken line inside the shadowed green–yellow colour). We used our PFRET data analysis algorithm to correct these SBTs (Chen et al., 2005; Chen & Periasamy, 2006). Inspectral imaging (no filter used), after applying unmixing, the quenched donor signal is from the whole donor spectrum that is extracted from DA_DS and does not have any acceptor signal (acceptor back-bleedthrough) and the FRET signal is from the whole acceptor spectrum which is extracted from DA_DS and does not have any donor signal (donor bleedthrough) but still has ASBT.
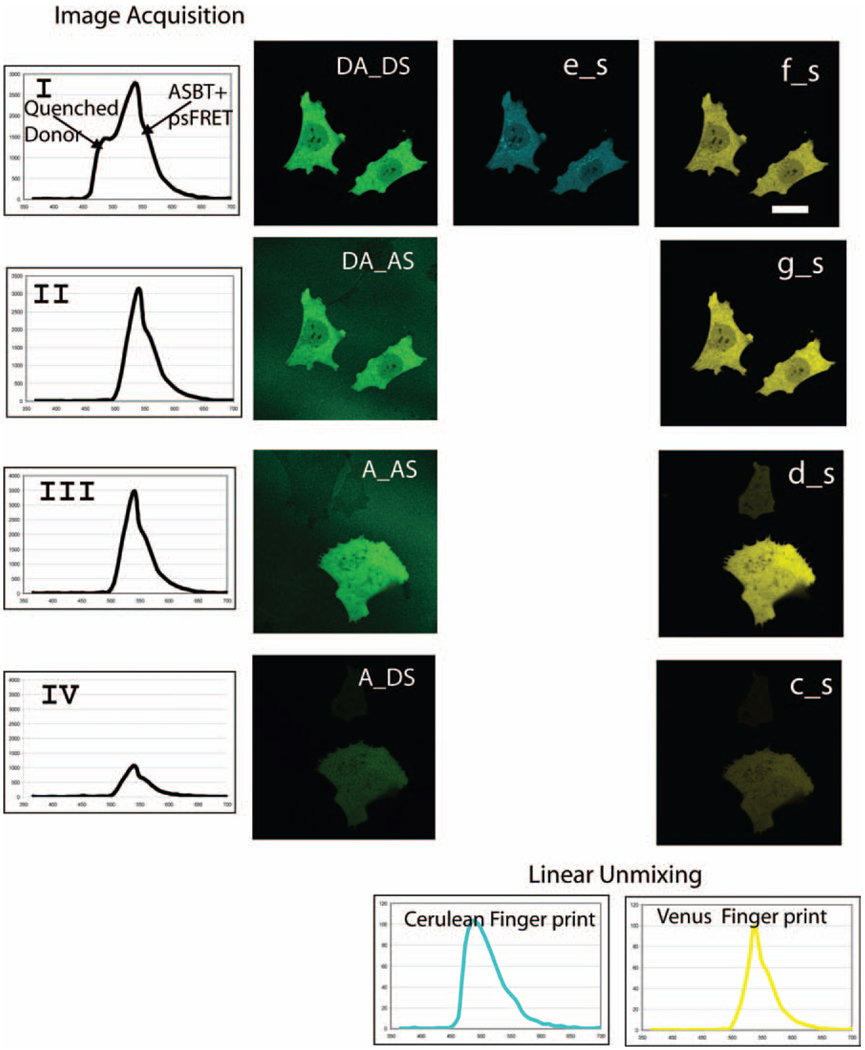
Here, we describe the development and use of a computer algorithm that identifies and removes the contribution of ASBT from the sFRET image. A sequence of images (see Table 1) was acquired of mouse GHFT1 cells that expressed the indicated FPs using the Zeiss 510 META system. First, cells that expressed donor and acceptor fluorophores directly coupled to one another (CVC, see Methods section) were illuminated at the donor excitation wavelength (458 nm), and the spectral image DA_DS was acquired (Fig. 2,Panel I). The DA_DS spectral image is the combination of the quenched donor signal, the ASBT signal and the FRET signal. A second spectral image, DA_AS (Fig. 2, Panel II) was acquired from the same cells using the acceptor excitation wavelength (514 nm). Since only the acceptor fluorophores are excited at this wavelength, the DA_AS spectral image provides the acceptor spectra. Next, spectral images of cells that expressed only the acceptor fluorophore (Venus FP) were acquired under the identical conditions to the previous image to collect the spectral image A_AS (Fig. 2, Panel III). The system was then switched to the donor excitation wavelength (458 nm), and the A_DS image was acquired under the same conditions used for the DA_DS image (Fig. 2, Panel IV). To improve the signal-to-noise ratio, all spectral images were averaged from four frames.
Fig. 2.
Spectral FRET data acquisition and linear unmixing. GHFT1 cells expressing either Venus FP (acceptor) alone or directly coupled to two Cerulean FP (donor) (CVC, see Methods section). Same optical settings were used for both imaging single or double-labelled cells. These images were unmixed as described in the text using the reference spectra of donor and acceptor. Panel I: DA_DS is spectral image from double-labelled specimen under donor excitation; e_s and f_s are unmixed from DA_DS. Panel II: DA_AS is spectral image from the same double-labelled specimen but under acceptor excitation; g_s is unmixed from DA_AS. Panel III: A_AS is spectral image from single-labelled acceptor specimen under same acceptor excitation as that from double-labelled specimen; d_s is unmixed from A_AS. Panel IV: A_DS is spectral image from single-labelled acceptor specimen under same donor excitation as that from double-labelled specimen; c_s is unmixed from A_DS, which is only acceptor bleedthrough. There are donor components from unmixing for DA_AS, A_DS and A_AS, which are not shown in the figure and are not required for the data analysis. Cerulean FP and Venus FP fingerprints were obtained from single-labelled donor and single-labelled acceptor to use for linear unmixing (shown at the bottom of the figure). All the linear unmixing were implemented using Cerulean FP, Venus FP and background spectra (not shown) (scale bar: 10 µm)
The spectral fingerprints (Fig. 2, bottom panel) for the Cerulean FP and Venus FP were then determined using cells that expressed only the Cerulean FP or Venus FP proteins. These reference spectra were used to unmix the four spectral images described earlier to generate the five unmixed images that are used to process the sFRET image (Table 1&Fig. 2). The unmixed DA_DS spectral image resulted in the quenched donor (Fig. 2, e_s) and ASBT-contaminated spectral FRET image (Fig. 2, f_s). The acceptor components from DA_AS, A_AS and A_DS spectral images are shown in the unmixed images g_s, d_s and c_s in Fig. 2, respectively. Using the system described here, there was no contribution of the donor to the DA_AS, A_AS and A_DS images (not shown), so these images were not used for data analysis.
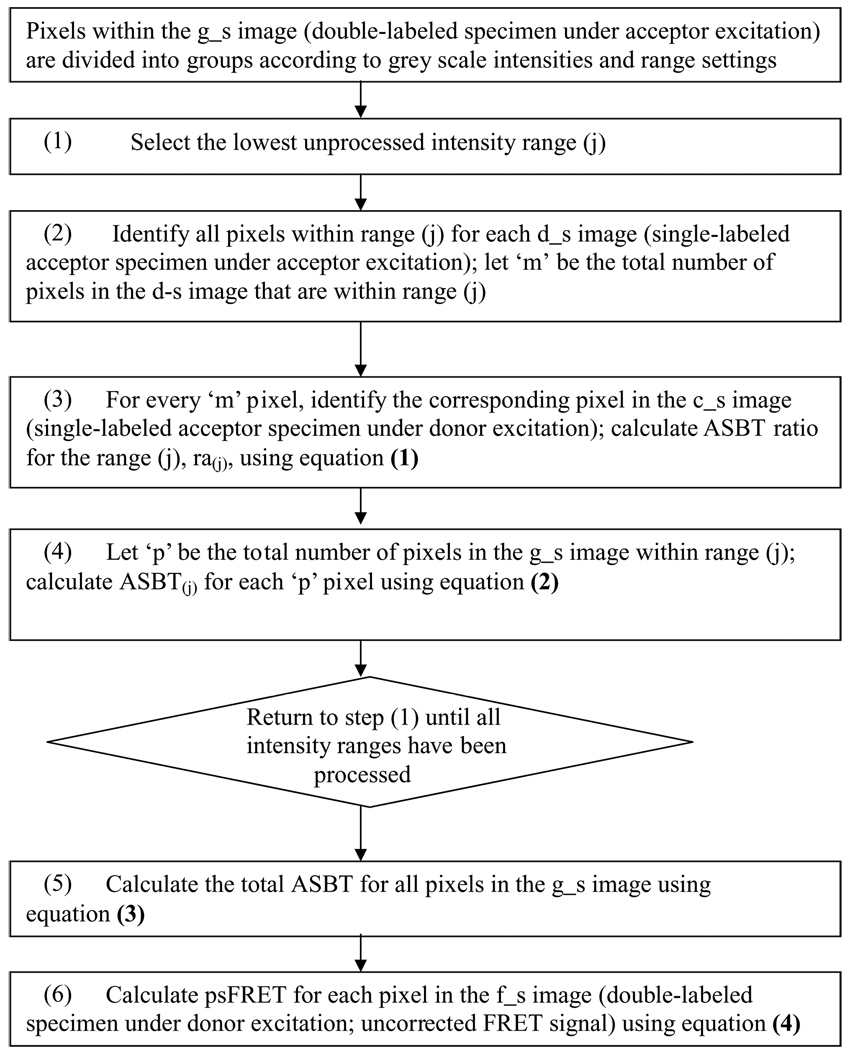
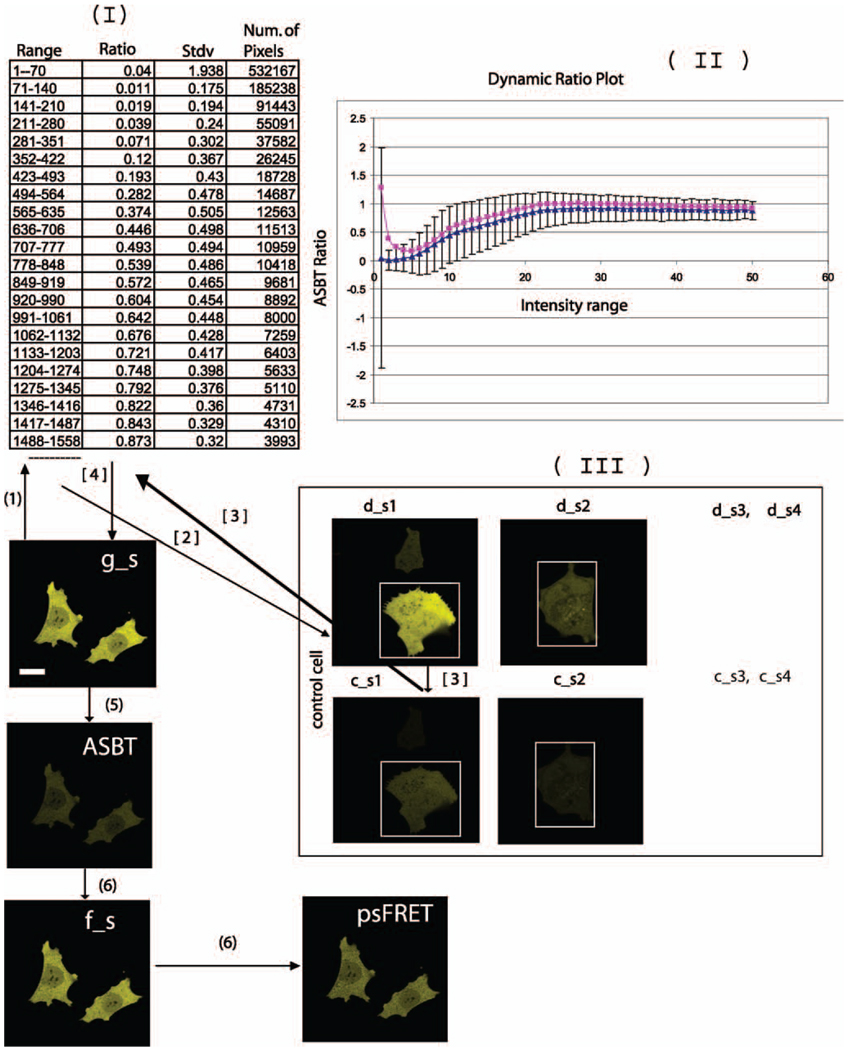
The information flow used by the psFRET algorithm is illustrated in Fig. 3a. Because background noise affects the accuracy of the estimation of the bleedthrough ratio (see Fig. 3b), and hence the accuracy of the measurement of FRET efficiency (E%), all the images used in the algorithm were background subtracted. The algorithm determines the ASBT dynamic ratio ra, the ratio at different intensity levels in the control cells (c_s, d_s; see Fig. 3b, I & II). The algorithm estimates the acceptor bleedthrough signal in each pixel of the grey level intensity values by assembling three images (g_s, d_s and c_s) as matrix elements. The c_s image is the bleedthrough signal resulting from the acceptor fluorophores. The process to correct the ASBT signal is illustrated in Fig. 3b (also see Fig. 3a). Arange of intensity values was chosen in the intensity matrix g_s (see Fig. 3b, I). This same range of selected pixel intensity values was then identified in ‘d_s’, and the corresponding ‘coordinates’ of intensity values were selected in c_s. The acceptor bleedthrough ratio ra is the ratio sum of all the elements in c_s and d_s (see Fig. 3b, I & II). These ratios are then applied to different ranges one by one by multiplying them with g s to get the ASBT (g_s * (c_s/d_s)) image. These ASBT values were used in Eq. (4) to obtain the psFRET image. The resultant psFRET image was used to estimate the energy transfer efficiency (E%) as described below.
Fig. 3.
Demonstration of the processed spectral FRET (psFRET) algorithm to remove the acceptor bleedthrough signal. (a) Flowchart for data processing using psFRET algorithm. (see Fig. 3b on page 7 to follow the flow chart); (b) Estimation of acceptor (Venus) bleedthrough ratio. (I) Bleedthrough ratio table. As an example, a portion of the range selection is shown (1–1558 grey level intensity). For that selected range, we have also shown the ratio, standard deviation and the number of pixels involved in the estimation. (II) The plot of dynamic ASBT ratio [ra, Eq. (1)] according to the table. The blue line is from background-subtracted images. The pink line is from non–background-subtracted images, which have a higher ratio. The bar represents standard deviation for 10 cells. (III) To avoid any bias produced by any set of control, several control cells are required for calculating the ratio. The ratio table is produced from 10 sets of controls, only two are displayed here. At lower intensity, the bleedthrough standard deviation is very high. It is from the background area (outside of the white rectangle) and it will not affect the calculation since it is only applied to the background area of g_s. The processing is based on whole images of control cells regardless of the location of the background and fluorescent signal. The number (1) through (6) shows how the data are processed. It matches the number in the flowchart. (see the step-by-step instructions in the text)
The energy transfer efficiency (E) is then calculated as the ratio of the donor image in the presence (IDA) and absence (ID) of acceptor as shown in the Eqs (5) and (6).
| (5) |
or
| (6) |
where e_s is the quenched donor signal. Here, in Eq. (5), we must use information acquired from two different cells to determine E. As described above, energy transferred from the donor to acceptor fluorophores results in the sensitized emission from the acceptor and quenching of donor. Thus, the value for the unquenched donor, ID, must be indirectly obtained from the psFRET image. This is achieved in Eq. (6) by adding the psFRET to the intensity of the quenched donor signal in the presence of acceptor (IDA). However, because of the difference in the quantum yield of donor and acceptor and the spectral sensitivity of the detector for donor and acceptor emission, the Eq. (6) must be revised as follows:
| (7) |
where Qd is the quantum yield of the donor, Qa is the quantum yield of the acceptor, Sd is the PMT spectral sensitivity of the donor emission wavelength and Sa is the spectral sensitivity of the acceptor emission wavelength.
Characterization of the algorithm using FRET standards
The utility of the algorithm for estimating spectral FRET efficiency was first characterized using FRET standards where the Cerulean and Venus FPs were directly coupled to one another (C5V, CVC, VCV, CTV; see Methods section). In their earlier study, Thaler and colleagues (2005) showed that, because of the comparable distance between the Cerulean and Venus domains in the C5V and CVC fusion proteins, both constructs yielded similar average FRET efficiencies of approximately 40%. By contrast, the VCV fusion protein, where Cerulean has two energy transfer pathways, the average FRET efficiency was approximately 65%. As a control for low FRET efficiency, the standard in which the Cerulean and Venus domains are separated by the 229 AA TRAF domain was used (Thaler et al., 2005). The FRET efficiency for the CTV protein ranged from 2 to 6% (Thaler et al., 2005), and is consistent with the size of the TRAF domain determined by the crystal structure, which would be expected to separate the fluorophores by at least 80 Å (Park et al., 1999).
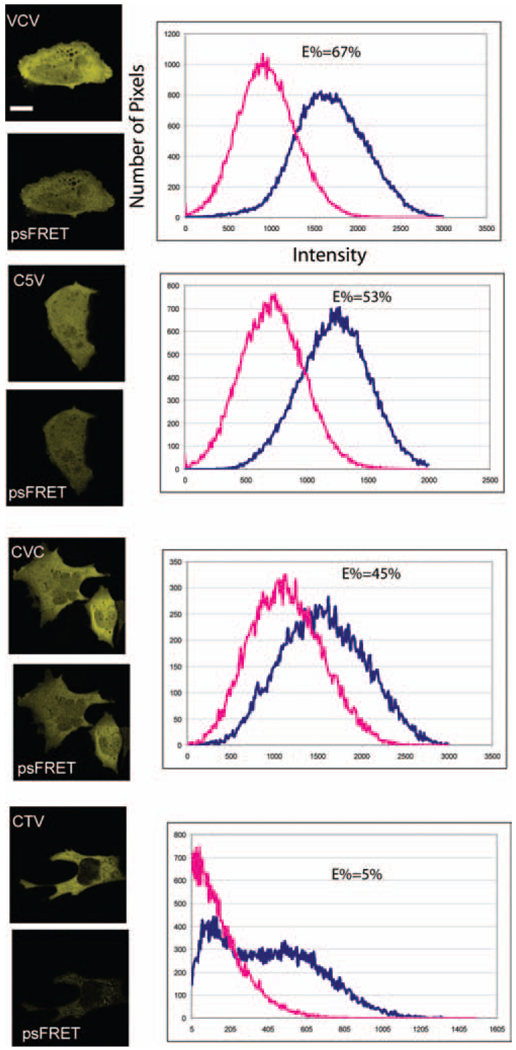
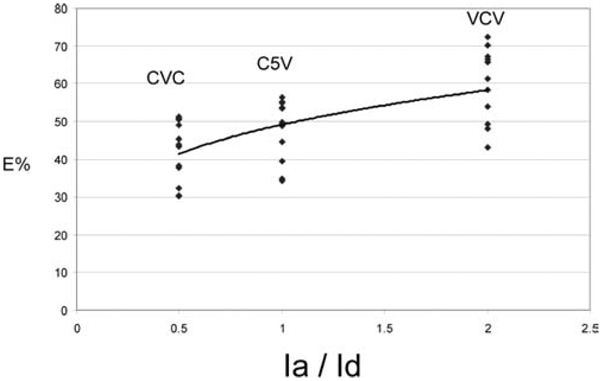
The results in Figs 4 and 5 summarize the average FRET efficiencies (E%) for each of the Cerulean–Venus fusion proteins determined using the psFRET approach. As expected, the CTV fusion protein had the lowest E%, averaging about 7%. This was in contrast to the average psFRET efficiency of about 45% measured for the C5V and CVC fusion proteins, and approximately 60% for the VCV fusion protein (Fig.5).To verify the psFRET measurements, we also acquired measurements of FRET efficiency using the same detector and same cell by the PFRET method (see Table 2). Here, the emission spectra were selected (CFP/Cerulean 468.8–500.9 nm; YFP/Venus 533–586.5 nm) in the Meta detector using the channel setting mode (www.zeiss.com). Furthermore, we also acquired data from cells on the same cover slips using the FLIM-FRET method (see Table 2). The FLIM measurements were made using the Becker & Hickl FLIM board (Becker & Hickl GmbH, Berlin, Germany), which was integrated with the Biorad Radiance 2100 (Carl Zeiss Microimaging Inc., Thornwood, NY, USA) confocal/multiphoton microscopy system (Chen & Periasamy, 2004). The FRET efficiencies (E%) obtained using each of these methods are summarized in Table 2. Taken together, the data obtained from the FRET standard fusion proteins verify the psFRET approach and demonstrate that the measurements are highly reproducible.
Fig. 4.
Verification of psFRET with FRET standards. Four FRET standards were used to demonstrate the developed psFRET algorithm for removing acceptor bleedthrough. Blue—before correction. Red—after acceptor bleedthrough correction. Respective E% values are listed in the graph. (scale bar: 10 µm)
Fig. 5.
Comparison of E% with Ia/Id ratio. This graph is plotted for 10 cells for CVC, C5V and VCV FRET standards. E% increases with increasing Ia/Id ratio, indicating that the presence of more acceptor molecule increases the rate of energy transfer.
Table 2.
Comparison of energy transfer efficiency (E%) using various methods for selected FRET standards and cells. sFRET: contaminated with acceptor bleedthrough, ASBT. (number of cells, 12).
| FRET Pair | sFRET (%) | psFRET (%) | PFRET (%) | sRET (%) | FLIM-FRET (%) |
|---|---|---|---|---|---|
| CTV | 18 (±6) | 7 (±4) | 8 (±2) | 7 (±5) | 8 (±2) |
| CVC | 52 (±5) | 43 (±3) | 44 (±4) | 40 (±5) | 42 (±3) |
| CFP + YFP-C/EBPα | 41 (±4) | 26 (±3) | 23 (±5) | — | 26 (±3) |
| CFP – C/EBPα + YFP-Pit-1 | 31 (±4) | 14 (±3) | 13 (±3) | — | 16 (±4) |
Measuring protein dimerization and non-homologous protein interactions
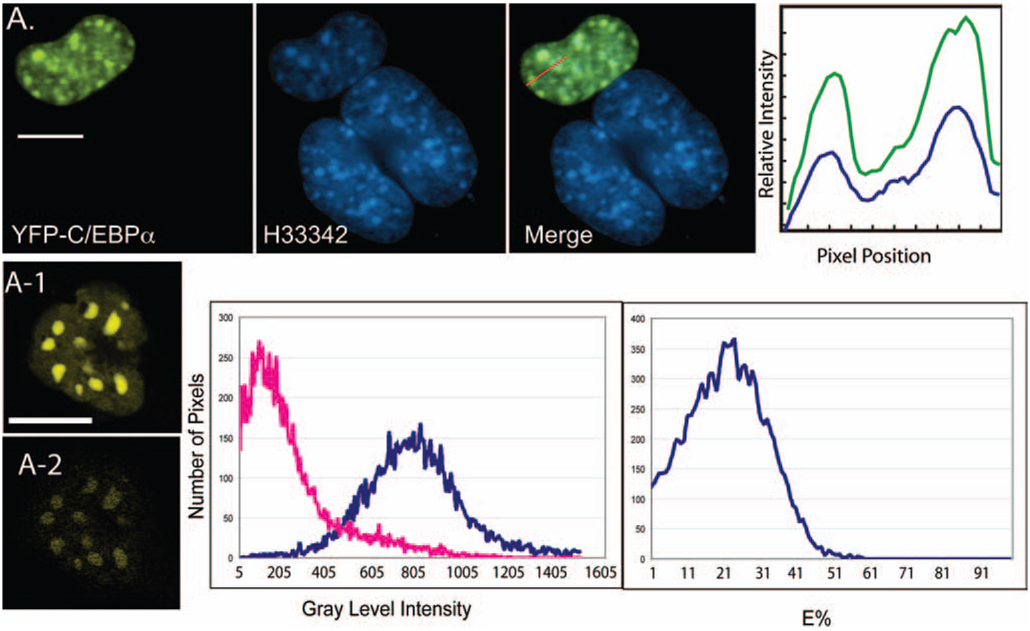
We next applied the psFRET approach to measure the formation of protein dimers involving the basic region–leucine zipper (B-Zip) transcription factor CCAAT/enhancer binding protein alpha (C/EBPα). The B-Zip family proteins form obligate dimers through the leucine-zipper domain, which functions to position the basic region residues for DNA binding (Vinson et al., 1989). Immunocytochemical staining of mouse cells showed that the endogenous C/EBPα protein preferentially bound to DNA-repeat sequences located in regions of centromeric heterochromatin (Tang & Lane, 1999; Schaufele et al., 2001). These regions of heterochromatin are especially prominent in mouse cells (Vig & Willcourt, 1998; Craig et al., 1999), and can be visualized by staining with the cell permeant DNA dye Hoechst 33342 (H33342). When YFP-labelled C/EBPα was expressed in mouse GHFT1 cells, it accumulated in regions of centromeric heterochromatin, here identified by the preferential staining with H33342 (Fig. 6A). The results from the psFRET measurements are consistent with the formation of dimers between CFP-and YFP-labelled C/EBPα that were co-expressed in mouse GHFT1 cells (Fig. 6A-2).
Fig. 6.
Measurement of C/EBPα protein dimerization in GHFT1 cells. The psFRET algorithm helps to identify the protein dimerization (A-2) involving the basic region–lucine zipper (B-zip) transcription factor C/EBPα. The upper panel shows the expression of YFP with C/EBPα and its accumulation in the region of centromeric heterochromatin stained by the DNA dye H33342 [The upper panel images were acquired using the arc lamp, filter-based wide-field microscope system as described in the literature (Day et al., 2003)]. A-1 is sFRET contaminated with ASBT. Histogram before (blue colour) and after (red colour) ASBT removal. Histogram of E% distribution from this cell is also shown. (scale bar: 10 µm)
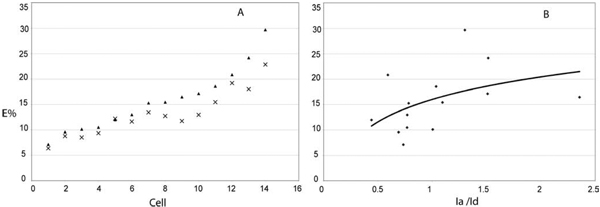
In an earlier study, we showed that the homeodomain (HD) transcription factor Pit-1 cooperatively interacted with C/EBPα in the regulation of pituitary gene expression (Enwright et al., 2003). Moreover, we showed Pit-1 recruited C/EBPα from the regions of centromeric heterochromatin to the intra-nuclear sites occupied by Pit-1 (Day et al., 2003), and this activity is shown here in Fig. 7. When expressed alone, YFP-Pit-1 occupies a web-like distribution throughout the cell nucleus (Fig. 7A). When YFP-Pit-1 was co-expressed with CFP-C/EBPα, the B-Zip protein no longer preferentially localized in regions of heterochromatin, but was strongly co-localized with YFP-Pit-1 (Fig. 7B, merge and profile). Recently, we showed that when Pit-1 recruited C/EBPα, the two proteins interacted as part of a common protein complex, and their association was detected using the apFRET method (Demarco et al., 2006). Here, we extended this observation by demonstrating the interactions of these two different proteins using the psFRET method (Fig. 7B-2). We measured the FRET efficiencies for individual cells within the transfected cell population using the psFRET approach, and found that they varied between 6% and 30% (Fig. 8A). This variability likely reflects the different stoichiometry of the donor to acceptor fluorophores within the protein complexes that is achieved when using the transient transfection approach. This is illustrated in Fig. 8B, which shows the trend for higher FRET efficiencies when the acceptor is in excess over the donor fluorophore, providing more than one pathway for energy transfer.
Fig. 7.
Measurement of non-homologous protein (C/EBPα-Pit-1) interactions. The interaction of YFP-Pit-1 and CFP-C/EBPα is clearly shown (B-2) as a diffuse signal in the GHFT1 nucleus compared to the localization of the C/EBPα dimer to areas of heterochromatin shown in Fig. 6. Panel A: Expression of YFP-Pit-1 and the DNA stain using H33342 and the merged image. Panel B: Expressed YFP-Pit-1 and CFP-C/EBPα and the merged image [The images in Panel A and B were acquired using the arc lamp, filter-based wide-field microscope system as described in the literature (Day et al., 2003)]. B-1 is the sFRET contaminated with ASBT. B-2 is the psFRET and the respective histogram before (blue colour) and after ASBT removal. Histogram of the E% distribution is also shown. (scale bar: 10 µm)
Fig. 8.
Measurement of E% and stoichiometry of donor and acceptor fluorophores. A: The variation in E% in different cells before (x) and after (▲) background correction. It is very obvious to see that the E% changes depending on the expression level in transfected cells. B: Higher energy transfer when the acceptor molecules are more than the donor indicating that the donor has more pathways to transfer the energy to the neighbouring acceptors.
Discussion
Here, we applied spectral unmixing techniques to FRET images as an effective and fast way to determine the donor and acceptor concentrations and measure protein–protein interactions in living cells. The spectral unmixing approach overcomes some of the limitations of other detection methods, permitting precise quantitative analysis (Dickinson et al., 2003). When applied in combination with FRET imaging, the spectral unmixing approach improves the speed and accuracy of measurements of the SBT contributions of donor, acceptor and background noise (Clegg, 1992; Zimmermann et al., 2002). Recently, Neher & Neher (2004a) provided an extensive theoretical analysis to describe how the contributions from different fluorophores collected in separate channels can be resolved spectrally. They then used this in a theoretical analysis to illustrate how the fluorescence from unpaired donors and acceptors can be separated from FRET pairs by the spectral FRET approach (Neher & Neher, 2004b). Using an experimental approach, Thaler et al. (2005) recently developed an efficient spectral resonance energy transfer (sRET) method that uses purified protein standards to provide reference spectra to calibrate the signals from donors and acceptors. The approach uses two-photon excitation microscopy to select a wavelength that excites both the donors and the acceptors, and then monitors simultaneously the changes in the fluorescence intensity of donors and acceptors involved in energy transfer (Thaler et al., 2005; Koushik et al., 2006). This approach maximizes the signal-to-noise ratio of both donor and acceptor, but requires purified samples of the donor and acceptor fluorophores, as well as specialized equipment for spectral imaging, two-photon excitation and specialized software for data analysis (Thaler et al., 2005; Vogel et al., 2006).
The psFRET method described here is more generally applicable. Spectral unmixing provides a direct method to remove the contribution of DSBT in the FRET image. Furthermore, the approach avoids the potential problems associated with back-bleedthrough of the acceptor signal into the donor channel that is common in filter-based and two-photon excitation imaging. However, since the spectrum of the ASBT is identical to the FRET signal, the ASBT component cannot be removed by spectral unmixing. Therefore, we developed an approach similar to established methods for SBT correction in filter-based FRET microscopy systems to remove the ASBT contamination from sFRET images (Gordon et al., 1998; Berney & Danuser, 2003; Elangovan et al., 2003; Wallrabe et al., 2003; Chen et al., 2005). When using wide-field illumination and a CCD detector with flat spectral sensitivity in the visible spectrum, the ASBT component is constant and independent of the intensity level. For imaging systems that use PMT detectors, however, the response of the PMT photocathode at lower grey level intensity is not stable (Chen et al., 2005; Chen & Periasamy, 2006; Wallrabe et al., 2006). This was observed in all commercially available confocal/spectral imaging units [including Carl Zeiss, Nikon (Nikon USA, Melville, NY, USA) and Olympus (Olympus America, Center Valley, PA, USA)]. To overcome this problem, we used a dynamic ratio approach to estimate ASBT. The dynamic ratio approach has several advantages. First, it corrects for the variation of ASBT ratio at different intensity levels. Second, it avoids the errors introduced by the background at the lower signal intensity levels. Finally, the approach simplifies the ratio calculation for large numbers of control cells (e.g., see Fig. 3b, ratio calculation). Moreover, our approach allows the correction for both conditions, linear or non-linear signals.
We verified the psFRET approach using well-characterized FRET standards (Thaler et al.,2005). The results demonstrated that very similar values for FRET efficiency were obtained using the spectral, intensity and lifetime-based methods (summarized in Table 2). The psFRET approach was then used to demonstrate the formation of protein dimers involving the B-Zip transcription factor C/EBPα in the living cell nucleus. The B-Zip family proteins form obligate dimers through the leucine-zipper domain, which functions to position the basic region residues for DNA binding (Vinson et al.,1989). The endogenous C/EBPα protein preferentially binds to DNA-repeat sequences located in regions of centromeric heterochromatin (Tang & Lane, 1999; Schaufele et al., 2001). Here, the psFRET method was used to measure the efficiency of energy transfer between the CFP- and YFP-labelled C/EBPα that were co-expressed in mouse GHFT1 cells. These results showed an average FRET efficiency of about 25% for the C/EBPα dimers that localized in regions of centromeric heterochromatin in the mouse pituitary cell nucleus. These results are consistent with our earlier studies using other FRET methods to detect the dimerization of this protein (Day et al., 2003; Chen et al., 2005).
Through its interactions with other co-regulatory proteins, C/EBPα acts to direct programmes of cell differentiation and plays key roles in the regulation of genes involved in energy metabolism (reviewed in Johnson, 2005). However, the preferential positioning of C/EBPα dimers in regions of centromeric heterochromatin that are typically associated with gene silencing (Perrod & Gasser, 2003) appears to contradict the role of this protein as an activator of genes involved in cell differentiation. We resolved this contradiction by showing in earlier studies that the HD transcription factor Pit-1 cooperatively interacted with C/EBPα in the regulation of pituitary gene expression (Day et al., 2003; Enwright et al., 2003). These earlier studies showed that Pit-1 recruited C/EBPα from the regions of centromeric heterochromatin to the intra-nuclear sites occupied by Pit-1 (see Fig. 7). Here, we used the psFRET method to demonstrate that when Pit-1 recruited C/EBPα, the two proteins were closely associated with one another. Taken together, our earlier studies and the present observations indicated a potential role for the HD transcription factor in organizing other gene regulatory proteins in transcriptionally permissive regions of the pituitary cell nucleus, and provided a mechanism by which precise homeostatic control is achieved through a network of interactions.
Conclusion
The application of FRET-based methods has become an important tool for understanding the dynamics of protein interactions in living cells. Through the generation of new probes and the development of new approaches, the technique continues to evolve. It is critical to apply methods that allow rapid and accurate quantification and removal of the SBT background from the measurements. The psFRET methodology described here provides researchers with a tool to remove ASBT on any commercially available laser scanning spectral imaging microscope. We expect this approach will have broad application for investigating protein–protein interactions in a variety of biological systems.
Table 3.
Abbreviation of terminology used in the text.
| Images represented | Method represented | |
|---|---|---|
| FRET | Förster (fluorescence) Resonance Energy transfer | |
| sFRET | Spectral FRET (sFRET) image which is contaminated by ASBT |
|
| psFRET | Processed spectral FRET (psFRET) image from sFRET where ASBT is removed from sFRET using the spectral FRET algorithm |
psFRET also represents spectral FRET algorithm described in this paper to remove ASBT from spectral image sFRET. |
| PFRET | Processed FRET image where both DSBT and ASBT are removed. |
PFRET also represents the algorithm used to remove DSBT and ASBT from the FRET image using filter based system. (Chen et al., 2005; Chen & Periasamy, 2006; Elangovan et al., 2003) |
| FRET-FLIM | Donor lifetime images are acquired in the absence and presence of acceptor |
Lifetime method to measure FRET by measuring the change in donor lifetime (Chen and Periasamy, 2004) |
| sRET | Purified protein is required to collect the images to process the image using a sophisticated spectral FRET data analysis algorithm. |
Spectral FRET method with 2p system (Thaler et al., 2004). |
Acknowledgements
We thank Drs. Steven Vogel and Srinagesh Koushik [National Institute of Alcohol Abuse and Alcoholism (NIAAA) at the National Institutes of Health] for providing the FRET standards. This work was supported by grants from the National Center for Research Resources (RR021202 to A.P.) and NIH (DK47301 to R.N.D.). We would like to thank Mr. Horst Wallrabe for his valuable comments.
References
- Bastiaens PI, Jovin TM. Microspectroscopic imaging tracks the intracellular processing of a signal transduction protein: fluorescent-labeled protein kinase C beta I. Proc. Natl. Acad. Sci. USA. 1996;93:8407–8412. doi: 10.1073/pnas.93.16.8407. [DOI] [PMC free article] [PubMed] [Google Scholar]
- Berney C, Danuser G. FRET or no FRET: a quantitative comparison. Biophys. J. 2003;84:3992–4010. doi: 10.1016/S0006-3495(03)75126-1. [DOI] [PMC free article] [PubMed] [Google Scholar]
- Centonze VE, Sun M, Masuda A, Gerritsen H, Herman B. Fluorescence resonance energy transfer imaging microscopy. Meth. Enzymol. 2003;360:542–560. doi: 10.1016/s0076-6879(03)60127-8. [DOI] [PubMed] [Google Scholar]
- Chen Y, Mills JD, Periasamy A. Protein interactions in cells and tissues using FLIM and FRET. Differentiation. 2003;71:528–541. doi: 10.1111/j.1432-0436.2003.07109007.x. [DOI] [PubMed] [Google Scholar]
- Chen Y, Periasamy A. Characterization of two-photon excitation fluorescence lifetime imaging microscopy for protein localization. Microsc. Res. Tech. 2004;63:72–80. doi: 10.1002/jemt.10430. [DOI] [PubMed] [Google Scholar]
- Chen Y, Elangovan M, Periasamy A. FRET data analysis—the algorithm. In: Periasamy A, Day RN, editors. Molecular Imaging: FRET Microscopy and Spectroscopy. New York: Academic-Elsevier Press; 2005. pp. 126–145. [Google Scholar]
- Chen Y, Periasamy A. Intensity range based quantitative FRET data analysis to localize the protein molecules in living cell nucleus. J. Fluoresc. 2006;16:95–104. doi: 10.1007/s10895-005-0024-1. [DOI] [PubMed] [Google Scholar]
- Chudakov DM, Lukyanov S, Lukyanov KA. Fluorescent proteins as a toolkit for in vivo imaging. Trends Biotechnol. 2005;23:605–613. doi: 10.1016/j.tibtech.2005.10.005. [DOI] [PubMed] [Google Scholar]
- Clegg R. Fluorescence resonance energy transfer and nucleic acids. Meth. Enzymol. 1992;211:353–388. doi: 10.1016/0076-6879(92)11020-j. [DOI] [PubMed] [Google Scholar]
- Clegg RM, Holub O, Gohlke C. Fluorescence lifetime-resolved imaging: measuring lifetimes in an image. Meth. Enzymol. 2003;360:509–542. doi: 10.1016/s0076-6879(03)60126-6. [DOI] [PubMed] [Google Scholar]
- Craig JM, Earnshaw WC, Vagnarelli P. Mammalian centromeres: DNA sequence, protein composition, and role in cell cycle progression. Exp. Cell Res. 1999;246:249–262. doi: 10.1006/excr.1998.4278. [DOI] [PubMed] [Google Scholar]
- Day RN, Periasamy A, Schaufele F. Fluorescence resonance energy transfer microscopy of localized protein interactions in the living cell nucleus. Methods. 2001;25:4–18. doi: 10.1006/meth.2001.1211. [DOI] [PubMed] [Google Scholar]
- Day RN, Voss TC, Enwright JF, III, Booker CF, Periasamy A, Schaufels F. Imaging the localized protein interactions between Pit-1 and the CCAAT/enhancer binding protein alpha (C/EBPa) in the living pituitary cell nucleus. Mol. Endo. 2003;17:333–345. doi: 10.1210/me.2002-0136. [DOI] [PMC free article] [PubMed] [Google Scholar]
- Day RN, Schaufele F. Molecular interactions in living cells. Mol. Endocrinol. 2005;19:1675–1686. doi: 10.1210/me.2005-0028. [DOI] [PMC free article] [PubMed] [Google Scholar]
- Demarco IA, Voss TC, Booker CF, Day RN. Dynamic interactions between Pit-1 and C/EBPalpha in the pituitary cell nucleus. Mol. Cell Biol. 2006;26:8087–8098. doi: 10.1128/MCB.02410-05. [DOI] [PMC free article] [PubMed] [Google Scholar]
- Dickinson ME, Simbuerger E, Zimmermann B, Waters CW, Fraser SE. Multiphoton excitation spectra in biological samples. J. Biomed. Opt. 2003;8:329–338. doi: 10.1117/1.1583734. [DOI] [PubMed] [Google Scholar]
- Dong CY, French T, So PT, Buehler C, Berland KM, Gratton E. Fluorescence-lifetime imaging techniques for microscopy. Methods Cell Biol. 2003;72:431–464. doi: 10.1016/s0091-679x(03)72021-4. [DOI] [PubMed] [Google Scholar]
- Elangovan M, Wallrabe H, Chen Y, Day RN, Barroso M, Periasamy A. Characterization of one- and two-photon excitation fluorescence resonance energy transfer microscopy. Methods. 2003;29:58–73. doi: 10.1016/s1046-2023(02)00283-9. [DOI] [PubMed] [Google Scholar]
- Enwright JF, III, Kawecki-Crook MA, Voss TC, Schaufele F, Day RN. A PIT-1 homeodomain mutant blocks the intranuclear recruitment of the CCAAT/enhancer binding protein alpha required for prolactin gene transcription. Mol. Endocrinol. 2003;17:209–222. doi: 10.1210/me.2001-0222. [DOI] [PMC free article] [PubMed] [Google Scholar]
- Gordon GW, Berry G, Liang XH, Levine B, Herman B. Quantitative fluorescence resonance energy transfer measurements using fluorescence microscopy. Biophys. J. 1998;74:2702–2713. doi: 10.1016/S0006-3495(98)77976-7. [DOI] [PMC free article] [PubMed] [Google Scholar]
- Jares-Erijman EA, Jovin TM. FRET imaging. Nat. Biotechnol. 2003;21:1387–1395. doi: 10.1038/nbt896. [DOI] [PubMed] [Google Scholar]
- Johnson PF. Molecular stop signs: regulation of cell-cycle arrest by C/EBP transcription factors. J. Cell Sci. 2005;118:2545–2555. doi: 10.1242/jcs.02459. [DOI] [PubMed] [Google Scholar]
- Koushik SV, Chen H, Thaler C, Puhl HL, III, Vogel SS. Cerulean, Venus, and Venusy67c FRET reference standards. Biophys. J. 2006;91:L99–L101. doi: 10.1529/biophysj.106.096206. [DOI] [PMC free article] [PubMed] [Google Scholar]
- Lakowicz JR. Principles of Fluorescence Spectroscopy. 2nd edn. New York: Plenum; 1999. [Google Scholar]
- Lew D, Brady H, Klausing K, Yaginuma K, Theill LE, Stauber C, Karin M, Mellon PL. GHF-1-promoter-targeted immortalization of a somatotropic progenitor cell results in dwarfism in transgenic mice. Genes Dev. 1992;7:683–693. doi: 10.1101/gad.7.4.683. [DOI] [PubMed] [Google Scholar]
- Nagai T, Ibata K, Park ES, Kubota M, Mikoshiba K, Miyawaki A. A variant of yellow fluorescent protein with fast and efficient maturation for cell-biological applications. Nat. Biotechnol. 2002;20:87–90. doi: 10.1038/nbt0102-87. [DOI] [PubMed] [Google Scholar]
- Neher RA, Neher E. Optimizing imaging parameters for the separation of multiple labels in a fluorescence image. J. Microsc. 2004a;213:46–62. doi: 10.1111/j.1365-2818.2004.01262.x. [DOI] [PubMed] [Google Scholar]
- Neher RA, Neher E. Applying spectral fingerprinting to the analysis of FRET images. Microsc. Res. Tech. 2004b;64:185–195. doi: 10.1002/jemt.20078. [DOI] [PubMed] [Google Scholar]
- Park YC, Burkitt V, Villa AR, Tong L, Wu H. Structural basis for self-association and receptor recognition of human TRAF2. Nature. 1999;398:533–538. doi: 10.1038/19110. [DOI] [PubMed] [Google Scholar]
- Periasamy A, Day RN. Molecular Imaging: FRET Microscopy and Spectroscopy. New York: Academic-Elsevier Press; 2005. [Google Scholar]
- Perrod S, Gasser SM. Long-range silencing and position effects at telomeres and centromeres: parallels and differences. Cell Mol. Life Sci. 2003;60:2303–2318. doi: 10.1007/s00018-003-3246-x. [DOI] [PMC free article] [PubMed] [Google Scholar]
- Rizzo MA, Springer GH, Granada B, Piston DW. An improved cyan fluorescent protein variant useful for FRET. Nat. Biotechnol. 2004;22:445–449. doi: 10.1038/nbt945. [DOI] [PubMed] [Google Scholar]
- Schaufele F, Enwright JF, III, Wang X, Teoh C, Srihari R, Erickson R, MacDougald OA, Day RN. CCAAT/enhancer binding protein alpha assembles essential cooperating factors in common subnuclear domains. Mol. Endocrinol. 2001;15:1665–1676. doi: 10.1210/mend.15.10.0716. [DOI] [PubMed] [Google Scholar]
- Shaner NC, Steinbach PA, Tsien RY. A guide to choosing fluorescent proteins. Nat. Methods. 2005;2:905–909. doi: 10.1038/nmeth819. [DOI] [PubMed] [Google Scholar]
- Suhling K, Siegel J, Phillips D, French PM, Leveque-Fort S, Webb SE, Davis DM. Imaging the environment of green fluorescent protein. Biophys. J. 2002;83:3589–3595. doi: 10.1016/S0006-3495(02)75359-9. [DOI] [PMC free article] [PubMed] [Google Scholar]
- Tang QQ, Lane MD. Activation and centromeric localization of CCAAT/enhancer-binding proteins during the mitotic clonal expansion of adipocyte differentiation. Genes Dev. 1999;13:2231–2241. doi: 10.1101/gad.13.17.2231. [DOI] [PMC free article] [PubMed] [Google Scholar]
- Thaler C, Koushik SV, Blank PS, Vogel SS. Quantitative multiphoton spectral imaging and its use for measuring resonance energy transfer. Biophys. J. 2005;89:2736–2749. doi: 10.1529/biophysj.105.061853. [DOI] [PMC free article] [PubMed] [Google Scholar]
- Tramier M, Kemnitz K, Durieux C, Coppey-Moisan M. Picosecond time-resolved microspectrofluorometry in live cells exemplified by complex fluorescence dynamics of popular probes ethidium and cyan fluorescent protein. J. Microsc. 2004;213:110–118. doi: 10.1111/j.1365-2818.2004.01271.x. [DOI] [PubMed] [Google Scholar]
- Vig BK, Willcourt M. Decondensation of pericentric heterochromatin alters the sequence of centromere separation in mouse cells. Chromosoma. 1998;107:417–423. doi: 10.1007/s004120050325. [DOI] [PubMed] [Google Scholar]
- Vinson CR, Sigler PB, McKnight SL. Scissors-grip model for DNA recognition by a family of leucine zipper proteins. Science. 1989;246:911–916. doi: 10.1126/science.2683088. [DOI] [PubMed] [Google Scholar]
- Vogel SS, Thaler C, Koushik SV. Fanciful FRET. Sci. STKE, re2. 2006 doi: 10.1126/stke.3312006re2. ( www.stke.org/) [DOI] [PubMed]
- Wallrabe H, Elangovan M, Burchard A, Periasamy A, Barroso M. Confocal FRET microscopy to measure clustering of ligand-receptor complexes in endocytic membranes. Biophys. J. 2003;85:559–571. doi: 10.1016/S0006-3495(03)74500-7. [DOI] [PMC free article] [PubMed] [Google Scholar]
- Wallrabe H, Periasamy A. FRET-FLIM microscopy and spectroscopy in the biomedical sciences. Curr. Opin. Biotech. 2005;16:19–27. doi: 10.1016/j.copbio.2004.12.002. [DOI] [PubMed] [Google Scholar]
- Wallrabe H, Chen Y, Periasamy A, Barroso M. Issues in confocal microscopy for quantitative FRET analysis. Microsc. Res. Tech. 2006;69:196–206. doi: 10.1002/jemt.20281. [DOI] [PubMed] [Google Scholar]
- Wouters FS, Bastiaens PI, Wirtz KW, Jovin TM. FRET Microscopy demonstrates molecular association of non-specific lipid transfer protein (nsL-TP) with fatty acid oxidation enzymes in peroxisomes. EMBO J. 1998;17:7179–7189. doi: 10.1093/emboj/17.24.7179. [DOI] [PMC free article] [PubMed] [Google Scholar]
- Xia Z, XLiu TM. Reliable and global measurement of fluorescence resonance energy transfer using fluorescence microscopes. Biophys. J. 2001;81:2395–2402. doi: 10.1016/S0006-3495(01)75886-9. [DOI] [PMC free article] [PubMed] [Google Scholar]
- Zacharias DA, Violin JD, Newton AC, Tsien RY. Partitioning of lipid-modified monomeric GFPs into membrane microdomains of live cells. Science. 2002;296:913–916. doi: 10.1126/science.1068539. [DOI] [PubMed] [Google Scholar]
- Zal T, Gascoigne NR. Photobleaching-corrected FRET efficiency imaging of live cells. Biophys. J. 2004;86:3923–3939. doi: 10.1529/biophysj.103.022087. [DOI] [PMC free article] [PubMed] [Google Scholar]
- Zimmermann T, Rietdorf J, Girod A, Georget V, Pepperkok R. Spectral imaging and linear un-mixing enables improved FRET efficiency with a novel GFP2-YFP FRET pair. FEBS Lett. 2002;531:245–249. doi: 10.1016/s0014-5793(02)03508-1. [DOI] [PubMed] [Google Scholar]


