Abstract
Molecular beacons (MBs) have the potential to provide a powerful tool for rapid RNA detection in living cells, as well as monitoring the dynamics of RNA expression in response to external stimuli. To exploit this potential, it is necessary to distinguish true signal from background signal due to non-specific interactions. Here, we show that, when cyanine-dye labeled 2′-deoxy and 2′-O-methyl oligonucleotide probes are inside living cells for >5 h, most of their signals co-localize with mitochondrial staining. These probes include random-sequence MB, dye-labeled single-strand linear oligonucleotide and dye-labeled double-stranded oligonucleotide. Using carbonyl cyanide m-chlorophenyl hydrazone treatment, we found that the non-specific accumulation of oligonucleotide probes at mitochondria was driven by mitochondrial membrane potential. We further demonstrated that the dye-labeled oligonucleotide probes were likely on/near the surface of mitochondria but not inside mitochondrial inner membrane. Interestingly, oligonucleotides probes labeled respectively with Alexa Fluor 488 and Alexa Fluor 546 did not accumulate at mitochondria, suggesting that the non-specific interaction between dye-labeled ODN probes and mitochondria is dye-specific. These results may help design and optimize fluorescence imaging probes for long-time RNA detection and monitoring in living cells.
INTRODUCTION
Live cell detection of RNA molecules, including mRNAs, nuclear RNAs and microRNAs provides a powerful means for basic biological studies of gene transcription and regulation, RNA localization and transport, disease diagnosis and the isolation of specific cells for disease treatment. In particular, in studying the dynamics of endogenous mRNA in live cells in response to external stimulus, it may be necessary to monitor the expression level and localization of specific mRNA for a few hours (1). For example, when subjected to shear flow, the expression of specific genes such as Klf2, BMP4 and eNOS in endothelial cells depends on the mode of flow (laminar or oscillatory), magnitude of shear stress and duration of shear (2–4). Therefore, it is desirable to monitor in real time the expression of specific mRNAs in live endothelial cells under shear conditions. However, when using fluorescence imaging probes to track the changes of target mRNAs in live cells, a significant amount of non-specific background signal may occur, especial during long-time (>5 h) monitoring.
Many intracellular events can contribute to the background signal in performing fluorescence imaging of RNAs in living cells using oligonucleotide probes, including degradation of probes with DNA backbone by endonucleases (such as DNase II) (5), and RNase H induced cleavage of the duplex of DNA probe and RNA target (6,7). Although the use of oligonucleotide probes with 2′-O-methyl backbone can reduce endonuclease and RNase H activity (8–10), these probes are more prone to opening by hairpin-binding proteins, thus increasing background signal (9). When oligonucleotide probes (with DNA or RNA backbone) are exposed to subcellular environment for a long time, non-specific interactions with cellular components such as mitochondria and processing bodies (P-bodies) may occur, causing degradation of the probes (11).
Of all the oligonucleotide probes developed to date, molecular beacons (MBs) are the most promising probe for live-cell RNA detection. MB is a dual-labeled antisense oligonucleotide probe with a fluorophore and a quencher at each end (12,13). It is designed to form a hairpin structure in the absence of a complementary target so that fluorescence of the fluorophore is quenched. Hybridization with the target mRNA opens the hairpin and physically separates the reporter from the quencher, allowing a fluorescence signal to be emitted upon excitation. Thus, MBs can achieve signal specificity without the need to perform washing to remove unbound probes (14). Extensive studies have been performed on fluorophore quenching, multi-color detection, target specificity, hybridization kinetics, target accessibility and probe-target interaction of MBs (13,15–24).
To determine the applicability of MBs to long-term monitoring of dynamic changes of target mRNAs in living cells, in this work, we evaluated the background signal generated by random-sequence MBs (random beacon) and found that after 2 h of incubation in live human dermal fibroblast cells, most of the signal from random beacons is co-localized with mitochondria. A systematic study was performed, using six different oligonucleotide probes, to elucidate the accumulation of oligonucleotide probes at mitochondria. Our results clearly demonstrate the potential issue of high background signal when cyanine-dyes are used to label oligonucleotide probes for long-time detection and monitoring of specific RNAs in living cells.
MATERIALS AND METHODS
Cell culture
Normal human dermal fibroblast (HDF) cells (Cambrex, NJ, USA) were grown in Clonetics fibroblast growth medium supplemented with 2% FBS, insulin, fibroblast growth factor, gentamicin sulfate and amphotericin-B (all from Cambrex). HDF cells were used in our studies due to their low auto-fluorescence and ease for probe delivery. HeLa and MG63 cells were cultured in Dulbecco’s Modified Eagle Medium (DMEM, Invitrogen) supplemented with 10% FBS. HUVECs were cultured in M199 medium supplemented with 20% FBS, heparin (American Pharmaceutical Partners) and endothelial growth factor supplement (isolated in the laboratory). All the microscopic analyses were performed in 2 or 4-well Lab-Tek® II chambered cover glasses (Nalge Nunc International, NY, USA).
Synthesis and cellular delivery of oligonucleotide probes and target
All the oligonucleotide probes and targets used in this study were synthesized by MWG Biotech (High Point, NC, USA), except for the short Cy3-conjugated oligonucleotide (Integrated DNA Technologies). Cy3 and Cy5 dyes were purchased from GE Healthcare; the Alexa Fluor 488 dye was purchased from Invitrogen (Carlsbad, CA, USA). Oligonucleotides were delivered into live HDF cells with a reversible permeabilization method using activated Streptolysin O (SLO) (18). SLO-based delivery method is simple, very efficient and applicable to different cell types. It can deliver probes directly into the cytosol, thus avoiding probe degradation in the endosomes. Cells were incubated for 10 min in 250 µl of serum-free medium containing 0.2 U/ml of activated SLO and 1 µM of oligonucleotides for cell permeabilization and oligonucleotide delivery. Cells were then resealed by adding normal growth medium and incubated for 0–24 h at 37°C before performing fluorescence microscopy imaging. Each experiment was performed at least five times to ensure reproducibility. For delivery of random-sequence linear oligonucleotide probes and targets (Table 1), we delivered 1 µM of Cy3-labeled random-sequence linear oligonucleotide (antisense) probes first, incubated cells at 37°C for 24 h, and then delivered 2 µM of the BHQ-2 quencher conjugated complementary linear oligonucleotide (sense) target and incubated cells for additional 24 h.
Table 1.
The design of oligonucleotide probes
| Oligonucleotide probe | Sequences, fluorophore and quencher | Tm (°C) |
|---|---|---|
| Random MB with Cy3 | 5′-Cy3-CGACGCGACAAGCGCACCGATACGTCG-BHQ-3′ | 50.9 |
| Random MB2 with Cy3 | 5′-Cy3-CGACGCTCTGCCTAAGTGATGTCCGTCG-BHQ-3′ | 53.5 |
| Random 2′-O-methyl MB with Cy3a | 5′-Cy3-CGACGCGACAAGCGCACCGATACGTCG-BHQ-3′ | 68.2 |
| Random linear probe with Cy3 | 5′-Cy3-CCTGCCGACAAGCGCACCGATACGTCC-3′ | – |
| Random DSO with dye and quencher | 5′-Cy3-CGACGCGACAAGCGGCTTGTCGCGTCG-BHQ-3′ | 84.5 |
| Random DSO with dye only | 5′-Cy3-CGACGCGACAAGCGGCTTGTCGCGTCG-3′ | 84.5 |
| Random linear probe with Alexa 488 | 5′-Alexa488-CCTGCCGACAAGCGCACCGATACGTCC-3′ | – |
| Random linear probe with Alexa 546 | 5′-Alexa546-CCTGCCGACAAGCGCACCGATACGTCC-3′ | – |
| Random MB with Alexa 546 | 5′-Alexa546-CGACGCGACAAGCGCACCGATACGTCG-BHQ-3′ | 50.9 |
| Random linear probe with Cy5 | 5′-Cy5-CCTGCCGACAAGCGCACCGATACGTC-3′ | – |
| Short-linear probe with Cy3 | 5′-Cy3-CCTG-3′ | – |
| Long-linear probe with Cy3 | 5′-Cy3-CTGCCGACAAGCGCACCGATACGTCCCCTGCCGACAAGC-3′ | – |
| Random linear target with quencher | 5′-GACGTATCGGTGCGCTTGTCGGCAGG-BHQ-3′ | – |
| BMP4 MB with Cy3 | 5′-Cy3-CGCAGCCTCTACCACCATCTCCCTGCG-BHQ-3′ | 55.4 |
aItalic letters indicate 2′-O-methyl backbone chemistry; MB, molecular beacon; DSO, double-stranded oligonucleotide probe.
The melting temperatures of random-sequence MBs and double-stranded oligonucleotide (DSO) probes shown in Table 1 were calculated using the program provided at http://frontend.bioinfo.rpi.edu/applications/mfold/cgi-bin/dna-form1.cgi using folding temperature of 37°C and ionic condition of 10 mM KCl and 5 mM MgCl2.
Cell treatment and lysosome staining
The inhibitor of oxidative phosphorylation, CCCP (carbonyl cyanide m-chlorophenyl hydrazone), was used to treat cells for 24 h at a concentration of 50 µM after oligonucleotide delivery (25–28). Thirty minutes after CCCP treatment, DiOC6 was added to the medium at a concentration of 25 nM to visualize the membrane potential (27–29). One hour after CCCP treatment, the oligonucleotide accumulation in cells was analyzed and membrane potential was measured. For lysosome staining, cells were treated with LysoTracker Blue-White DPX (Invitrogen) for 24 h after probe delivery.
Fluorescence imaging
Fluorescence imaging of live cells was performed using a Zeiss Axiovert 100 TV epifluorescence microscope coupled to a Cooke Sensicam SVGA cooled CCD camera. Zeiss 100× and 40× EC Plan-NEOFLUAR oil objectives with NA (Numerical Aperture) of 1.3 were used for the experiments. The fluorescence signal of Cy3-labeled oligonucleotides were imaged with excitation at 545 nm and emission detection at 570 nm, and Alexa Fluor 488 and DiOC6 were imaged with excitation at 470 nm and emission detection at 525 nm. Live-cell fluorescence imaging was also performed using the DeltaVision Deconvolution microscope (Applied Precision LLC, WA, USA) equipped with Olympus 60×, Plan Apo N lens, numerical aperture 1.42 and a CoolSNAP_HQ2 / ICX285 camera. Images were collected at 0.2 µm Z-intervals.
RESULTS AND DISCUSSION
Design of oligonucleotide probes
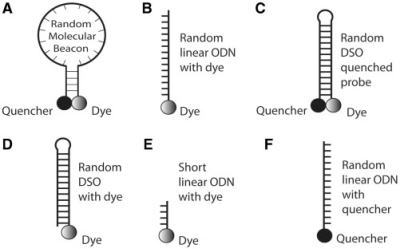
As shown in Table 1, most of the oligonucleotide probes used in this study was designed to have a ‘random sequence’ (generated by using ‘random walk’) such that there is no complementary target in any animal cell, as confirmed by BLAST search. Therefore, the subcellular localization of the fluorescence signal from these probes should not be due to hybridization to specific mRNA targets. As illustrated in Figure 1A, the random-sequence MB (random MB) has a stem-loop structure, with Cy3 dye on its 5′-end and BHQ-2 quencher on its 3′-end (Table 1). Without any target in the cells, any fluorescence signal from a random MB is background signal due to MB degradation or non-specific interactions. To investigate the effect of the backbone chemistry of the oligonucleotide probe on its interaction with intracellular organelles, we used both deoxynucleotide and 2′-O-methyl backbone for random-sequence MBs (Table 1). As a positive control, an unquenched, dye-labeled random-sequence linear oligonucleotide probe was designed (Figure 1B) so that probes delivered into cells would show signal, and their localization is due to interactions with intracellular organelles. As a negative control, a quenched, random-sequence DSO probe was designed with a long stem (13 bp) and a dye-quencher pair at the end (Figure 1C). Without probe degradation, the DSO probe should show little fluorescence signal since the fluorophore is quenched and the probe should not open (thus separating the dye and quencher). As a further control, we designed a DSO probe with a dye at its end without a quencher (Figure 1D). This probe should always show signal upon proper excitation. The difference between the dye-labeled linear oligonucleotide probe (Figure 1B) and the dye-labeled DSO probe (Figure 1D) is that the former may have intracellular localization due to interaction with RNA molecules, while the latter should not hybridize to RNA. Since partial match of the linear oligonucleotide probe with an RNA molecule might influence the localization of the linear ODN, we designed a dye-labeled short-linear ODN probe (with four bases), as shown in Figure 1E. Finally, a target ODN (sense) with a sequence complementary to the linear ODN probe (antisense) was designed, with a quencher at its 3′-end so that, when it is hybridized to the dye-labeled linear ODN probe (Figure 1B), fluorescence is quenched.
Figure 1.
Schematic illustrations of dye-labeled oligonucleotide probes and quencher-conjugated target designed in this study. (A) Random-sequence MB labeled with a dye–quencher pair. (B) Random-sequence linear oligonucleotide labeled with a dye only. (C) Random-sequence DSO labeled with a dye–quencher pair. (D) Random-sequence DSO labeled with a dye only. (E) Dye-labeled short oligonucleotide. (F) Quencher-conjugated linear oligonucleotide target with a sequence complementary to the dye-labeled linear oligonucleotide probe in (B).
Non-specific fluorescence signal from oligonucleotide probes
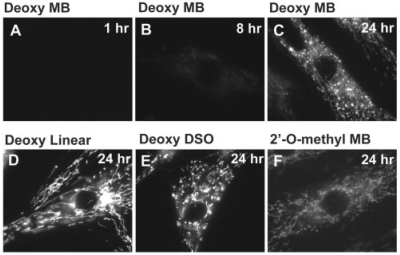
Initially, we delivered random MB with DNA backbone (calculated melting temperature = 50.9°C) into live HDF cells. We could only observe very low levels of fluorescence signal from random MBs at 1 h (Figure 2A) and 2 h (data not shown) after delivery. This was expected since the random MBs have no target in HDF cells. Even after 8 h of incubation, the fluorescence signal was still quite weak (Figure 2B). However, 24 h after random MB delivery, there was strong fluorescence signal; most of the signals showed filament-like localization, while a small amount of signals localized spot-like (Figure 2C). These non-specific signals may be due to slow degradation of random MBs by nucleases, causing the fluorescent dye being separated from the quencher, allowing fluorescence emission upon excitation. In theory, it is also possible that the random MBs non-specifically hybridized to mRNAs or interacted with other cellular components during long-time incubation, causing MBs to open. As a ‘positive control’ of signal localization, we delivered Cy3-labeled random-sequence linear oligonucleotide probes with DNA backbone (Figure 1B and Table 1) into HDF cells. Interestingly, we could only detect very low levels of fluorescence signal during the first 2–3 h after probe delivery, similar to what we observed with random MBs. This counterintuitive result is presumably due to the dispersion of the oligonucleotide probes in the cytosol without any localization, resulting in a low fluorescence intensity not being detected by microscopy imaging. Much stronger fluorescence signals appeared 5–6 h after probe delivery, much earlier than that of random MBs (data not shown). Twenty-four hours after delivery, we observed the same filament-like signal localization (Figure 2D), similar to what observed with random MBs at the same time point (Figure 2C) but with a smaller amount of spot-like signal. We used an additional random MB with a different sequence (Random MB2; Table 1) and observed similar mitochondrial accumulation of the probes (data not shown). Therefore, we could rule out the possibility of having random MB acted as aptamer-like probe that induced the mitochondrial accumulation.
Figure 2.
Subcellular distribution of fluorescence signal from dye-labeled, random-sequence oligonucleotide probes in live HDF cells at different time points. The oligonucleotide probes were delivered into HDF cells with 1 µM of concentration, and the same exposure time of 400 ms was used for fluorescence imaging for all ODN probes. (A–C) Fluorescence signal from random-sequence MBs (random MB) with deoxynucleotide backbone imaged at 1 (A), 8 (B) and 24 (C) h after delivery. Note that even 8 h after delivery, the random MBs only showed very weak signal. (D–F) Fluorescence images taken 24 h after probe delivery of (D) Cy3-labeled random-sequence linear ODN probe with deoxynucleotide backbone, (E) DSO probe with a dye–quencher pair, (F) random-sequence MB with 2′-O-methyl backbone (2′-O-methyl MB).
To determine if the filament-like fluorescence signal from random MBs and Cy3-labeled linear oligonucleotide probes is due to their non-specific hybridization to certain mRNAs inside living cells, we delivered the DSO probe (Figure 1C) into HDF cells and performed fluorescence imaging after 24 h of incubation. Note that this random-sequence oligonucleotide probe has a long double-stranded stem with a high melting temperature (84.5°C as calculated using mFOLD), and the fluorophore (Cy3) is quenched by the BHQ2 quencher. This probe is expected to maintain its double-stranded structure without interacting with any mRNA in the cytoplasm, and thus having no fluorescence signal inside a living cell. Surprisingly, we observed strong fluorescence signal 24 h after delivery, with the same filamentous signal localization (Figure 2E) as that with random MB (Figure 2C) and Cy3-labeled linear ODN (Figure 2D). This result clearly demonstrates that the filament-like signal localization shown by random MB and dye-labeled linear ODN probe was not due to non-specific hybridization of these probes with mRNA molecules. To determine if the fluorescence signal from random MB (Figure 1A) and DSO probe (Figure 1C) with DNA backbone was due to probe degradation by endonucleases or RNase H, we used random-sequence MB with 2′-O-methyl backbone (Table 1) which is more resistant to nuclease degradation and RNase H activity. Twenty-four hours after delivery of the 2′-O-methyl random MB, the HDF cells showed the same filament-like localization of fluorescence signal, although the signal intensity is lower than that of the probes with DNA backbone (Figure 2F). These results suggest that the non-specific signal shown in Figure 2C–F from the oligonucleotide probes 24 h after delivery was caused neither by non-specific hybridization to mRNAs nor by degradation of oligonucleotide.
Co-localization of signal from ODN probes with mitochondrial staining indicates the accumulation of probes at mitochondria
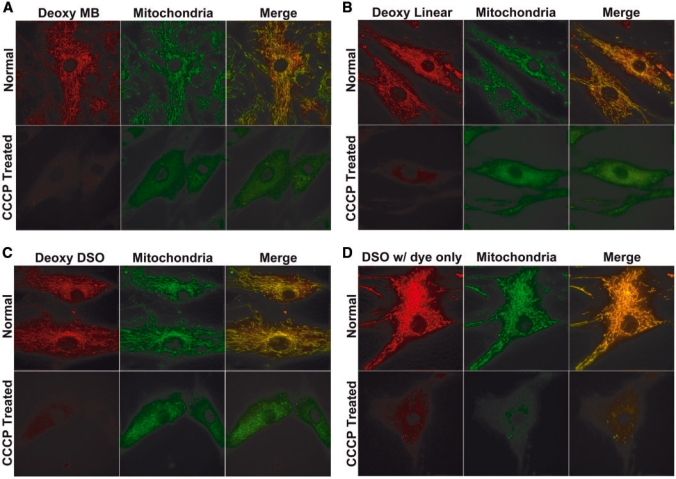
The non-specific fluorescence signal of the oligonucleotide probes 24 h after delivery all showed filament-like localization, similar to the staining of mitochondria (30). To confirm this, we used DiOC6, a mitochondrial staining dye to stain mitochondria in live HDF cells 24 h after delivery of oligonucleotide probes (including random MB, dye-labeled ODN and DSO probes), and imaged the fluorescence signals from Cy3 (excitation at 545 nm and emission detection at 570 nm) and DiOC6 (excitation at 470 nm and emission detection at 525 nm), respectively. As shown in Figure 3A, the filament-like signal from the deoxynucleotide random MB (red) co-localizes with that from mitochondrial staining (green), as indicated by the merged images. The use of a different dye, MitoFluor Green to stain mitochondria gave the same result (data not shown). For dye-labeled ODN and DSO probes with DNA backbone, the filamentous signals (red) were also found to co-localize with the signal from mitochondrial staining (green), as shown by the images in Figure 3B and C, respectively. These results provide strong evidence that, after long-time (24 h) incubation, the Cy3-labeled ODN probes accumulated at mitochondria in live HDF cells.
Figure 3.
The effect of mitochondrial membrane potential on the accumulation of fluorescence signal from: (A) random MB, (B) random-sequence linear oligonucleotide probe, (C) DSO probe labeled with a dye-quencher pair, (D) dye-labeled DSO probe without quencher. Upper panel: fluorescence images of Cy3-labeled random-sequence oligonucleotide probes (upper left panel) and mitochondrial staining (upper middle panel) in normal HDF cells. The merge of the images in upper left and upper middle panels is shown in the upper right panel. Lower panel: fluorescence images of dye-labeled ODN probes (lower left panel) and mitochondria staining (lower middle panel) in CCCP-treated HDF cells. The merge of the images in lower left panel and lower middle panel is shown in the lower right panel. After the delivery of dye-labeled oligonucleotide probes, cells were incubated for 24 h and then treated with CCCP for 30 min. Cells were further incubated in DiOC6- and CCCP-containing medium for 30 min before imaged using a deconvolution microscope with the same exposure time for dye-labeled ODN probe and DiOC6.
The accumulation of Cy3-labeled ODN probes at mitochondria could be caused by the fluorophore, the oligonucleotide or the quencher. The results from the Cy3-labeled linear oligonucleotide probe without a quencher, as shown in Figure 3B, suggest that it is not caused by the quencher. To further rule out the quencher as the cause of mitochondria accumulation, we used a DSO probe with a dye at its end without a quencher (Figure 1D), and performed the delivery and imaging assays. The fluorescence signal from the DSO probe without a quencher also co-localized with mitochondrial staining, as illustrated by Figure 3D. We therefore believe that the mitochondria accumulation of labeled ODN probes was not caused by the quencher.
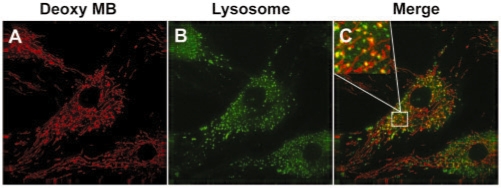
The fluorescence signal from random MB with DNA backbone showed both filamentous signal and spot-like signal, as can be seen from the image in Figure 2C. While the filamentous signal is co-localized with mitochondria staining, the spot-like signal is not. To gain insight, we stained lysosomes in live HDF cells with a lysosome-specific dye LysoTracker 24 h after delivery of random MBs (with DNA backbone), and imaged the fluorescence signal from the random MB (Figure 4A) and LysoTracker (Figure 4B), respectively. Merging the images in Figure 4A and B indicated that most of the spot-like signal from random MBs was co-localized with lysosomes (Figure 4C). Since the spot-like signal from random MBs was observed only after at least 8 h after probe delivery, it is possible that some of the random MBs were internalized and trapped in the lysosomes and degraded there due to the endonuclease activity. This hypothesis is supported by the observation that random MBs with 2′-O-methyl backbone, which has higher resistance to nuclease degradation, did not show spot-like signal (Figure 2F).
Figure 4.
Co-localization of fluorescence signal from random MB with lysosome staining. Twenty-four hours after random MB delivery, cells were incubated with LysoTracker to stain lysosomes, and the signal from Cy3 and LysoTracker were imaged using a deconvolution microscope. Some of the spot-like signal from random MB (A) is co-localized with signal from lysosome staining (B), as indicated by the merged images in (C).
Mitochondrial membrane potential is required for the accumulation of probe signal at mitochondria
It is well known that mitochondrial membrane potential is a major driving force for the transport of molecules across the mitochondrial membranes (31). Mitochondrial membrane potential is one of the key factors regulating important cellular functions including mitochondrial respiration, ATP synthesis, and ion transport (31,32). Cationic fluorescent dyes often selectively accumulate at mitochondria, thus have been used for monitoring the mitochondrial membrane potential. In contrast, neutral and anionic molecules have no mitochondrial interaction (33). Therefore, it is possible that mitochondrial membrane potential is involved in the co-localization of the signal from oligonucleotide probes.
To determine if this is indeed the case, we used CCCP to reduce the mitochondrial membrane potential. Twenty-four hours after delivery of random MBs, cells were incubated with CCCP for 1 h, and mitochondria were stained with DiOC6. As shown in Figure 3A, most of the signal from DiOC6 mitochondrial staining disappeared after CCCP treatment, indicating that mitochondrial membrane potential was significantly reduced by CCCP treatment. Interestingly, the fluorescence signal from random MBs that co-localized with mitochondrial staining was drastically decreased, and the signal showed only a rather diffused distribution in the cytosol. Similar results were observed when Cy3-labeled linear oligonucleotide probe (Figure 3B), quenched DSO probe (Figure 3C) and Cy3-labeled, unquenched DSO probes (Figure 3D) were used. The results shown in Figure 4 clearly suggest that the mitochondrial accumulation of the signal from Cy3-labeoled oligonucleotide probes was induced by the charge-dependent interaction with mitochondria.
Although it is well known that mitochondria and the microtubule network share similar subcellular localization patterns (32), the results shown in Figure 3 clearly indicate that the dye-labeled ODN probes were accumulated at mitochondria, not microtubules, since CCCP treatment of cells, which reduces mitochondrial membrane potential but has no effect on microtubules, dramatically reduced (or eliminated) the filament-like signal from the probes.
Accumulation of probe signal at mitochondria is dye-dependent
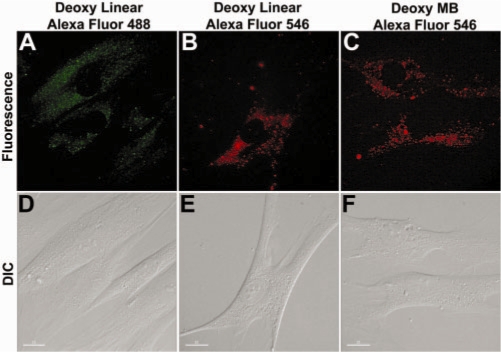
For Cy3-labeled oligonucleotide probes used in our studies, oligonucleotide itself is negatively charged, while the Cy3 dye is positively charged. Thus, it is possible that the accumulation of fluorescence signals at mitochondria is mediated by the Cy3 dye, which belongs to the cyanine dye family. In fact, the dye we used for specific mitochondrial stain, DiOC6 is also a cyanine dye, and almost all dyes that show mitochondria-specific fluorescence are positively charged at physiological pH (33). To determine if other cyanine dyes induce mitochondrial accumulation of labeled oligonucleotide probed, we used Cy5 dye, which is also positively changed, to label random-sequence linear oligonucleotide probes instead of Cy3. Live HDF cells were imaged 24 hours after delivery of the Cy5 labeled linear ODN probed, and the images showed the same filament-like signal co-localized with mitochondrial staining as with Cy3-labeled probes (data not shown). We further used respectively Alexa Fluor 488 and Alexa Fluor 546 (with excitation and emission wavelengths similar to Cy3), which are negatively charged, to label random-sequence linear ODN probes instead of Cy3, and imaged the fluorescence emission 24 hours after probe delivery. However, as shown in Figure 5A and B, probes labeled respectively with Alexa Fluor 488 and Alexa Fluor 546 did not show signal accumulation at mitochondria; rather, the fluorescence signal from Alexa Fluor 488 and Alexa Fluor 546 labeled oligonucleotide probes showed a perinuclear localization with low signal intensity. Delivery of Alexa Fluor 546 labeled random MBs resulted in similar signal distribution 24 h after delivery (Figure 5C). These results clearly suggest that the accumulation of probe signal at mitochondria is dye-dependent, regardless of the structure of the ODN; cyanine dyes (positively charged) facilitate mitochondrial accumulation, whereas Alexa Fluor dyes (negatively charged) do not. Note that the results in Figure 5 were obtained after increasing the signal intensity of the fluorescence images significantly. With the same optics used for imaging Cy3 labeled ODN probes, we did not detect much signal.
Figure 5.
Signal distribution of Alexa Fluor-labeled oligonucleotide probes, as indicated by fluorescence (A–C) and DIC (D–F) images of HDF cells 24 h after delivery of probes, including random-sequence linear oligonucleotide probes labeled with Alexa Fluor 488 (A and D) and Alexa Fluor 546 (B and E) respectively, and random-sequence MBs labeled with Alexa Fluor 546 (C and F). Alexa Fluor labeled probes showed perinuclear localization instead of mitochondria accumulation. Scale bar = 15 µm.
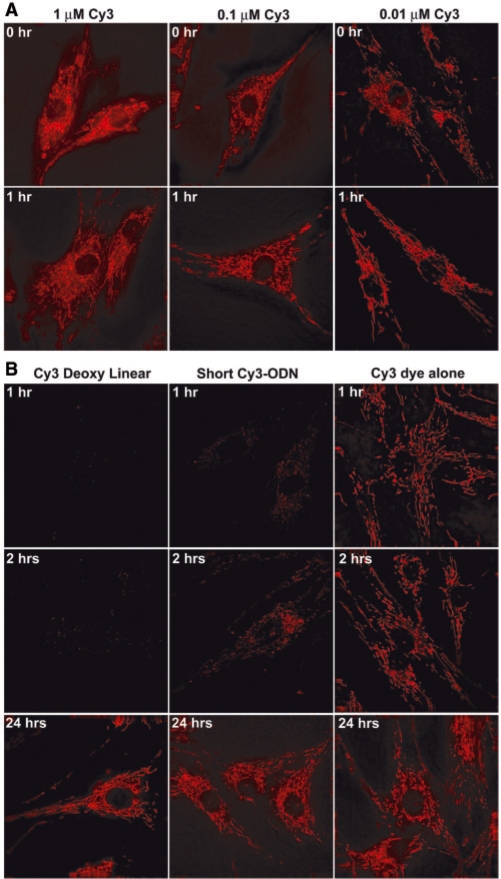
To confirm that Cy3 is a key factor in inducing charge-dependent mitochondrial accumulation of the labeled ODN probes, we delivered 1 µM of Cy3 dye alone and observed extremely bright fluorescence signals that were co-localized with mitochondria staining, even right after delivery (Figure 6A). Reducing the dye concentration to 0.1 µM and 0.01 µM resulted in decreased fluorescence intensity but did not alter the mitochondrial localization pattern. Note that there was little difference between the signals at 0 h (right after delivery) and 1 h after Cy3 delivery (Figure 6A).
Figure 6.
Accumulation of Cy3 dye and Cy3-labeled short-linear oligonucleotide at mitochondria. (A) Fluorescence images of Cy3 dye emission at 0 h (right after delivery) and 1 h after delivery with 1 µM (exposure time: 5 ms), 0.1 µM (exposure time: 50 ms) and 0.01 µM (exposure time: 200 ms) Cy3 concentration. (B) Comparison of fluorescence images of Cy3-labeled random-sequence linear ODN probe (right panel), Cy3-labeled short ODN probe (middle panel) and Cy3 dye alone at 1, 2 and 24 h after delivery, all with concentration of 1 µM. The exposure time for the ODN probes was 200 ms, and that for Cy3 dye was 5 ms.
Although it is clear that Cy3 dye alone can act as a cationic mitochondrial staining dye due to its positive charge, it is still puzzling why Cy3-labeled oligonucleotide accumulate at mitochondria, since the 26 nt negatively changed oligonucleotide should balance the positive charge of Cy3. To determine the effect of the length of the oligonucleotide, we used Cy3 to label a short oligonucleotide, which only has the first 4 nt of the 26 nt random linear oligonucleotide (Table 1). Delivery of the short ODN probe into HDF cells also showed signal accumulation at mitochondria; however, this appeared about 2 h after delivery (mid-panel in Figure 6B), much slower than that of Cy3 dye alone, and much faster than that of Cy3-labeled 26 nt linear ODN probe, as shown in Figure 6B. It is possible that the increased molecular weight of the ODN probe caused the decreased rate of mitochondrial accumulation due to its effect on diffusion. We also delivered a longer, 40 nt Cy3-labeled ODN probe and observed similar mitochondrial accumulation 24 h after delivery (data not shown).
Probes may not be inside mitochondrial inner membrane
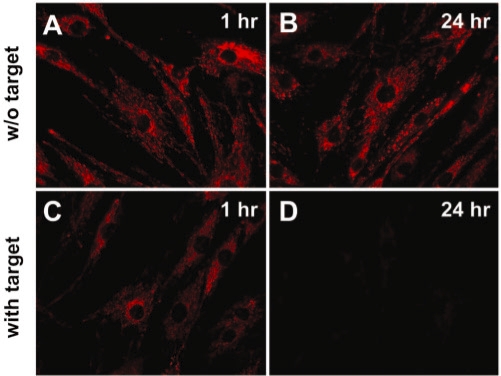
Why fluorescence signal from cyanine dye-labeled ODN probes accumulated at mitochondria 24 h after delivery? There are a few possible reasons: (i) charge of the dye, (ii) ODN structure, (iii) degradation of the probe inside mitochondria. Since the chemical environment inside the inner mitochondrial membrane (mitochondrial matrix) is different from that of cytosol, it is possible that cyanine dye-labeled ODN probes are degraded in the mitochondrial matrix. To determine if the probes were inside or outside the mitochondria inner membrane (the outer membrane of mitochondria is permeable to biomolecules <5 KD, while the inner membrane of mitochondria is impermeable to ions and macromolecules), we designed a linear target oligonucleotide (sense strand, Table 1) conjugated with a BHQ-2 quencher (Figure 1F), which has a sequence complementary to the random-sequence linear oligonucleotide probe (antisense, Table 1). Upon hybridization with the Cy3-labeled random-sequence linear ODN probe, the fluorescence of Cy3 is quenched by this target (data not shown). As discussed earlier, our results indicate that the BHQ-2 quencher is not involved in the mitochondrial localization of the ODN probes. Therefore, the BHQ-2 labeled ODN target by itself should not accumulate at mitochondria. We delivered the Cy3-labeled random-sequence linear ODN probes into live HDF cells, incubated the cells at 37°C for 24 h to allow the probes accumulate at mitochondria (as indicated by the bright signal from the Cy3-labeled linear ODN probe at this time point), then delivered the BHQ-2 labeled targets into these cells and incubated the cells at 37°C for up to 24 h. As shown in Figure 7, the fluorescence signal from Cy3-labeled ODN probes accumulated at mitochondria was decreased significantly by the BHQ-2 labeled target ODN just 1 h after target ODN delivery. 24 h after target ODN delivery, most of the fluorescence signals disappeared, presumably due to quenching by the ODN target delivered.
Figure 7.
Fluorescence images of Cy3-labeled random-sequence linear ODN probe showing that the ODN probes are not inside the mitochondrial inner membrane. After delivery of 1 µM of Cy3-labeled random-sequence linear ODN probes, HDF cells were incubated for 24 h. Cells were further incubated without (A and C) or with (C and D) 2 µM of quencher-conjugated linear complementary target, and imaged at 1 h (A and C) or 24 h (B and D) after target delivery. The same exposure time was used for all images.
This result suggests that the Cy3-labeled ODN probes are near/on mitochondria surface, or inside the outer membrane of mitochondria, but not inside the inner membrane of mitochondria. This is based on the assumption that the BHQ-2 conjugated ODN targets do not translocate across the inner membrane of mitochondria. To definitely confirm that the Cy3-labeled ODN probes are outside the mitochondrial inner membrane, it might be necessary to perform electron microscopy (EM) studies with high spatial resolution. However, the ODN probes need to be tagged with gold nanoparticles to achieve EM contrast (34), which may alter the intracellular distribution of the probes, especially their interaction with mitochondria. It may also be possible to isolate mitochondria from cells and perform in vitro assays to determine if Cy3-labeled ODN probes are inside mitochondrial inner membrane. The potential issues, however, are that: (i) the intracellular environment such as specific proteins may be required for dye-labeled ODN probes to interact with mitochondria; (ii) the viability and functionality of isolated mitochondria may have a large effect on the interaction between dye-labeled ODN probes and mitochondria.
In summary, in this work, we found that Cy3- (or Cy5)-labeled oligonucleotide probes including MBs with DNA and 2′-O-methyl backbones show strong non-specific fluorescence signal at mitochondria 24 h after probe delivery into live HDF cells. Our results suggest that this mitochondrial accumulation is mediated by mitochondrial membrane potential, and is dye-dependent. Therefore, cyanine dye-labeled ODN probes are probably inappropriate for long-time monitoring of the dynamics of mRNA expression and localization. However, for rapid imaging of RNA in live cells using MBs, the use of cyanine dyes may not be an issue, since the mitochondrial accumulation of signal from random MB appeared 8–10 h after delivery (Figure 2). Although the SLO-based probe delivery was chosen for this study, we observed similar mitochondrial accumulation of oligonucleotide probes delivered using a liposome-based delivery method. Oligonucleotide probes in the endosome were slowly released and localized at the mitochondria. We have also observed previously that cell penetrating peptide-mediated delivery using TAT peptide-conjugated MBs also resulted in non-specific mitochondrial accumulation of probes. Thus, we believe that the mitochondrial accumulation of Cy3 or Cy5 labeled oligonucleotides does not depend on the specific delivery method used. In our previous work, we used Cy3 and Cy5 dyes as a fluorescence resonance energy transfer (FRET) pair for live-cell imaging of specific mRNAs, and found that the fluorescence signal from MBs targeting K-Ras or GAPDH mRNAs were co-localized with mitochondrial staining (30,35). In these studies, the fluorescence signal was imaged 45–60 min after MB delivery; therefore, it is most likely that the signal was due to hybridization of the MBs to their mRNA targets, since it took about 5 h for the unquenched Cy3-labeled linear ODN probe to show signal accumulation at mitochondria.
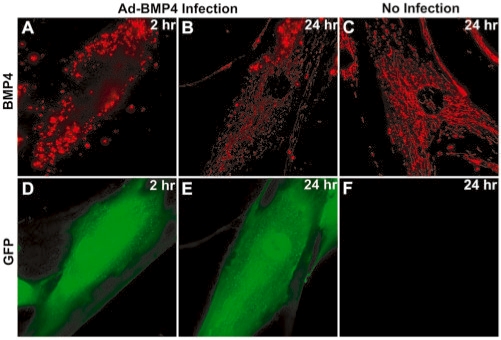
To determine if oligonucleotide probes targeting a specific mRNA slowly accumulate at mitochondria, we used one of the specific MBs validated previously (19) that target BMP-4 mRNA. We infected cells with adenovirus to overexpress BMP-4 (bone morphogenic protein 4) and GFP, delivered BMP-4 targeting MB, and observed the subcellular distribution of fluorescence signal for up to 24 h after delivery. As shown in Figure 8A, at 2 h post-delivery, in GFP-expressing cells (Figure 8D), the fluorescent signal from BMP-4 MBs exhibited a spot-like distribution with high intensity; these spot-like signals were proven to be specific signals from hybridization of MBs to BMP-4 mRNA (19). At 24 h post-delivery, we observed a decrease in the spot-like signals both in their amount and fluorescence intensity, as well as an increase in fluorescent signal accumulated at mitochondria (Figure 8B and E). This clearly indicates that, for oligonucleotide probes labeled with Cy3 fluorophore, some probes can accumulate at mitochondria even when the probes target specific mRNA, thus producing a high background signal during the long-term monitoring of specific mRNA in living cells. In non-infected cells, BMP-4 targeting MBs showed the same mitochondrial distribution as random MBs (Figure 8C and F), since there was a very low amount of target mRNA in these cells.
Figure 8.
Fluorescence images of Cy3-labeled BMP-4 targeting MBs in HDF cells that infected with (A, B, D, and E) and without (C and F) adenovirus. Infected cells highly expressed BMP-4 and GFP, which was used as an independent marker for infection, but not tagged to BMP-4 protein. HDF cells were infected with adenovirus and then delivered with 1 µM of BMP-4 targeting MB. MB (A–C) and GFP (D–F) fluorescent signals were observed 2 (A and D) and 24 (C and E) hours after delivery. The same exposure time was used for each channel.
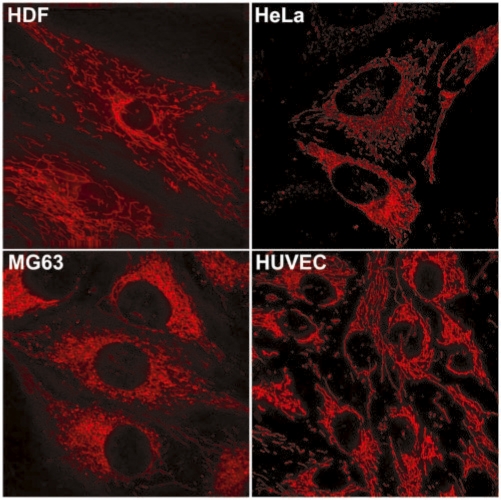
To confirm that this non-specific accumulation of oligonucleotide probes is not limited to HDF cells, we delivered 1 µM of Cy3-labeled random DSO into different cell types and further incubated for 24 h. As shown in Figure 9, Cy3-labeled random DSO probes showed similar mitochondrial accumulation in MG63 (osteosarcoma), HUVEC (human umbilical vein endothelial cell) and HeLa (epithelial cell) cells, in addition to HDF cells. Therefore, the non-specific accumulation of cyanine dye-labeled oligonucleotide probes to mitochondria does not seem to be cell-type dependent.
Figure 9.
Accumulation of Cy3-labeled DSO probes at mitochondria in different cell types such as HDF, HeLa, MG63 and HUVEC. One micromolar of Cy3-labeled DSO probes were delivered into each cell type and further incubated for 24 h. Mitochondrial accumulation was observed with a deconvolution microscope.
How cyanine dyes such as Cy3 and Cy5 induced the accumulation of ODN probes, including random MBs and DSO probes at mitochondria remains elusive. Clearly, mitochondrial membrane potential is essential, and the dye molecule plays an important role, for otherwise there would be no difference between Cy3-labeled and Alexa Fluor 488-labeled ODN probes in signal localization. It has been demonstrated that cationic molecules selectively accumulate at mitochondria, while neutral and anionic molecules have no mitochondrial interaction, possibly due to the relatively high electric potential (inside negative) across the mitochondrial membrane (33). However, for dye-labeled ODN probes, the charge of the dye may not be the only driving force. For example, although Cy3 is positively charged (e = +1) and may interact with mitochondria membrane, the 26 nt linear ODN has a total charge of e = −26 (−1 charge per nt); therefore, the overall net charge of the dye-labeled probes is negative, which should not cause the interaction of Cy3-labeled ODN probe with mitochondrial membrane. Although the intracellular salt condition may affect the total charge of the dye-labeled probe, it is unlikely that it had a large effect on the probe accumulation at mitochondria, since both in the cytosol and mitochondrial intermembrane space, the ionic strength is the same (the outer mitochondrial membrane is permeable to ions and small molecules <5 KDa). Further, for random MBs with deoxynucleotide and 2′-O-methyl backbones (Figure 1A), as well as the DSO probes (Figure 1D), there is no mRNA target in the HDF cells, thus the stem–loop structure of the probes should remain closed, and the fluorescence of the Cy3 dye should be quenched by the BHQ-2 quencher. How these stem–loop hairpin probes are opened non-specifically or degraded near or on mitochondria remains a mystery. It is highly unlikely that mitochondrial accumulation of the fluorophore-labeled ODN probes (including MBs) is due to the negatively changed oligonucleotide, since Alexa Fluor dye-labeled oligonucleotide did not accumulated at mitochondria. Although salt concentration plays an important role in stabilizing the stem–loop hairpin structure of a MB, it may not be the cause of MB opening at mitochondria due the fact that in the mitochondrial intermembrane space the ionic strength is the same as in the cytosol. It would not be responsible for the opening of the Cy3-labeled DSO probe either (which has a very high melting temperature, Table 1). Since mitochondrion contains intermembrane space between outer membrane (permeable to biomolecules <5 kD) and inner membrane (impermeable to ions and macromolecule), it is possible that positively charged fluorophores are attracted to the intermembrane space due to local charge–charge interactions (e.g. driven by mitochondrial membrane potential) and, once the probes (including MBs) with positively charged fluorophores are trapped in the intermembrane space, they are being degraded by enzymes. This possibility merits a separate study.
In addition to the basic biological questions involved in the mitochondrial accumulation of dye-labeled ODN probes, it is important to understand why ODN probes labeled with cyanine dyes may generate a strong background signal after long-time (>5 h) incubation. The Cy3 dye is one of the most effective dyes in live-cell mRNA imaging using labeled ODN probes such as MBs. It has been reported that Alexa 546, which has similar excitation and emission spectra compared with Cy3, is quenched 39%, 35%, 57% and 34% by adenosine, cytidine, guanosine and thymidine bases, respectively (22). In contrast, the fluorescence emission from Cy3 is enhanced when conjugated to oligonucleotides (22). Therefore, understanding the sub-cellular localization of cyanine-dye conjugated oligonucleotides has practical importance in the design of dye-labeled ODN probes for live-cell RNA imaging studies.
FUNDING
National Institutes of Health as a Program of Excellence in Nanotechnology (HL80711 to G.B.); as a Center of Cancer Nanotechnology Excellence (CA119338 to G.B.); National Institutes of Health (CA103103 to G.B.); Korea Research Foundation Grant (KRF-2006-D00074 to W.J.R.) from the Korean Government (MOEHRD, Basic Research Promotion Fund). Funding for open access charge: NIH Award HL80711.
Conflict of interest statement. None declared.
REFERENCES
- 1.Wu Y, Yang CJ, Moroz LL, Tan W. Nucleic acid beacons for long-term real-time intracellular monitoring. Anal. Chem. 2008;80:3025–3028. doi: 10.1021/ac702637w. [DOI] [PMC free article] [PubMed] [Google Scholar]
- 2.McCormick SM, Eskin SG, McIntire LV, Teng CL, Lu CM, Russel CG, Chittur KK. DNA microarray reveals changes in gene expression of shear stressed human umbilical vein endothelial cells. Proc. Natl Acad. Sci. USA. 2001;98:8955–8960. doi: 10.1073/pnas.171259298. [DOI] [PMC free article] [PubMed] [Google Scholar]
- 3.Sen-Banerjee S, Mir S, Lin Z, Hamik A, Atkins GB, Das H, Banerjee P, Kumar A, Jain MK. Kruppel-like factor 2 as a novel mediator of statin effects in endothelial cells. Circulation. 2005;112:720–726. doi: 10.1161/CIRCULATIONAHA.104.525774. [DOI] [PubMed] [Google Scholar]
- 4.Sorescu GP, Song H, Tressel SL, Hwang J, Dikalov S, Smith DA, Boyd NL, Platt MO, Lassegue B, Griendling KK, et al. Bone morphogenic protein 4 produced in endothelial cells by oscillatory shear stress induces monocyte adhesion by stimulating reactive oxygen species production from a nox1-based NADPH oxidase. Circ. Res. 2004;95:773–779. doi: 10.1161/01.RES.0000145728.22878.45. [DOI] [PubMed] [Google Scholar]
- 5.Barry MA, Eastman A. Identification of deoxyribonuclease II as an endonuclease involved in apoptosis. Arch. Biochem. Biophys. 1993;300:440–450. doi: 10.1006/abbi.1993.1060. [DOI] [PubMed] [Google Scholar]
- 6.Crouch RJ, Dirksen ML. In: Nucleases. Linn SM, Roberts RJ, editors. Vol. 14. Plainview, NY: Cold Spring Harbor Press; 1982. pp. 211–241. [Google Scholar]
- 7.Cummins LL, Owens SR, Risen LM, Lesnik EA, Freier SM, McGee D, Guinosso CJ, Cook PD. Characterization of fully 2’-modified oligoribonucleotide hetero- and homoduplex hybridization and nuclease sensitivity. Nucleic Acids Res. 1995;23:2019–2024. doi: 10.1093/nar/23.11.2019. [DOI] [PMC free article] [PubMed] [Google Scholar]
- 8.Baker BF, Lot SS, Condon TP, Cheng-Flournoy S, Lesnik EA, Sasmor HM, Bennett CF. 2′-O-(2-Methoxy)ethyl-modified anti-intercellular adhesion molecular 1 (ICAM-1) oligonucleotides selectively increase the ICAM-1 mRNA level and inhibit formation of the ICAM-1 translation initiation complex in human umbilical vein endothelial cells. J. Biol. Chem. 1997;272:11994–12000. doi: 10.1074/jbc.272.18.11994. [DOI] [PubMed] [Google Scholar]
- 9.Molenaar C, Marras SA, Slats JC, Truffert JC, Lemaitre M, Raap AK, Dirks RW, Tanke HJ. Linear 2′ O-Methyl RNA probes for the visualization of RNA in living cells. Nucleic Acids Res. 2001;29:E89. doi: 10.1093/nar/29.17.e89. [DOI] [PMC free article] [PubMed] [Google Scholar]
- 10.Prakash TP, Johnston JF, Graham MJ, Condon TP, Manoharan M. 2′-O-[2-[(N,N-dimethylamino)oxy]ethyl]-modified oligonucleotides inhibit expression of mRNA in vitro and in vivo. Nucleic Acids Res. 2004;32:828–833. doi: 10.1093/nar/gkh220. [DOI] [PMC free article] [PubMed] [Google Scholar]
- 11.Sheth U, Parker R. Decapping and decay of messenger RNA occur in cytoplasmic processing bodies. Science. 2003;300:805–808. doi: 10.1126/science.1082320. [DOI] [PMC free article] [PubMed] [Google Scholar]
- 12.Tyagi S, Kramer FR. Molecular beacons: probes that fluoresce upon hybridization. Nat. Biotechnol. 1996;14:303–308. doi: 10.1038/nbt0396-303. [DOI] [PubMed] [Google Scholar]
- 13.Tyagi S, Bratu DP, Kramer FR. Multicolor molecular beacons for allele discrimination. Nat. Biotechnol. 1998;16:49–53. doi: 10.1038/nbt0198-49. [DOI] [PubMed] [Google Scholar]
- 14.Bao G, Rhee WJ, Tsourkas A. Fluorescent Probes for Live-Cell RNA Detection. Annu. Rev. Biomed. Eng. 2009;11:25–47. doi: 10.1146/annurev-bioeng-061008-124920. [DOI] [PMC free article] [PubMed] [Google Scholar]
- 15.Yang CJ, Lin H, Tan W. Molecular assembly of superquenchers in signaling molecular interactions. J. Am. Chem. Soc. 2005;127:12772–12773. doi: 10.1021/ja053482t. [DOI] [PMC free article] [PubMed] [Google Scholar]
- 16.Tsourkas A, Behlke MA, Bao G. Structure-function relationships of shared-stem and conventional molecular beacons. Nucleic Acids Res. 2002;30:4208–4215. doi: 10.1093/nar/gkf536. [DOI] [PMC free article] [PubMed] [Google Scholar]
- 17.Tsourkas A, Behlke MA, Rose SD, Bao G. Hybridization kinetics and thermodynamics of molecular beacons. Nucleic Acids Res. 2003;31:1319–1330. doi: 10.1093/nar/gkg212. [DOI] [PMC free article] [PubMed] [Google Scholar]
- 18.Santangelo PJ, Nix B, Tsourkas A, Bao G. Dual FRET molecular beacons for mRNA detection in living cells. Nucleic Acids Res. 2004;32:e57. doi: 10.1093/nar/gnh062. [DOI] [PMC free article] [PubMed] [Google Scholar]
- 19.Rhee WJ, Santangelo PJ, Jo H, Bao G. Target accessibility and signal specificity in live-cell detection of BMP-4 mRNA using molecular beacons. Nucleic Acids Res. 2008;36:e30. doi: 10.1093/nar/gkn039. [DOI] [PMC free article] [PubMed] [Google Scholar]
- 20.Nitin N, Rhee WJ, Bao G. Translation inhibition reveals interaction of 2′-deoxy and 2′-O-methyl molecular beacons with mRNA targets in living cells. Nucleic Acids Res. 2009;37:4977–4986. doi: 10.1093/nar/gkp517. [DOI] [PMC free article] [PubMed] [Google Scholar]
- 21.Sokol DL, Zhang X, Lu P, Gewirtz AM. Real time detection of DNA.RNA hybridization in living cells. Proc. Natl Acad. Sci. USA. 1998;95:11538–11543. doi: 10.1073/pnas.95.20.11538. [DOI] [PMC free article] [PubMed] [Google Scholar]
- 22.Marras SA, Kramer FR, Tyagi S. Efficiencies of fluorescence resonance energy transfer and contact-mediated quenching in oligonucleotide probes. Nucleic Acids Res. 2002;30:e122. doi: 10.1093/nar/gnf121. [DOI] [PMC free article] [PubMed] [Google Scholar]
- 23.Marras SAE, Kramer FR, Tyagi S. Multiplex detection of single-nucleotide variations using molecular beacons. Genetic Analysis: Biomol. Eng. 1999;14:151–156. doi: 10.1016/s1050-3862(98)00018-7. [DOI] [PubMed] [Google Scholar]
- 24.Zhang P, Beck T, Tan W. Design of a molecular beacon DNA probe with two fluorophores. Angew. Chem. Int. Ed. Engl. 2001;40:402–405. doi: 10.1002/1521-3773(20010119)40:2<402::AID-ANIE402>3.0.CO;2-I. [DOI] [PubMed] [Google Scholar]
- 25.Heytler PG. Uncouplers of oxidative phosphorylation. Methods Enzymol. 1979;55:462–472. doi: 10.1016/0076-6879(79)55060-5. [DOI] [PubMed] [Google Scholar]
- 26.Finucane DM, Waterhouse NJ, Amarante-Mendes GP, Cotter TG, Green DR. Collapse of the inner mitochondrial transmembrane potential is not required for apoptosis of HL60 cells. Exp. Cell. Res. 1999;251:166–174. doi: 10.1006/excr.1999.4527. [DOI] [PubMed] [Google Scholar]
- 27.Facompre M, Wattez N, Kluza J, Lansiaux A, Bailly C. Relationship between cell cycle changes and variations of the mitochondrial membrane potential induced by etoposide. Mol. Cell Biol. Res. Commun. 2000;4:37–42. doi: 10.1006/mcbr.2000.0251. [DOI] [PubMed] [Google Scholar]
- 28.Armstrong JS, Steinauer KK, French J, Killoran PL, Walleczek J, Kochanski J, Knox SJ. Bcl-2 inhibits apoptosis induced by mitochondrial uncoupling but does not prevent mitochondrial transmembrane depolarization. Exp. Cell. Res. 2001;262:170–179. doi: 10.1006/excr.2000.5091. [DOI] [PubMed] [Google Scholar]
- 29.Castedo M, Ferri K, Roumier T, Metivier D, Zamzami N, Kroemer G. Quantitation of mitochondrial alterations associated with apoptosis. J. Immunol. Methods. 2002;265:39–47. doi: 10.1016/s0022-1759(02)00069-8. [DOI] [PubMed] [Google Scholar]
- 30.Santangelo PJ, Nitin N, Bao G. Direct visualization of mRNA colocalization with mitochondria in living cells using molecular beacons. J. Biomed. Opt. 2005;10:044025. doi: 10.1117/1.2011402. [DOI] [PubMed] [Google Scholar]
- 31.Henze K, Martin W. Evolutionary biology: essence of mitochondria. Nature. 2003;426:127–128. doi: 10.1038/426127a. [DOI] [PubMed] [Google Scholar]
- 32.Alberts B, Bray D, Lewis J, Raff M, Roberts K, Watson JD. Molecular Biology of the Cell. 3rd edn. New York, NY: Garland Publishing; 1994. [Google Scholar]
- 33.Johnson LV, Walsh ML, Bockus BJ, Chen LB. Monitoring of relative mitochondrial membrane potential in living cells by fluorescence microscopy. J. Cell. Biol. 1981;88:526–535. doi: 10.1083/jcb.88.3.526. [DOI] [PMC free article] [PubMed] [Google Scholar]
- 34.Cady NC, Strickland AD, Batt CA. Optimized linkage and quenching strategies for quantum dot molecular beacons. Mol. Cell Probes. 2007;21:116–124. doi: 10.1016/j.mcp.2006.09.001. [DOI] [PubMed] [Google Scholar]
- 35.Nitin N, Santangelo PJ, Kim G, Nie S, Bao G. Peptide-linked molecular beacons for efficient delivery and rapid mRNA detection in living cells. Nucleic Acids Res. 2004;32:e58. doi: 10.1093/nar/gnh063. [DOI] [PMC free article] [PubMed] [Google Scholar]


