


Abstract
Various studies in unicellular and multicellular organisms have shown that codon bias plays a significant role in translation efficiency (TE) by co-adaptation to the tRNA pool. Yet, in humans and other mammals the role of codon bias is still an open question, with contradictory results from different studies. Here we address this question, performing a large-scale tissue-specific analysis of TE in humans, using the tRNA Adaptation Index (tAI) as a direct measure for TE. We find tAI to significantly correlate with expression levels both in tissue-specific and in global expression measures, testifying to the TE of human tissues. Interestingly, we find significantly higher correlations in adult tissues as opposed to fetal tissues, suggesting that the tRNA pool is more adjusted to the adult period. Optimization based analysis suggests that the tRNA pool—codon bias co-adaptation is globally (and not tissue-specific) driven. Additionally, we find that tAI correlates with several measures related to the protein functionally importance, including gene essentiality. Using inferred tissue-specific tRNA pools lead to similar results and shows that tissue-specific genes are more adapted to their tRNA pool than other genes and that related sets of functional gene groups are translated efficiently in each tissue. Similar results are obtained for other mammals. Taken together, these results demonstrate the role of codon bias in TE in humans, and pave the way for future studies of tissue-specific TE in multicellular organisms.
INTRODUCTION
Codon bias, the unequal usage of different codons, has been observed in many organisms. It is believed that in many unicellular organisms codon bias has evolved to optimize translation efficiency (TE) by favoring codons with higher levels of tRNA (1–4). Similar evidence was found in multicellular organisms such as Caenorhabditis elegans and Drosophila melanogaster (5,6). However, the evolution and functional significance of codon bias in multicellular organisms such as mammals, and specifically in humans, are still largely unknown (7,8). Small scale analyses have shown that expressing a foreign gene in human cells while fitting its codons to the bias of human can increase its protein levels by two orders of magnitude (9), implying a relation between codon bias and TE. However, large-scale analyses of codon bias in humans show contradictory results: some of the studies relate the bias to TE while others do not find a significant correlation between these two variables (2,10–16) [reviewed in (8)].
When analyzing the role of codon bias in TE in humans, two points should be noted: First, a measure for TE should address the translation process directly. However, most previous studies relied on various measures for codon bias that are not directly related to TE. For example, Wright (17) suggested the measure of effective number of codons, which quantifies how far the codon usage of a gene departs from equal usage of synonymous codons. Urrutia and Hurst (13,14) used the Maximum Likelihood Codon Bias (MCB), which measures the observed bias from a background model of expected bias. Others have defined measures for the similarity between the codon bias of a gene to the usage found in highly expressed genes which their usage is presumably selected for [e.g. Frequency of Optimal Codons (18); Codon Bias Index (19); Codon Adaptation Index (20)]. This assumption is of course plausible, but yet indirect [e.g. highly expressed gene may also undergo selection for increased GC content (21)]. Hence, when studying TE, a more useful approach would go beyond quantifying the codon bias and also aim to measure the codon-bias—tRNA pool co-adaptation. Indeed, the tRNA Adaptation Index (tAI) forms such a measure (2), as it assigns for each codon a score based upon the availability of the corresponding tRNAs. tAI was shown to correspond to in vivo measurements of translation rate of specific codons (22), as well as being a better predictor of protein abundance in Saccharomyces cerevisiae as compared to other measures (3,23). However, tAI has not been used to study TE in depth in human or other multicellular organisms. Second, in difference from previous studies of TE in multicellular organisms that utilized global measures of expression [e.g. (13–16)], an analysis of TE in this setting should consider the distinct gene expression (GE) pattern of each tissue. However, most previous studies either focused on the codon bias of small sets of tissue-specific genes rather than the overall expression patterns of these tissues (24–26) or took global expression measures such as expression breadth (number of tissues in which the gene is expressed), expression rate (mean expression over tissues) (13,14) or maximum expression level (15,16). While a former study indeed used tissue-specific expression levels in humans (12), it used other measures for codon and amino acid (AA) bias rather than direct measures for TE such as tAI. Here we perform the first large-scale study in human that combines both points: a tissue-specific direct analysis of TE in human, using the tAI measure. Our results suggest that codon bias plays an important role in TE in humans, with significant differences between tissues and developmental stages.
MATERIALS AND METHODS
tAI calculation
For all organisms, tAI was calculated as described in dos Reis et al. (2).
Briefly, this measure is based on the fact that each codon is recognized by some anti-codon(s) and the corresponding tRNA(s). According to Crick’s wobble rules (27), more than one anti-codon can recognize the codon, with different efficiency, based on the match between them [see dos Reis et al. (2) for all the relations between codons and anti-codons].
Let ni be the number of tRNA isoacceptors recognizing codon i. Let tGCNij be the copy number of the jth tRNA that recognize the ith codon, and let Sij be the selective constraint on the efficiency of the codon–anti-codon coupling. We define the absolute adaptiveness Wi for each codon i as:
From Wi we obtain wi, which is the relative adaptiveness value of codon i by normalizing the Wi's values (dividing them by the maximal Wi). Supplementary Table S1 shows the w values for all codons according to the human genomic tRNA pool.
The final tAI of a gene, g, is the following geometric mean:
 |
where ikg is the codon defined by the k’th triplet on gene g and lg is the length of the gene (excluding stop codons). S values were taken from dos Reis et al. (2).
Codon usage for human, Muss musculus (mouse) and S. cerevisiae (yeast) genes was downloaded from the Codon Usage Database (28) (http://www.kazusa.or.jp/codon/) on 7.2008. The codon usage for Pan troglodytes (chimpanzee), Rattus norvegicus (rat) and Escherichia coli, was calculated from genes' sequences that were downloaded from BioMart (29). The codon usage for C. elegans and D. melanogaster (fruit fly) was calculated from genes’ sequences downloaded from KEGG database (30).
Human, chimpanzee, mouse, rat, S. cerevisiae, C. elegans and E. coli tRNA copy numbers were downloaded from the Genomic tRNA Database (31) (http://gtrnadb.ucsc.edu).
Tissue-specific tRNA levels
Dittmar et al. (26) have characterized the expression levels of tRNA across human tissues, but we were not able to use these results here as they are not absolute tissue-specific levels but only ratios relative to the brain. In addition, such data are currently available on only eight human tissues. Nevertheless, we have conducted several additional extensive analyses using the data of Dittmar et al. (26), to further support our choice of tRNA copy number and the results reported in the article.
First, we used the tRNA levels in the brain as our reference point, following Dittmar et al. (26), i.e. making their levels equal to the genomic copy number provided by Dittmar et al. (26) (in their Supplementary Data) and used the ratios reported in their article to infer from them the levels in other tissues. We used the copy number in Dittmar et al. (26) though it is slightly different from the current version in Genomic tRNA Database (31), in order to use their original assignment of each probe to the corresponding tRNA and infer the relevant ratios. Nevertheless, the two sets of copy numbers are highly correlated and as can be seen from Supplementary Tables S2 and S8, lead to very similar results, both in the correlation magnitude and in the ranking of tissues. Next, we measured the tAI–GE correlation in six of the tissues, for which we had expression data in our dataset. Second, in an alternative route for identifying and using tissue-specific tRNA levels for the TE computation, we have employed an optimization procedure to infer the tissue-specific tRNA levels. Briefly, instead of assuming that the tRNA levels in the brain are determined by the tRNA copy numbers, we allowed their levels to vary and, while maintaining the tRNA expression ratios reported in the work of Dittmar et al. as constraints, we maximized the overall correlation between tAI and expression levels across the tissues with both expression data and relative tRNA values.
Formally, let Ti denote the inferred vector of tRNA levels in tissue i (i = 1 denotes the brain); let tAI(Ti) denote the corresponding vector of gene tAI when using Ti as proxy of tRNA levels; let  denote GE vector in tissue i; Let
  denote Spearman correlation.
We solved the following optimization problem:
such that:
For every i each entry in Ti is larger than 0 if the copy number of the corresponding entry is larger than 0; otherwise the entry remains 0.
The ratios between the expression levels of tRNAs in each tissue(i = 1, 2, …) relative to the brain (i = 1) are identical to the results reported in (26).
To solve this problem we employed the optimization approach of Nelder–Mead (32,33). Optimization was done simultaneously on all tissues.
As further tissue-specific analysis, we measured the tissue-specific tAI measure (using optimized tissue-specific tRNA levels, as above) of tissue-specific genes in those tissues and found them to be significantly higher than other genes expressed in these tissues (‘Discussion’ section). To evaluate the significance of TE in tissue-specific genes, we compared their mean tissue-specific tAI to those of 100 000 random gene sets of the same size (all of them expressed in the specific tissue).
GE data
All expression data was downloaded from Gene Expression Omnibus (34) (http://www.ncbi.nlm.nih.gov/geo/).
Human tissues (including fetal tissues): we used the GE of Su et al. (35) (GDS596). As the original data set is redundant (i.e. it includes similar tissues; for example, more than 20 of the tissues are from different parts of the brain) we focused our analysis on 30 (out of 79) non-redundant normal adult tissues (Supplementary Table S2).
Other GE sets: fetal and adult circulating blood reticulocytes (GDS2655), Mouse tissues (GDS592), Mouse fetal and adult liver (GSE13149), Mouse embryonic stem cells (GDS2666), Yeast (GDS772, wild type), Chimpanzee (GSE7540), Rat (GDS589, three strains), E. coli (GSE6836), D. melanogaster (GSE7763) and C. elegans (GSE8004).
We averaged technical repeats and probes of the same gene. Following (36), a gene was defined as expressed in a tissue if its expression level in Affymetrix chip was above 200 standard Affymetrix average-difference units. A gene was defined as tissue specific in a tissue if it is expressed in that tissue and its expression level is at least 2 SD above its mean across all tissues.
Protein–protein interactions
Protein–protein interaction data were downloaded from (37). After mapping to Entrez IDs, it contains 10 024 proteins and 78 799 interactions. For tissue-specific protein interactions networks, we considered only proteins whose genes are expressed in the tissue.
Essential genes
A list of essential genes, both for human and mouse, was compiled using the Mouse Genome Informatics (38) (http://www.informatics.jax.org). We defined a mouse gene to be essential if its phenotype data contained the term ‘MP:0005374’ (lethality-prenatal/perinatal). Using this criterion, 1844 genes were defined to be essential. Similarly, we defined a human gene to be essential if its mouse homolog was essential, resulting in 1765 human essential genes. We evaluated the significance of their median tAI by comparing it to those of 10 000 random gene sets of the same size.
GC content
In order to control for GC content, we have used several measures of GC content:
GC percentage of (a) the gene (exons only) (b) introns only (c) both introns and exons of the gene (d) 3′ UTR and (e) 5′ UTR. All these measures were downloaded from BioMart (29).
GC percentage of the isochore of the gene [which was shown to be highly correlated with the GC content of the gene (8)]. The genomic location of each gene was downloaded from BioMart (29), and the GC content of isochors along the human genome was taken from Constantini et al. (39).
GC percentage of the probes used in the microarrays of Su et al. (35) (Affymetrix GeneChip Human Genome U133 Array Set HG-U133A). Probes sequences were downloaded from Affymetrix website (table HG-U133A_2.probe_tab for human) and we have calculated accordingly the GC content. When more than one probe was mapped to a gene, we have averaged the probes’ GC content.
In addition, we made nucleotide-preserving permutation significance testing. We permutated the codons for each gene, while preserving its nucleotide content. We divided the 61 codons (ignoring stop codons) into equivalence classes. Codons A and B were in the same class if and only if they share the same nucleotides (e.g. {CGU, CUG, UCG, GCU, GUC, UGC} is an equivalence class). Permutations were allowed only between members of the same class. After obtaining random (nucleotide preserving) codon distribution, we computed tAI based on these distributions, and repeated our analyses. This test was repeated a 100 times.
Replication time
In order to control for replication time bias, which was shown to correlate with GC content (40), we have used replication time data of the human genome, with a resolution of 1 MB (downloaded from http://www.sanger.ac.uk/PostGenomics/replication-timing/).
Recombination rate
Recombination rate was shown to be correlated with various sequence features, including GC content (41). Recombination rate data were taken from Jensen-Seaman et al. (41).
AA bias
We defined two measures of AA bias for control:
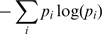
- For each gene, its AA bias was defined as the entropy of the frequencies of the AAs along its corresponding protein [an accepted measure for non-uniformity; e.g. (42)]. Let
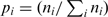 denote the fraction of AA ni (1 ≤ i ≤ 20) in a protein. The AA bias for the protein is:
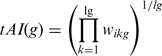
We made an additional control for AA bias using a new tAI measure, tAIaa. The tAIaa of a gene was defined as its tAI normalized by the maximal possible tAI value for a sequence with the same AAs. Briefly, as in (2), each codon is given a weight w, according to the genomic copy numbers of its associated tRNAs. For each AA we define an optimal codon, being the one with the highest w. Let tAI(g) be the tAI of gene g, and let tAImax(g) be the tAI for the same sequence of AAs, when using optimal codons only. We define tAIaa to be
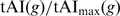 . Following this definition, tAIaa controls for AA bias, as it considers the actual AA sequence as well.
Evolutionary rate
Evolutionary rate (ER) is defined as the ratio between synonymous and non-synonymous mutations (dN/dS) of a gene. We used two measures of ER: (i) between human and mouse and (ii) along the human lineage. ER values between human and mouse were downloaded from BioMart (29). ER values along the human lineage were computed as describe in (43).
tRNA–codon bias co-adaptation significance test
In order to check the significance of the tRNA–codon bias co-adaptation found in human tissues we made two randomization tests, one for the codon bias and the other for the tRNA pool:
In the codon bias test, we made permutations between different codons of the same AA. Each permutation was done for each gene separately.
In the tRNA pool test, we made permutations between the copy numbers of different tRNAs of the same codon.
Thus, both tests preserve the original protein sequence and the total copy number of tRNAs for each of the AAs.
Repeating each test 100 times, we measured the tAI–GE correlation for both tests, and obtained an empirical P-value for the current tRNA codon bias co-adaptation (being the fraction of random sets above the correlation observed in the original data). tAI–GE correlation was measured for each tissue separately and for all the tissues (by concatenating all GE data into one vector) as well.
tRNA pool optimality
The weaker tAI–GE correlation in humans (e.g. as compared to yeast) may be the result of multi-cellular constraints—i.e. the need to determine the composition of a common global pool (the tRNA copy number) for the different expression levels observed in different tissues. Examining this hypothesis further, we performed a heuristic hill climbing search (simulated annealing) from numerous random starting states, to find a distribution of tRNA copy numbers that yields both a minimal and maximal tAI–expression correlations (separately, of course) given a single tissue (in our case, the heart, the tissue with the highest correlation).We then repeated this computation as we incrementally added additional tissues to the set whose correlations need to be maximized/minimized. We added tissues in the following order: heart, PB-BDCA4+dendritic cells, skeletal muscle, bronchial epithelial cells, whole brain and whole blood. When considering more than one tissue, the total correlation was computed for the concatenation of the GE of all the tissues being optimized.
In each step of the optimization the overall sum of all tRNA copy numbers present in the genome was preserved (additionally preserving the copy numbers that are equal to zero)—i.e. the underlying assumption is that there is a limited given amount of tRNA genes in the genome, but evolution is free to choose the `best’ combination of specific tRNA copies given this allocation.
Functional enrichment
Functional enrichment was done using the DAVID bioinformatics Functional Annotation tool (44). For each analysis we ranked the genes according to their tAI and took the top genes (taking the top 5, 10 and 20% genes for genome-wide, tissue-specific and housekeeping analyses, respectively. Differences are due to different sample sizes to allow comparable sets of several hundred genes for each analysis). In analyzing differential TE (i.e. genes that are efficient in a specific tissue as compared to their efficiency in other tissues) we measured for each tissue its tAI (and normalized its with the mean tAI in the tissue). Next, for each gene in each tissue we calculated the ratio between its tAI in that tissue and the mean tAI in other tissue, and took the top 5% genes among all genes. We report here only results that are significant after false discovery rate (‘Benjamini’ in DAVID results). The results (Supplementary Table S7) are grouped according to the clusters generated by DAVID. In cases where the same gene ontology (GO) term appears in more than one cluster, we present it only once.
Analysis
Analysis was done using Matlab® software (MathWorks Inc.). All correlations are the non-parametric Spearman correlation (and partial correlation).
RESULTS
Tissue-specific translation is efficient
We calculated tAI values for 12 271 human genes for which expression data across tissues was available (35), and detected significant correlations between tAI and GE levels in all 30 human adult tissues examined. This testifies to the efficient translation in those tissues, where highly expressed genes have higher TE. The correlations varied among the tissues, with the heart, lung and liver showing the highest correlation scores (R > 0.21) and the appendix and salivary gland showing the lowest scores (R < 0.05, Figure 1 and Supplementary Table S2). These results, as well as others reported below, remain significant after controlling for numerous potentially confounding features reported earlier in the literature (GC content, AA bias, protein length, replication time, recombination rate and more) (Note 1 in Supplementary Data and Supplementary Tables S2 and S3).
Figure 1.

Tissue-specific TE in humans. tAI–GE correlation values in 30 normal adult tissues. See Supplementary Table S1 for additional information.
Analyzing tissue-specific TE in a developmental perspective, we studied whether there is a difference in TE between fetal and adult tissues. Comparison between adult and fetal circulating blood reticulocytes showed that adult tissues exhibit a significantly higher correlation (P = 2.62 × 10⁻⁵, Wilcoxon test). Additional comparison of four tissues further supported this hypothesis (where three of them exhibit 2–3-fold increase in correlation, Figure 2), but we were unable to test the significance of these results due to the small number of samples. Taken together, these results suggest that the current tRNA genomic copy number is more adapted to the adult period rather than the developmental/fetal one.
Figure 2.

tAI–GE correlation in adult versus fetal tissues.
The co-adaptation of codon bias and tRNA pool is globally driven
The human tAI–expression correlations shown above are markedly lower than the levels that have been typically obtained in unicellular organisms [in E. coli these correlation values varies between 0.30 and 0.44 across 121 different conditions (Supplementary Table S4) and in S. cerevisiae being R = 0.596, P = 4.54 × 10−264 (Supplementary Figure S1)]. This may represent a lower selection pressure on multi-tissue organisms, perhaps due to smaller effective population size (45). Yet, another possibility for explaining this gap is that the need to cater for more tissues in multicellular organisms makes the task of optimizing tAI–expression correlation more challenging. Additionally, it is interesting to observe that expression patterns across human tissues have a higher variation than that observed across growth environments in unicellular organisms (Note 2 in Supplementary Data). In light of these comparatively lower human TE levels, we turned to further study the co-adaptation of the tRNA pool–codon bias in both global and in tissue-specific terms (‘Materials and Methods’ section). First, we randomly permutated the current tRNA pool, without changing the translation code (by permuting the tRNAs of the same AA), finding it to be significantly adapted to the given codon usage human genes over all tissues (empirical P = 0.01). Next, we randomly permutated each gene's; codon usage, without changing its protein sequence, again finding the current codon bias more adapted to the given tRNA pool over all tissues (empirical P <0.01). However, when we measured these correlations in each tissue separately we found a small number of tissues that were not significantly more correlated than the random sets, for both kinds of tests (Supplementary Table S5). This can be a result for a global, rather than tissue specific, co-adaptation; as the genomic tRNA pool is shared by all tissues, the tRNA pool–codon bias co-adaptation is globally driven, resulting in rather low correlations in specific tissues (in lieu of putative ‘compromises’ that evolution has to make due to the multiple constraints). Examining this hypothesis further, optimization based analysis shows that, as expected, the tAI–expression correlation decreases as we add more tissues in a simulated scenario (‘Materials and Methods’ section). Furthermore, this simulation demonstrates that the current correlation observed in humans is closer to being maximal than to being minimal (Supplementary Figure S2).
Functionally important genes are translated more efficiently
Turning to study global features of human TE, we find that shorter genes are translated more efficiently: there is a significant negative correlation between tAI and protein length (R = –0.12, P = 1.05 × 10−40). This result, which is in concordance with previous studies showing (for other organisms) a correlation between codon bias and protein length (46–48), may reflect that both mechanisms for TE (protein length and codon bias) work in concert. In addition, we find tAI to significantly correlate with both expression rate and breadth [R = 0.182, P = 2.34 × 10−92 and R = 0.144, P = 7.14 × 10−58, respectively (Figure 3A and B)]. Moreover, we find that the tAI reflects previously reported trends more robustly than the MCB measure (13). Whereas the correlation between MCB and expression breadth is not significant after controlling for protein length, the tAI remains significantly correlated with both expression rate and breadth even after controlling to gene length, as well as many other features [R = 0.139, P = 8.58 × 10⁻³³ and R = 0.10, P = 1.27 × 10⁻¹⁷, for expression rate and breadth, respectively (Note 1 in Supplementary Notes; Supplementary Table S6)]. The correlation between tAI and expression breadth may indicate that housekeeping genes are translated more efficiently. To examine this hypothesis further we measured the correlation between tAI and a number of measures that are conventionally considered to be related to the functional importance of genes. We find that essential human genes have higher values of tAI as compared to those of all genes (empirical P < 10−5); conserved genes show higher tAI values manifesting a significant negative correlation between tAI and ER (R = –0.263, P = 5.81 × 10−231, Figure 3C); and finally a gene’s tAI significantly correlates with its connectivity in a human protein–protein interaction network (R = 0.055, P = 4.73 × 10⁻⁸). Taken together, these results indicate that functionally important genes are translated more efficiently in humans.
Figure 3.

Correlations between TE and expression patterns and between TE and ER. (A) tAI versus expression breadth (R = 0.869, P = 3.48 × 10⁻⁷). Genes are binned according to the number of tissues in which they are expressed. For each bin we show its mean tAI. (B) tAI versus expression rate (R = 0.872, P = 1.41 × 10⁻⁶). We divided the genes into bins according to their mean expression over 30 tissues. Each bin is 200 standard Affymetrix average-difference units wide, using a minimal bin size of at least 10 genes. For each bin we show its mean tAI. (C) tAI versus ER (R = –0.887, P = 3.97 × 10⁻⁷) across human genes. ER values are the dN/dS ratio between the human and mouse. We divided the ER values in the range [0,1] to 25 intervals (each 0.04 wide), taking the mean tAI for each interval. We considered only intervals with at least 10 genes.
In addition, to identify whether the most efficient genes (in tAI terms) are enriched in some functional classes, we ranked all the genes according to their tAI values and looked whether the top genes were enriched in specific GO (49) categories (‘Materials and Methods’ section). We find that the most translationally efficient genes are enriched in functional classes such as ribosomal activity, metal (copper, cadmium) and calcium ion binding, GTPase activity, development and more (Supplementary Table S7). When focusing on housekeeping genes (i.e. those expressed in all tissues), we find enrichment in genes related to ribosomal activity (Supplementary Table S7).
TE analysis based on inferred tissue-specific tRNA levels
All results above are based on global copy numbers of tRNAs. Yet, when analyzing tissue-specific aspects of TE, a more adequate measure would be the actual tissue-specific tRNA levels, which varies between tissues (26). However, as such data are currently unavailable on a broad scope, we used tRNA genomic copy number as approximation for their actual levels. Nevertheless, as additional analysis of tissue-specific TE, we used published data of relative tRNA levels in various human tissues (26). Being relative measurements we could not use the data directly, but, using an optimization procedure we inferred tissue-specific tRNA levels from the data (‘Materials and Methods’ section). Interestingly, the results obtained using tRNA genomic copy numbers remain fairly similar when using inferred tissue-specific tRNA levels instead of the tRNA copy numbers, for a set of six tissues for which both relative tRNA levels (26) and expression data was available (35) (Figure 5 and Supplementary Table S8), suggesting that tRNA genomic copy numbers can be used for first approximation. In addition, for all six tissues we find significant correlation between tAI and expression for the genes expressed in these tissues. Moreover, focusing on tissue-specific genes, we find that in three of the six tissues examined, their inferred tissue-specific tAI measure is significantly higher than that of other genes expressed in the tissue (empirical P <0.002, Supplementary Table S9).
Figure 5.

Comparison between genomic tAI values and inferred tissue-specific tAI values. tAI–GE correlation values in six human tissues, based on tAI–GE correlation for (i) copy number—genomic copy numbers (shared by all tissues), (ii) Relative tRNA levels—obtained by fixing the brain tRNA levels as a base point equal to the genomic copy numbers and using the ratios reported in (26) to infer the levels in the five other tissues, and (iii) Optimized tRNA levels, where we allowed variance in the brain tRNA levels (while maintaining the tRNA expression ratios in other tissues) when optimizing the overall tAI–GE in tissues (‘Materials and Methods’ section). As expected from such an optimization procedure, the resulting tAI–GE correlations were higher than those previously obtained using the gene copy number, but remarkably, in average less than 5% higher (Supplementary Table S8).
Next, we obtained tissue-specific protein–protein interaction networks, based upon the genes expressed in each tissue (‘Materials and Methods’ section). We find that in five of the six tissues, hubs (proteins with connectivity above the 90th percentile) are translated significantly more efficiently compared to other genes expressed in the tissue. Similarly, we find that tAI significantly correlates with network connectivity in four of the tissue-specific networks (Supplementary Table S9).
Similar to our analysis of global tAI measures, we used the tissue-specific tAI measure to look for functional enrichment in translationally-efficient genes. We find ribosomal proteins show significant tissue-specific TE in all tissues. Interestingly, we also find that genes translated efficiently in the brain are enriched in calcium ion-binding genes. Calcium is known to have a major essential role in various neuronal activities such as neurotransmitter release and dendritic propagation (50). In addition, we find genes translated efficiently in the thymus to be enriched for genes related to chemotaxis and locomotion, which play a key role in T cells maturation in the thymus (51) (Table 1, Supplementary Table S7). As each tissue has its own tRNA pool, we identified the genes that are significantly efficient in a given tissue according to its own tRNA pool, compared to their TE (tAI values) in other tissues. Interestingly, we find that the set of genes in the gonads (testis and ovary) is overlapping considerably compared to other tissues, as well as the set of genes in the immune system tissues of the thymus and lymph nodes (Jaccard index being 0.253 and 0.156 for the gonads and immune system, respectively, compared to mean Jaccard index 0.055 across all tissues. See also Supplementary Table S7 for enriched GO terms in the gene set of each tissue). Notably, this distinction cannot be inferred from GE alone (e.g. expression in the testis is more correlated with the brain and thymus than the ovary). Additionally, we find that genes related to calcium ion binding are translated more efficiently in the brain and that hormonal genes [including growth hormone 2 (Entrez ID: 4262), insulin (Entrez ID: 3630) and more (GO:0005179)] are translated more efficiently in the liver, as compared to other tissues (Table 1, Supplementary Table S7). Similar tissue-specific analysis of the ovary shows enrichment for extracellular matrix related genes (GO:0031012), specifically for collagen genes (GO:0005581), both are known to have an important role in normal ovary function (52) as well as in ovarian cancer progression, outcome and treatment (53–55) (Table 1, Supplementary Table S7). In addition we find that cadmium ion binding is enriched in the testis; this may be related to the sensitivity of this tissue to elevated levels of cadmium [e.g. (56)].
Table 1.
List of functional groups showing enrichment for tissue-specific TE
| Brain | Liver | Testis | Ovary | Thymus | Lymph node | |
|---|---|---|---|---|---|---|
| Tissue-specific TE | ribosome, calcium ion binding, GTP binding | ribosome, structural molecule activity, cytoplasm | ribosome, copper ion binding, actin binding | ribosome, copper ion binding, extracellular region | ribosome, chemotaxis, locomotory behavior | ribosome, transporter activity, cation transport |
| Differential tissue-specific TE | calcium ion binding, protein folding, actin binding | immune system response, extracellular region, hormonal activity | DNA binding, Zinc ion binding, cadmium ion binding | DNA binding, collagen, extracellular matrix | transcription factor activity, signal transducer activity, amine transport | transporter activity, amine transport, peptide binding |
For each tissue we show the top three significant functional groups (based upon GO classification) exhibiting significant TE (as compared to other genes in the tissue [tissue-specific TE] and as compared to their TE in other tissues [differential tissue-specific TE]). The bold groups are those discussed in the text. For the full list of functional groups exhibiting significant tissue-specific TE see Supplementary Table S7.
Taken together, these results suggest that inferred tissue-specific tAI values reveal additional tissue-specific features of TE.
DISCUSSION
Using tAI as a measure for TE and large-scale tissue-specific expression data, we analyzed the role of codon bias in TE in humans, finding it to be important. As opposed to most previous studies in multicellular organisms, our tissue-specific approach enabled us to find significant differences across tissues and developmental stages. Computation based analysis implies that the codon bias–genomic tRNA pool co-adaptation is globally driven, thus explaining why the tAI–GE correlations observed in human, although significant, are lower than those obtained in unicellular organisms. In addition, using various measures, we find that functionally important genes are translated more efficiently, and identify functional groups that are translated more efficiently. Extending our analyses to mouse, chimpanzee and rat, we obtain qualitatively similar results (Figures 4; Notes 3–4 in Supplementary Data; Supplementary Tables S10–S12). These findings suggest that codon bias plays an important functional role in TE in humans as well as in other mammals.
Figure 4.

TE analysis in other mammals. tAI versus expression rate in other mammals: (A) in Pan troglodytes (chimpanzee) R = 0.841, P = 5.49 × 10⁻⁶, (B) in Mus musculus (mouse) R = 0.758, P = 2.59 × 10⁻⁴ and (C) in Rattus nrvegicus (rat, Spargue strain) R = 0.692, P = 2.60 × 10⁻⁴. We divided the genes into bins according to their mean expression over 30 tissues. Each bin is 150 standard Affymetrix average-difference units wide, using a minimal bin size of at least 10 genes. For each bin we show its mean tAI. In addition, we performed further analyses, such as tissue-specific analysis in these mammals with several controls and more, obtaining significant results. See Notes 3–4 (Supplementary Data) and Supplementary Tables S10–S12 for detailed results.
Recently, employing some of methods described here, we have shown that codon bias plays a significant role in TE not only in normal tissues but also in cancerous tissues. Analyzing the distribution of cancerous mutations in the tumor suppressor gene TP53, we found them to be under selection for their TE effect (22). This result generalizes the results reported here for normal tissues.
Our results indicate that there is a significant difference between the TEs at distinct developmental stages and that the tRNA pool is more adjusted to the expression regime of adult versus fetal period. In order to see whether we observe this difference in other mammals as well, we compared adult and fetal liver tissues in mouse (57). Again, we find the adult tissue showing higher correlation values (P = 0.0158, Wilcoxon test; Supplementary Table S13). As there are GE measurements in various developmental stages of mouse embryonic stem cells (58), we examined how this correlation changes during development. Interestingly, we find a significant correlation between development and tAI–GE correlation—as the stem cells develop, the correlation increases (R = 0.864, P = 0.0013, over 11 developmental time points. See Supplementary Table S14). Notably, we also find that as the fetal liver develops, its GE regime becomes more similar to the adult liver (R > 0.97, P = 3.96 × 10⁻⁴ over eight prenatal developmental stages), which may partially explain the increase in co-adaptation to the genomic tRNA pool during developmental stages.
Nevertheless, the lower correlation observed in fetal tissues does not necessarily indicate that their translation is less efficient. It may be a result of post-transcriptional regulation such as RNA-binding proteins (59,60) or ncRNAs (61,62). Indeed, various mechanisms of such regulation are known to be abundant during development (63,64).
As mammals are viviparous organisms, some proteins are translated in maternal tissues and transported to the fetus. Therefore, the expression in fetal tissues may not necessarily represent the actual demands and may account for the different correlation values. To analyze this hypothesis, we examined whether this phenomenon is also observed in oviparous organisms which lay eggs and where the embryo translates all its proteins by itself. For that purpose, we have examined expression data from the central nervous system of the oviparous nematode C. elegans. We found that also in this organism, embryonic tissue exhibited significant lower correlation than the corresponding larval tissue (P = 0.0159, Wilcoxon’s test; Supplementary Table S15). To asses our assumption that in our context larval tissues resemble adult tissues (and differ from fetal tissues), we compared between larval and adult tissues in the oviparous fruit fly D. melanogaster, not finding significant differences in tAI–GE correlations (Supplementary Table S16). These results suggest that also in some of the oviparous the tRNA pool is more adjusted to the expression regime at the adulthood. An interesting future work would be to further analyze the differences in TE between various developmental stages in different organisms.
Nevertheless, some limitations of the current analysis should be pointed out.
First, the tAI measure encapsulates within its definition the wobble rules (27). However, there are some posttranscriptional modifications which alter the specific binding of some tRNAs (65,66). When more data on these modifications will be available it will obviously be interesting to repeat the analysis shown here.
In addition, following previous studies in humans and other multicellular organisms (6,11,15,16), we used the genomic copy numbers of tRNA genes as a first approximation of their levels; indeed, tRNA copy numbers were previously shown to highly correlate with their expression levels in several unicellular organisms (18,67–69). This global measure, shared by all tissues, is adequate when analyzing global features of TE (such as the fetal/adult tissue comparison, multi-tissue optimization, the functionally importance of genes and more). Yet, when analyzing tissue-specific aspects of TE, a more adequate measure would be the actual tissue-specific tRNA levels, which varies between tissues (26). However, such data are currently unavailable on a broad scope, therefore we used tRNA genomic copy number as approximation for their actual levels. While tRNA copy numbers are obviously identical across tissues, their usage leads to distinct tissue-specific TE estimations since each tissue has a different GE pattern. Nevertheless, analysis based on inferred on tissue-specific tRNA levels for six tissues leads to results similar to those reported using the common pool, suggesting that tRNA genomic copy numbers can be used for first approximation. As tissue-specific tRNA levels data accumulates, it will be highly interesting to repeat our analysis: the tissue-specific TE scores presented here should possibly be viewed as lower bounds on the final TE values in humans, as the actual tissue-specific tRNA levels are probably further transcriptionally regulated to optimize TE.
SUPPLEMENTARY DATA
Supplementary Data are available at NAR Online.
FUNDING
Edmond J. Safra Bioinformatics program at Tel-Aviv University (to Y.Y.W.); Koshland Scholar award from the Weizmann Institute of Science (to T.T.); Israeli Science Fund (ISF), the Ministry of Science and Technology (MOST) and the Tauber Fund (to E.R.); The Israel Science Foundation (grant number 385/06 to R.S.). Funding for open access charge: Tauber Fund.
Conflict of interest statement. None declared.
Supplementary Material
ACKNOWLEDGEMENTS
The authors thank the anonymous referees for their valuable comments and suggestions.
REFERENCES
- 1.Ikemura T. Codon usage and tRNA content in unicellular and multicellular organisms. Mol. Biol. Evol. 1985;2:13–34. doi: 10.1093/oxfordjournals.molbev.a040335. [DOI] [PubMed] [Google Scholar]
- 2.dos Reis M, Savva R, Wernisch L. Solving the riddle of codon usage preferences: a test for translational selection. Nucleic Acids Res. 2004;32:5036–5044. doi: 10.1093/nar/gkh834. [DOI] [PMC free article] [PubMed] [Google Scholar]
- 3.Man O, Pilpel Y. Differential translation efficiency of orthologous genes is involved in phenotypic divergence of yeast species. Nat. Genet. 2007;3:415–421. doi: 10.1038/ng1967. [DOI] [PubMed] [Google Scholar]
- 4.Lithwick G, Margalit H. Hierarchy of sequence-dependent features associated with prokaryotic translation. Genome Res. 2003;13:2665–2673. doi: 10.1101/gr.1485203. [DOI] [PMC free article] [PubMed] [Google Scholar]
- 5.Duret L, Mouchiroud D. Expression pattern and, surprisingly, gene length shape codon usage in Caenorhabditis, Drosophila, and Arabidopsis. Proc. Natl Acad. Sci. USA. 1999;96:4482–4487. doi: 10.1073/pnas.96.8.4482. [DOI] [PMC free article] [PubMed] [Google Scholar]
- 6.Duret L. tRNA gene number and codon usage in the C. elegans genome are co-adapted for optimal translation of highly expressed genes. Trends Genet. 2000;16:287–289. doi: 10.1016/s0168-9525(00)02041-2. [DOI] [PubMed] [Google Scholar]
- 7.Duret L. Evolution of synonymous codon usage in metazoans. Curr. Opin. Genet. Dev. 2002;12:640–649. doi: 10.1016/s0959-437x(02)00353-2. [DOI] [PubMed] [Google Scholar]
- 8.Chamary JV, Parmley JL, Hurst LD. Hearing silence: non-neutral evolution at synonymous sites in mammals. Nat. Rev. Genet. 2006;7:98–108. doi: 10.1038/nrg1770. [DOI] [PubMed] [Google Scholar]
- 9.Gustafsson C, Govindarajan S, Minshull J. Codon bias and heterologous protein expression. Trends Biotechnol. 2004;22:346–353. doi: 10.1016/j.tibtech.2004.04.006. [DOI] [PubMed] [Google Scholar]
- 10.Kanaya S, Yamada Y, Kinochi M, Kudo Y, Ikemura T. Codon usage and tRNA genes in eukaryotes: correlation of codon usage diversity with translation efficiency and with CG-dinucleotide usage as assessed by multivariate analysis. J. Mol. Evol. 2001;53:290–298. doi: 10.1007/s002390010219. [DOI] [PubMed] [Google Scholar]
- 11.Lander ES, Linton LM, Birren B, Nusbaum C, Zody MC, Baldwin J, Devon K, Dewar K, Doyle M, FitzHugh W, et al. Initial sequencing and analysis of the human genome. Nature. 2001;409:860–921. doi: 10.1038/35057062. [DOI] [PubMed] [Google Scholar]
- 12.Comeron JM. Selective and mutational patterns associated with gene expression in humans: influences on synonymous composition and intron presence. Genetics. 2004;167:1293–1304. doi: 10.1534/genetics.104.026351. [DOI] [PMC free article] [PubMed] [Google Scholar]
- 13.Urrutia AO, Hurst LD. Codon usage covaries with expression breadth and the rate of synonymous evolution in humans, but this is not evidence for selection. Genetics. 2001;159:1191–1199. doi: 10.1093/genetics/159.3.1191. [DOI] [PMC free article] [PubMed] [Google Scholar]
- 14.Urrutia AO, Hurst LD. The signature of selection mediated by expression on human genes. Genome Res. 2003;13:2260–2264. doi: 10.1101/gr.641103. [DOI] [PMC free article] [PubMed] [Google Scholar]
- 15.Lavner Y, Kotlar D. Codon bias as a factor in regulating expression via translation rate in the human genome. Gene. 2005;345:127–138. doi: 10.1016/j.gene.2004.11.035. [DOI] [PubMed] [Google Scholar]
- 16.Kotlar D, Lavner Y. The action of selection on codon bias in the human genome is related to frequency, complexity, and chronology of amino acids. BMC Genomics. 2006;7:67. doi: 10.1186/1471-2164-7-67. [DOI] [PMC free article] [PubMed] [Google Scholar]
- 17.Wright F. The effective number of codons used in a gene. Gene. 1990;87:23–29. doi: 10.1016/0378-1119(90)90491-9. [DOI] [PubMed] [Google Scholar]
- 18.Ikemura T. Correlation between the abundance of Escherichia coli transfer RNAs and the occurrence of the respective codons in its protein genes: a proposal for a synonymous codon choice that is optimal for the E. coli system. J. Mol. Biol. 1981;151:389–409. doi: 10.1016/0022-2836(81)90003-6. [DOI] [PubMed] [Google Scholar]
- 19.Bennetzen JL, Hall BD. Codon selection in yeast. J. Mol. Chem. 1982;257:3026–3031. [PubMed] [Google Scholar]
- 20.Sharp PM, Li WH. The codon adaptation index - a measure of directional synonymous codon usage bias, and its potential applications. Nucleic Acids Res. 1987;15:1281–1295. doi: 10.1093/nar/15.3.1281. [DOI] [PMC free article] [PubMed] [Google Scholar]
- 21.Lercher MJ, Urrutia AO, Pavlícek A, Hurst LD. A unification of mosaic structures in the human genome. Hum. Mol. Genet. 2003;12:2411–2415. doi: 10.1093/hmg/ddg251. [DOI] [PubMed] [Google Scholar]
- 22.Waldman YY, Tuller T, Sharan R, Ruppin E. TP53 cancerous mutations exhibit selection for translation efficiency. Cancer Res. 2009;69:8807–8813. doi: 10.1158/0008-5472.CAN-09-1653. [DOI] [PubMed] [Google Scholar]
- 23.Tuller T, Kupiec M, Ruppin E. Determinants of protein abundance and translation efficiency in S. cerevisiae. PLoS Comput. Biol. 2007;3:e248. doi: 10.1371/journal.pcbi.0030248. [DOI] [PMC free article] [PubMed] [Google Scholar]
- 24.Plotkin JB, Robins H, Levine AJ. Tissue-specific codon usage and the expression of human genes. Proc. Natl Acad. Sci. USA. 2004;101:12588–12591. doi: 10.1073/pnas.0404957101. [DOI] [PMC free article] [PubMed] [Google Scholar]
- 25.Sémon M, Lobry JR, Duret L. No evidence for tissue-specific adaptation of synonymous codon usage in humans. Mol. Biol. Evol. 2006;23:523–529. doi: 10.1093/molbev/msj053. [DOI] [PubMed] [Google Scholar]
- 26.Dittmar KA, Goodenbour JM, Pan T. Tissue-specific differences in human transfer RNA expression. PLoS Genet. 2006;2:e221. doi: 10.1371/journal.pgen.0020221. [DOI] [PMC free article] [PubMed] [Google Scholar]
- 27.Crick FH. Codon–anticodon pairing: the wobble hypothesis. J. Mol. Biol. 1966;19:548–555. doi: 10.1016/s0022-2836(66)80022-0. [DOI] [PubMed] [Google Scholar]
- 28.Nakamura Y, Gojobori T, Ikemura T. Codon usage tabulated from international DNA sequence databases: status for the year 2000. Nucleic Acids Res. 2000;28:292. doi: 10.1093/nar/28.1.292. [DOI] [PMC free article] [PubMed] [Google Scholar]
- 29.Durinck S, Moreau Y, Kasprzyk A, Davis S, De Moor B, Brazma A, Huber W. BioMart and Bioconductor: a powerful link between biological databases and microarray data analysis. Bioinformatics. 2005;21:3439–3440. doi: 10.1093/bioinformatics/bti525. [DOI] [PubMed] [Google Scholar]
- 30.Kanehisa M, Araki M, Goto S, Hattori M, Hirakawa M, Itoh M, Katayama T, Kawashima S, Okuda S, Tokimatsu T, et al. KEGG for linking genomes to life and the environment. Nucleic Acids Res. 2008;36:D480–D484. doi: 10.1093/nar/gkm882. [DOI] [PMC free article] [PubMed] [Google Scholar]
- 31.Chan PP, Lowe TM. GtRNAdb: a database of transfer RNA genes detected in genomic sequence. Nucleic Acids Res. 2009;37:D93–D97. doi: 10.1093/nar/gkn787. [DOI] [PMC free article] [PubMed] [Google Scholar]
- 32.Nelder JA, Mead R. A simplex method for function minimization. Computer J. 1965;7:308–313. [Google Scholar]
- 33.Lagarias JC, Reeds JA, Wright MH, Wright PE. Convergence properties of the Nelder-Mead simplex method in low dimensions. SIAM J. Optim. 1998;9:112–147. [Google Scholar]
- 34.Barrett T, Troup DB, Wilhite SE, Ledoux P, Rudnev D, Evangelista C, Kim IF, Soboleva A, Tomashevsky M, Edgar R. NCBI GEO: mining tens of millions of expression profiles—database and tools update. Nucleic Acids Res. 2006;35:D760–D765. doi: 10.1093/nar/gkl887. [DOI] [PMC free article] [PubMed] [Google Scholar]
- 35.Su AI, Wiltshire T, Batalov S, Lapp H, Ching KA, Block D, Zhang J, Soden R, Hayakawa M, Kreiman G, et al. A gene atlas of the mouse and human protein-encoding transcriptomes. Proc. Natl Acad. Sci. USA. 2004;101:6062–6067. doi: 10.1073/pnas.0400782101. [DOI] [PMC free article] [PubMed] [Google Scholar]
- 36.Su AI, Cooke MP, Ching KA, Hakak Y, Walker JR, Wiltshire T, Orth AP, Vega RG, Sapinoso LM, Moqrich A, et al. Large-scale analysis of the human and mouse transcriptomes. Proc. Natl Acad. Sci. USA. 2002;99:4465–4470. doi: 10.1073/pnas.012025199. [DOI] [PMC free article] [PubMed] [Google Scholar]
- 37.Bossi A, Lehner B. Tissue specificity and the human protein interaction network. Mol. Syst. Biol. 2009;5:260. doi: 10.1038/msb.2009.17. [DOI] [PMC free article] [PubMed] [Google Scholar]
- 38.Bult CJ, Eppig JT, Kadin JA, Richardson JE, Blake JA. Mouse Genome Database Group: The Mouse Genome Database (MGD): mouse biology and model systems. Nucleic Acids Res. 2008;36:D724–D728. doi: 10.1093/nar/gkm961. [DOI] [PMC free article] [PubMed] [Google Scholar]
- 39.Costantini M, Clay O, Auletta F, Bernardi G. An isochore map of human chromosomes. Genome Res. 2006;16:5536–5541. doi: 10.1101/gr.4910606. [DOI] [PMC free article] [PubMed] [Google Scholar]
- 40.Woodfine K, Fiegler H, Beare DM, Collins JE, McCann OT, Young BD, Debernardi S, Mott R, Dunham I, Carter NP. Replication timing of the human genome. Hum. Mol. Genet. 2004;13:191–202. doi: 10.1093/hmg/ddh016. [DOI] [PubMed] [Google Scholar]
- 41.Jensen-Seaman MI, Furey TS, Payseur BA, Lu Y, Roskin KM, Chen CF, Thomas MA, Haussler D, Jacob HJ. Comparative recombination rates in the rat, mouse, and human genomes. Genome Res. 2004;14:528–538. doi: 10.1101/gr.1970304. [DOI] [PMC free article] [PubMed] [Google Scholar]
- 42.Cover TM, Thomas JA. Elements of Information Theory. NY: J. Wiley and sons; 1991. [Google Scholar]
- 43.Tuller T, Kupiec M, Ruppin E. Evolutionary rate and gene expression across different brain regions. Genome Biol. 2008;9:R142. doi: 10.1186/gb-2008-9-9-r142. [DOI] [PMC free article] [PubMed] [Google Scholar]
- 44.Dennis G, Jr, Sherman BT, Hosack DA, Yang J, Gao W, Lane HC, Lempicki RA. DAVID: Database for Annotation, Visualization, and Integrated Discovery. Genome Biol. 2003;4:P3. [PubMed] [Google Scholar]
- 45.Sharp PM, Averof M, Lloyd AT, Matassi G, Peden JF. DNA sequence evolution: the sounds of silence. Philos. Trans. R. Soc. Lond. B. 1995;349:241–247. doi: 10.1098/rstb.1995.0108. [DOI] [PubMed] [Google Scholar]
- 46.Eyre-Walker A. Synonymous codon bias is related to gene length in Escherichia coli: selection for translational accuracy? Mol. Biol. Evol. 1996;13:864–872. doi: 10.1093/oxfordjournals.molbev.a025646. [DOI] [PubMed] [Google Scholar]
- 47.Duret L, Mouchiroud D. Expression pattern and, surprisingly, gene length shape codon usage in Caenorhabditis, Drosophila, and Arabidopsis. Proc. Natl Acad. Sci. USA. 1999;96:4482–4487. doi: 10.1073/pnas.96.8.4482. [DOI] [PMC free article] [PubMed] [Google Scholar]
- 48.Coghlan A, Wolfe KH. Relationship of codon bias to mRNA concentration and protein length in Saccharomyces cerevisiae. Yeast. 2000;16:1131–1145. doi: 10.1002/1097-0061(20000915)16:12<1131::AID-YEA609>3.0.CO;2-F. [DOI] [PubMed] [Google Scholar]
- 49.The Gene Ontology Consortium. Gene ontology: tool for the unification of biology. Nat. Genet. 2000;25:25–29. doi: 10.1038/75556. [DOI] [PMC free article] [PubMed] [Google Scholar]
- 50.Kandel ER, Schwartz JH, Jessel TM. 4th edn. New York, NY: McGraw-Hill companies; 2000. Principles of neural science. [Google Scholar]
- 51.Takahama Y. Journey through the thymus: stromal guides for T-cell development and selection. Nat. Rev. Immunol. 2006;6:127–135. doi: 10.1038/nri1781. [DOI] [PubMed] [Google Scholar]
- 52.Rodgers RJ, Irving-Rodgers HF, Russell DL. Extracellular matrix of the developing ovarian follicle. Reproduction. 2003;126:415–424. doi: 10.1530/rep.0.1260415. [DOI] [PubMed] [Google Scholar]
- 53.Santala M, Simojoki M, Risteli J, Risteli L, Kauppila A. Type I and III collagen metabolites as predictors of clinical outcome in epithelial ovarian cancer. Clin. Cancer Res. 1999;5:4091–4096. [PubMed] [Google Scholar]
- 54.Sherman-Baust CA, Weeraratna AT, Rangel LB, Pizer ES, Cho KR, Schwartz DR, Shock T, Morin PJ. Remodeling of the extracellular matrix through overexpression of collagen VI contributes to cisplatin resistance in ovarian cancer cells. Cancer Cell. 2003;3:377–386. doi: 10.1016/s1535-6108(03)00058-8. [DOI] [PubMed] [Google Scholar]
- 55.De Cecco L, Marchionni L, Gariboldi M, Reid JF, Lagonigro MS, Caramuta S, Ferrario C, Bussani E, Mezzanzanica D, Turatti F, et al. Gene expression profiling of advanced ovarian cancer: characterization of a molecular signature involving fibroblast growth factor 2. Oncogene. 2004;23:8171–8183. doi: 10.1038/sj.onc.1207979. [DOI] [PubMed] [Google Scholar]
- 56.Haouem S, Najjar MF, El Hani A, Sakly R. Accumulation of cadmium and its effects on testis function in rats given diet containing cadmium-polluted radish bulb. Exp. Toxicol. Pathol. 2008;59:307–311. doi: 10.1016/j.etp.2007.10.002. [DOI] [PubMed] [Google Scholar]
- 57.Li T, Huang J, Jiang Y, Zeng Y, He F, Zhang MQ, Han Z, Zhang X. Multi-stage analysis of gene expression and transcription regulation in C57/B6 mouse liver development. Genomics. 2009;93:235–242. doi: 10.1016/j.ygeno.2008.10.006. [DOI] [PMC free article] [PubMed] [Google Scholar]
- 58.Hailesellasse Sene K, Porter CJ, Palidwor G, Perez-Iratxeta C, Muro EM, Campbell PA, Rudnicki MA, Andrade-Navarro MA. Gene function in early mouse embryonic stem cell differentiation. BMC Genomics. 2007;8:85. doi: 10.1186/1471-2164-8-85. [DOI] [PMC free article] [PubMed] [Google Scholar]
- 59.Glisovic T, Bachorik JL, Yong J, Dreyfuss G. RNA-binding proteins and post-transcriptional gene regulation. FEBS Lett. 2008;582:1977–1986. doi: 10.1016/j.febslet.2008.03.004. [DOI] [PMC free article] [PubMed] [Google Scholar]
- 60.Mittal N, Roy N, Babu MM, Janga SC. Dissecting the expression dynamics of RNA-binding proteins in posttranscriptional regulatory networks. Proc. Natl Acad. Sci. USA. 2009;106:20300–20305. doi: 10.1073/pnas.0906940106. [DOI] [PMC free article] [PubMed] [Google Scholar]
- 61.Mercer TR, Dinger ME, Mattick JS. Long non-coding RNAs: insights into functions. Nat. Rev. Genet. 2009;10:155–159. doi: 10.1038/nrg2521. [DOI] [PubMed] [Google Scholar]
- 62.Mattick JS. The genetic signatures of noncoding RNAs. PLoS Genet. 2009;5:e1000459. doi: 10.1371/journal.pgen.1000459. [DOI] [PMC free article] [PubMed] [Google Scholar]
- 63.Amaral PP, Mattick JS. Noncoding RNA in development. Mamm. Genome. 2008;19:454–492. doi: 10.1007/s00335-008-9136-7. [DOI] [PubMed] [Google Scholar]
- 64.Dinger ME, Amaral PP, Mercer TR, Pang KC, Bruce SJ, Gardiner BB, Askarian-Amiri ME, Ru K, Soldà G, Simons C, et al. Long noncoding RNAs in mouse embryonic stem cell pluripotency an differentiation. Genome Res. 2008;18:1433–1445. doi: 10.1101/gr.078378.108. [DOI] [PMC free article] [PubMed] [Google Scholar]
- 65.Agris PF. Decoding the genome: a modified view. Nucleic Acids Res. 2004;32:223–238. doi: 10.1093/nar/gkh185. [DOI] [PMC free article] [PubMed] [Google Scholar]
- 66.Agris PF, Vendeix FA, Graham WD. tRNA's; wobble decoding of the genome: 40 years of modification. J. Mol. Biol. 2007;366:1–13. doi: 10.1016/j.jmb.2006.11.046. [DOI] [PubMed] [Google Scholar]
- 67.Dong H, Nilsson L, Kurland CG. Co-variation of tRNA abundance and codon usage in Escherichia coli at different growth rates. J. Mol. Biol. 1996;260:649–663. doi: 10.1006/jmbi.1996.0428. [DOI] [PubMed] [Google Scholar]
- 68.Percudani R, Pavesi A, Ottonello S. Transfer RNA gene redundancy and translational selection in Saccharomyces cerevisiae. J. Mol. Biol. 1997;268:322–330. doi: 10.1006/jmbi.1997.0942. [DOI] [PubMed] [Google Scholar]
- 69.Kanaya S, Yamada Y, Kudo Y, Ikemura T. Studies of codon usage and tRNA genes of 18 unicellular organisms and quantification of Bacillus subtilis tRNAs: gene expression level and species-specific diversity of codon usage based on multivariate analysis. Gene. 1999;238:143–155. doi: 10.1016/s0378-1119(99)00225-5. [DOI] [PubMed] [Google Scholar]
Associated Data
This section collects any data citations, data availability statements, or supplementary materials included in this article.